Improved Accuracy for Automated Counting of a Fish in Baited Underwater Videos for Stock Assessment
 Rod M. Connolly1*
  David V. Fairclough2
  Eric L. Jinks1
  Ellen M. Ditria1
  Gary Jackson2
  Sebastian Lopez-Marcano1,3
  Andrew D. Olds4
  Kristin I. Jinks1
- 1Coastal and Marine Research Centre, School of Environment and Science, Australian Rivers Institute, Griffith University, Gold Coast, QLD, Australia
- 2Aquatic Sciences and Assessment, Department of Primary Industries and Regional Development, Hillarys, WA, Australia
- 3Quantitative Imaging Research Team, CSIRO, Marsfield, NSW, Australia
- 4School of Science and Engineering, University of the Sunshine Coast, Maroochydore, QLD, Australia
The ongoing need to sustainably manage fishery resources can benefit from fishery-independent monitoring of fish stocks. Camera systems, particularly baited remote underwater video system (BRUVS), are a widely used and repeatable method for monitoring relative abundance, required for building stock assessment models. The potential for BRUVS-based monitoring is restricted, however, by the substantial costs of manual data extraction from videos. Computer vision, in particular deep learning (DL) models, are increasingly being used to automatically detect and count fish at low abundances in videos. One of the advantages of BRUVS is that bait attractants help to reliably detect species in relatively short deployments (e.g., 1 h). The high abundances of fish attracted to BRUVS, however, make computer vision more difficult, because fish often obscure other fish. We build upon existing DL methods for identifying and counting a target fisheries species across a wide range of fish abundances. Using BRUVS imagery targeting a recovering fishery species, Australasian snapper (Chrysophrys auratus), we tested combinations of three further mathematical steps likely to generate accurate, efficient automation: (1) varying confidence thresholds (CTs), (2) on/off use of sequential non-maximum suppression (Seq-NMS), and (3) statistical correction equations. Output from the DL model was more accurate at low abundances of snapper than at higher abundances (>15 fish per frame) where the model over-predicted counts by as much as 50%. The procedure providing the most accurate counts across all fish abundances, with counts either correct or within 1–2 of manual counts (R2 = 88%), used Seq-NMS, a 45% CT, and a cubic polynomial corrective equation. The optimised modelling provides an automated procedure offering an effective and efficient method for accurately identifying and counting snapper in the BRUV footage on which it was tested. Additional evaluation will be required to test and refine the procedure so that automated counts of snapper are accurate in the survey region over time, and to determine the applicability to other regions within the distributional range of this species. For monitoring stocks of fishery species more generally, the specific equations will differ but the procedure demonstrated here could help to increase the usefulness of BRUVS.
Introduction
The ongoing need to maximise fishery harvests while maintaining stocks at sustainable levels demands efficient in-water monitoring of fish abundances. The advent of robust yet inexpensive underwater cameras provides a potential step-change in increased efficiency of monitoring stocks. Unfortunately, the requirement for manual processing of underwater videos to count target species severely curtails the scalability of camera systems (Sheaves et al., 2020). Automated image analysis can overcome this bottleneck, but technical limitations have restricted its use for routine fisheries monitoring to date (Tseng and Kuo, 2020; Yang et al., 2020; Lopez-Marcano et al., 2021).
The most common measure of fish abundance derived from underwater videos is the maximum count of a target species in any one frame (MaxN). A single MaxN per video is the most commonly reported metric (Whitmarsh et al., 2017), but multiple MaxN measures over short time intervals of video, and averages of these, are recommended as being more reliable statistically (Schobernd et al., 2014). By removing the costly step of manual counting, automation can encourage extraction of more values for video and thus greater statistical rigour. Automated analysis needs to extract these values accurately and efficiently to be useful.
Baited remote underwater video system (BRUVS) are the most widely used application of videos for monitoring fish abundances (Whitmarsh et al., 2017), and automated analysis therefore needs to be accurate specifically for this method. Along with issues common to all underwater image analysis, such as variable water clarity and complex, dynamic backgrounds (Siddiqui et al., 2018; Yang et al., 2020), the BRUVS technique raises another challenge by generating potentially large ranges of fish abundances, from none to many individual fish. Automated analysis needs to report accurately across this wide range of abundances, overcoming significant occlusion issues (where an individual fish can obscure parts of another fish) at higher fish densities.
Efficient, automated identification and counting of fish in underwater images has become possible with the development of computer vision, in particular deep learning (DL), a branch of machine learning that automatically extracts features from raw imagery (LeCun et al., 2015). DL has been used for classification of individual fish images into species classes (Salman et al., 2016; Siddiqui et al., 2018; dos Santos and Gonçalves, 2019), and for object detection and classification on underwater video streams (Mandal et al., 2018; Villon et al., 2018). In unbaited remote underwater video stations, video analysis has been successful on individual target species (Ditria et al., 2020a) and multiple species selected from fish assemblages (Villon et al., 2018, 2020; Knausgård et al., 2020). Here, we build upon existing DL methods for fish identification and counting to improve accuracy for BRUVS over a wide range of fish abundances. The objective is to demonstrate post-processing steps capable of automating the current manual analysis of BRUVS videos for monitoring abundances of a fisheries species. The example species, Chrysophrys auratus (Australasian snapper, family Sparidae), is a popular recreational and commercial species that has suffered stock declines and corresponding management responses across much of the species distribution in Australia (Fowler et al., 2018). In Western Australia, there is renewed focus on the development of fishery-independent methods for monitoring relative abundance over time as an input to stock assessment models.
Materials and Methods
To achieve our aim of building on output from existing DL models to improve counts of target species in BRUVS, we first trained a DL model on footage from BRUVS deployed to monitor abundances of Australasian snapper (snapper) off Shark Bay in the Gascoyne region of Western Australia. We then applied combinations of mathematical procedures to improve accuracy of automated counts.
Dataset and Deep Learning Model
The stock of snapper in oceanic waters off Shark Bay (∼26°S) in the Gascoyne region of Western Australia was recently assessed (2017) as being at high risk with a range of management actions subsequently introduced in 2018 to reduce exploitation and assist stock recovery (Jackson et al., 2020). Fishery-independent monitoring of snapper at breeding aggregation sites off Shark Bay is in its infancy, with underwater camera systems being tested for future surveys. BRUVS were deployed from a commercial vessel (FV Ada Clara) for 1 h during the day in July 2019 (between 0830 and 1630) at six sites along the northern and western coasts of Bernier Island, Shark Bay. Sites comprised mixed rock-sand habitats in 30–60 m water depth, where commercial fishers normally target snapper. Each replicate deployment was baited with 1 kg of pilchards (Sardinops neopilchardus). The camera frame and system design followed that of Langlois et al. (2020) and used Canon HF M52 cameras with 1920 × 1080 HD resolution.
We created a dataset for training and validation from videos at three sites (Sites 1, 3, and 5), and an independent dataset for testing from videos at the other three sites (Sites 2, 4, and 6). Sites 1 and 2 had the highest densities of snapper, Sites 3 and 4 had moderate densities, and Sites 5 and 6 had very low densities. Individual snapper were identified manually by one of the authors (KJ), who is an experienced fish biologist, and manually annotated with bounding boxes (following Ditria et al., 2020b). The annotator could play videos back and forth to obtain different views of individual fish to increase confidence in snapper detections. Of the annotated snapper, 4690 annotations were used for training (80%) and validation (20%), and 3627 annotations were used for testing. Importantly, this included fish at all angles to the camera, and parts of fish (e.g., head only) where the remainder of the individual was unobservable, either obscured by other fish or outside the field of view. In a preliminary model using only snapper annotations, we noted that two other species superficially resembling snapper (brown-stripe snapper, Lutjanus vitta, and stripey snapper, Lutjanus carponotatus) sometimes caused misidentification (i.e., false positive labelling as C. auratus), and we therefore also annotated and trained these species (81 and 190 annotations, respectively) to include in the final raw model. Including a small number of annotations of these additional species resulted in a reduction of false positives for the target snapper species (see Supplementary Table 1 for comparison of the model with and without inclusion of other annotated species).
The test dataset from the three independent sites was used in three ways. We selected multiple segments from throughout the videos from these three sites to provide a range of ground-truth snapper densities (0–30), and compared predictions from the raw model and the optimised model (see below) against ground-truth counts. We also compared MaxN counts from the optimised model against ground-truth counts for the first 5 min of videos from each site. In these 5-min test video segments, the number of snapper (N) was recorded manually every 30 s (i.e., 10 records over 5 min). These manually extracted N values provided ground-truth results against which computer predictions were tested. Detailed analysis of the first sections of videos provides an appropriately wide range of fish densities, since BRUVS typically have no fish present as the camera drop begins, with high densities by the 5 min mark as the bait attractant takes effect (Whitmarsh et al., 2017). Finally, we compared the predicted MaxN for the entire 1 h of each video against the ground-truth MaxN.
We used a convolutional neural network framework for object detection, specifically an implementation of Faster R-CNN developed by Massa and Girshick (2018). Model development was conducted using a ResNet50 configuration, pre-trained on the ImageNet-1k dataset. This method successfully detects and counts target species at low densities in unbaited RUVs (Ditria et al., 2020a). Model training, prediction, and testing tasks were conducted on a Microsoft Azure Data Science Virtual Machine powered by an NVIDIA V100 GPU. Overfitting was minimised using the early-stopping technique (Prechelt, 1998).
Mathematical Procedures
In seeking to improve the accuracy of DL model output, we applied mathematical procedures to raw computer predictions. We tested numerous combinations of three key mathematical components considered likely to generate accurate, efficient automation: (1) varying confidence thresholds (CTs), (2) on/off use of sequential non-maximum suppression (Seq-NMS), and (3) statistical correction equations. Seq-NMS was tried both before and after varying CTs. Statistical correction equations were always applied last. We also tried variations of other aspects, such as image resolution, but these did not provide measurable improvement and are not reported on further. Selection of CTs, the values above which objects are classified into a class (here, snapper), are an important determinant in balancing false positive and false negatives (and, therefore, in maximising true positives). We tried CTs from 0 to 95% in 5% increments. Seq-NMS is a spatio-temporal filter that creates detection chains by analysing neighbouring frames (Han et al., 2016). It is regarded as a useful procedure where DL models are over-predicting, which in initial trials on snapper BRUVS we identified as an issue at high fish densities. As a final mathematical component, we applied corrective equations to output from combinations of CT and Seq-NMS. Given the patterns of errors in predictions we most commonly observed, we tried linear, quadratic and cubic polynomial equations with randomly varying constants. In total, 120 combinations of the three components were tested (combinations of 20 CTs, Seq-NMS on/off, 3 forms of equations). In all cases, the measure of accuracy was the fit of computer predictions of N against ground-truth values, across the entire range of fish densities (quantified by R2 value).
Results
Raw automated predictions were generally inaccurate, often considerably above ground-truth values, particularly at mid to high snapper abundances (15–25 fish per frame; Figure 1). The over-prediction was almost solely due to high numbers of false positive detections of snapper, predominantly as double and triple detection of the same individual fish; for example, the head and tail of one fish were counted as two fish (see example in Supplementary Figure 1).
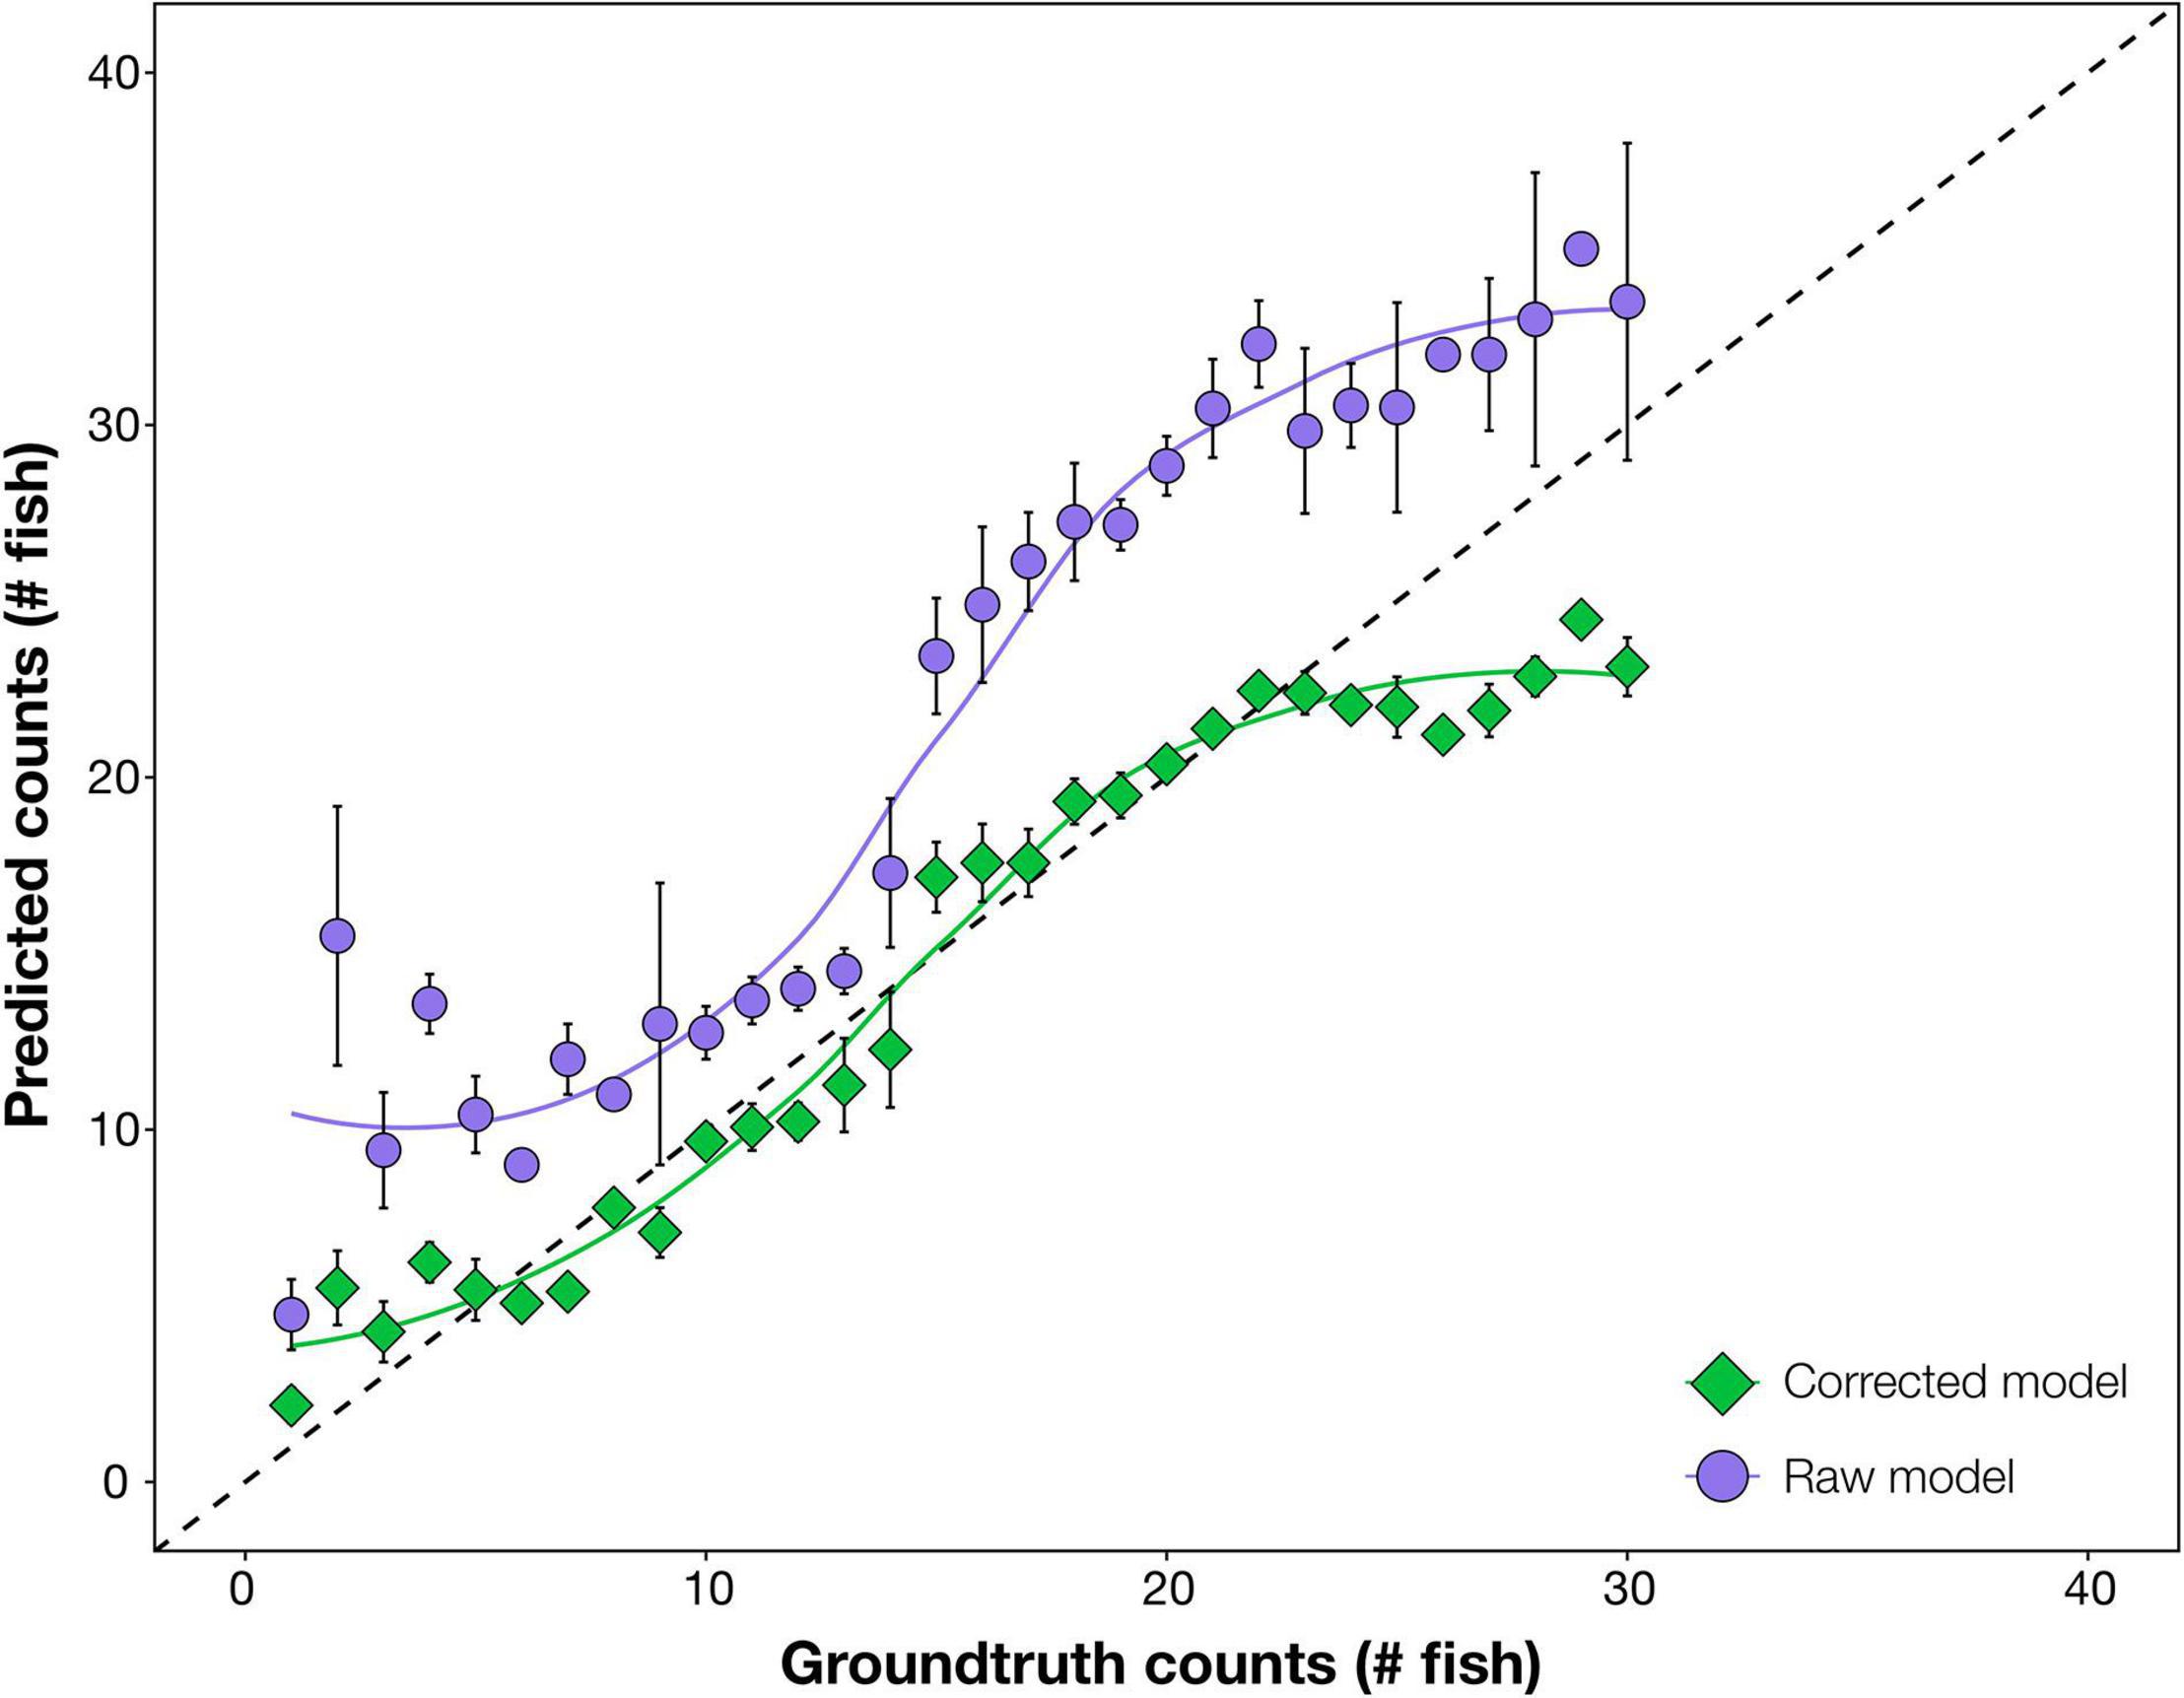
Figure 1. Comparison of accuracy of automated counts of the target species, Australasian snapper, from the raw deep learning output (raw model) and the enhanced modelling procedure (corrected model). In both cases, prediction counts are tested for accuracy against ground-truth (manual) counts, with more accurate results closer to the 1:1 dashed line. Raw model counts are unmodified from the deep learning model. Corrected model counts use automated mathematical enhancements – Seq-NMS, optimum confidence threshold, and corrective equation – on the deep learning output. Data are combined from the three test sites. Error bars = SE.
After optimising combinations of mathematical procedures, computer predictions became more accurate (Figure 1). Corrected predictions were on average the same as ground-truth values at all fish abundances, with only slight under-prediction at ground-truthed abundances above 25 fish. The optimal enhancements were, in order: (1) Seq-NMS on, (2) CT of 45%, and (3) a cubic polynomial corrective equation applied (N′ = A + B.N + C.N2 + D.N3 where A = 14.8, B = 112.8, C = 7.2, D = −12.1). This optimum was selected at the highest R2 from the 120 combinations (Supplementary Table 2). A comparison of automated counts from the final revised modelling procedure against manual ground-truth counts gave an R2 of 88%.
The effectiveness of the optimum model procedure is illustrated in predictions at each 30 s over the first 5 min of BRUVS drops, shown for the three test sites (Figure 2). The MaxN values and the average MaxN values from computer generated predictions were very similar to ground-truth values at each time interval, i.e., either exactly the same or within 1 or 2 of actual counts (Figure 2). MaxN values for the entire 1 h video predicted by the optimised model and ground-truth, respectively, were; Site 2: 25 vs. 30, Site 4: 8 vs. 7, Site 6: 1 vs. 1.
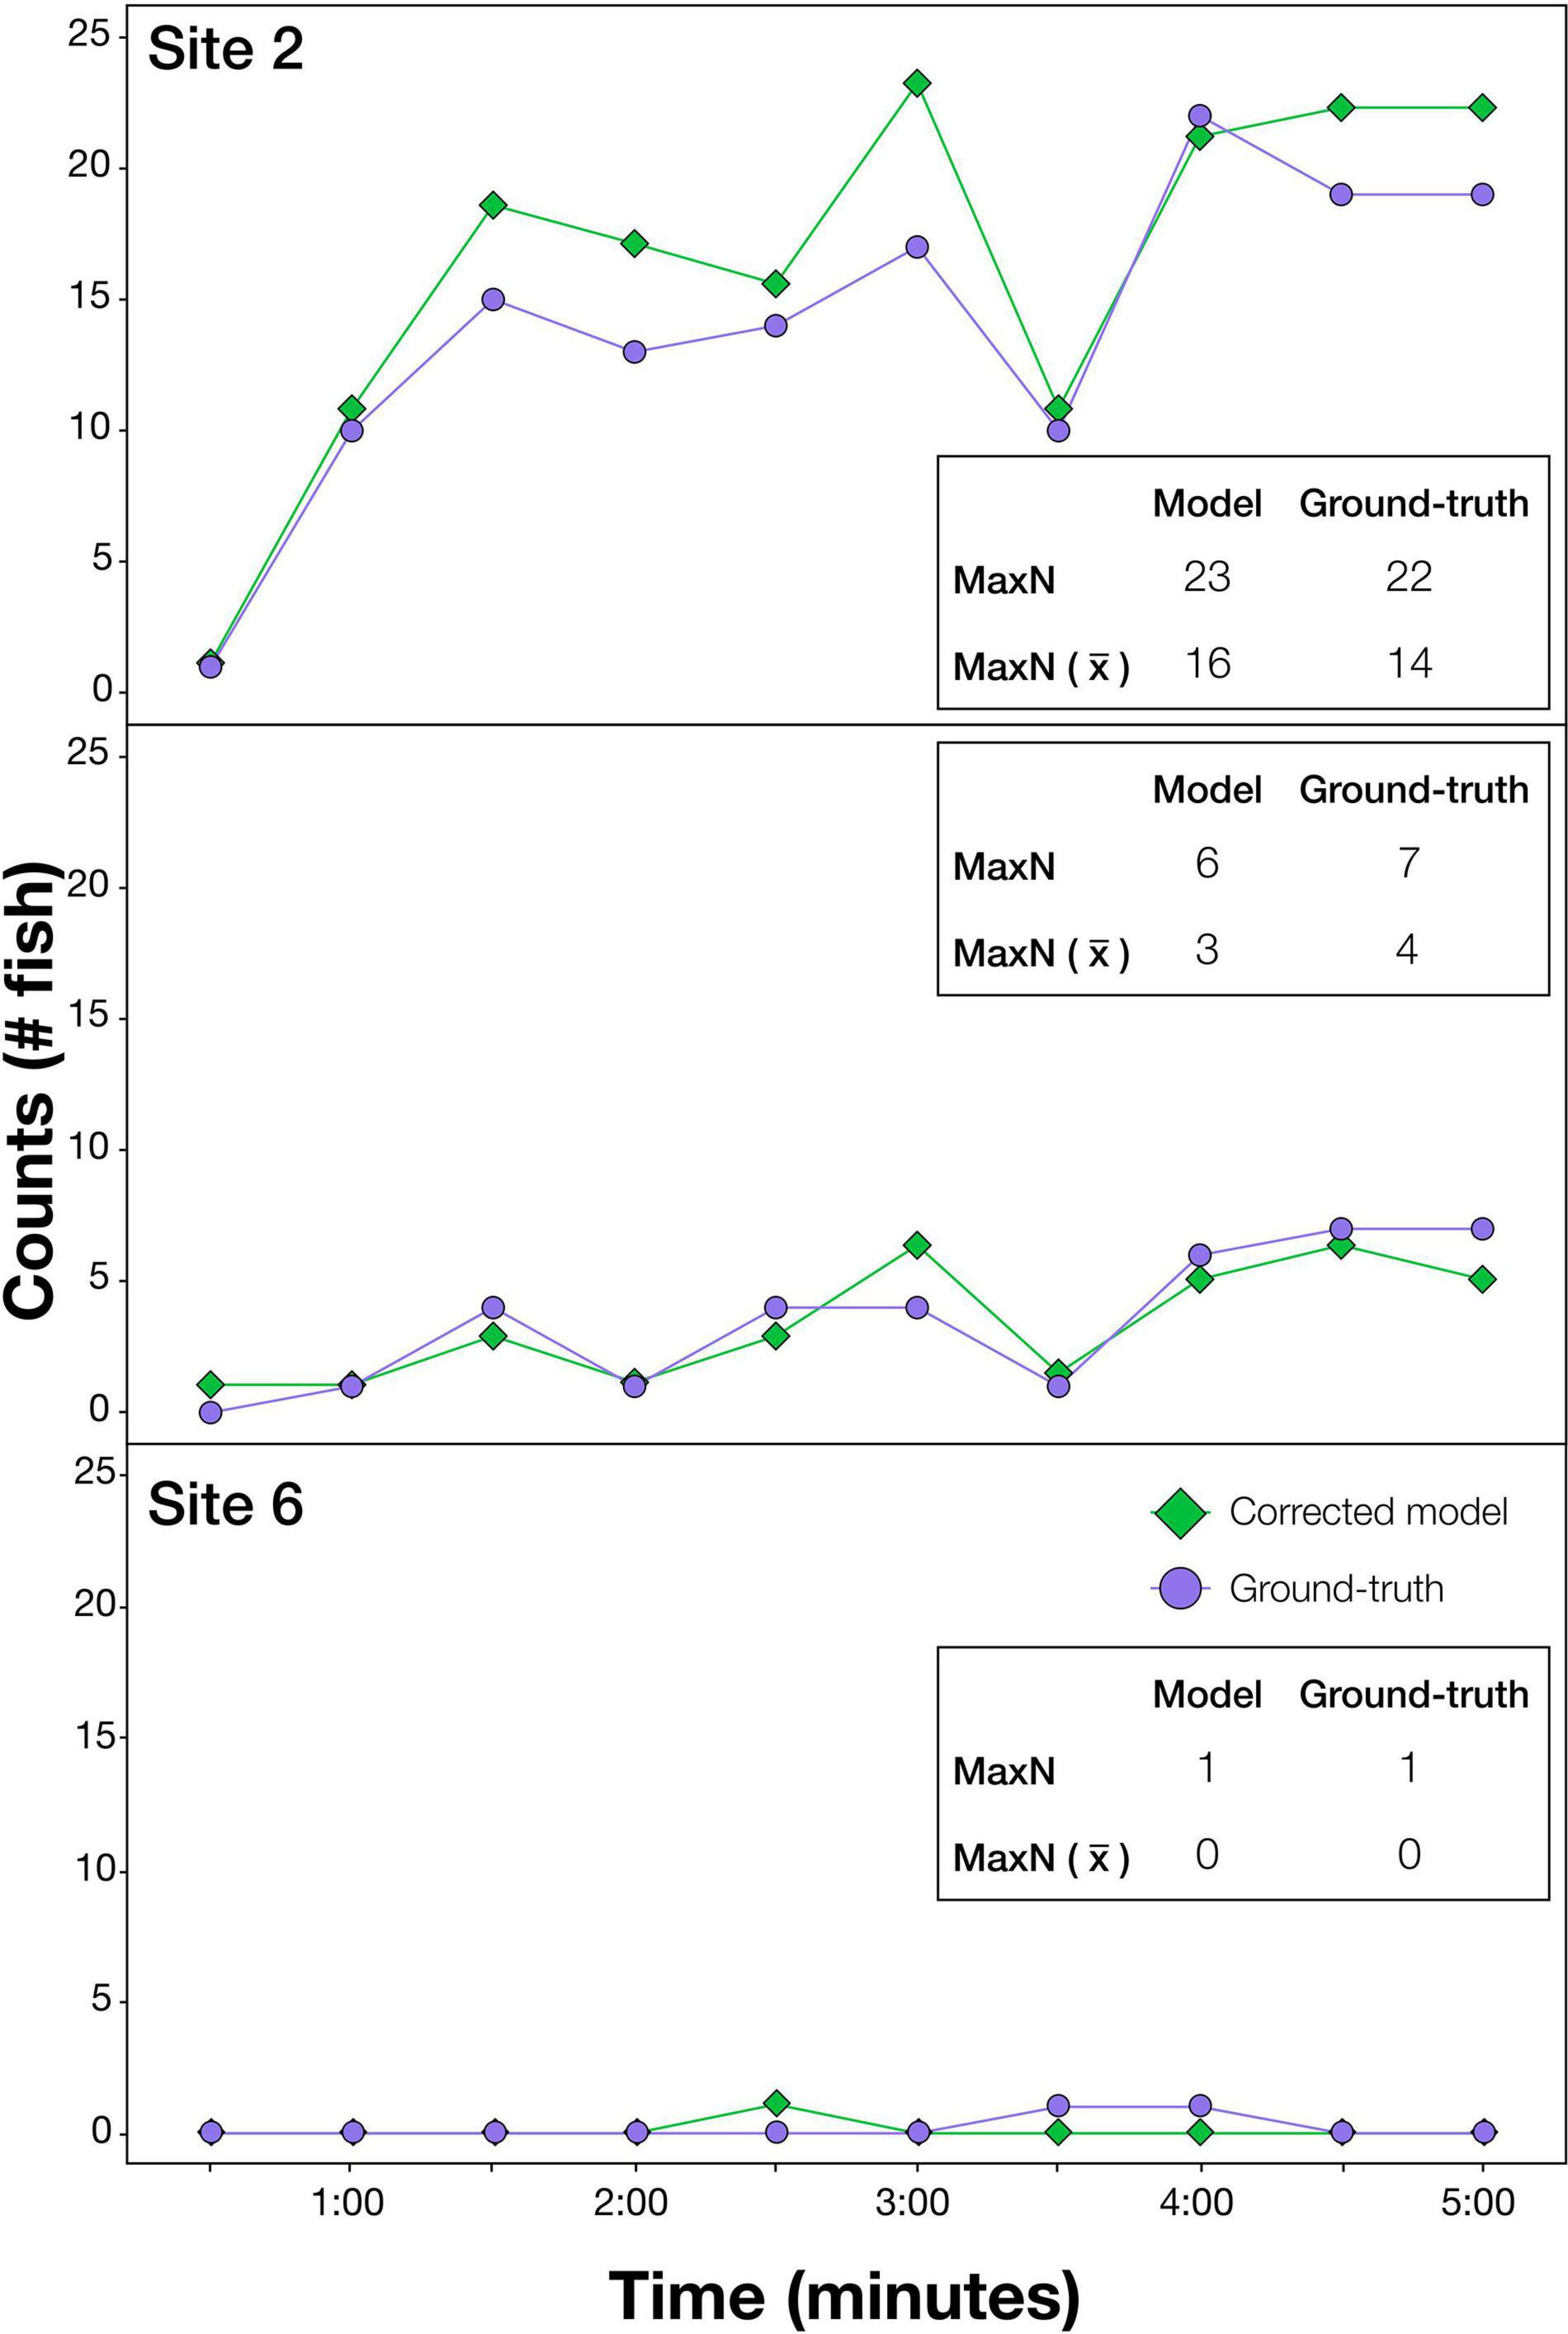
Figure 2. Results illustrating the effectiveness of the modelling procedure at automatically extracting counts of the target species, Australasian snapper, from videos. Sites shown are a selection demonstrating accuracy at high (Site 2), medium (Site 4), and very low (Site 6) snapper abundances. At each site, ground-truth and modelled (optimised model using deep learning and additional operations) counts are shown every 30 s for the first 5 min of video. This imagery was independent of that used in training. MaxN is the greatest fish count over the 5 min period, and MaxN () is the average MaxN over the 5 min period.
Discussion
The refined procedure of DL with additional automated mathematical operations produced an effective method for identifying and counting target fish from BRUVS. The processing procedure provides rapid, automated extraction of snapper counts from zero to high abundances. The final optimised procedure utilised a combination of Seq-NMS, a specific CT, and a cubic polynomial corrective equation (Figure 3). Our intention with the current dataset was to demonstrate the series of post-processing steps. Considerable additional testing is required for the automated processing procedure to be useful for snapper monitoring more broadly. After this additional work, the procedure can potentially encourage expansion of monitoring sites and times while avoiding increased costs of manual processing. It will also encourage reporting of MaxN values at much more frequent intervals within BRUVS videos, an important aspect of increasing the rigour of fisheries monitoring (Schobernd et al., 2014).
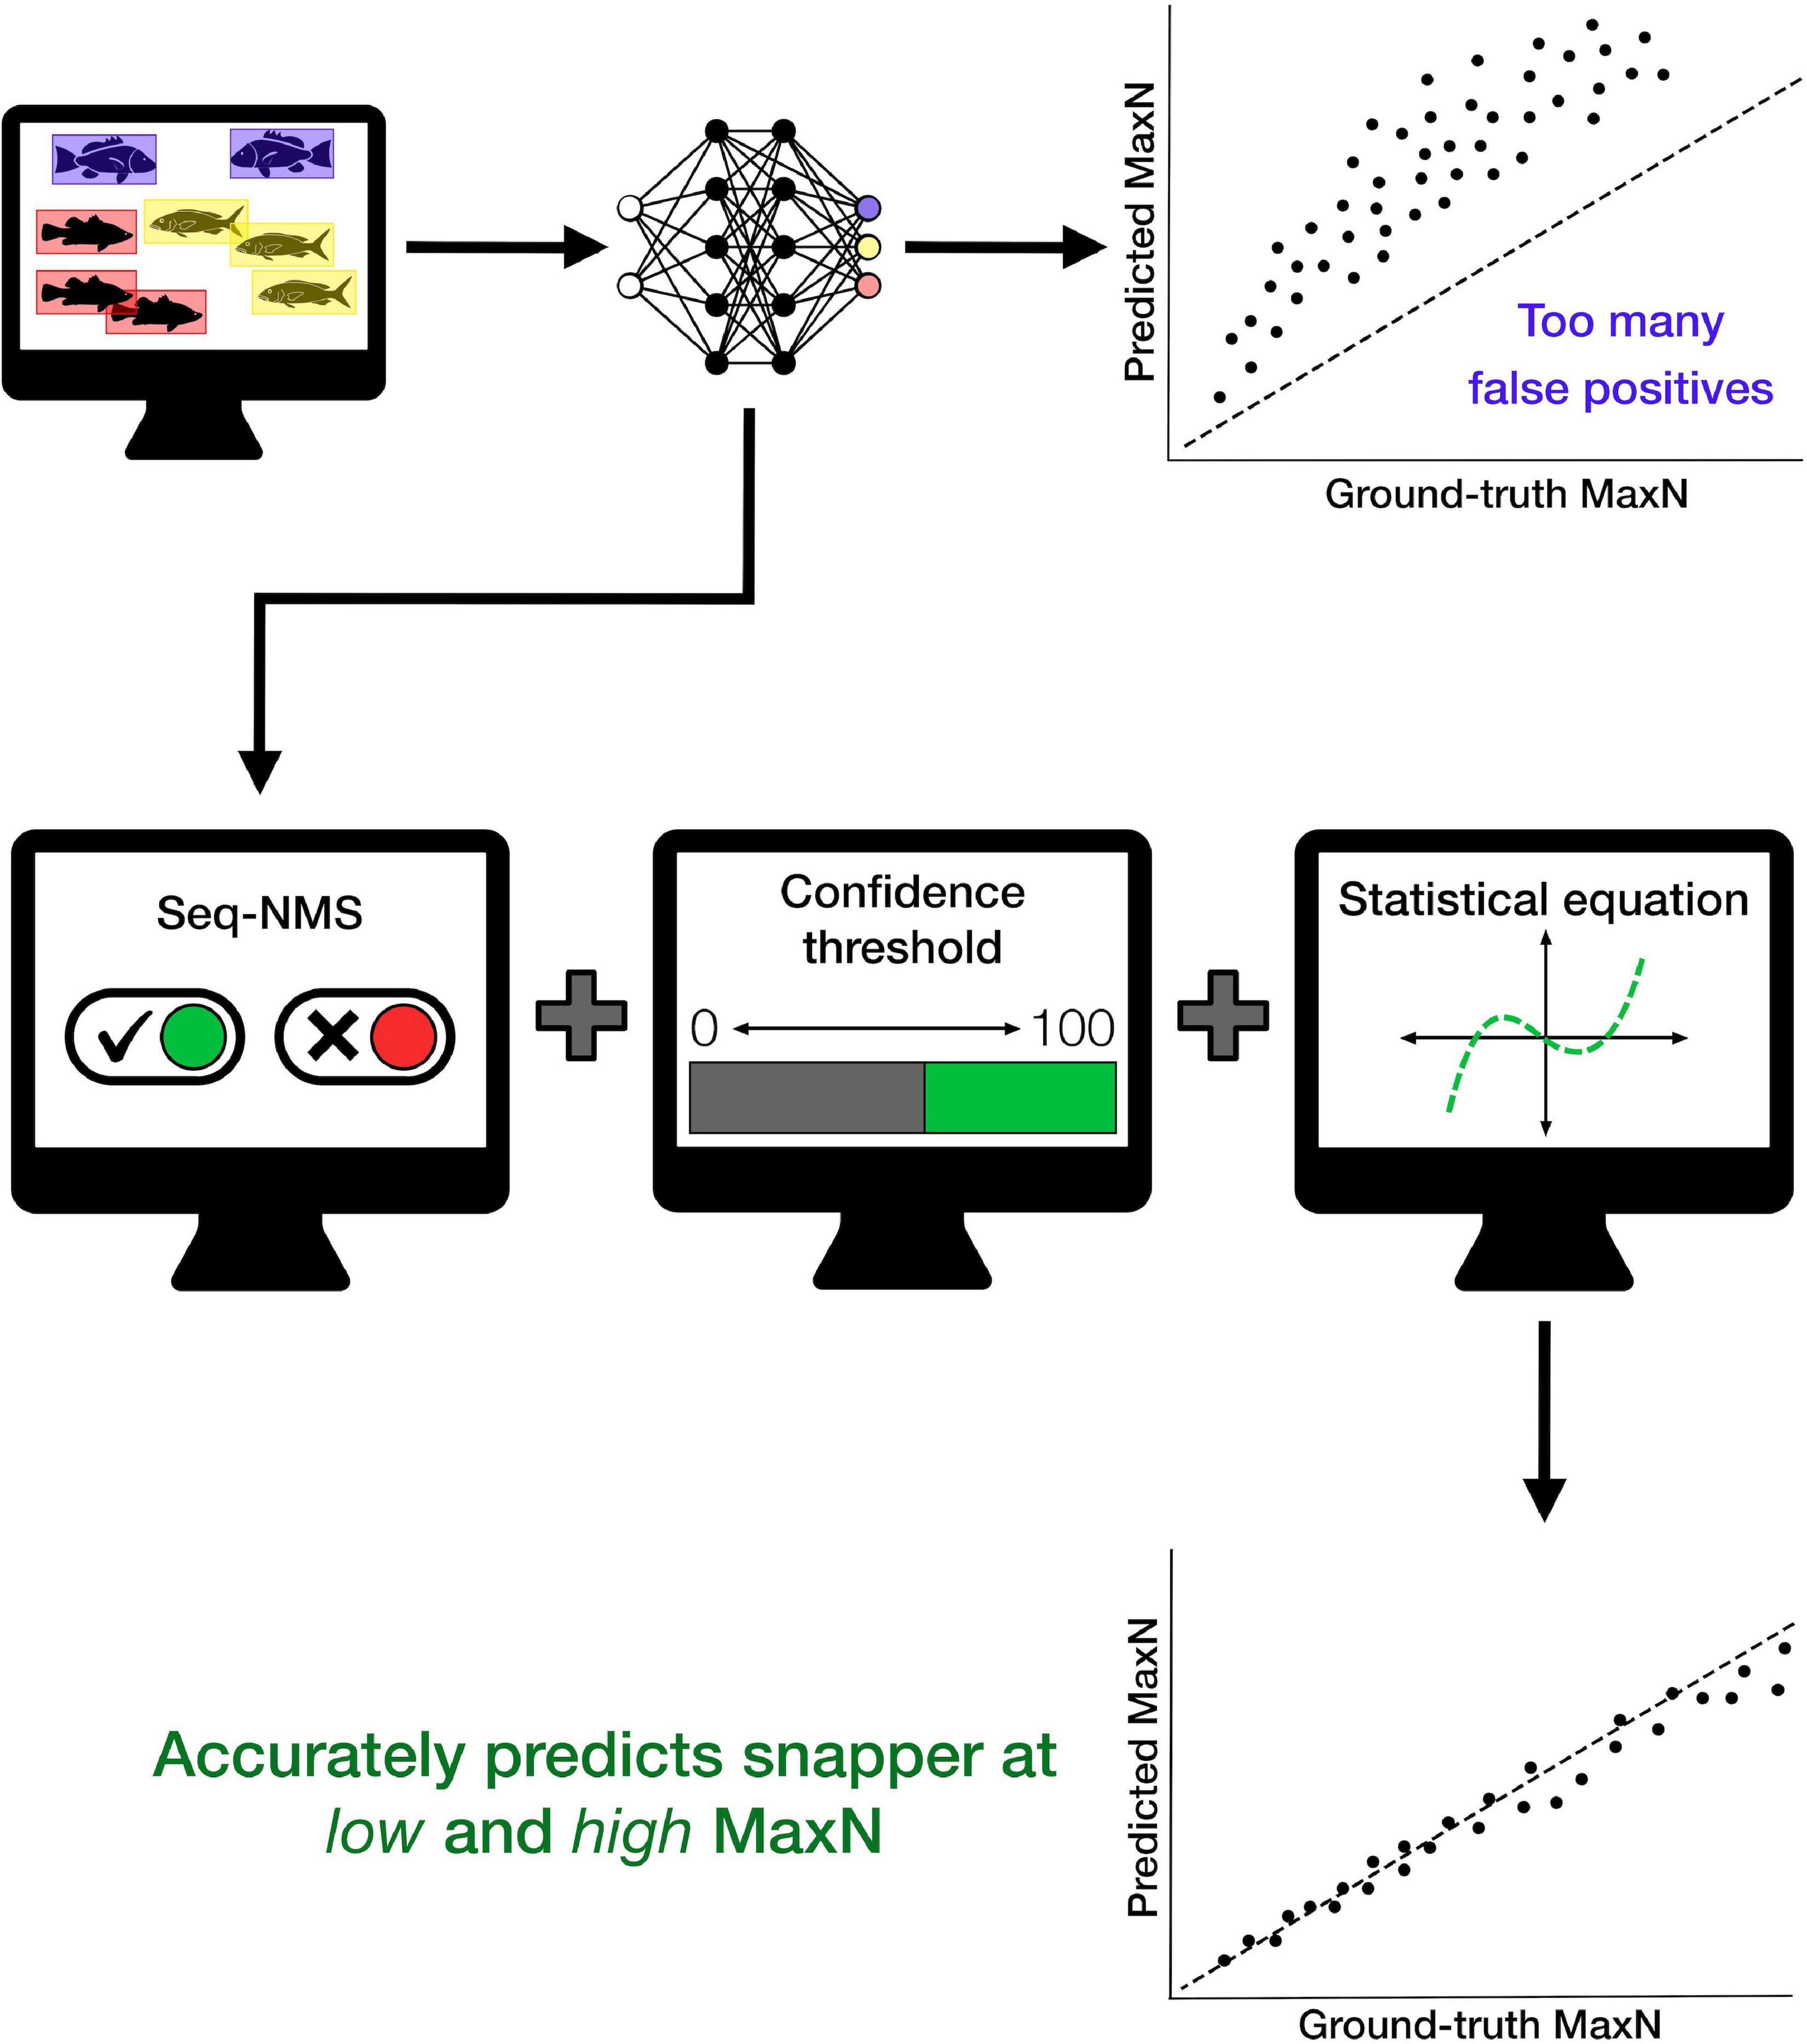
Figure 3. Conceptual diagram summarising steps used to create the deep learning model and apply additional mathematical operations to improve accuracy of automated counts of the target species, Australasian snapper, particularly at higher fish densities. This general procedure will have different specific parameters for different places and species; for the particular case of Australasian snapper in this study, the optimal procedure used Seq-NMS, a confidence threshold of 45%, and a cubic polynomial corrective equation, producing the accurate automated counts shown in Figure 1.
The procedure demonstrated here can stimulate improvements in automation of BRUVS data extraction more generally, and be used for BRUVS automation for many different species and situations. For species other than snapper, selected CTs and the form of corrective equation can be expected to vary. Even within a single dataset, the optimum CT is known to differ among species and with different amounts of training data (Villon et al., 2020). The specific models and post-processing steps will need to be validated on relevant datasets. As with any automation method, there is considerable up front effort required to ensure that models produce accurate output, but once achieved, the method can efficiently analyse endless videos and should provide very cost-effective extraction of fish counts for stock assessment programs.
Although the demonstrated procedure has been successful, there are some caveats and we have recommendations for further trials and testing. Two common challenges in computer vision, domain shift and concept drift, will need to be addressed when applying our model more generally. Our model performance depends on the environment, or domain, in which it was trained (Ditria et al., 2020b). At this stage, the optimal procedure is addressed only for snapper at the multiple sites within the survey area in the Gascoyne region of Western Australia. The usefulness of the model will ultimately need demonstrating in different regions across the distributional range of snapper. The model will need checking in other places where aspects such as habitat backgrounds and species assemblages will vary – a concept known as domain shift (Kalogeiton et al., 2016). It will also require testing in situations where the size composition of snapper differs from that in this study. For example, BRUVS are used in monitoring the abundance of snapper recruits on the lower west coast of Australia (Wakefield et al., 2013). We expect that use of the model in other places will require different CTs or corrective equations, although, it is also possible that a more generic model might be developed that is effective across the snapper distributional range. Our model is also linked to a specific time, and so further work is required to guard against inaccuracies due to concept drift (Hashmani et al., 2019). Changes in the environment or camera equipment over time can reduce the accuracy of computer vision models (e.g., Langenkämper et al., 2020). The current study produced a very accurate procedure for videos from the initial survey of the Gascoyne region. It will need testing over time as videos become available from future monitoring surveys, to address aspects of the environment likely to change, such as known tropicalisation of reefal habitats in Western Australia (Arias-Ortiz et al., 2018).
The post-processing steps evaluated here are necessary to adjust raw predictions from DL models, but we also encourage refinements to improve the accuracy of those model predictions prior to post-processing steps. Analysis of underwater imagery can continue to improve with the development of new computer vision techniques. For example, algorithms to enhance the clarity of underwater imagery are becoming available to improve the accuracy of species identification in the context of variable and changing backgrounds (Donaldson et al., 2020). More generally, new methods are being developed to increase the quality and quantity of annotations for training models (Perez and Wang, 2017; Ditria et al., 2020c). Automated extraction of more detailed data from videos might also provide opportunities to estimate fish abundance more precisely than the commonly used MaxN metric. Detection of individual markings or sizes of fish, for example, could allow for distinctions among individuals and ultimately for more informative estimates of abundance (Gifford and Mayhood, 2014).
There is clear potential for DL automation to revolutionise observation-based monitoring of animal abundances (Christin et al., 2019). The applications of computer vision to fisheries science are at the early stages of being realised (Lopez-Marcano et al., 2021). BRUVS are already used for safe and repeatable monitoring of fish abundances in a range of situations (Harvey et al., 2021), and we hope that the procedures demonstrated here can increase the usefulness of BRUVS, while decreasing costs of long-term monitoring programs, and ultimately improving fishery-independent stock assessments.
Data Availability Statement
The raw data supporting the conclusions of this article will be made available by the authors, without undue reservation.
Ethics Statement
Ethical review and approval was not required for the animal study because videos analysed in this article were collected by Western Australian Department of Primary Industries and Regional Development (authors DF and GJ). In Western Australia, the Animal Welfare Act 2002 does not require the Department of Primary Industries and Regional Development (DPIRD) to obtain a permit to use animals (fish) for scientific purposes unless the species are outside the provisions of the governing legislation (i.e., Fish Resources Management Act 1994 and Fish Resources Management Regulations 1995). Nonetheless, all sampling was undertaken in strict adherence to the DPIRD policy for the handling, use, and care of marine fauna for research purposes. No marine fauna were collected, injured, or required to be euthanased for the purposes of this study.
Author Contributions
All authors conceptualized and interpreted results. DF, GJ, KJ, and EJ contributed to database curation. All authors performed the methodology and wrote the manuscript led by RC. EJ and KJ created the model. RC, DF, GJ, and SL-M contributed to funding and resources.
Funding
This work was supported by the Western Australian Department of Primary Industries and Regional Development. RC, DF, AO, and EJ benefit through support from the Australian Research Data Commons for the digital platform. RC was supported by a Discovery Project from the Australian Research Council (DP180103124), and by the Global Wetlands Project, funded by a charitable organisation which neither seeks nor permits publicity for its efforts. SL-M, ED, and RC received funding through Microsoft’s AI for Earth grant scheme.
Conflict of Interest
The authors declare that the research was conducted in the absence of any commercial or financial relationships that could be construed as a potential conflict of interest.
Publisher’s Note
All claims expressed in this article are solely those of the authors and do not necessarily represent those of their affiliated organizations, or those of the publisher, the editors and the reviewers. Any product that may be evaluated in this article, or claim that may be made by its manufacturer, is not guaranteed or endorsed by the publisher.
Acknowledgments
The authors thank technical staff (particularly Nick Jarvis) of the Department of Primary Industries and Regional Development for conducting video sampling and skippers and owner of the FV Ada Clara. The study benefited from collaborations with all researchers in the Global Wetlands Project.
Supplementary Material
The Supplementary Material for this article can be found online at: https://www.frontiersin.org/articles/10.3389/fmars.2021.658135/full#supplementary-material
References
Arias-Ortiz, A., Serrano, O., Masque, P., Lavery, P. S., Mueller, U., Kendrick, G. A., et al. (2018). A marine heatwave drives massive losses from the world’s largest seagrass carbon stocks. Nat. Clim. Change 8, 338–344. doi: 10.1038/s41558-018-0096-y
Christin, S., and Hervet, É, and Lecomte, N. (2019). Applications for deep learning in ecology. Methods Ecol. Evol. 10, 1632–1644.
Ditria, E. M., Lopez-Marcano, S., Sievers, M., Jinks, E. L., Brown, C. J., and Connolly, R. M. (2020a). Automating the analysis of fish abundance using object detection: optimizing animal ecology with deep learning. Front. Mar. Sci. 7:429. doi: 10.3389/fmars.2020.00429
Ditria, E. M., Sievers, M., Connolly, R. M., Jinks, E. L., and Lopez-Marcano, S. (2020b). Deep learning for automated analysis of fish abundance: the benefits of training across multiple habitats. Environ. Monit. Assess. 192:698.
Ditria, L., Meyer, B. J., and Drummond, T. (2020c). OpenGAN: open set generative adversarial networks. arXiv [Preprint] arXiv:200308074,Google Scholar
Donaldson, J. A., Drews, P., Bradley, M., Morgan, D. L., Baker, R., and Ebner, B. C. (2020). Countering low visibility in video survey of an estuarine fish assemblage. Pacific Cons. Biol. 26, 190–200.
dos Santos, A. A., and Gonçalves, W. N. (2019). Improving Pantanal fish species recognition through taxonomic ranks in convolutional neural networks. Ecol. Inform. 53:100977. doi: 10.1016/j.ecoinf.2019.100977
Fowler, A., Jackson, G., Stewart, J., Hamer, P., and Roelofs, A. (2018). Snapper, Chrysophrys auratus, in Status of Key Australian Fish Stocks Reports 2018. Canberra, ACT: Fisheries Research and Development Corporation (FRDC).
Gifford, C. M., and Mayhood, D. W. (2014). “Natural marks for identifying individual fish in small populations of at-risk westslope cutthroat trout,” in Wild Trout IX: Sustaining Wild Trout in a Change World, eds R. F. Carline and C. LoSapio (Bozeman, MT: Wild Trout Symposium), 275–280.
Han, W., Khorrami, P., Paine, T. L., Ramachandran, P., Babaeizadeh, M., Shi, H., et al. (2016). “Seq-NMS for video object detection,” in Proceedings of the International Conference on Learning Representations(ICLR), Peurto Rico, SJN.
Harvey, E. S., Mclean, D. L., Goetze, J. S., Saunders, B. J., Langlois, T. J., Monk, J., et al. (2021). The BRUVS workshop - an Australian-wide synthesis of baited remote underwater video data to answer broad-scale ecological questions about fish, sharks and rays. Mar. Policy 127:104430. doi: 10.1016/j.marpol.2021.104430
Hashmani, M. A., Jameel, S. M., Al-Hussain, H., Rehman, M., and Budiman, A. (2019). Accuracy performance degradation in image classification models due to concept drift. Int. J. Adv. Comput. Sci. Appl 10, 422–425. doi: 10.14569/IJACSA.2019.0100552
Jackson, G., Denham, A., Hesp, A., Hall, N., Fisher, E., and Stephenson, P. (2020). Gascoyne Demersal Scalefish Resource. Perth, WA: Department of Primary Industries and Regional Development.
Kalogeiton, V., Ferrari, V., and Schmid, C. (2016). Analysing domain shift factors between videos and images for object detection. IEEE Trans. Pattern Anal. Mach. Intell. 38, 2327–2334. doi: 10.1109/tpami.2016.2551239
Knausgård, K. M., Wiklund, A., Sørdalen, T. K., Halvorsen, K., Kleiven, A. R., Jiao, L., et al. (2020). Temperate fish detection and classification: a deep learning based approach. arXiv[Preprint] arXiv:2005.07518.
Langenkämper, D., van Kevelaer, R., Purser, A., and Nattkemper, T. W. (2020). Gear-induced concept drift in marine images and its effect on deep learning classification. Front. Mar. Sci. 7:506. doi: 10.3389/fmars.2020.00506
Langlois, T., Goetze, J., Bond, T., Monk, J., Abesamis, R. A., Asher, J., et al. (2020). A field and video annotation guide for baited remote underwater stereo-video surveys of demersal fish assemblages. Methods Ecol. Evol. 11, 1401–1409.
Lopez-Marcano, S., Brown, C. J., Sievers, M., and Connolly, R. M. (2021). The slow rise of technology: computer vision techniques in fish population connectivity. Aquat. Conserv. Mar. Freshw. Ecosyst. 31, 210–217. doi: 10.1002/aqc.3432
Mandal, R., Connolly, R. M., Schlacher, T. A., and Stantic, B. (2018). “Assessing fish abundance from underwater video using deep neural networks,” in Proceedings of the 2018 International Joint Conference on Neural Networks (IJCNN), Rio de Janeiro, 1–6. doi: 10.1201/9781351119023-1
Massa, F., and Girshick, R. (2018). Maskrcnn-Benchmark: Fast, Modular Reference Implementation of Instance Segmentation and Object Detection Algorithms in PyTorch. Available online at: https://github.com/facebookresearch/maskrcnn-benchmark (accessed January 8, 2021).
Perez, L., and Wang, J. (2017). The effectiveness of data augmentation in image classification using deep learning. arXiv [Preprint] arXiv:171204621,Google Scholar
Prechelt, L. (1998). “Early stopping-but when?” in Neural Networks: Tricks of the Trade, eds G. Montavon, G. B. Orr, and K. R. Müller (Berlin: Springer), 55–69. doi: 10.1007/3-540-49430-8_3
Salman, A., Jalal, A., Shafait, F., Mian, A., Shortis, M., Seager, J., et al. (2016). Fish species classification in unconstrained underwater environments based on deep learning. Limnol. Oceanogr. Methods 14, 570–585. doi: 10.1002/lom3.10113
Schobernd, Z. H., Bacheler, N. M., and Conn, P. B. (2014). Examining the utility of alternative video monitoring metrics for indexing reef fish abundance. Can. J. Fish. Aquat. Sci. 71, 464–471. doi: 10.1139/cjfas-2013-0086
Sheaves, M., Bradley, M., Herrera, C., Mattone, C., Lennard, C., Sheaves, J., et al. (2020). Optimizing video sampling for juvenile fish surveys: using deep learning and evaluation of assumptions to produce critical fisheries parameters. Fish Fish. 21, 1259–1276. doi: 10.1111/faf.12501
Siddiqui, S. A., Salman, A., Malik, M. I., Shafait, F., Mian, A., Shortis, M. R., et al. (2018). Automatic fish species classification in underwater videos: exploiting pre-trained deep neural network models to compensate for limited labelled data. ICES J. Mar. Sci. 75, 374–389. doi: 10.1093/icesjms/fsx109
Tseng, C.-H., and Kuo, Y.-F. (2020). Detecting and counting harvested fish and identifying fish types in electronic monitoring system videos using deep convolutional neural networks. ICES J. Mar. Sci. 77, 1367–1378. doi: 10.1093/icesjms/fsaa076
Villon, S., Mouillot, D., Chaumont, M., Darling, E. S., Subsol, G., Claverie, T., et al. (2018). A deep learning method for accurate and fast identification of coral reef fishes in underwater images. Ecol. Inform. 48, 238–244. doi: 10.1016/j.ecoinf.2018.09.007
Villon, S., Mouillot, D., Chaumont, M., Subsol, G., Claverie, T., and Villéger, S. (2020). A new method to control error rates in automated species identification with deep learning algorithms. Sci. Rep. 10, 1–13.
Wakefield, C. B., Lewis, P. D., Coutts, T. B., Fairclough, D. V., and Langlois, T. J. (2013). Fish assemblages associated with natural and anthropogenically-modified habitats in a marine embayment: comparison of baited videos and opera-house traps. PLoS One 8:e59959. doi: 10.1371/journal.pone.0059959
Whitmarsh, S. K., Fairweather, P. G., and Huveneers, C. (2017). What is Big BRUVver up to? Methods and uses of baited underwater video. Rev. Fish Biol. Fish. 27, 53–73. doi: 10.1007/s11160-016-9450-1
Keywords: automated fish identification, automated marine monitoring, computer vision, deep learning, object detection, stock assessment, relative abundance
Citation: Connolly RM, Fairclough DV, Jinks EL, Ditria EM, Jackson G, Lopez-Marcano S, Olds AD and Jinks KI (2021) Improved Accuracy for Automated Counting of a Fish in Baited Underwater Videos for Stock Assessment. Front. Mar. Sci. 8:658135. doi: 10.3389/fmars.2021.658135
Received: 25 January 2021; Accepted: 24 September 2021;
Published: 12 October 2021.
Edited by:
Charlie Huveneers, Flinders University, AustraliaReviewed by:
Brendan Ebner, James Cook University, AustraliaDaniel Marrable, Curtin University, Australia
Copyright © 2021 Connolly, Fairclough, Jinks, Ditria, Jackson, Lopez-Marcano, Olds and Jinks. This is an open-access article distributed under the terms of the Creative Commons Attribution License (CC BY). The use, distribution or reproduction in other forums is permitted, provided the original author(s) and the copyright owner(s) are credited and that the original publication in this journal is cited, in accordance with accepted academic practice. No use, distribution or reproduction is permitted which does not comply with these terms.
*Correspondence: Rod M. Connolly, r.connolly@griffith.edu.au