Recent expansion and intensification of hypoxia in the Arabian Gulf and its drivers
 Zouhair Lachkar
 Michael Mehari
 Marina Lévy
 Francesco Paparella
 John A. Burt
- 1Arabian Center for Climate and Environmental Sciences, New York University Abu Dhabi, Abu Dhabi, United Arab Emirates
- 2Sorbonne Université (CNRS/IRD/MNHN), LOCEAN-IPSL, Paris, France
- 3Center for Stability, Instability, and Turbulence, New York University Abu Dhabi, Abu Dhabi, United Arab Emirates
- 4Water Research Center, New York University Abu Dhabi, Abu Dhabi, United Arab Emirates
The Arabian Gulf (also known as Persian Gulf, hereafter Gulf) is a shallow semi-enclosed subtropical sea known for its extreme physical environment. Recent observations suggest a decline in oxygen concentrations in the Gulf over the past few decades accompanied by an expansion of seasonal near-bottom hypoxia. Here, we reconstruct the evolution of dissolved oxygen in the Gulf from 1982 through 2010 and explore its controlling factors. To this end, we use an eddy-resolving hindcast simulation forced with winds and heat and freshwater fluxes from an atmospheric reanalysis. We show that seasonal near-bottom hypoxia (O2< 60 mmol m-3) emerges in the deeper part of the Gulf over summer and peaks in autumn in response to enhanced vertical stratification inhibiting mixing and O2 replenishment at depth. We also find a significant deoxygenation in the Gulf over the study period, with the Gulf O2 content dropping by nearly 1% per decade and near-bottom O2 decreasing by between 10 and 30 mmol m-3 in the deeper part of the Gulf between the early 1980s and the late 2000s. These changes result in the horizontal expansion of seasonal bottom hypoxia with the hypoxia-prone seafloor area increasing from less than 20,000 km2 in the 1980s to around 30,000 km2 in the 2000s. The expansion of hypoxia is also accompanied by a lengthening of the hypoxic season with hypoxia emerging locally 1 to 2 months earlier in the late 2000s relative to the early 1980s. Furthermore, declining near-bottom O2 levels result in the expansion of suboxic conditions (O2< 4 mmol m-3) and the emergence and amplification of denitrification there. An analysis of the Gulf oxygen budget demonstrates that deoxygenation is essentially caused by reduced oxygen solubility near the surface and enhanced respiration near the bottom. While reduced solubility results from the warming of the Gulf waters, enhanced respiration is mostly driven by an increased supply of nutrients imported from the Arabian Sea due to the weakening of winter Shamal winds over the study period. Our findings suggest that recent changes in local climate are not only altering the Gulf physical environment but are also having a strong impact on the Gulf biogeochemistry with profound potential implications for the ecosystems and the fisheries of the region.
1 Introduction
The Gulf is a shallow marginal semi-enclosed sea located in a subtropical hyper-arid region marked by intense evaporation ( ∼ 2 m yr-1) that far exceeds precipitation and runoff (0.2-0.5 m yr-1) (Reynolds, 1993). In consequence, the Gulf is characterized by extreme environmental conditions exemplified by wide annual fluctuations (12-36°C) in sea surface temperatures and the prevalence of large swaths of hypersaline waters with salinity exceeding 42 psu (Vaughan et al., 2019). The circulation of the Gulf is dominated by a reverse-estuarine Mediterranean-type circulation where the high-density hypersaline Gulf water (Gulf Deep Water) is exported along the southern side of the Strait of Hormuz into the Sea of Oman and is replaced by a surface inflow of fresher and lower density waters from the Indian Ocean (Indian Ocean Surface Water) along the northern side of the Strait (Chao et al., 1992; Reynolds, 1993; Swift and Bower, 2003). The Gulf hosts a variety of marine ecosystems that have adapted to its harsh environment ranging from mangroves and seagrasses to coral reefs (Vaughan et al., 2019). Yet, under the recent rapid growth of the populations and economies of the surrounding countries on the one hand and the changing regional climate on the other hand, these ecosystems are experiencing an ever-increasing pressure from anthropogenic activity (Sheppard et al., 2010; Burt, 2014; Naser, 2014; Lincoln et al., 2021). Examples of anthropogenic stressors altering the local biogeochemistry and potentially threatening the local ecosystems include the rise of eutrophication and a fast rate of warming of up to 0.6 ± 0.3°C per decade, two to three times higher than the global average over the same period (Strong et al., 2011; Al-Yamani and Naqvi, 2019; Burt et al., 2019; Lachkar et al., 2021; Lincoln et al., 2021). The increased nutrient loading (either directly through pollution from terrestrial sources or indirectly due to altered oceanic circulation because of climate change) together with the warming of the Gulf can cause a decline in O2 and lead to the emergence of hypoxia due to enhanced remineralization, increased stratification and reduced O2 solubility (Al-Ansari et al., 2015; Al-Yamani and Naqvi, 2019).
Given its very shallow depth (average depth around 35 m) and short water residence times (from below 1 year to 2.5 years) (Brewer and Dyrssen, 1985; Alosairi et al., 2011), the Gulf is generally expected to be well oxygenated in its pristine state (Grasshoff, 1975; Al-Yamani and Naqvi, 2019). Early observations (from the 1960s and 1970s) indeed suggest that the Gulf waters had remained above the hypoxic thresholds (Grasshoff, 1976; Brewer and Dyrssen, 1985). Yet, more recent observations (from the 1980s onward) reported occurrence of hypoxia (O2< 60 mmol m-3) at depth in the Gulf. For instance, O2 observations collected by the research vessel Mukhtabar Al-Bihar during September 1985 and September 1986 reported for the first time the occurrence of hypoxia within few meters of the seafloor at depths exceeding 40 m in the southeastern Gulf region and near the Strait of Hormuz (El Samra Samra and El Gindy, 1990). Observations collected in December 1993 and December 1994 by the research vessel Umitaka-Maru reported oxygen levels generally close to saturation near the surface and in the upper 50 m (Hashimoto et al., 1998). However, near the bottom (at 70 m depth) hypoxic concentrations (O2 as low as 45 mmol m-3) were recorded in the central Gulf. More recent observations in the Qatar exclusive economic zone (Qatar EEZ) revealed even stronger hypoxia with O2 concentrations dropping to as low as 37 mmol m-3 at depths below 50 m in early autumn 2000 (September-October) (Al-Ansari et al., 2015). These authors also estimated the total area covered by near-bottom hypoxia to exceed 7,000 km2 in the Qatar EEZ. Finally, a recent extensive survey of the Iranian side of the Gulf with measurements of dissolved oxygen collected from multiple cruises by the research vessel Khalij Fars between September 2018 and November 2019 reported O2 levels as low as 26 mmol m-3, the lowest O2 concentration ever measured in the Gulf (Saleh et al., 2021). In the same study, large-scale near-bottom hypoxia was observed both in summer and autumn with a total area estimated to potentially reach up to 50,000 km2 in the autumn. These observations indicate a possible intensification of hypoxia in the deeper part of the Gulf as was also suggested by recent analyses of historical O2 observations by Al-Yamani and Naqvi (2019) and Naqvi (2021).
The expansion and intensification of hypoxia in the Gulf has the potential to profoundly alter the biogeochemistry of the Gulf and its marine ecosystems in various ways. For instance, hypoxia can cause fish mortality and lead to a loss of marine biodiversity (Rabalais et al., 2002). Even when non-lethal, hypoxic conditions stress surviving organisms by negatively affecting their growth, physiology and reproduction, and by compressing their habitats and hence increasing their vulnerability to predation and fishing (Vaquer-Sunyer and Duarte, 2008); hypoxia may also cause distribution shifts as fish migrate to avoid hypoxic stress (McIlwain et al., 2011; Al-Rasady et al., 2021). Loss of dissolved O2 is also predicted to cause shifts in the food web structure that favor hypoxia-tolerant species like microbes at the expense of large animals like fishes (Vaquer-Sunyer and Duarte, 2008; Laffoley and Baxter, 2019). Finally, hypoxia can alter the community structure of reef ecosystems (e.g., Hughes et al., 2020; Johnson et al., 2021) and may hence increase the vulnerability of the Gulf coral reefs to ongoing warming and climate change (De Verneil et al., 2021).
Because of the scarcity of physical and biogeochemical observations in the region (Al-Yamani and Naqvi, 2019), our understanding of the dynamics of hypoxia in the Gulf remains in its infancy. Indeed, the lack of observations not only limits our ability to understand the dynamics of the Gulf biogeochemical environment in general and the dynamics of O2 cycling in particular, but also severely hinders documenting long-term O2 trends in the Gulf in the context of a changing climate. Several modeling studies were conducted to compensate for the scarcity of observations in the Gulf (Chao et al., 1992; Kämpf and Sadrinasab, 2006; Yao and Johns, 2010a; Yao and Johns, 2010b; Thoppil and Hogan, 2010a; Thoppil and Hogan, 2010b; Pous et al., 2013; Pous et al., 2015; Al Azhar et al., 2016; Al-Shehhi et al., 2021). However, no modeling has yet been conducted to elucidate the biogeochemistry of the Gulf, as previous studies essentially focused only on the dynamics of the Gulf circulation and its the variability. Moreover, to the best of our knowledge, no previous work has explored the drivers of large-scale hypoxia in the Gulf and its seasonal and long-term variability.
The current paper contributes to bridging these gaps. Using a state-of-the-art eddy resolving coupled physical-biogeochemical model, we examine the dynamics of dissolved O2 in the Gulf with a focus on the seasonal near-bottom hypoxia and its drivers over the period from 1982 to 2010. We show that seasonal hypoxia develops in the central Gulf over summer and peaks in the autumn, in agreement with observations. This seasonal O2 depletion results from year-long biological consumption of O2 near the seafloor combined with a weak O2 replenishment at depth between spring and autumn, caused by enhanced stratification that limits vertical mixing during this period of the year. Our simulation also reveals a recent expansion and intensification of bottom hypoxia in the central Gulf, accompanied by a lengthening of the hypoxic season. Finally, our analysis indicates that O2 depletion results from a combination of: i) reduced O2 solubility and ii) enhanced O2 consumption near the bottom and in the benthos, both are a consequence of recent regional changes in atmospheric conditions.
2 Methods
2.1 Experimental design
The circulation model is based on a configuration of the Regional Ocean Modeling System (ROMS) AGRIF version (Shchepetkin and McWilliams, 2005) thoroughly described in Lachkar et al. (2021). The model domain covers the entire Indian Ocean at 1/10° eddy-resolving horizontal resolution and uses 32 vertical layers in terrain-following sigma-coordinates, with enhanced vertical resolution near the surface. The marine biogeochemistry and the dynamics of the lower trophic ecosystem is represented using a nitrogen-based nutrient–phytoplankton–zooplankton–detritus (NPZD) model (Gruber et al., 2006) that uses six compartments: two nutrients (nitrate and ammonium), one phytoplankton class, one zooplankton class and two classes of detritus (small and large sizes). Previous observations suggest that nitrogen is the main limiting nutrient in the Gulf, thus supporting the use of a nitrogen-based NPZD model to investigate the dynamics of Gulf hypoxia (Grasshoff, 1976; Brewer and Dyrssen, 1985; Hashimoto et al., 1998; Al-Said et al., 2018; Al-Yamani and Naqvi, 2019). Furthermore, the model represents the cycling of oxygen as well as water column and benthic denitrification (Lachkar et al., 2016). The details of the equations that govern the evolution of O2 in the model are provided in the Supplementary Information (SI). The model simulation is forced with the ECMWF ERA-Interim 6-hourly reanalysis data. Surface salinity is restored to the Simple Ocean Data Assimilation (SODA) reanalysis data (Carton and Giese, 2008), whereas sea surface temperature (SST) is restored to Advanced Very High Resolution Radiometer (AVHRR) Pathfinder and Aqua MODIS observations using the heat flux correction method proposed by Barnier et al. (1995). Initial and lateral boundary conditions for temperature, salinity, currents and sea surface height are derived from the SODA reanalysis, whereas nitrate and oxygen initial and boundary conditions are extracted from the World Ocean Atlas (WOA) 2013 (Garcia et al., 2013a; Garcia et al., 2013b). As the used SODA reanalysis data (version 2.3) is available only up to 2010, we have restricted the simulated period to the period from January 1982 to December 2010. Finally, we restrict our analysis to the Gulf region extending from 24°N to 30°N in latitude and from 48°E to 57°E in longitude. The model is spun-up over a period of 145 years allowing a minimal drift in the upper and intermediate ocean. The details of the spin-up strategy and model drift analysis are provided in Lachkar et al. (2021).
2.2 Model evaluation
The performance of the model in the Arabian Sea region was thoroughly assessed in Lachkar et al. (2021). In particular, the model was shown to reproduce relatively well the physical and biogeochemical mean state as well as the observed long-term changes in temperature and stratification in the Arabian Sea. The evaluation of the performance of the model in reproducing the sea surface temperature as well as the three dimensional structure of temperature, salinity and density in the Gulf is presented in detail in the SI (Figure S1–S7). Despite the scarcity of in-situ observations, this analysis reveals that the model displays a similar range of variation in temperature, salinity and density to that depicted in observations. Moreover, the simulated progression of stratification from winter to summer is comparable to that derived from observations. Additionally, the model captures relatively well the strong observed temperature gradients across the Gulf in both summer and winter. However, the model also shows some local discrepancies with respect to observations such as an underestimation of vertical stratification in both temperature and salinity with a maximum bias in summer for temperature and winter for salinity (SI). This may stem from the fact the model and observations are covering slightly different time periods or may indicate a weaker vertical stratification in the model that may lead to an overestimation of O2 at depth and a potential underestimation of simulated bottom hypoxia.
The volume and seasonality of the Gulf outflow (through the Strait of Hormuz) is an additional key parameter we use to assess the model skill. While this metric has been used in many previous modeling studies of the Gulf, available direct observations of the Gulf outflow are very limited and come essentially from the study by Johns et al. (2003) who deployed acoustic Doppler current profiler (ADCP) moorings to measure the intensity and seasonality of the outflow across the Strait of Hormuz. In that study, the authors investigated the exchange between the Gulf and the Arabian Sea through the Strait of Hormuz over the period from December 1996 to March 1998. They found a strong and relatively steady deep outflow below 45 m of around 0.15 ± 0.03Sv (1Sv = 106 m3 s-1) that varies from 0.08 Sv in December to 0.18 Sv in March. On top of this, a weaker but strongly varying outflow of 0.06 ± 0.02 Sv is observed near the surface (above 45 m). In agreement with these observations, our model simulates an annual deep outflow of 0.13 ± 0.05 Sv that varies between 0.06 Sv in December and 0.2 Sv in May and a surface outflow of 0.05 ± 0.02 Sv (Table 1). Taken together, the model simulates a total annual outflow of 0.17± 0.06 Sv, in a good agreement with estimate of 0.21± 0.05 Sv from Johns et al. (2003). Our simulated outflow also compares well with previous estimates based on indirect measurements (Ahmad and Sultan, 1991; Pous et al., 2004) and model simulations (Chao et al., 1992; Kämpf and Sadrinasab, 2006; Yao and Johns, 2010b) (see a listing of these different estimates in Table 1). In summary, despite a few identified local biases, the model exhibits a reasonable skill at reproducing the key characteristics of the hydrography of the Gulf as known from observations. Next, we evaluate the model representation of key biological variables, chlorophyll-a and O2.
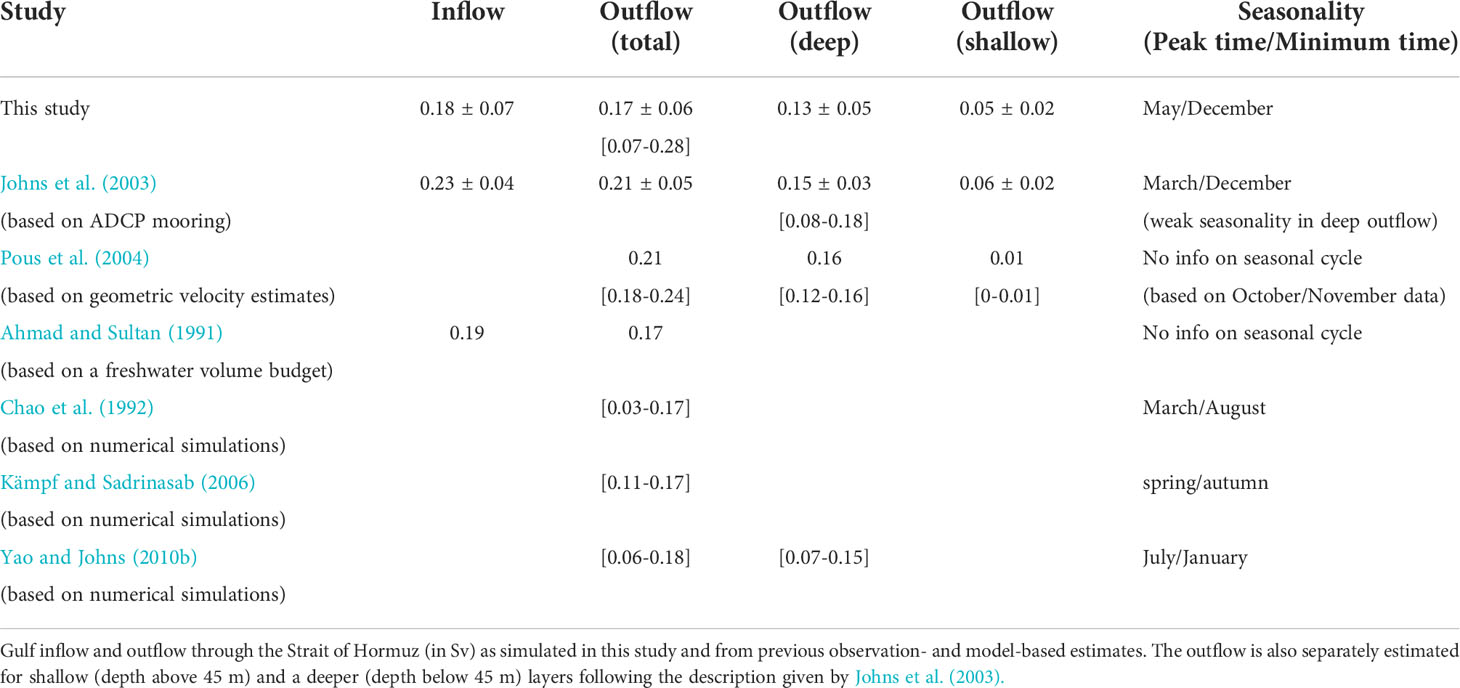
Table 1 Gulf outflow estimates.
The evaluation of the model ability to represent biological productivity is hindered by the lack of in-situ measurements of primary production in the Gulf region. Similarly, openly available in-situ measurements of Chl-a pigment, typically used as an indicator of phytoplankton biomass are also very scarce in the region. However, we contrast here our model simulated chlorophyll-a to a set of in-situ observations collected in the Qatar exclusive economic zone in the central Gulf from six research cruises conducted in April 2015, June 2015, November 2015, February 2016, April 2016, and September 2016 (Al-Naimi et al., 2017). The comparison of the surface chlorophyll concentration throughout the year between the model and the in-situ observations depicts a good agreement both in terms of the annual average and seasonality (Figure 1). The model also reproduces well the observed depth and magnitude of the deep chlorophyll maximum (DCM) in the region both in spring and summer. However, the model underestimates the magnitude of the DCM in winter and overestimates it in the autumn season (Figure 1). Interestingly, the satellite chlorophyll data from the Ocean Color Climate Change Initiative (OC-CCI) shows a strongly significant correlation with the in-situ observations in the region, despite an important systematic overestimation of in-situ measurements [Figure 1, Al-Naimi et al. (2017)]. This overestimation is likely due to the high turbidity of the Gulf waters (classified as optically complex Case II waters) and the presence of suspended sediments that alter the reliability of the chlorophyll estimates retrieved from satellites. Nevertheless, the statistically high-correlation (r = 0.795, p< 0.001) found in the region between in-situ and satellite data suggests that remotely sensed chlorophyll observations can be used to characterize the seasonality of the Gulf biological productivity (Al-Naimi et al., 2017). Therefore, to complement our model evaluation we contrast the simulated surface chlorophyll seasonal anomalies to those derived from the OC-CCI data over the entire Gulf (Figure S8, SI). In order to minimize the potential contamination of the chlorophyll signal by suspended sediments and bottom reflectance in satellite data, we restricted this comparison to the area of the Gulf that has a seafloor bathymetry deeper than 30 m. This comparison shows a good agreement between the model and the satellite chl-a data across the Gulf, both in winter and summer seasons and highlights the fact that the simulated seasonal variability in chlorophyll is consistent with that from satellite-based observations (Figure S8, SI).
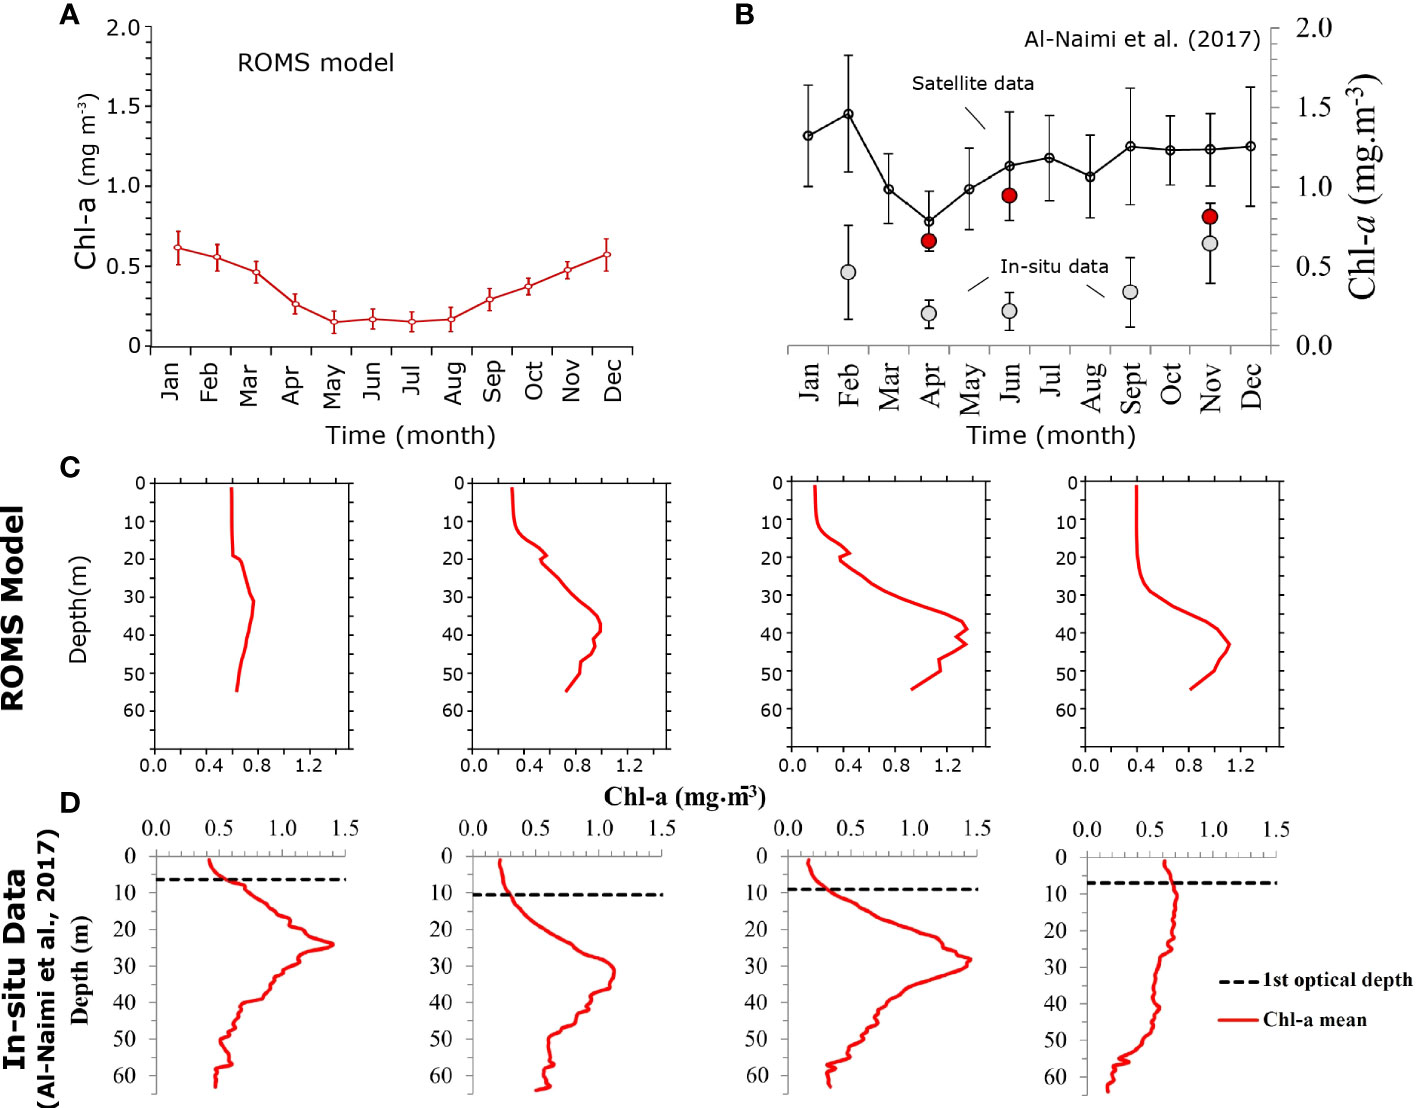
Figure 1 Evaluation of the model simulated chlorophyll-a concentrations (A, B) Seasonal surface Chl-a concentrations (in mg m-3) in the Qatar Exclusive Economic Zone (EEZ) (A) as simulated by ROMS and (B) from observations published by Al-Naimi et al. (2017). Gray circles show in-situ observations from six research cruises (2015-2016) while the black line indicates surface chl-a based on the OC-CCI satellite monthly climatology (1997-2013). (C, D) Vertical profiles of Chl-a in the Qatar EEZ in winter (DJF), spring (MAM), summer (JJA) and autumn (SON) seasons as simulated by (C) ROMS and (D) from in-situ measurements by Al-Naimi et al. (2017). Note that the seasonal in-situ chlorophyll profiles for winter, spring, summer and autumn are based on data collected in February 2016, April 2015/2016, June 2015, and September 2016/November 2015, respectively.
Observations of oxygen in the Gulf are very scarce. Here, we compare the model simulated O2 with observations from the extensive survey recently conducted in the Iran exclusive economic zone from summer 2018 to autumn 2019 (Saleh et al., 2021). This comparison is shown in Figure 2. Although the observations are collected outside of the period covered by the model simulation (ending in December 2010), this comparison is useful to illustrate the model performance in reproducing the seasonal variability in O2 both near the surface and close to the bottom. This comparison reveals that the model is able to capture the seasonal progression of low O2 and bottom hypoxia as inferred from the Saleh et al. (2021) observations. Indeed, throughout the sampled months oxygen is lowest in the late summer and early autumn (September) below 50 m and highest near the surface in May both in the model and the observations (Figure 2). However, the model simulated O2 concentrations are slightly above those measured in the summer and autumn, particularly below 50 m. Although not statistically significant (as the error bars from observations and model do overlap), this difference may also reflect the fact the model and observations are covering different time periods or may indicate an overestimation of O2 at depth that may cause an underestimation of the extent and magnitude of Gulf bottom hypoxia in the model.
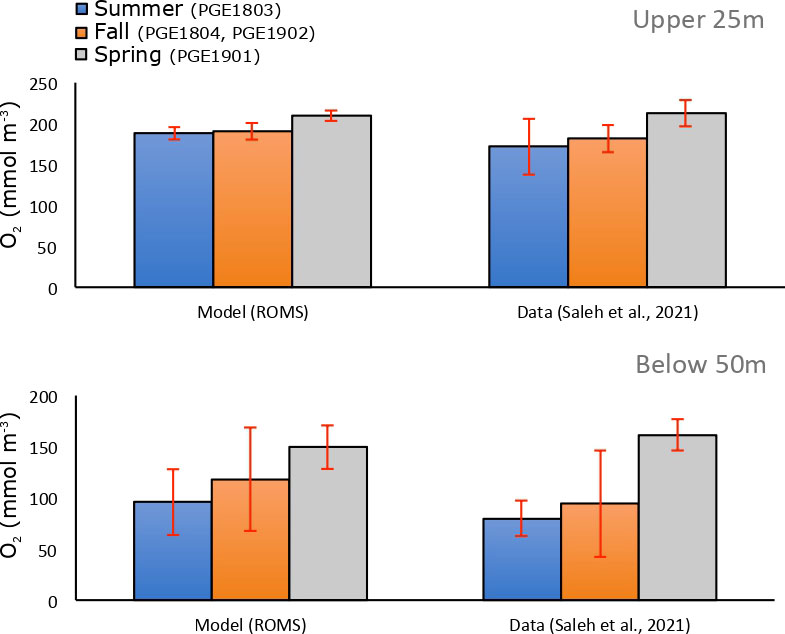
Figure 2 Evaluation of the model simulated dissolved O2 concentrations. O2 concentrations in the the Gulf (Iran EEZ) in late summer (blue), late autumn (orange) and spring (gray) as simulated by ROMS (left) and from observations collected during cruises PGE1803, PGE1804, PGE1901, and PGE1902 in 2018 and 2019 by Saleh et al. (2021) (right) in the upper 25m (top) and below 50m (bottom). Bar plots correspond to average concentrations for each season while error bars show standard deviations around the mean. For this comparison, the model was sampled at the observation points for each season.
Finally, the evaluation of the model’s ability to reproduce long-term changes in the Gulf is limited by the sparse data coverage in the region. Nevertheless, we use available observational data to assess the model simulated trends. More specifically, we contrast here simulated trends in SST to trends based on different observational products. Additionally, we also compare simulated long-term trends in temperature, salinity and density to trends derived from the ECMWF Ocean Reanalysis System 5 (ORAS5) reanalysis at both surface and at 50 m depth. This comparison reveals that the simulated surface warming is generally in good agreement with that from the different observational SST products, despite differences in the magnitude of warming, with ERA5 (HadlSST) displaying the strongest (weakest) rates of warming (Figure S9, SI). The model comparison with ORAS5 reveals that the simulated trends in temperature at both the surface and bottom compare relatively well with those derived from the reanalysis (Figure S10, SI). However, our model simulates a slight increase in salinity, especially in the southern Gulf at the surface, that contrasts with the a slight but statistically insignificant decrease in ORAS5 salinity. This is because our model is forced by the SODA reanalysis that similarly shows a slight increase in surface salinity over the study period. This discrepancy is likely to have limited implications for the simulated trends in circulation as the water density generally decreases both near the surface and at depth in both our model and ORAS5 reanalysis (Figure S12, SI).
2.3 Sensitivity experiments
In addition to strong warming, the analysis of trends in atmospheric conditions over the Gulf region reveals an important weakening of the northwesterly Shamal winds that is particularly important during winter (Figure S13, SI). These trends are relatively robust and consistent across multiple data products. Indeed, trends in surface winds from three reanalysis products: ERA-Interim (here used to force the model), the Japanese 55-year Reanalysis Project (JRA-55), and the National Centers for Environmental Prediction reanalysis II (NCEP-2) all show a weakening of wind speed and a reduction in the northwesterly Shamal winds that is particularly important in winter (Figure S13, SI). Finally, a previous analysis of simulated oxygen trends in the Arabian Sea conducted over the same period revealed a strong intensification of the oxygen minimum zone (OMZ), particularly in the adjacent Sea of Oman (Lachkar et al., 2021). Therefore, to disentangle and quantify the potential individual contributions of: (i) local warming, (ii) wind changes and (iii) remote deoxygenation to the simulated O2 trends in the Gulf, we analyze three additional sensitivity simulations (Table S1, SI). In the first run, Swclim, all atmospheric conditions vary interannually like in the control run except winds that are extracted from a normal year (that is neutral with respect to the leading interannual climate oscillations El Niño Southern Oscillation (ENSO) and Indian Ocean Dipole (IOD)), 1986, and repeated every year (i.e., no wind changes). This approach allows filtering out interannual variability while conserving the high-frequency variability of the original forcing (e.g., Large and Yeager, 2004). In the second sensitivity experiment, SAG_hclim, the heat fluxes were similarly extracted from the year 1986 and repeated annually but only over the Gulf region (i.e., no local warming over the Gulf). Finally, in a third simulation SAS_hclim, the heat fluxes are interannual over the Gulf and climatological over the rest of the domain (i.e., warming over the Gulf only). In this latest run, no significant OMZ intensification is simulated in the upper layers of the Arabian Sea (i.e., no remote deoxygenation affecting the Gulf inflow source waters).
3 Results
3.1 Seasonal hypoxia in the Gulf and its drivers
O2 in the control run remains close to saturation in the upper 50 m and shows a relatively limited seasonal variation, with a peak in March and a minimum in October (Figure 3A). Below 50 m, O2 shows a much larger deviation from its saturation levels and exhibits a stronger seasonal variation with a peak in February and a minimum in October (Figure 3B). O2 depletion at depth leads to the emergence of near-bottom (here defined as the model deepest layer) hypoxia (O2< 60 mmol m-3) that develops over a significant portion of the deeper part of the Gulf (bathymetry deeper than 50 m) with a maximum covered area fraction reaching up to 30-50% in the autumn (October-November) (Figure 3D). This seasonal progression of bottom hypoxia is consistent with recent observations from Saleh et al. (2021) that also indicate that near-bottom hypoxia emerges in the deepest part of the Gulf in summer and reaches its maximum spatial extent in the autumn. Our finding is also consistent with the observations of Al-Ansari et al. (2015) who first reported hypoxia in the deeper (>50 m) layers of the exclusive economic zone of Qatar in the central Gulf in the late summer and early autumn (September-October). The drop in near-bottom O2 concentrations also leads to the emergence of suboxia (O2< 5 mmol m-3) during the autumn over 2-5% of the deep Gulf area (Figure 3D).
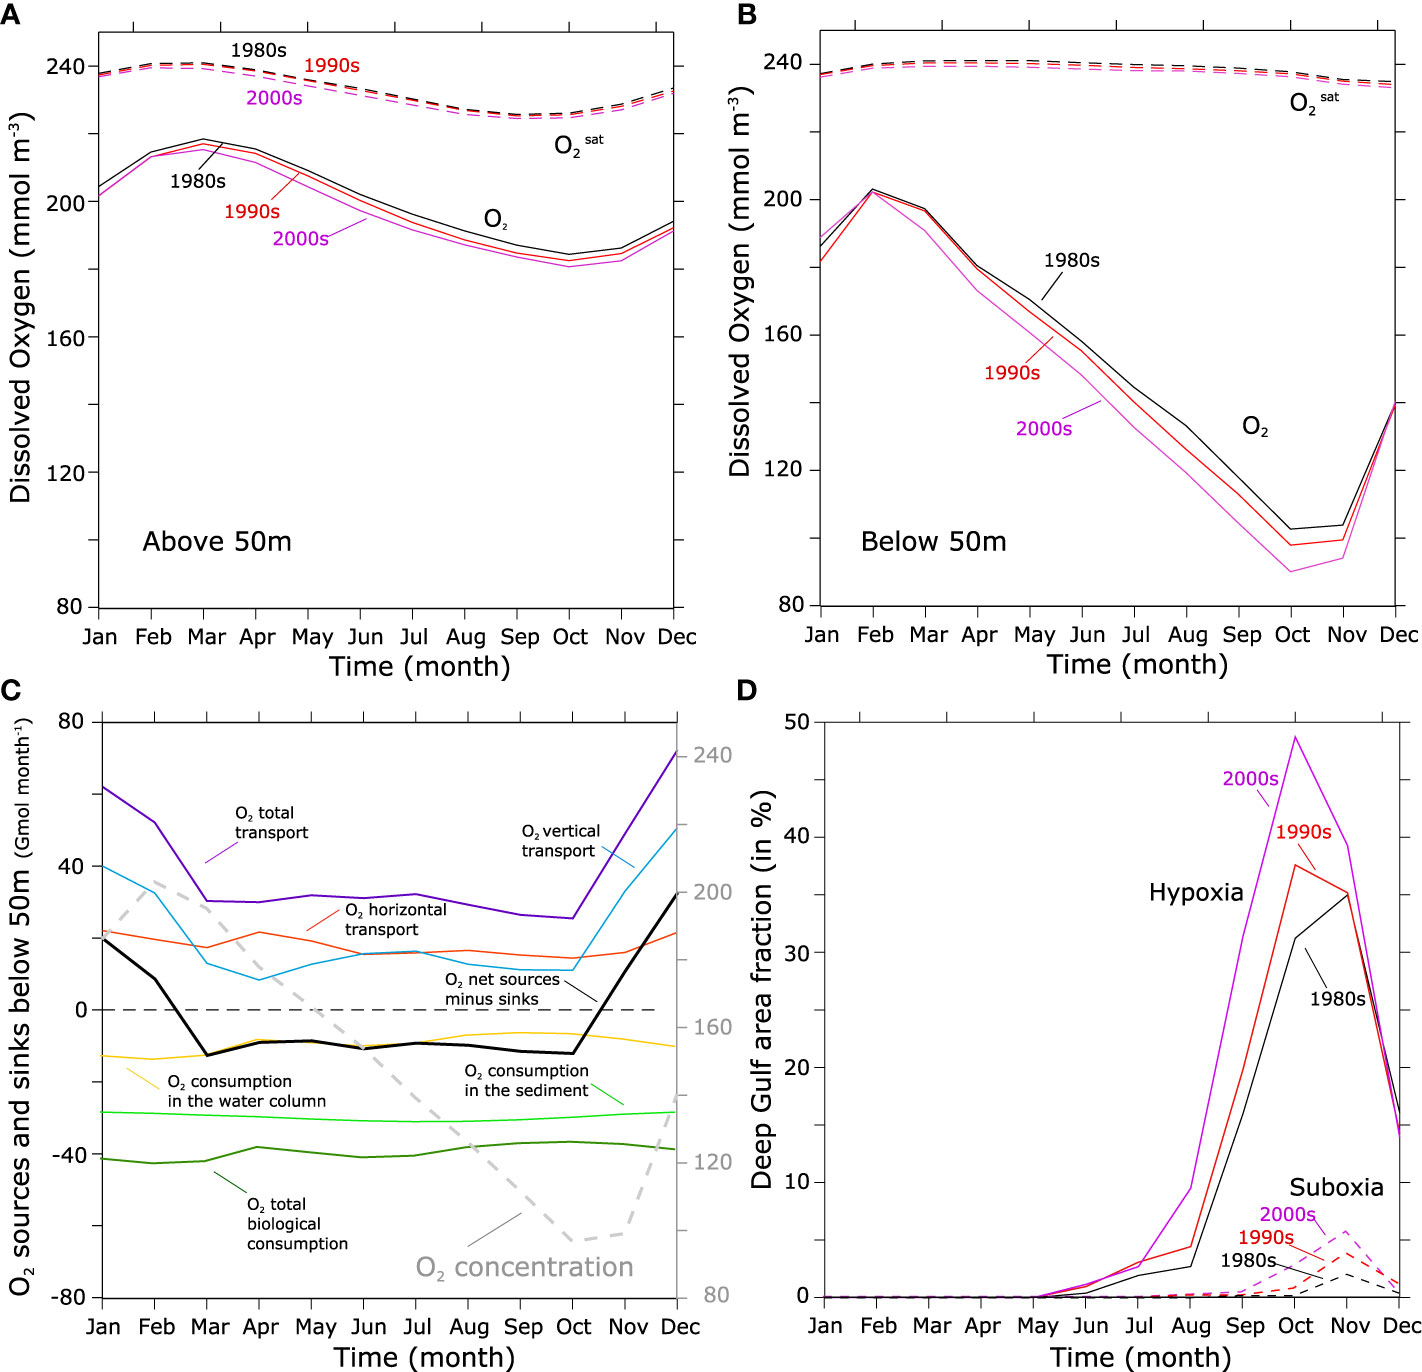
Figure 3 Seasonal variation in O2 and bottom hypoxia. (A, B) Average seasonal cycle in O2 (solid) and (dashed) in the 80s (black), 90s (red) and 2000s (purple) above 50m (A) and below 50m (B). (C) Seasonal variation in annual mean O2 concentrations (dashed gray line) and in physical and biological sources and sinks (solid lines) in the Gulf below 50 m. (D) hypoxic (O2< 60 mmol m-3) (solid) and suboxic (O2< 4 mmol m-3) (dashed) area fraction (in %) in the deep Gulf (bathymetry deeper than 50 m) in the 80s (black), 90s (red) and 2000s (purple).
Al-Ansari et al. (2015) have speculated that bottom O2 concentration is highest in the winter because of the weak stratification that favors the mixing of deep layers with the O2 saturated surface waters. They also speculated that bottom hypoxia develops in summer because of the stronger stratification that prevents mixing as well as the strong fertilization of the Gulf by the intrusion of the surface nutrient-rich Indian waters in summer, that enhances productivity and boosts remineralization and O2consumption. Here we perform an O2 budget analysis in the deeper (>50 m) part of the Gulf to elucidate the drivers of O2 depletion and the factors controlling the seasonal progression of hypoxia (Figure 3C). The results of this analysis indicate that near-bottom O2 is, indeed, maximum in winter because of a weaker stratification favoring a more vigorous vertical mixing with surface waters. However, our analysis also shows that the drop in deep Gulf water oxygen levels is not driven by a peak in O2 consumption in summer but is rather driven by the cumulative year-long biological drawdown of O2, in combination with the weak oxygen replenishment from spring to autumn due to enhanced stratification during this period of the year (Figure 3C). Our analysis also reveals that the peak fertilization of the Gulf occurs in winter (Figure 10 and Figure S14, SI). This is likely due to the higher nitrogen content of the Indian Ocean surface waters in winter that results from convective mixing in the northern Arabian Sea (Naqvi et al., 2002; Al-Yamani and Naqvi, 2019).
3.2 Deoxygenation and bottom hypoxia intensification in the Gulf
The analysis of O2 trends over the study period reveals a steady decline in the O2 content of the Gulf as a whole as well as in its deeper (> 50 m) layer at statistically significant rates of 1.04 mmol m-3 decade-1 and 4.07 mmol m-3 decade-1, respectively (Figure 4A). The decline is particularly important in summer and autumn where O2 concentrations decrease at depth by more than 20 mmol m-3 between the early 1980s and the late 2000s (Figure S15, SI). The rate of O2 decline is however uneven, with a stronger decline between 1990s and 2000s than between the 1980s and 1990s (Figure 3B), reflecting a strong imprint of the interannual variability on the long-term deoxygenation signal (Figure 4). The O2 depletion results in an important increase in the near-bottom hypoxia- and suboxia-prone areas between the 1980s and the 2000s at statistically significant rates of 3818 and 1013 km2 decade-1, respectively (Figure 4B). The expansion of hypoxia comes with a strong seasonality with a particularly fast intensification in late summer and in the autumn seasons (Figure 3D). Indeed, not only do hypoxia (and suboxia) reach their maximum extent in the late summer and autumn but the maximum decline in O2 in absolute terms is also recorded during this period of the year (Figure 3D and Figure S15, SI). However, in relative terms the increase in hypoxic area is more important in spring and early summer (Figure 3D and Figure S16, SI).
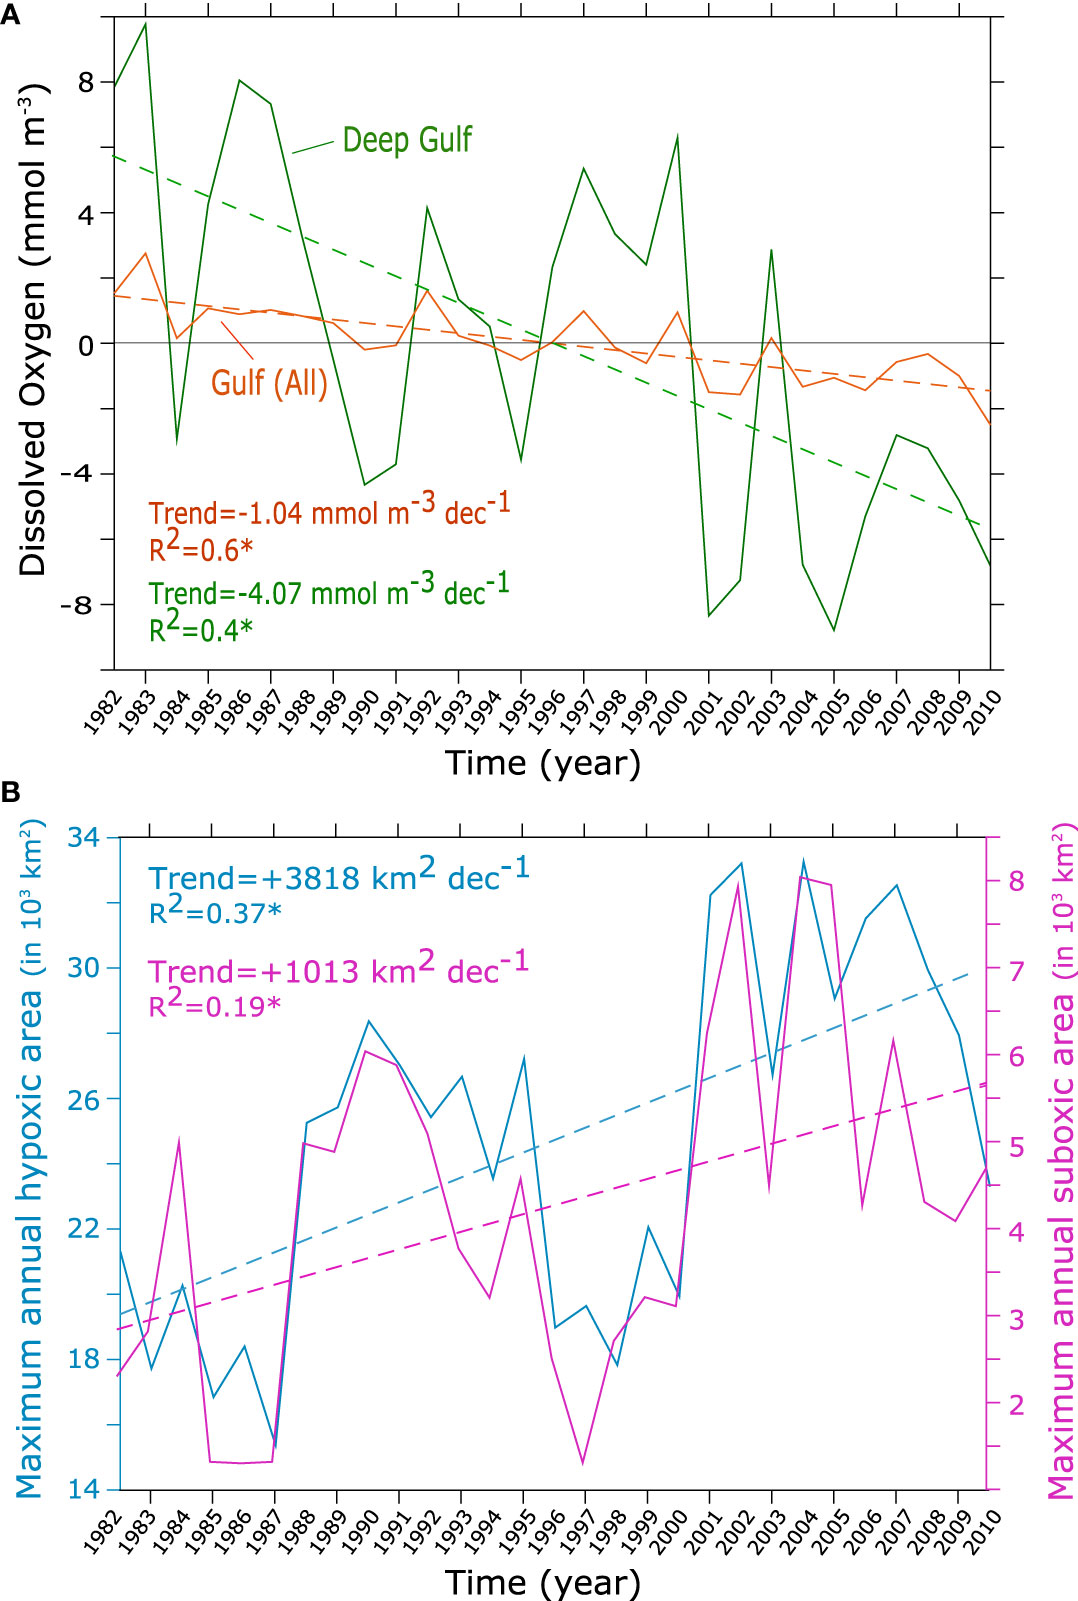
Figure 4 Gulf deoxygenation trends. (A) O2 anomalies and trends over the entire Gulf (orange) and the deep Gulf (green) between 1982 and 2010. The deep Gulf corresponds to the Gulf region with a bathymetry deeper than 50 m. (B) Evolution of the annual maximum area of hypoxia (blue) and suboxia (purple) (in x 1000 km2) between 1982 and 2010. Dashed lines indicate the trend lines.
These changes are accompanied by a local lengthening of the hypoxic season by 1 to 3 months mostly associated with an earlier start of the hypoxic season by 1 to 2 months between the early 1980s and the late 2000s (Figure 5). Additionally, an increase in the frequency and severity of the hypoxic episodes can also be observed over the study period (Figure 5). For instance, in the late 2000s O2 levels dropped to the suboxic or near suboxic ranges (O2< 20 mmol m-3) in areas that only recorded moderate hypoxia (40 mmol m-3< O2< 60 mmol m-3) in the early 1980s (Figure 5A and Figure S17, SI). This has led to a near doubling of denitrification rate in the Gulf over the study period (Figure S18, SI). Additionally, in the late 2000s hypoxia became regular (with at least 1 event per year) in areas where its occurrence was uncommon (e.g., less than 1 event in 5 years) in the early 1980s (Figure 5). Next, we explore the drivers of oxygen changes in the Gulf with a focus on changes in near-bottom O2 and hypoxia.
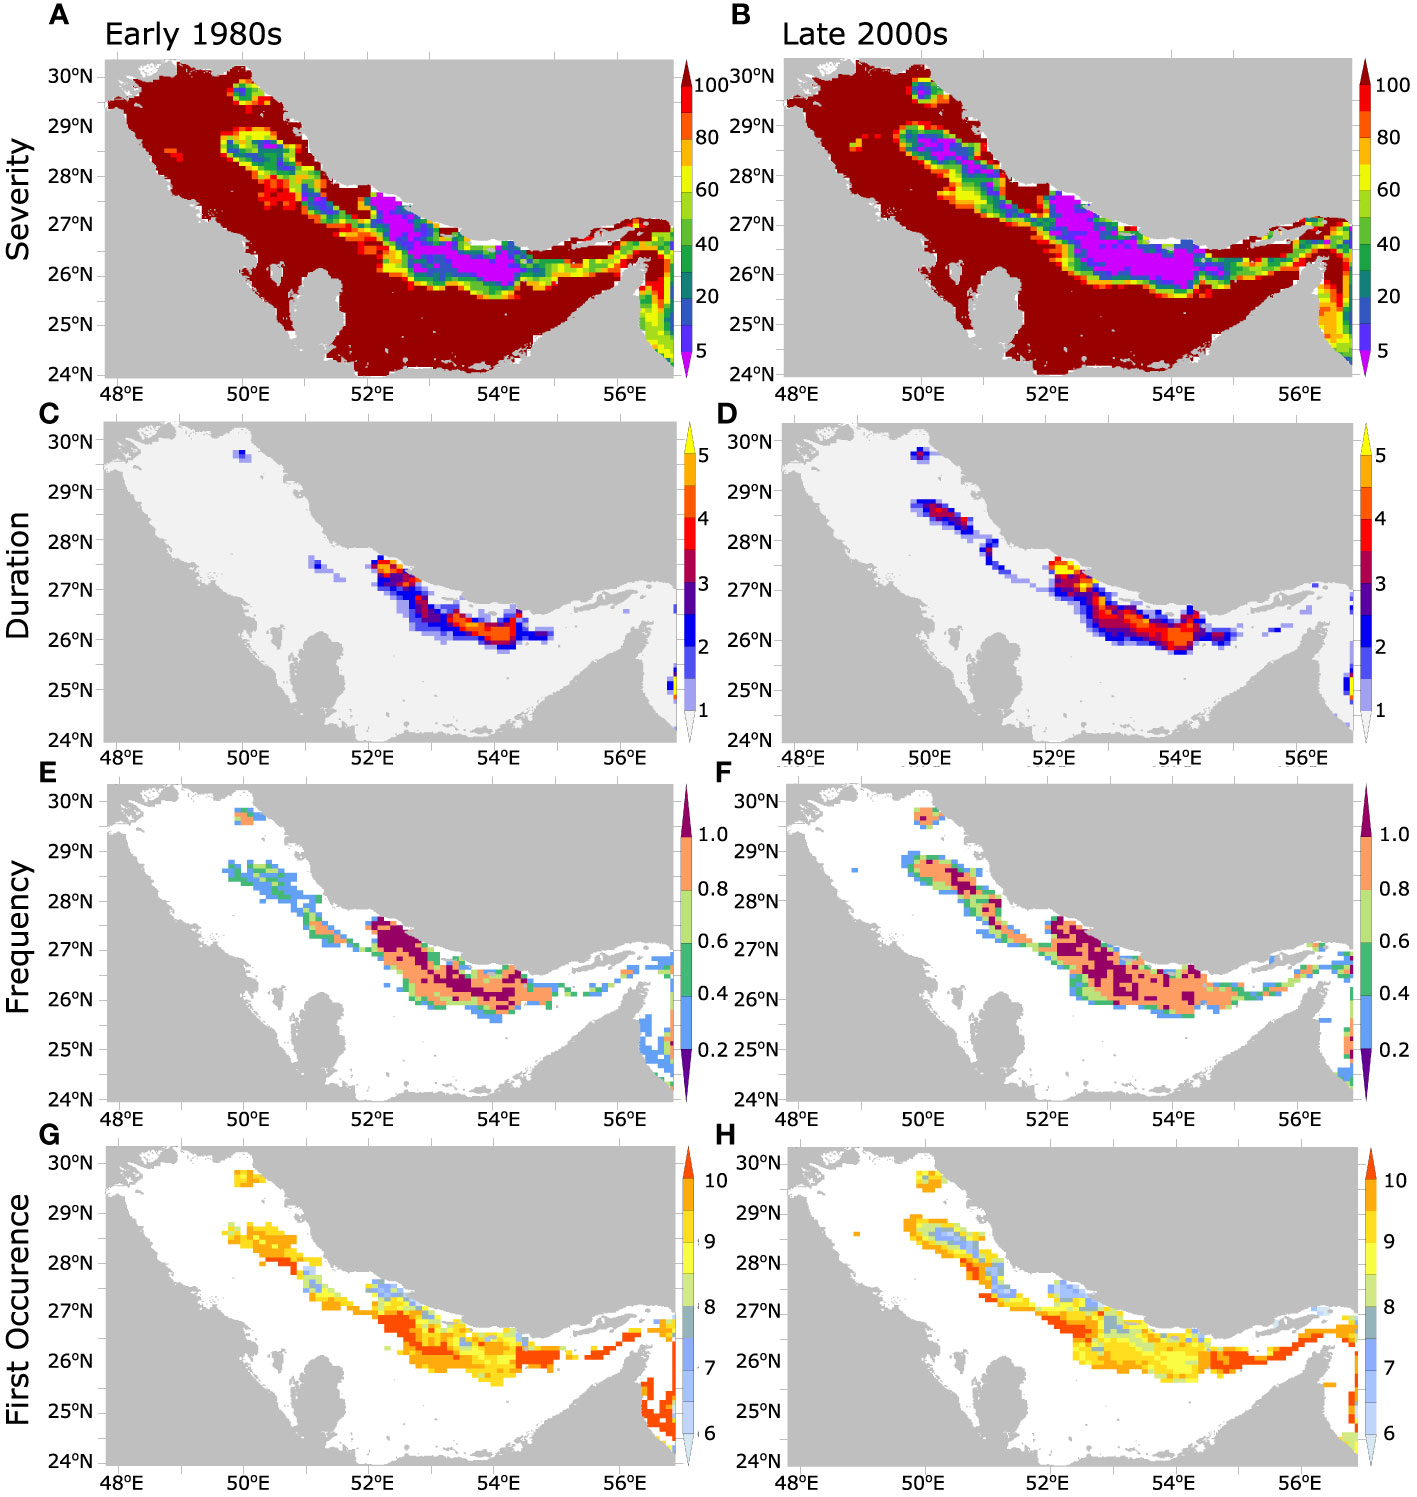
Figure 5 Evolution of the statistics of seasonal hypoxia in the Gulf between 1980s and 2000s. Annual near-bottom hypoxia (A, B) severity (i.e., O2 minimum concentration in mmol m-3), (C, D) total duration (in months), (E, F) frequency (number of hypoxic events per year), and (G, H) first occurrence (month of the year) in the early 1980s (1982-1986) (left) and late 2000s (2006-2010) (right).
3.3 Drivers of deoxygenation and near-bottom hypoxia expansion
At the sea surface, dissolved oxygen is generally at or near-equilibrium with the atmosphere. This equilibrium concentration, , known as oxygen saturation level is a function of temperature, salinity and atmospheric pressure (Garcia and Gordon, 1992). As water leaves the surface and is subducted into deeper layers, its O2 content gets depleted by biological activity. The O2 deviation for a water parcel from its saturation level, known as apparent oxygen utilization (), is a measure of oxygen consumption via biological activity since the parcel was last at equilibrium in contact with the atmosphere. Therefore AOU depends both on biological activity as well as on ventilation (pathways and timescales). Here, to separate the contributions of changes in ventilation and biology (O2 utilization effect) from those driven by changes in O2 saturation (thermal effect), essentially induced by temperature changes, we decompose the oxygen anomaly ΔO2 as:
where and ΔAOU represent the anomalies of and AOU, respectively. The analysis of the three terms of this equation reveals that the reduction of (thermal effect) explains the majority of the simulated O2 decline throughout the water column in the shallow banks of the southern Gulf (Figure 6). In the western and northwestern Gulf, warming-induced decline in explains around half of the O2 decline. In contrast, in the deeper part of the Gulf along the Iranian coast, changes in explain only 30 to 40% of the total O2 decline, driven mostly by changes in O2 biological utilization (AOU) (Figure 6). When considering the deepest layer of the Gulf (deepest model sigma layer), the dominance of AOU over is even more pronounced, with AOU changes explaining locally between 70% and 90% of O2 decline in the deep part of the Gulf (h > 50 m) (Figure 7). We conclude therefore that the near-bottom hypoxia expansion reported in our study is mostly driven by changes in AOU, and hence changes in either biological consumption or O2 transport, with only a small contribution emanating from decreasing O2 solubility.
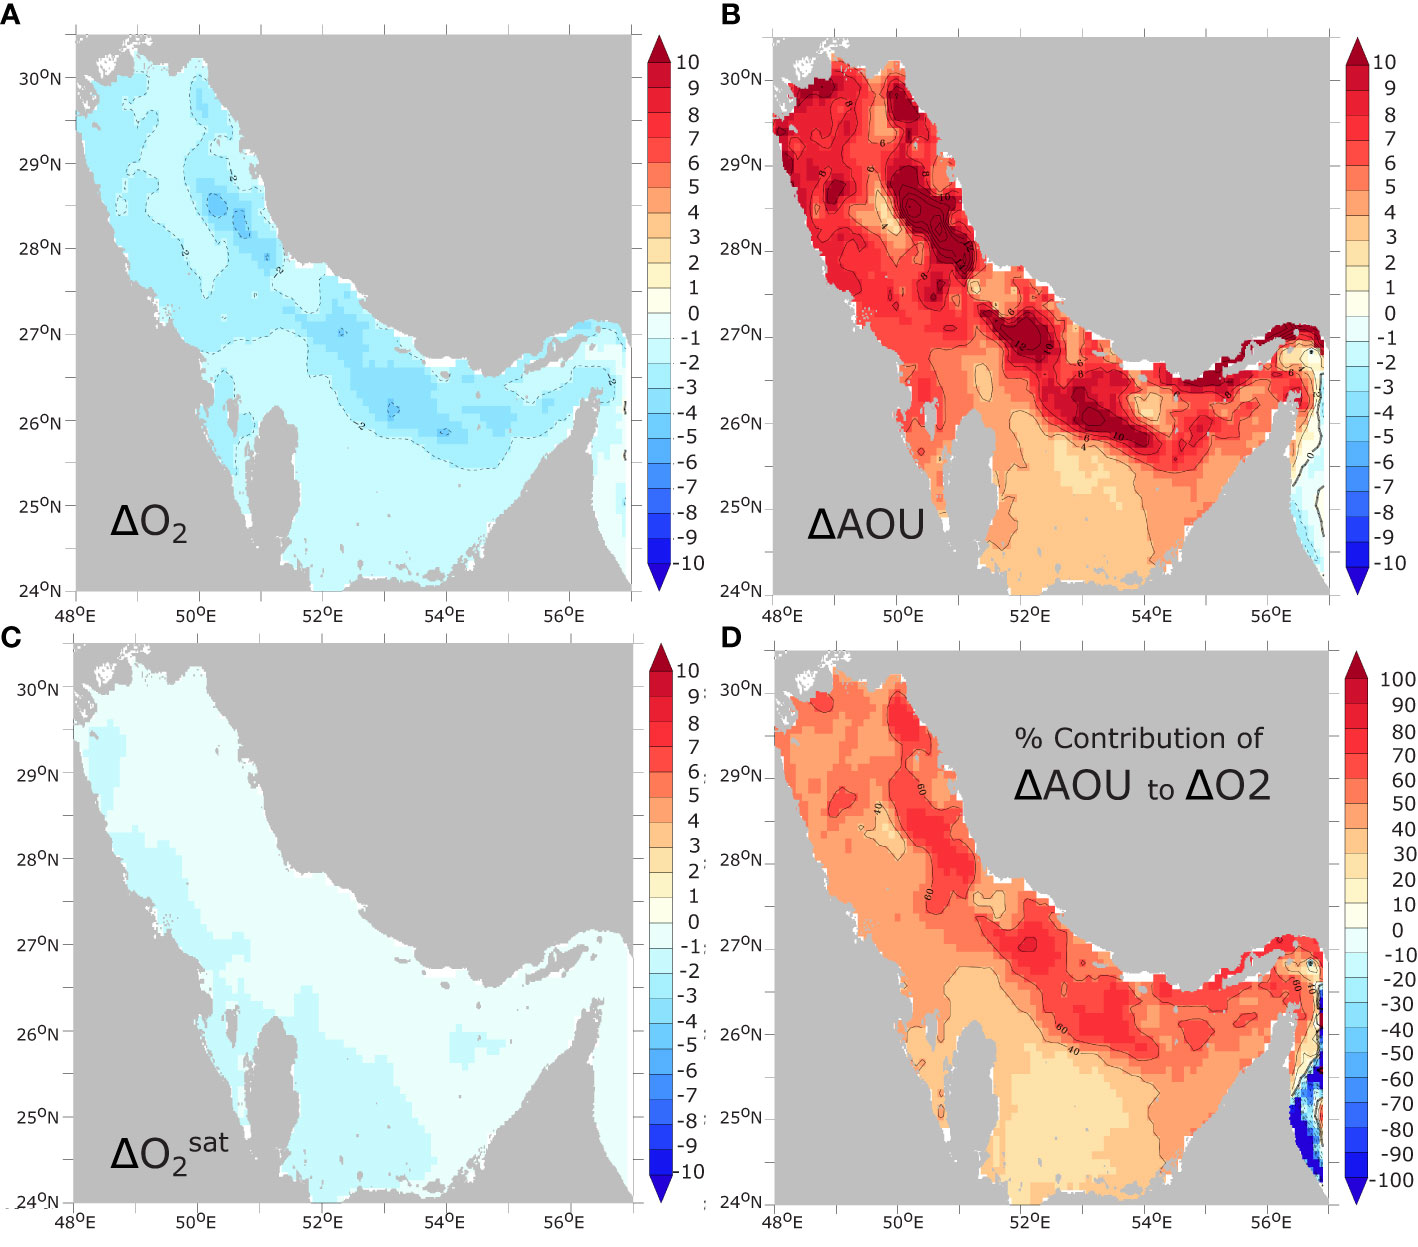
Figure 6 Contributions of solubility and AOU changes to O2 changes. Relative change in (A) annual mean O2 inventory (i.e., vertically-integrated O2 concentration) and (B) AOU between 1982 and 2010 (in % of average O2 inventory and AOU, respectively). (C) relative change in oxygen inventory at saturation (). (D) contribution of changes in AOU (-ΔAOU) to oxygen changes (in % of total O2 changes).
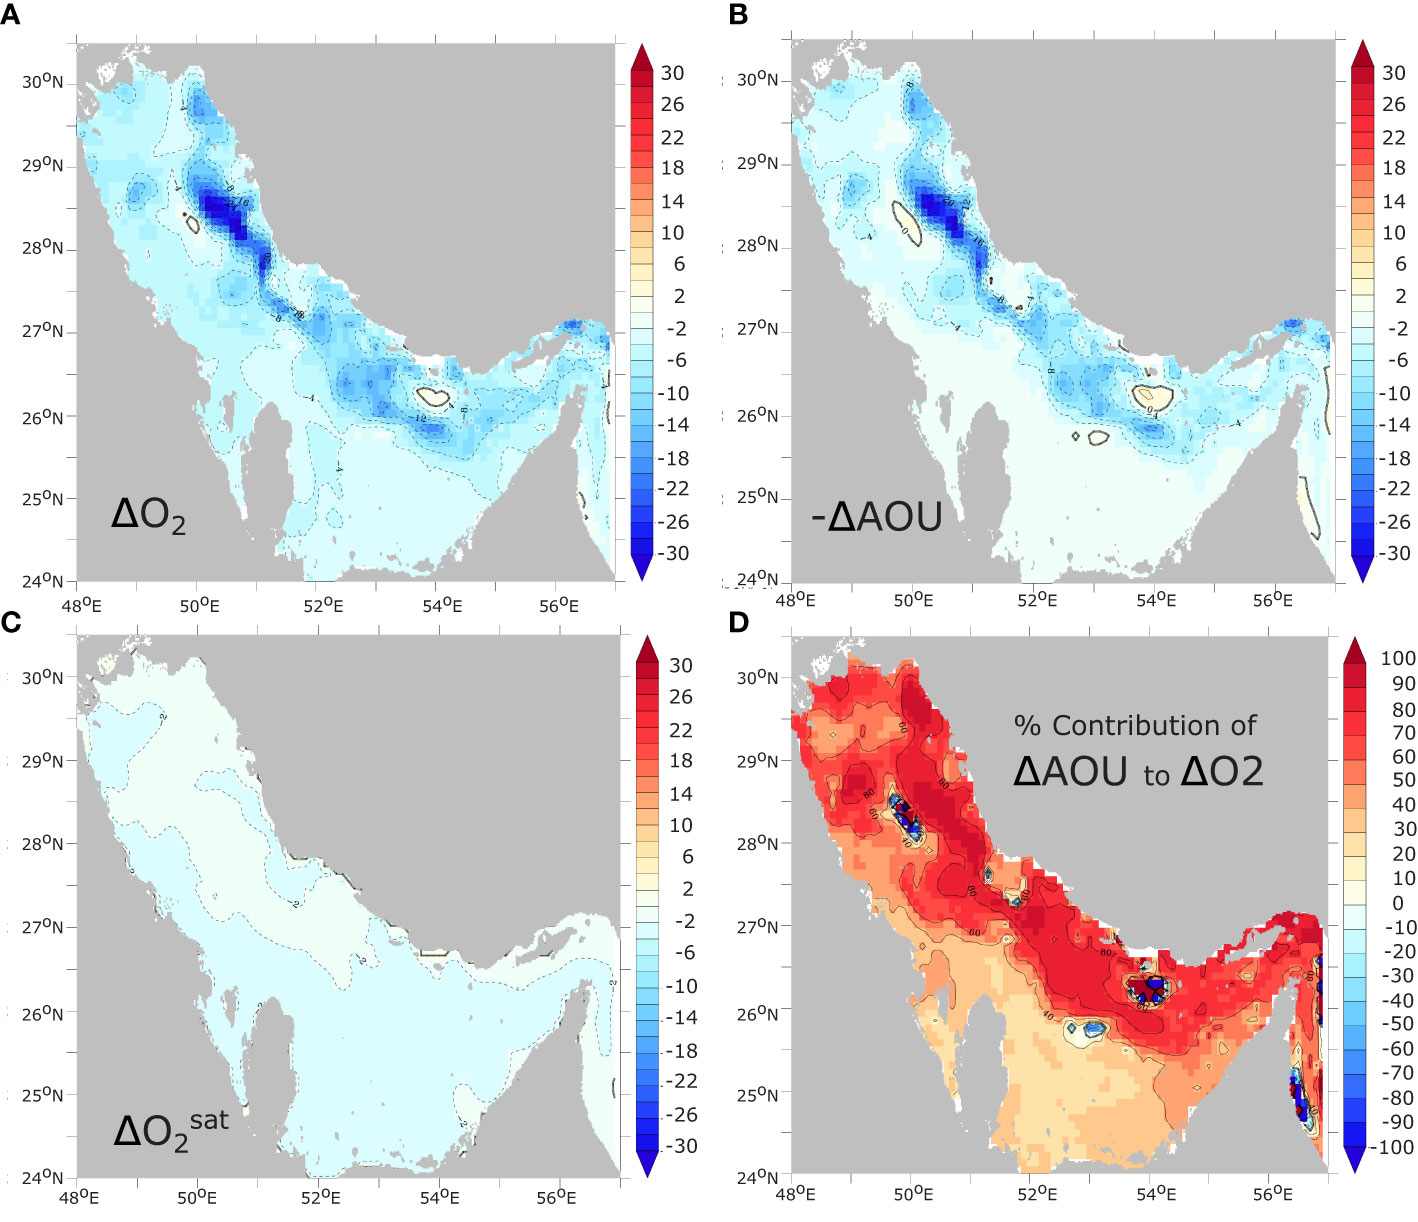
Figure 7 Contributions of solubility and AOU changes to near-bottom O2 changes. Change in annual mean near-bottom (deepest model sigma layer) (A) O2 concentrations and (B) -ΔAOU (), and (C) between 1982 and 2010 (in mmol m-3). (D) contribution of changes in AOU (-ΔAOU) to changes in near-bottom O2 (in %).
To disentangle the roles of biology (remineralization) and transport (ventilation) in driving near-bottom O2 depletion, we performed an O2 budget in the model deepest layer (Figure 7). This analysis reveals that near-bottom O2 decline is driven by biological consumption, while O2 transport acts to partially counteract this tendency (Figure 8). This compensation reflects the effect of vertical mixing with O2-rich surface waters, dampening O2 depletion. The O2 budget also reveals that the enhanced O2 consumption near the bottom is mostly driven by an increase in remineralization in the sediment (Figure 8). This reflects the importance of benthic respiration (and sedimentary processes in the Gulf biogeochemistry in general) as can be expected in such a very shallow marginal sea (Al-Yamani and Naqvi, 2019). This is also consistent with the recent findings of De Verneil et al. (2021) that suggest that a considerable fraction of the total O2 consumption in shallow portions of the Gulf may be associated with benthic respiration.
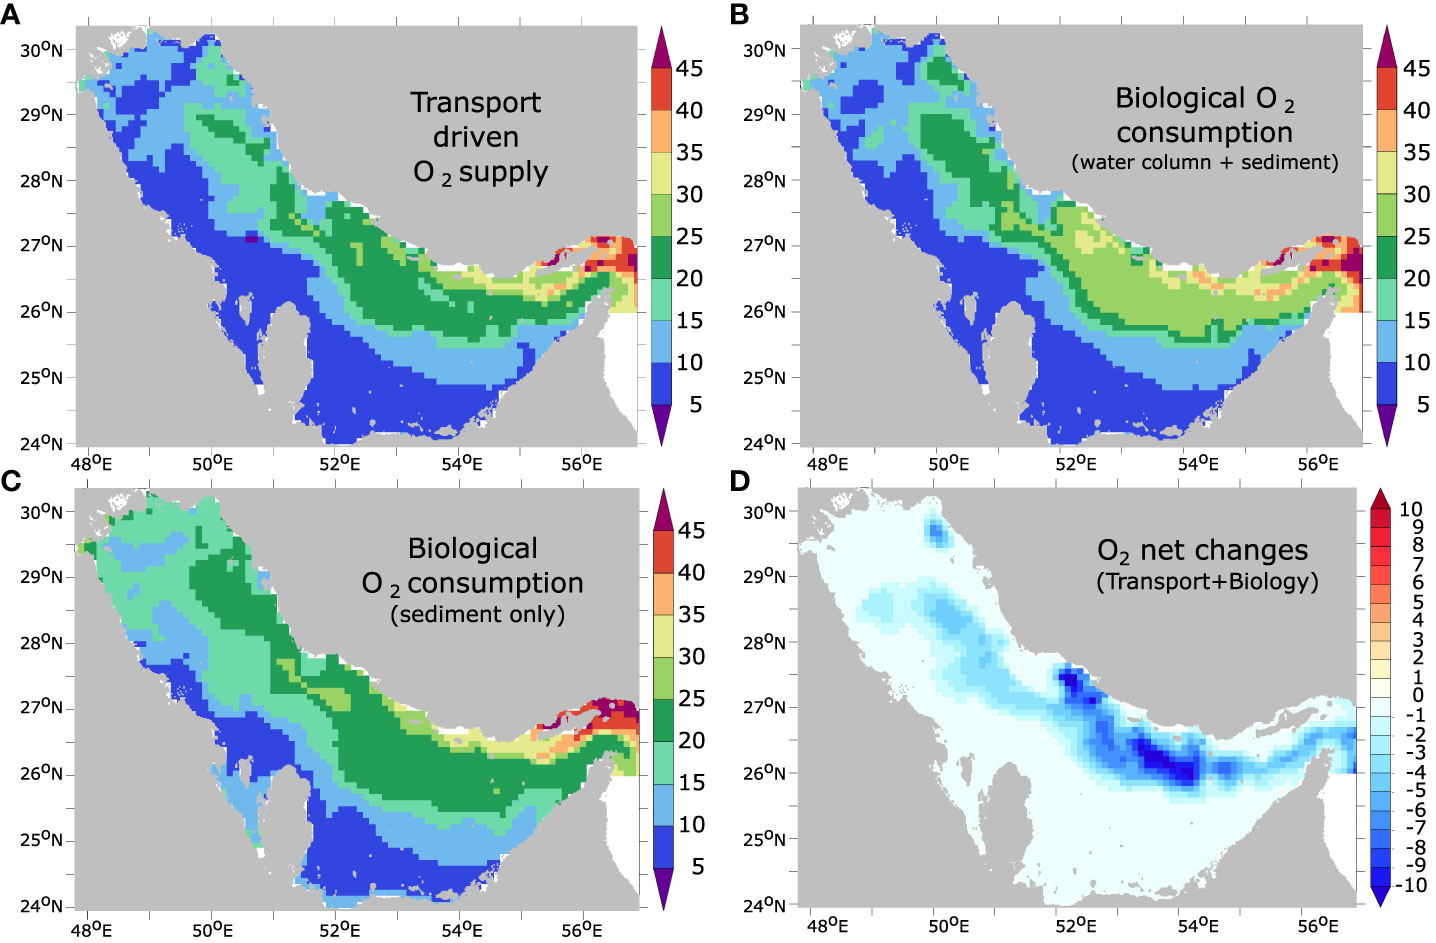
Figure 8 Near-bottom O2 budget between 1982 and 2010. Cumulative O2 supply due to transport (in Gmol) (A) and cumulative O2 sink due to biological consumption in the water column and the sediment (B) and in the sediment-only (C) (in Gmol N) integrated over the study period in the deepest (bottom) layer. (D) cumulative net O2 sources minus sinks (transport-biology) integrated over the study period in the bottom layer (in Gmol N).
The enhanced respiration in the Gulf is a direct consequence of productivity increase (locally reaching up to 20% of the mean production levels) over the study period (Figure 9). This increase in productivity can result from a weakening of the nutrient limitation or an increase in the temperature-dependent and light-limited phytoplankton growth rate. Examining these potential contributions, we find that most of the productivity enhancement reported here is associated with a stronger nutrient supply (fertilization) while the increase in phytoplankton growth rate (in response to water temperature increase) is playing a significant yet smaller role (Figure 9). The Gulf fertilization is indicative of an enhanced inflow of nutrients through the Strait of Hormuz as no other atmospheric or terrestrial sources of nutrients is considered in the study. To elucidate the mechanisms leading to such changes, we examine the evolution of total inorganic nitrogen (TIN) transport across the Strait of Hormuz as well as the long-term change in the Gulf water inflow (Figure 10). This analysis confirms that the transport of TIN into the Gulf substantially increased between the 1980s and the 2000s in the winter season during which nitrogen transport is largest. This is associated with enhanced surface inflow into the Gulf in winter (Figure 10). We hypothesize that this increase in the Gulf inflow is associated with the concurrent weakening of the winter northwesterly Shamal winds (Figure S13, SI) as a strong link between the Shamal winds and the strength of the cyclonic gyre in the southern Gulf (and hence the transport across the Strait of Hormuz) has been reported in previous studies (e.g., Thoppil and Hogan, 2010a; Pous et al., 2013). To test this hypothesis, we explore the sensitivity of the Gulf inflow of water and nutrients to changes in atmospheric conditions including changes in surface winds.
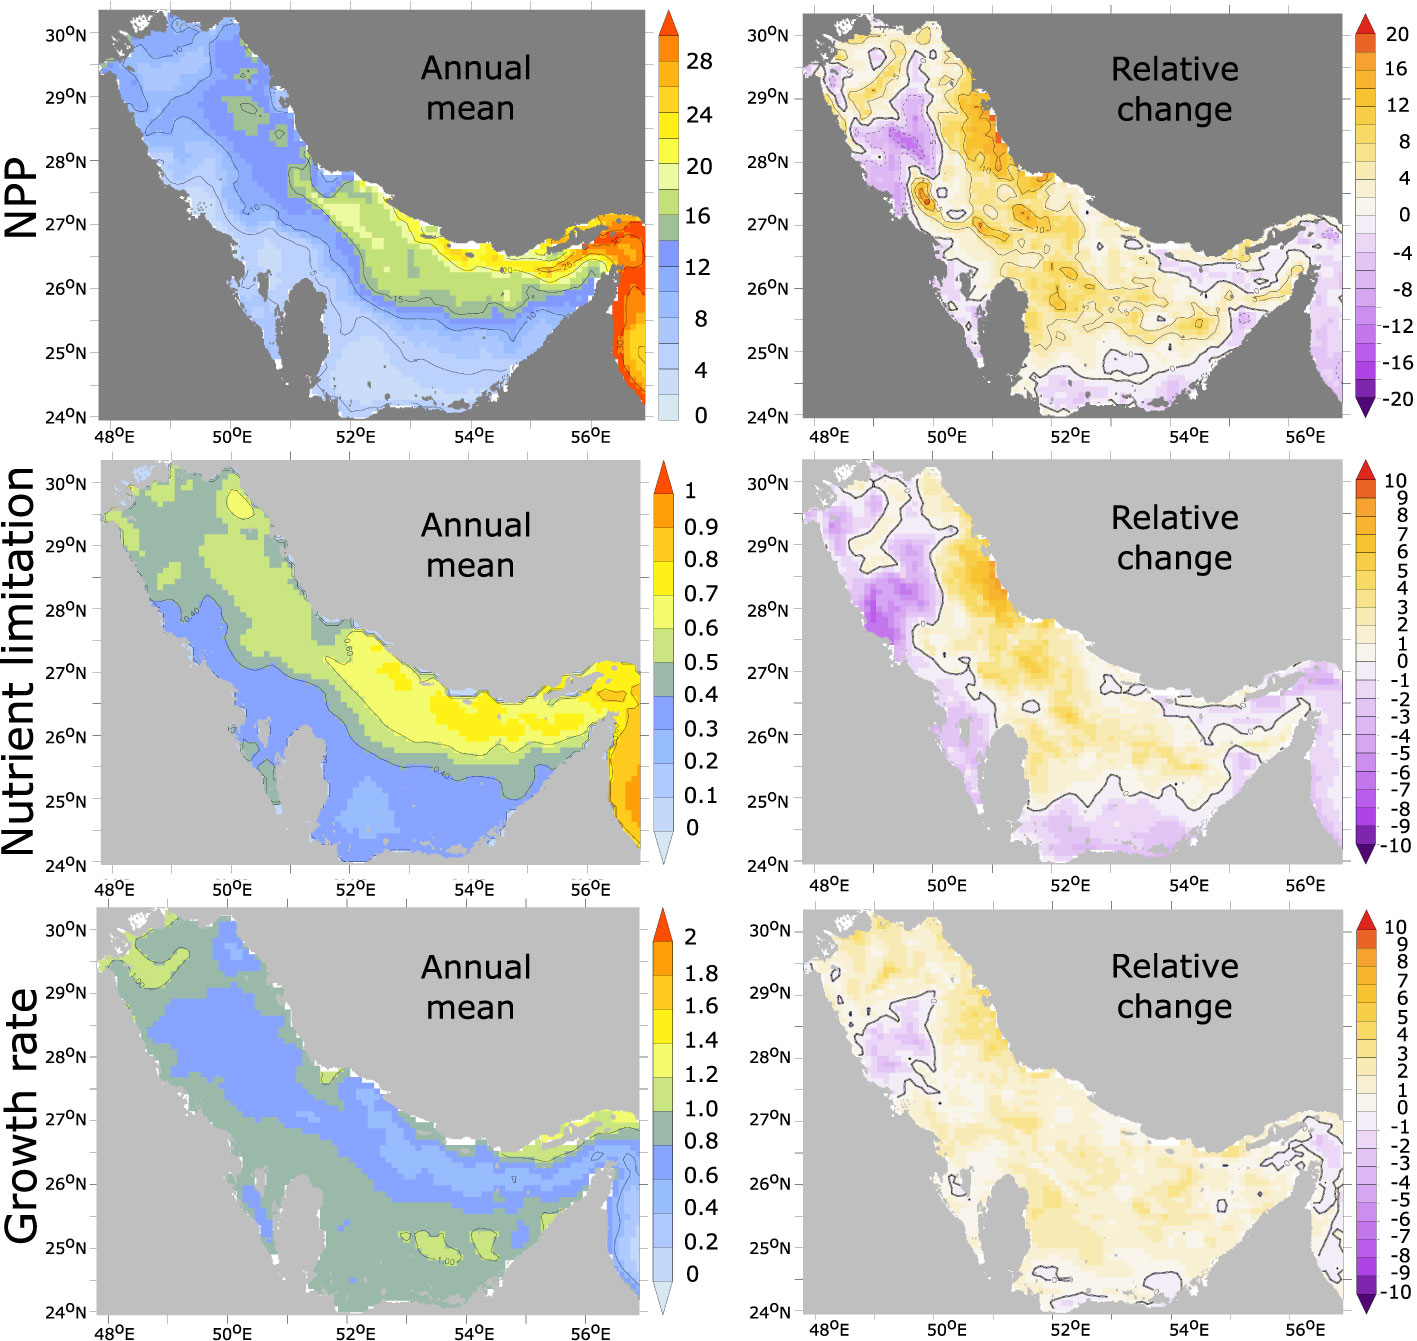
Figure 9 Net Primary Production (NPP) changes and its drivers. Net primary production (in mol C m-2 yr-1) (top), nutrient limitation factor γ (γ(, ) is a non-dimensional factor parameterized using Michaelis-Menten equation that varies between 0 (nutrient-depleted conditions) and 1 (nutrient-replete conditions)) (middle) and the temperature-dependent, light-limited phytoplankton growth rate (day-1) under nutrient replete conditions (bottom) in the early 1980s (left) and relative change (in %) between the early 1980s and the late 2000s (right).
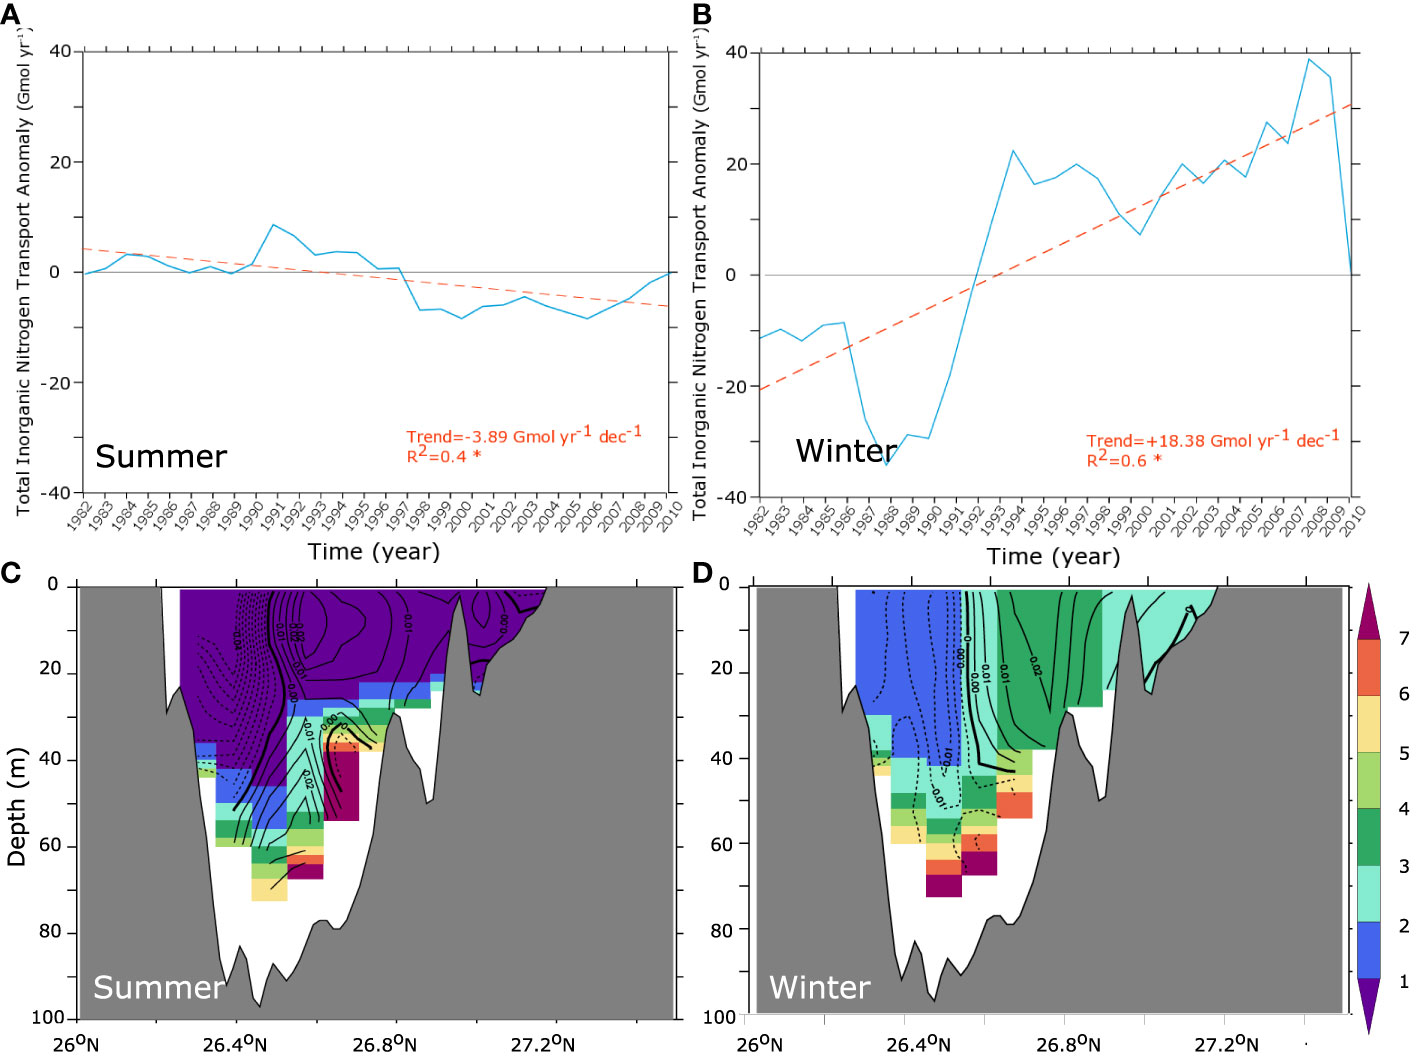
Figure 10 Changes in the Gulf nutrient inflow. (A, B) Cumulative anomalies of total transport of TIN across the Strait of Hormuz between 1982 and 2010 in the upper 40 m in summer (A) and winter (B) (trend lines are shown in orange). (C, D) Average TIN (color shading, in mmol m-3) and change in water velocities through the Strait of Hormuz (contour lines, in m s-1; inflow positive) between the early 1980s and the late 2000s in summer (C) and winter (D).
3.4 Role of changes in atmospheric conditions
In order to unravel the role of (i) wind changes, (ii) local warming and (iii) remote warming and O2 changes in the Arabian Sea in driving the Gulf O2 decline, we contrast the control run with three additional sensitivity simulations. More specifically, we identify the effect of wind changes on oxygen by contrasting the changes in the no-wind-change Swclim run to those in the control run. Similarly, contrasting the O2 changes in the no-Arabian Sea-warming simulation SAS_hclim to those in the control run allows us to measure the relative importance of the warming of the Arabian Sea to Gulf deoxygenation. As O2 changes in the northern Arabian Sea are non-significant in the SAS_hclim run [see Lachkar et al. (2021)], this comparison also reveals the importance (or the lack thereof) of deoxygenation trends in the Arabian Sea to the O2 decline in the Gulf. Finally, by comparing oxygen changes in the SAG_hclim (no Gulf warming) and the control run, we are able to measure the effect of local Gulf warming on oxygen changes and hypoxia expansion. This analysis confirms that changes in winds (weakening of Shamal winds) are responsible for most of the O2 decline at depth in the Gulf (Figures 11, 12), and therefore are the primary cause of near-bottom hypoxia expansion (Figure 13). Indeed, under climatological winds (i.e., Swclim) near-bottom O2 depletion is much weaker than in the control in both summer and autumn seasons (Figure 11). Additionally, no significant trends can be identified in either O2 content or hypoxic area in the absence of wind changes (Figures 12, 13). Contrasting O2 changes in the no-Arabian Sea-warming simulation SAS_hclim to those in the control run reveals very limited differences, except around the strait of Hormuz region and in the eastern Gulf where there is a weaker decline in O2 relative to the control (Figures 11, 12). The expansion of the hypoxic area is also only marginally weaker in the SAS_hclim run relative to the control (Figure 13). This indicates that while the warming of the Arabian Sea (and its deoxygenation) may slightly enhance O2 depletion in the eastern Gulf, it has a very limited impact on deoxygenation in the rest of the Gulf. The comparison of the SAG_hclim (no Gulf warming) and the control run reveals important differences near the sea surface with weaker O2 decrease in the upper 20 m in the absence of Gulf warming (Figure 11). However, O2 decline in the deep layers is comparable in the two simulations (Figures 11, 12). Furthermore, near-bottom hypoxia expansion is relatively similar in both simulations (Figure 13). We therefore conclude that while local warming of the Gulf leads to O2 loss in the near-surface due to reduced O2 solubility and outgassing, it has a relatively limited impact on deep O2 levels and contributes little to simulated bottom hypoxia expansion. Finally, contrasting changes simulated in the control run to those obtained under different atmospheric forcing scenarios further confirms that the Gulf fertilization is linked to surface wind changes (Figure S19). Indeed, in the absence of wind changes (i.e., Swclim), no increase in is observed in the Gulf (Figure S19). Additionally, in contrast to the control run and the sensitivity runs where surface winds do change (i.e., SAS_hclim and SAG_hclim) that show an increase in the surface water inflow through the Strait of Hormuz over the study period, no similar change is produced in the absence of wind changes (Figure S19).
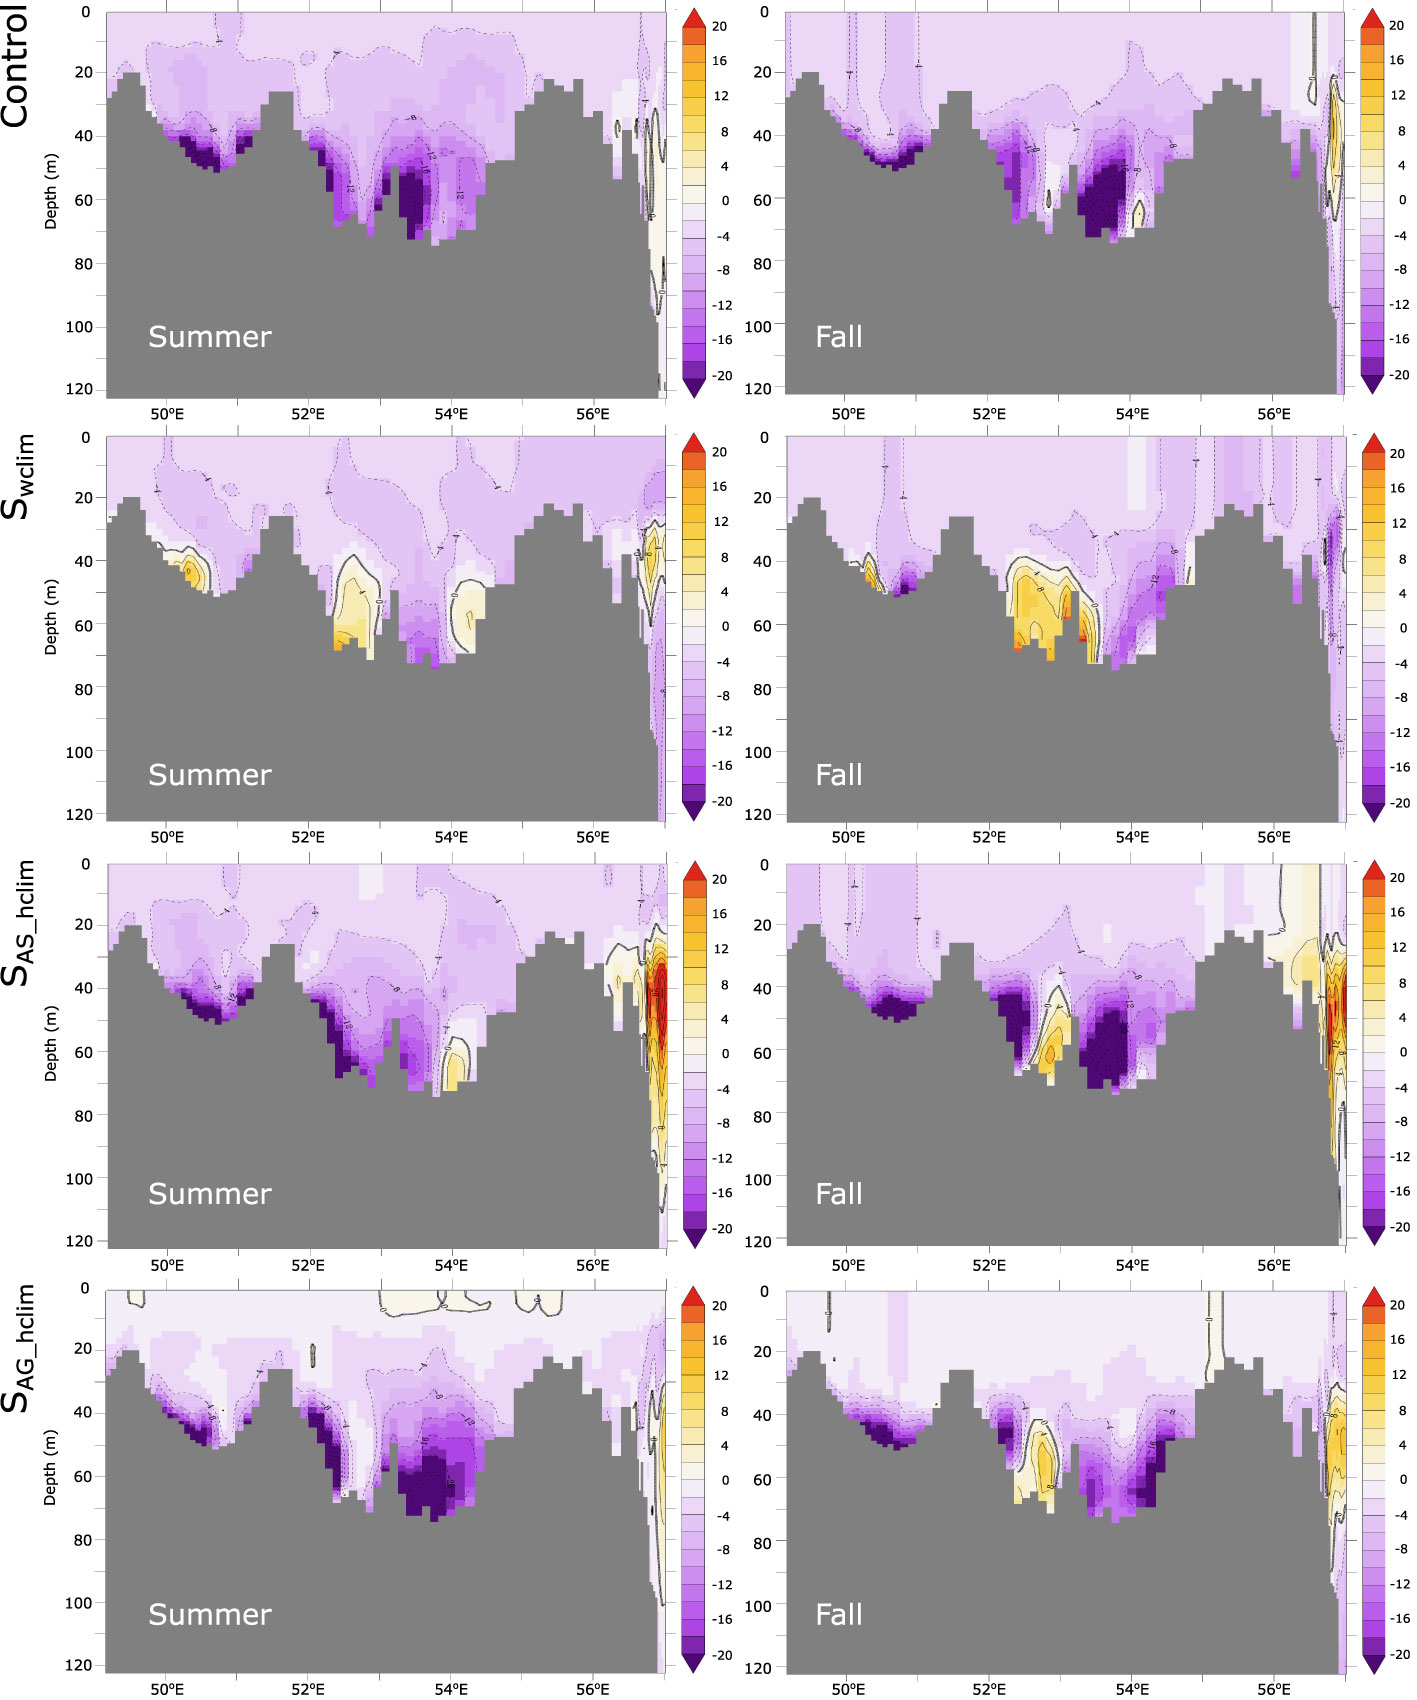
Figure 11 O2 changes along the Gulf axis in the control and under different atmospheric forcing scenarios. O2 changes between the early 1980s and the late 2000s along the Gulf axis (shown in Figure S1) in summer (left) and autumn (right) as simulated in the control (top), in absence of wind changes (i.e., Swclim) (row 2), in absence of warming over the Arabian Sea (i.e., SAS_hclim) (row 3) and in absence of Gulf warming (i.e., SAG_hclim) (bottom).
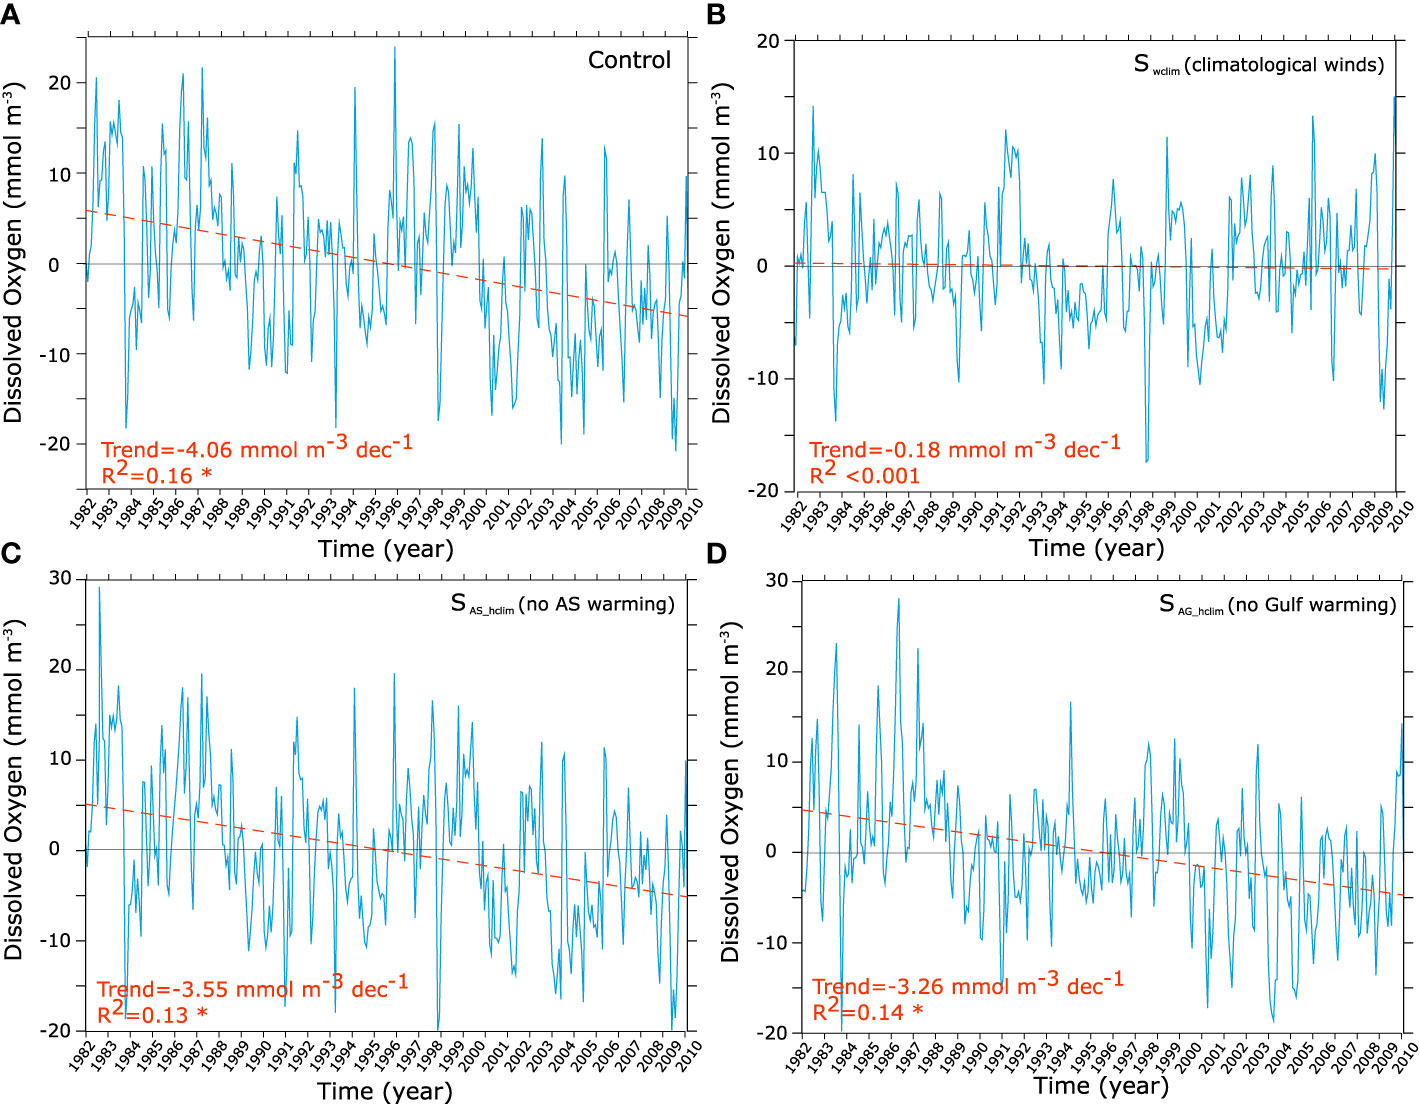
Figure 12 O2 trends in the control and under different atmospheric forcing scenarios. O2 interannual anomalies and trends in the deep Gulf (bathymetry > 40 m) as simulated in the control (A), in absence of wind changes (i.e., Swclim) (B), in absence of warming over the Arabian Sea (i.e., SAS_hclim) (C) and in absence of Gulf warming (i.e., SAG_hclim) (D).
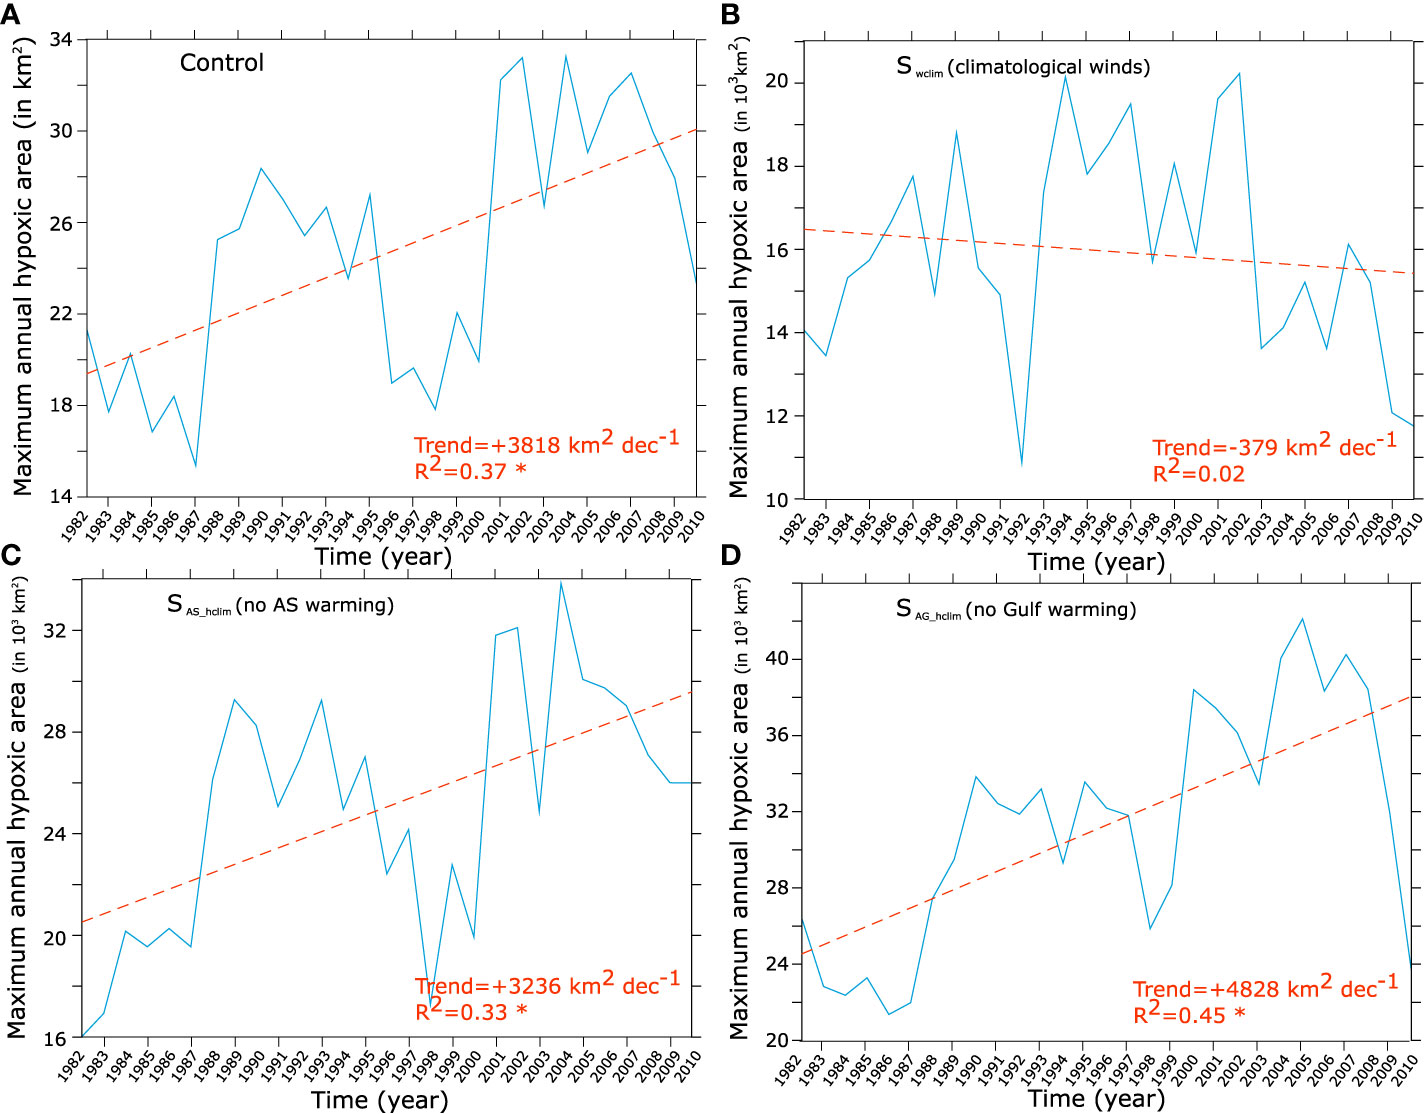
Figure 13 Evolution of the hypoxic area in the control and under different atmospheric forcing scenarios. Interannual anomalies and trends in bottom hypoxia annual maximum area (in 1000 km2) as simulated in the control (A), in absence of wind changes (i.e., Swclim) (B), in absence of warming over the Arabian Sea (i.e., SAS_hclim) (C) and in absence of Gulf warming (i.e., SAG_hclim) (D).
In summary, we simulate an important deoxygenation in the Gulf that causes the intensification and expansion of the seasonal near-bottom hypoxia in the deeper layers. Our analysis reveals that O2 decline is mostly driven by local warming near the sea surface and by the weakening of Shamal winds that enhances the Gulf fertilization in the winter. This results in increased production in the surface and enhanced respiration near and in the sediment, causing near-bottom oxygen depletion (Figure 14). Deoxygenation in the Arabian Sea appears to have limited impact on Gulf oxygen content, beyond amplifying O2 depletion in the eastern Gulf.
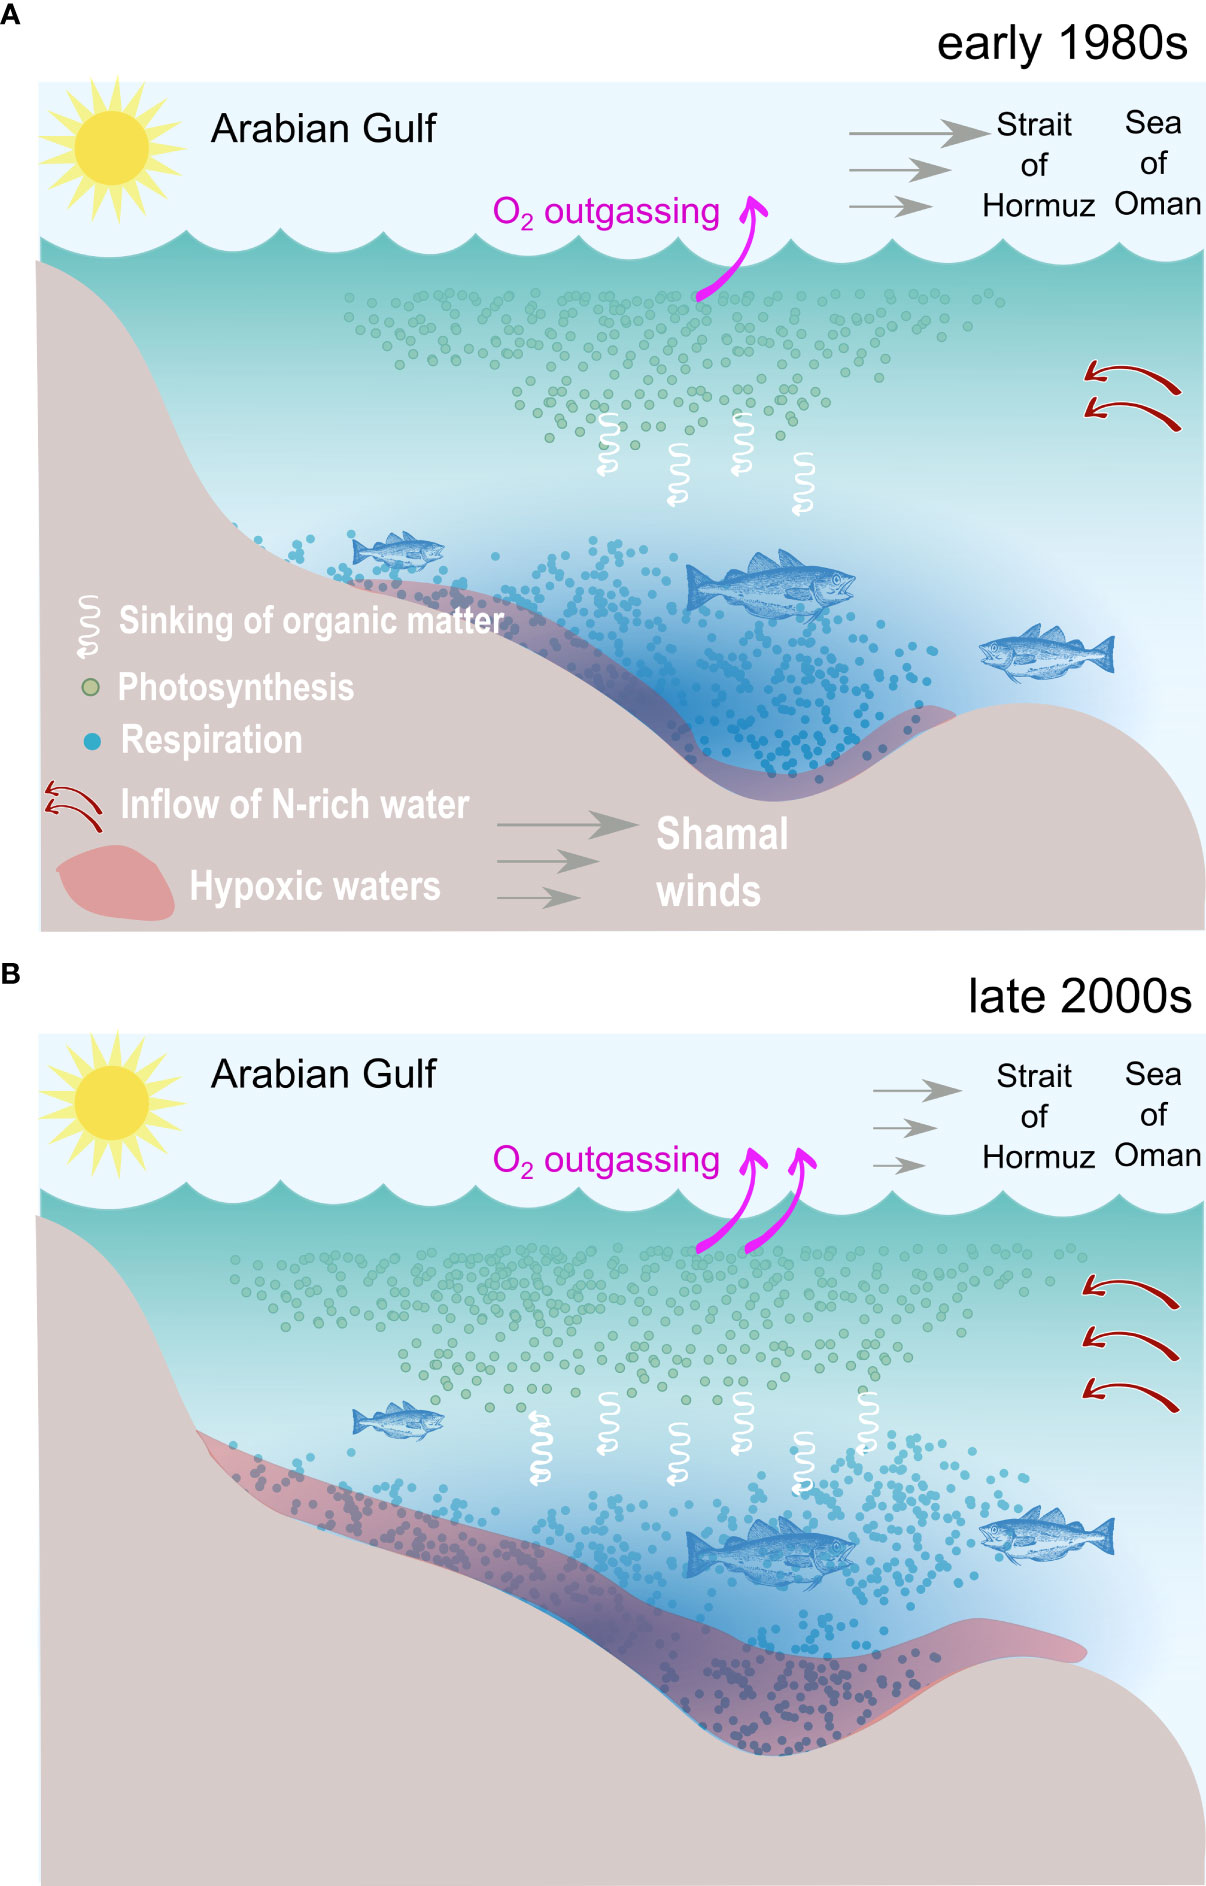
Figure 14 A schematic summarizing the main processes responsible for O2 depletion and near-bottom hypoxia expansion in the Gulf. (A) Conditions in the 1980s: relatively cool conditions favor strong O2 solubility in the seawater and weaker outgassing. Strong Shamal winds limit nutrient supply from the Arabian Sea in the winter season, thus limiting productivity and respiration at depth, resulting in restricted seasonal hypoxia near the bottom. (B) Conditions in the 2000s: warm conditions lower O2 solubility in the water and enhance outgassing. Weaker shamal winds favor enhanced nutrient supply from the Arabian Sea during winter. This, together with warming-induced increase in phtoplankton growth rates, enhances productivity and respiration at depth, resulting in an extended near-bottom hypoxia and compressed habitat for sensitive benthic and pelagic species.
4 Discussion
4.1 Comparison with previous works
Observational evidence suggests an expansion and intensification of near-bottom hypoxia in the Gulf (El Samra and El Gindy, 1990; Al-Ansari et al., 2015; Al-Yamani and Naqvi, 2019; Saleh et al., 2021). Al-Ansari et al. (2015) have estimated the area covered by hypoxic water in the central Gulf in summer to exceed 7,000 km2. However, this is likely an underestimation as this study was restricted to the Qatar exclusive economic zone. Saleh et al. (2021) have observed hypoxic waters in the western Gulf (November 2018) at depths exceeding 50 m and in the eastern Gulf at depths exceeding 75 m (December 2019). Assuming that hypoxia covered the entire seafloor of the Gulf at depths below 50 m in the western part and 75 m in the eastern part, these authors estimated the total area of the Gulf prone to bottom hypoxia in mid-autumn to potentially exceed 50,000 km2. Here, we report an increase of the hypoxic area from less than 20,000 km2 in the early 1980s to above 30,000 km2 in the 2000s. (Figure 4B). The discrepancy between the two hypoxia-prone area estimates may reflect an excessive extrapolation by Saleh et al. (2021) or stem from an underestimated bottom hypoxia in our model, potentially caused by the simulated weaker vertical stratification relative to observations.
Both Al-Ansari et al. (2015) and Saleh et al. (2021) reported high phosphate and nitrate concentrations in the bottom hypoxic waters, suggesting that bottom hypoxia is tightly related to enhanced remineralization in the benthos and near the seafloor. De Verneil et al. (2021) also reported that a substantial fraction of O2 consumption at a reef in the southern Gulf is associated with benthic respiration. These results are in agreement with our finding that O2 depletion near the bottom is mostly associated with the increase of remineralization in the sediment.
Al-Ansari et al. (2015) have speculated that summer hypoxia is driven by the fertilization of the Gulf in summer by the inflow of Indian Ocean surface water driven by summer monsoon winds. Our study shows the summer and autumn hypoxia in the Gulf is caused by the strong stratification prevailing during this period of the year, preventing O2 replenishment of the bottom waters combined with the persistent O2 consumption driven by year-long remineralization near the bottom and in the benthos. Additionally, our analysis also suggests that the Gulf fertilization is stronger in winter than summer because of the higher nutrient content of the Indian Ocean surface waters in winter. This is consistent with observations suggesting winter convective mixing in the northern Arabian Sea and the Sea of Oman to cause nutrient entrainment into the surface layer (Madhupratap et al., 1996; Naqvi et al., 2002). In contrast, summer Indian Ocean surface waters are more nutrient-depleted because of the stronger stratification and because upwelled waters along the southern coast of Oman do not enter the Sea of Oman (Naqvi et al., 2006).
Al-Said et al. (2018) reported elevated levels of total organic carbon (TOC) in the Kuwaiti waters between 2014 and 2016 linked to anthropogenic pollution. These authors have suggested that the recent expansion of hypoxia in the Gulf might be driven by increased O2 biological consumption associated with eutrophication. Our analysis also indicates that the intensification of the O2 depletion in the Gulf is primarily driven by enhanced respiration at depth. However, our results show that enhanced respiration in the Gulf is not necessarily driven by terrestrial pollution but can also be caused by larger scale changes in climatic factors.
Finally, using a combination of in-situ observations and modeling, Paparella et al. (2019) and Burt et al. (2019) have demonstrated that summer bottom temperature in the Gulf is tightly controlled by the intensity of evaporative cooling driven by Shamal winds. For instance, the two studies linked the dramatic warming of the sea bottom recorded in summer 2017 (that led to a severe coral bleaching event in the southern Gulf) to the absence of strong Shamal wind events in that particular summer. Our study sheds light on the role of weaker winter Shamal winds in the enhanced fertilization of the Gulf and hence the intensity of subsequent biological respiration and O2 depletion. A weakening of the summer Shamal winds as suggested by Figure S13 (SI) can contribute to further amplify O2 depletion at depth, as the lack of wind-driven evaporative cooling is likely to increase surface warming and stratification in the deeper part of the Gulf (causing a weaker O2 replenishment at depth) as well as lead to an increase in bottom temperature in the shallower Gulf (causing a decreased O2 saturation).
4.2 Implications
A recent study by De Verneil et al. (2021) reported the occurrence of bottom hypoxia at very shallow depths (∼ 4 m) off the coast of Abu Dhabi in the summer and early autumn of 2019. However, this consisted in short-lived (median 3 hours) night-time hypoxic episodes caused by overnight respiration consuming up most of the available dissolved O2. Our study shows that in the shallow portion of the Gulf, long-term changes in O2 are equally sensitive to declining O2 solubility (and increasing water temperatures) as to changes in O2 biological utilization. Therefore, it can be expected that further warming of the Gulf in the future may lead to an increase in the frequency and possibly the duration of these short-lived but recurrent hypoxic events, which is likely to have strong implications for marine organisms and sensitive ecosystems such as coral reefs, as well as for economically important sectors such as fisheries (De Verneil et al., 2021; Maltby et al., 2022).
The hypersaline dense Gulf waters sink to intermediate depths (200-300 m) when they enter the Arabian Sea and hence are essential to the ventilation of its OMZ (McCreary et al., 2013; Lachkar et al., 2019). It has been recently shown that the warming of the Gulf waters limits this ventilation, as the warmer and more buoyant Gulf waters spread at shallower depths in the Arabian Sea, thus leading to an intensification of the upper part of the OMZ (Lachkar et al., 2019). Al-Said et al. (2018) and Al-Yamani and Naqvi (2019) have speculated that an increase in the TOC content of the Gulf waters, driven by increasing levels of anthropogenic pollution or eutrophication in the Gulf, can ultimately lead to an intensification of the Arabian Sea OMZ. This is because the semi-labile fraction of the TOC can in principle survive during the transit of water in the Gulf and become available for decomposition once the Gulf waters exit the Hormuz Strait and are exported into the OMZ. Here we argue that declining O2 concentrations in the Gulf, driven by changes in the Gulf climate as shown here, may further amplify the intensification of the Arabian Sea OMZ. This is a potential additional mechanism (in addition to (i) the impact of Gulf warming on the Arabian Sea ventilation and (ii) the impact of pollution-driven increase in TOC levels) through which local changes in the Gulf physical and biogeochemical environment can affect the Arabian Sea OMZ.
O2 decline is only one among many stressors that the Gulf ecosystems have to deal with. Rapid warming and additional changes in pH (acidification), salinity (desalination) and nutrient load (eutrophication) are a few other examples of stressors that may further push these ecosystems closer to critical environmental thresholds (Le Quesne et al., 2021; Lincoln et al., 2021; Maltby et al., 2022). Moreover, these multiple stressors may interact in complex ways and lead to synergistic or antagonistic effects that cause a larger or a smaller impact on the organisms and ecosystems than when experienced in isolation. Understanding these interactions is key to narrowing down uncertainties around the impact of future climate change on the Gulf ecosystems and to devising effective mitigation strategies for conservation of sensitive species threatened by oxygen decline.
Finally, our study reveals that hypoxia in the Gulf is not only subject to strong seasonality but is also associated with a strong interannual variability. Therefore, improving our understanding of the dynamics of dissolved O2 in the Gulf and documenting its variability requires devising suitable observational strategies that help ensure a sufficient sampling in order to detect long-term changes. This can be achieved through deploying fixed oceanographic moorings that establish long time-series and ensure a continuous physical and biogeochemical monitoring of the Gulf region following successful examples from other subtropical systems such as the Bermuda Atlantic Time-series Study (BATS) in the western subtropical Atlantic or the European Station for Time series in the Ocean Canary Islands (ESTOC) in the subtropical Eastern Atlantic. Alternatively, devising an observational program that consists of collecting key observations along repeated transects at regular intervals of time and ideally during the hypoxic season (summer-autumn), may also provide a wealth of information on the processes responsible for O2 depletion in the Gulf, but also on the characteristics of hypoxia (e.g., intensity, frequency, duration, etc.) and its biogeochemical and ecological implications.
4.3 Caveats and limitations
Our study has a couple of caveats which include the limitations associated with the modeling setup. For instance, while the model horizontal resolution (1/10°deg) is 4 to 5 times smaller than the local Rossby deformation radius (Chelton et al., 1998), allowing to explicitly resolve most mesoscale eddies, it remains relatively coarse to represent the fine details of the geometry of the coastline and the seafloor bathymetry. Although previous modeling studies at comparable resolutions (e.g., Kämpf and Sadrinasab, 2006; Pous et al., 2015) have been shown to reproduce the essential characteristics of the circulation and hydrography of the Gulf, enhanced resolution may be needed to improve the realism of the local currents and the influence of mesoscale eddies on the mean circulation and mixing as well as to refine the representation of stratification (Pous et al., 2015; Lévy et al., 2022). An additional model related caveat pertains to the absence of external sources of nutrients either due to coastal pollution and eutrophication (Devlin et al., 2015) or via atmospheric dust deposition (Al-Yamani and Naqvi, 2019). The crude representation of microbial respiration in the model is another major model-related limitation. For instance, remineralization rates in the model are set to be constant, while laboratory studies suggest that the metabolism processes that are responsible for respiration are temperature-dependent (López-Urrutia et al., 2006). Although simplistic representations of microbial respiration are a common problem in most existing biogeochemical models (Laufkötter et al., 2017; Oschlies et al., 2018), additional work to enhance the realism of this key process in the model is needed to help reduce uncertainty around model simulated O2 trends in the region.
Second, our analysis reveals that the evolution of O2 in the Gulf is marked by a strong interannual and decadal variability. Therefore, the trends reported in this study may not necessarily be representative of the long term climate-change driven perturbation. Previous observations suggest that the natural variability in O2, dominated by interannual and decadal oscillations, can locally be stronger than the long-term trends associated with climate warming (e.g., Whitney et al., 2007). This is particularly true as productivity and O2 consumption in the Gulf are very sensitive to changes in water exchange through the Strait of Hormuz, which in turn is strongly sensitive to interannual variability in atmospheric fluxes (Pous et al., 2015).
The prescribed main changes in the atmospheric conditions, namely the Gulf warming and changes in Shamal winds are relatively robust features across different data-based products (Figure S9 and S13, S1). However, the simulated changes in productivity and nutrient supply to the Gulf remain to be confirmed by in-situ observations. In particular, repeated measurements of key physical parameters such as the intensity and structure of the water exchange through the Strait of Hormuz and important biological parameters such as chlorophyll and nutrient concentrations are essential to documenting ongoing changes and confirming the mechanisms described in our modeling study.
5 Summary and conclusions
We reconstruct the seasonal and interannual evolution of dissolved oxygen in the Gulf from 1982 through 2010 using an eddy-resolving hindcast simulation forced with ERA-Interim atmospheric reanalysis. We find that O2 remains close to saturation near the surface. In contrast, a strong O2 depletion develops at depth in the central Gulf and results into a widespread seasonal near-bottom hypoxia that reaches its maximum spatial extent in the mid-autumn. This is mostly caused by the combination of strong year-long benthic respiration and strong vertical stratification from spring to autumn that prevents O2 replenishment to deep waters. The study of the long-term O2 trends reveals a significant deoxygenation of the Gulf with O2 inventories dropping by nearly 3% and near-bottom O2 decreasing by between 10 and 30 mmol m-3 in the deeper part of the Gulf over the 29 year study period. This results in an important expansion of the area covered by hypoxic waters at a statistically significant rate of 3,818 km2 per decade. The expansion of hypoxia is accompanied by an increase in its severity as well as a lengthening of its season with hypoxia emerging 1 to 2 months earlier in the late 2000s relative to the early 1980s. Furthermore, declining near-bottom O2 levels result in the expansion of suboxic conditions (O2< 4 mmol m-3), leading to almost doubling denitrification rates in the Gulf over the study period. An O2 budget analysis reveals that deoxygenation in the Gulf is essentially caused by reduced solubility near the surface and enhanced respiration near the bottom and in the benthos. While decreased oxygen solubility is a direct consequence of the fast warming of the Gulf waters, enhanced productivity and respiration at depth is driven, in addition to warming, by increased nutrient supply from the Arabian Sea through the Strait of Hormuz during winter. The analysis of a set of sensitivity experiments that consisted in altering the atmospheric forcing to disentangle the role of local and remote warming as well as to isolate the contribution of wind changes has confirmed that O2 decrease near the surface is caused by local Gulf warming whereas the depletion of O2 near the bottom is associated with the weakening of winter Shamal winds, causing a strengthening of the inflow of nutrient-rich waters into the Gulf and hence increased productivity and respiration near the bottom. This analysis has also revealed that the remote warming of the Arabian Sea (and the intensification of the OMZ this has caused) had limited impact on O2 in the central Gulf. Our findings suggest that changes in local climate are deeply altering the Gulf physical and biogeochemical environment with potentially profound implications for the ecosystems and the fisheries of the region.
Data availability statement
The raw data supporting the conclusions of this article will be made available by the authors, without undue reservation.
Code availability: the model code can be accessed online at http://www.croco-ocean.org/.
Author contributions
ZL conceived and designed the study. MM performed the simulations. ZL carried out the model output analysis and wrote the manuscript with contributions from MM, ML, FP and JB. All authors contributed to the article and approved the submitted version.
Funding
Support for this research has come from the Arabian Center for Climate and Environmental Sciences (ACCESS), through the New York University Abu Dhabi (NYUAD) Research Institute Grant CG009. JB and FP were supported by Tamkeen through research grant GC009 to the Arabian Center for Climate and Environmental Sciences and, respectively, research grant CG007 to the NYUAD Water Research Center and research grant CG002 to the NYUAD SITE Research Center; their support is greatly appreciated.
Acknowledgments
Computations were performed at the High Performance cluster (HPC) of NYUAD, Dalma. We thank the NYUAD HPC team for technical support. The authors are also grateful to John Patrick Dunne, Helga Do Rosario Gomes, Heiner Dietze and Muchamad Al Azhar for their constructive comments that helped improve the paper.
Conflict of interest
The authors declare that the research was conducted in the absence of any commercial or financial relationships that could be construed as a potential conflict of interest.
The reviewer MA declared a past co-authorship with several of the authors ZL, MM, and ML to the handling Editor.
Publisher’s note
All claims expressed in this article are solely those of the authors and do not necessarily represent those of their affiliated organizations, or those of the publisher, the editors and the reviewers. Any product that may be evaluated in this article, or claim that may be made by its manufacturer, is not guaranteed or endorsed by the publisher.
Supplementary material
The Supplementary Material for this article can be found online at: https://www.frontiersin.org/articles/10.3389/fmars.2022.891378/full#supplementary-material
References
Ahmad F., Sultan S. (1991). Annual mean surface heat fluxes in the Arabian gulf and the net heat transport through the strait of Hormuz. Atmosphere-Ocean 29, 54–61. doi: 10.1080/07055900.1991.9649392
Al-Ansari E. M., Rowe G., Abdel-Moati M., Yigiterhan O., Al-Maslamani I., Al-Yafei M., et al. (2015). Hypoxia in the central Arabian gulf exclusive economic zone (EEZ) of Qatar during summer season Vol. 159 (Estuarine: Coastal and Shelf Science), 60–68.
Al Azhar M., Temimi M., Zhao J., Ghedira H. (2016). Modeling of circulation in the a rabian G ulf and the s ea of O man: Skill assessment and seasonal thermohaline structure. J. Geophysical Res.: Oceans 121, 1700–1720. doi: 10.1002/2015JC011038
Alessi C. A., Hunt H. D., Bower A. S. (1999). “Hydrographic data from the US naval oceanographic office: Persian gulf, southern red Sea, and Arabian Sea 1923-1996,” in WOODS HOLE OCEANOGRAPHIC INSTITUTION MA.
Al-Naimi N., Raitsos D. E., Ben-Hamadou R., Soliman Y. (2017). Evaluation of satellite retrievals of chlorophyll-a in the Arabian gulf. Remote Sens. 9, 301. doi: 10.3390/rs9030301
Alosairi Y., Imberger J., Falconer R. A. (2011). Mixing and flushing in the Persian gulf (Arabian gulf). J. Geophysical Res.: Oceans 116, 116. doi: 10.1029/2010JC006769
Al-Rasady I. H., Meeuwig J. J., Claereboudt M. R. (2021). “Influence of climate-driven low oxygen zones on fish biodiversity: A case study from the Arabian Sea,” in The Arabian seas: Biodiversity, environmental challenges and conservation measures. Eds. Jawad L. A. (Cham:Springer). 701–717. doi: 10.1007/978-3-030-51506-5_29
Al-Said T., Naqvi S., Al-Yamani F., Goncharov A., Fernandes L. (2018). Potential impact of human-induced physico-chemical changes in the Arabian gulf on the oxygen minimum zone of the northwestern Indian ocean. Mar. Poll. Bull. 129, 35–42. doi: 10.1016/j.marpolbul.2018.02.013
Al-Shehhi M. R., Song H., Scott J., Marshall J. (2021). Water mass transformation and overturning circulation in the Arabian gulf. J. Phys. Oceanography 51, 3513–3527. doi: 10.1175/JPO-D-20-0249.1
Al-Yamani F., Naqvi S. (2019). Chemical oceanography of the Arabian gulf. Deep Sea Res. Part II: Topical Stud. Oceanography 161, 72–80. doi: 10.1016/j.dsr2.2018.10.003
Barnier B., Siefridt L., Marchesiello P. (1995). Thermal forcing for a global ocean circulation model using a three-year climatology of ECMWF analyses. J. Mar. Syst. 6, 363–380. doi: 10.1016/0924-7963(94)00034-9
Brewer P. G., Dyrssen D. (1985). Chemical oceanography of the Persian gulf. Prog. Oceanography 14, 41–55. doi: 10.1016/0079-6611(85)90004-7
Burt J. A. (2014). The environmental costs of coastal urbanization in the Arabian gulf. City 18, 760–770. doi: 10.1080/13604813.2014.962889
Burt J. A., Paparella F., Al-Mansoori N., Al-Mansoori A., Al-Jailani H. (2019). Causes and consequences of the 2017 coral bleaching event in the southern Persian/Arabian gulf. Coral Reefs 38, 567–589. doi: 10.1007/s00338-019-01767-y
Carton J. A., Giese B. S. (2008). A reanalysis of ocean climate using simple ocean data assimilation (SODA). Monthly weather review 136, 2999–3017. doi: 10.1175/2007MWR1978.1
Chao S.-Y., Kao T. W., Al-Hajri K. R. (1992). A numerical investigation of circulation in the Arabian gulf. J. Geophysical Res.: Oceans 97, 11 219–11 236. doi: 10.1029/92JC00841
Chelton D. B., DeSzoeke R. A., Schlax M. G., El Naggar K., Siwertz N. (1998). Geographical variability of the first baroclinic rossby radius of deformation. J. Phys. Oceanography 28, 433–460. doi: 10.1175/1520-0485(1998)028<0433:GVOTFB>2.0.CO;2
De Verneil A., Burt J. A., Mitchell M., Paparella F. (2021). Summer oxygen dynamics on a southern Arabian gulf coral reef. Front. Mar. Sci. 8, 1676. doi: 10.3389/fmars.2021.781428
Devlin M., Massoud M., Hamid S., Al-Zaidan A., Al-Sarawi H., Al-Enezi M., et al. (2015). Changes in the water quality conditions of kuwait’s marine waters: Long term impacts of nutrient enrichment. Mar. pollut. Bull. 100, 607–620. doi: 10.1016/j.marpolbul.2015.10.022
El Samra E., El Gindy A. (1990). Vertical distribution and inter-relations of oxygen and nutrients in the Arabian gulf and the gulf of Oman in summer. Qatar University Scientific Bulletin 10, 445–64
Garcia H. E., Boyer T. P., Locarnini R. A., Antonov J. I., Mishonov A. V., Baranova O. K., et al. (2013a). “World ocean atlas 2013, volume 3: dissolved oxygen, apparent oxygen utilization, and oxygen saturation,” in NOAA Atlas NESDIS, vol. 75. Eds. Levitus S., Mishonov A. (Silver Spring, MD: NOAA).
Garcia H. E., Gordon L. I. (1992). Oxygen solubility in seawater: Better fitting equations. Limnol. Oceanography 37, 1307–1312. doi: 10.4319/lo.1992.37.6.1307
Garcia H. E., Locarnini R. A., Boyer T. P., Antonov J. I., Baranova O. K., Zweng M. M., et al. (2013b). “World ocean atlas 2013, volume 4: dissolved inorganic nutrients (phosphate, nitrate, silicate),” in NOAA Atlas NESDIS, vol. 76. Eds Levitus S., Mishonov A.. (Silver Spring, MD: NOAA).
Grasshoff K. (1975). The hydrochemistry of landlocked basins and fjords. Chem. Oceanography 2, 455–597.
Grasshoff K. (1976). Review of hydrographic and productivity conditions in the gulf region. Mar. Sci. 26, 39–62.
Gruber N., Frenzel H., Doney S. C., Marchesiello P., McWilliams J. C., Moisan J. R., et al. (2006). Eddy-resolving simulation of plankton ecosystem dynamics in the California current system. Deep Sea Res. Part I: Oceanographic Res. Papers 53, 1483–1516. doi: 10.1016/j.dsr.2006.06.005
Hashimoto S., Tsujimoto R., Maeda M., Ishimaru T., Yoshida J., Takasu Y., et al. (1998). “Distribution of nutrient, nitrous oxide and chlorophyll a of RSA: extremely high ratios of nitrite to nitrate in whole water column,” in Offshore environment of the ROPME Sea area after the war-related oil spill: Results of the 1993–94 umitaka-maru cruises (Tokyo: Terra Sci), 99–124.
Hughes D. J., Alderdice R., Cooney C., Kühl M., Pernice M., Voolstra C. R., et al. (2020). Coral reef survival under accelerating ocean deoxygenation. Nat. Climate Change 10, 296–307. doi: 10.1038/s41558-020-0737-9
Johnson M. D., Scott J. J., Leray M., Lucey N., Bravo L. M. R., Wied W. L., et al. (2021). Rapid ecosystem-scale consequences of acute deoxygenation on a Caribbean coral reef. Nat. Commun. 12, 1–12. doi: 10.1038/s41467-021-24777-3
Johns W., Yao F., Olson D., Josey S., Grist J., Smeed D. (2003). Observations of seasonal exchange through the straits of Hormuz and the inferred heat and freshwater budgets of the Persian gulf. J. Geophys Res., 108, 3391. doi: 10.1029/2003JC001881
Kämpf J., Sadrinasab M. (2006). The circulation of the Persian gulf: a numerical study. Ocean Sci. 2, 27–41. doi: 10.5194/os-2-27-2006
Lachkar Z., Lévy M., Smith K. (2019). Strong intensification of the Arabian Sea oxygen minimum zone in response to Arabian gulf warming. Geophysical Res. Lett. 46, 5420–5429. doi: 10.1029/2018GL081631
Lachkar Z., Mehari M., Al Azhar M., Lévy M., Smith S. (2021). Fast local warming is the main driver of recent deoxygenation in the northern Arabian Sea. Biogeosciences 18, 5831–5849. doi: 10.5194/bg-18-5831-2021
Lachkar Z., Smith S., Lévy M., Pauluis O. (2016). Eddies reduce denitrification and compress habitats in the Arabian Sea. Geophysical Res. Lett. 43, 9148–9156. doi: 10.1002/2016GL069876
Laffoley D. D., Baxter J. (2019). Ocean deoxygenation: Everyone’s problem-causes, impacts, consequences and solutions (Gland, Switzerland: IUCN). doi: 10.2305/IUCN.CH.2019.13.en
Large W. G., Yeager S. G. (2004). Diurnal to decadal global forcing for ocean and sea-ice models: The data sets and flux climatologies (No. NCAR/TN-460+STR). University Corporation for Atmospheric Research. doi: 10.5065/D6KK98Q6
Laufkötter C., John J. G., Stock C. A., Dunne J. P. (2017). Temperature and oxygen dependence of the remineralization of organic matter. Global Biogeochemical Cycles 31, 1038–1050. doi: 10.1002/2017GB005643
Le Quesne W., Fernand L., Ali T., Andres O., Antonpoulou M., Burt J., et al. (2021). Is the development of desalination compatible with sustainable development of the Arabian gulf? Mar. pollut. Bull. 173, 112 940. doi: 10.1016/j.marpolbul.2021.112940
Lévy M., Resplandy L., Palter J. B., Couespel D., Lachkar Z. (2022). “The crucial contribution of mixing to present and future ocean oxygen distribution,” in Ocean mixing (Elsevier), 329–344. doi: 10.1016/B978-0-12-821512-8.00020-7
Lincoln S., Buckley P., Howes E. L., Maltby K. M., Pinnegar J. K., Ali T. S., et al. (2021). A regional review of marine and coastal impacts of climate change on the ROPME sea area. Sustainability 13, 13 810. doi: 10.3390/su132413810
López-Urrutia Á., San Martin E., Harris R. P., Irigoien X. (2006). Scaling the metabolic balance of the oceans. Proc. Natl. Acad. Sci. 103, 8739–8744. doi: 10.1073/pnas.0601137103
Madhupratap M., Kumar S. P., Bhattathiri P., Kumar M. D., Raghukumar S., Nair K., et al. (1996). Mechanism of the biological response to winter cooling in the northeastern Arabian Sea. Nature 384, 549–552. doi: 10.1038/384549a0
Maltby K., Howes E., Lincoln S., Pinnegar J., Buckley P., Ali T., et al. (2022). Marine climate change risks to biodiversity and society in the ROPME Sea area. Climate Risk Manage. 35, 100411. doi: 10.1016/j.crm.2022.100411
McCreary J. P., Yu Z., Hood R. R., Vinaychandran P., Furue R., Ishida A., et al. (2013). Dynamics of the Indian-ocean oxygen minimum zones. Prog. Oceanography 112, 15–37. doi: 10.1016/j.pocean.2013.03.002
McIlwain J. L., Harvey E. S., Grove S., Shiell G., Al Oufi H., Jardani A. L. N. (2011). Seasonal changes in a deep-water fish assemblage in response to monsoon-generated upwelling events. Fisheries Oceanography 20, 497–516. doi: 10.1111/j.1365-2419.2011.00598.x
Naqvi S. (2021). Deoxygenation in marginal seas of the Indian ocean. Front. Mar. Sci. 88. doi: 10.3389/fmars.2021.624322
Naqvi S., Narvekar P., Desa E. (2006). Coastal biogeochemical processes in the North Indian Ocean The Sea vol. 14. Eds. Robinson A., Brink K (Harvard University Press) 723–80.
Naqvi S., Sarma V., Jayakumar D. (2002). Carbon cycling in the northern Arabian Sea during the northeast monsoon: Significance of salps. Mar. Ecol. Prog. Ser. 226, 35–44. doi: 10.3354/meps226035
Naser H. A. (2014). Marine ecosystem diversity in the Arabian gulf: Threats and conservation, biodiversity–the dynamic balance of the planet. Ed. Grillo O. London:IntechOpen. doi: 10.5772/57015
Oschlies A., Brandt P., Stramma L., Schmidtko S. (2018). Drivers and mechanisms of ocean deoxygenation. Nat. Geosci. 11, 467–473. doi: 10.1038/s41561-018-0152-2
Paparella F., Xu C., Vaughan G. O., Burt J. A. (2019). Coral bleaching in the Persian/Arabian gulf is modulated by summer winds. Front. Mar. Sci. 6, 205. doi: 10.3389/fmars.2019.00205
Pous S., Carton X., Lazure P. (2004). Hydrology and circulation in the strait of Hormuz and the gulf of Oman–results from the GOGP99 experiment: 2. Gulf of Oman. J. Geophys Res., 109, C12038. doi: 10.1029/2003JC002146
Pous S., Carton X. J., Lazure P. (2013). A process study of the wind-induced circulation in the Persian gulf. Open J. Mar. Sci. 3, 27 160. doi: 10.4236/ojms.2013.31001
Pous S., Lazure P., Carton X. (2015). A model of the general circulation in the Persian gulf and in the strait of Hormuz: Intraseasonal to interannual variability. Continental Shelf Res. 94, 55–70. doi: 10.1016/j.csr.2014.12.008
Rabalais N. N., Turner R. E., Wiseman J. W.J. (2002). Gulf of Mexico hypoxia, aka “The dead zone”. Annual Review of Ecology and Systematics 33, 235–263. doi: 10.1146/annurev.ecolsys.33.010802.150513
Reynolds R. M. (1993). Physical oceanography of the gulf, strait of Hormuz, and the gulf of Oman–results from the Mt Mitchell expedition. Mar. pollut. Bull. 27, 35–59. doi: 10.1016/0025-326X(93)90007-7
Saleh A., Abtahi B., Mirzaei N., Chen C.-T. A., Ershadifar H., Ghaemi M., et al. (2021). Hypoxia in the Persian gulf and the strait of Hormuz. Mar. pollut. Bull. 167, 112 354. doi: 10.1016/j.marpolbul.2021.112354
Shchepetkin A. F., McWilliams J. C. (2005). The regional oceanic modeling system (ROMS): a split-explicit, free-surface, topography-following-coordinate oceanic model. Ocean Model. 9, 347–404. doi: 10.1016/j.ocemod.2004.08.002
Sheppard C., Al-Husiani M., Al-Jamali F., Al-Yamani F., Baldwin R., Bishop J., et al. (2010). The gulf: A young sea in decline. Mar. pollut. Bull. 60, 13–38. doi: 10.1016/j.marpolbul.2009.10.017
Strong A. E., Liu G., Skirving W., Eakin C. M. (2011). NOAA’s coral reef watch program from satellite observations. Ann. GIS 17, 83–92. doi: 10.1080/19475683.2011.576266
Swift S. A., Bower A. S. (2003). Formation and circulation of dense water in the Persian/Arabian gulf. J. Geophysical Res.: Oceans 108, 4–1. doi: 10.1029/2002JC001360
Thoppil P. G., Hogan P. J. (2010a). “Persian Gulf response to a wintertime shamal wind event,” in Deep Sea research part I: Oceanographic research papers, vol. 57 (8), 946–955. doi: 10.1016/j.dsr.2010.03.002
Thoppil P. G., Hogan P. J. (2010b). A modeling study of circulation and eddies in the Persian gulf. J. Phys. Oceanography 40, 2122–2134. doi: 10.1175/2010JPO4227.1
Vaquer-Sunyer R., Duarte C. M. (2008). Thresholds of hypoxia for marine biodiversity. Proc. Natl. Acad. Sci. 105, 15 452–15 457. doi: 10.1073/pnas.0803833105
Vaughan G. O., Al-Mansoori N., Burt J. A. (2019). “The arabian gulf,” in World seas: An environmental evaluation), volume 2: the Indian Ocean to the Pacific (Elsevier) 1–23. doi: 10.1016/B978-0-08-100853-9.00001-4
Whitney F. A., Freeland H. J., Robert M. (2007). Persistently declining oxygen levels in the interior waters of the eastern subarctic pacific. Prog. Oceanography 75, 179–199. doi: 10.1016/j.pocean.2007.08.007
Yao F., Johns W. E. (2010a). A HYCOM modeling study of the Persian gulf: 1. model configurations and surface circulation. J. Geophysical Res.: Oceans 115, C11017. doi: 10.1029/2009JC005781
Keywords: ocean deoxygenation, Arabian (Persian) Gulf, marine hypoxia, climate change, marine biogeochemical ecosystem model, ocean warming, semi-enclosed seas
Citation: Lachkar Z, Mehari M, Lévy M, Paparella F and Burt JA (2022) Recent expansion and intensification of hypoxia in the Arabian Gulf and its drivers. Front. Mar. Sci. 9:891378. doi: 10.3389/fmars.2022.891378
Received: 07 March 2022; Accepted: 04 August 2022;
Published: 07 September 2022.
Edited by:
Cosimo Solidoro, Istituto Nazionale di Oceanografia e di Geofisica Sperimentale, ItalyReviewed by:
John Patrick Dunne, Geophysical Fluid Dynamics Laboratory, Princeton University, United StatesHelga Do Rosario Gomes, Columbia University, United States
Heiner Dietze, Helmholtz Association of German Research Centres (HZ), Germany
Muchamad Al Azhar, Plymouth Marine Laboratory, United Kingdom
Copyright © 2022 Lachkar, Mehari, Lévy, Paparella and Burt. This is an open-access article distributed under the terms of the Creative Commons Attribution License (CC BY). The use, distribution or reproduction in other forums is permitted, provided the original author(s) and the copyright owner(s) are credited and that the original publication in this journal is cited, in accordance with accepted academic practice. No use, distribution or reproduction is permitted which does not comply with these terms.
*Correspondence: Zouhair Lachkar, zouhair.lachkar@nyu.edu