 Jordi Manuello1,2†
 Andrea Nani1,2,3†
 Enrico Premi4
 Barbara Borroni4
 Tommaso Costa1,2*
 Karina Tatu1,2
 Donato Liloia2
 Sergio Duca1
 Franco Cauda1,2
- 1GCS-fMRI, Department of Psychology, Koelliker Hospital, University of Turin, Turin, Italy
- 2FOCUS Laboratory, Department of Psychology, University of Turin, Turin, Italy
- 3Michael Trimble Neuropsychiatry Research Group, Birmingham and Solihull Mental Health NHS Foundation Trust, Birmingham, United Kingdom
- 4Neurology Unit, Department of Clinical and Experimental Sciences, University of Brescia, Brescia, Italy
Gray matter alterations are typical features of brain disorders. However, they do not impact on the brain randomly. Indeed, it has been suggested that neuropathological processes can selectively affect certain assemblies of neurons, which typically are at the center of crucial functional networks. Because of their topological centrality, these areas form a core set that is more likely to be affected by neuropathological processes. In order to identify and study the pattern formed by brain alterations in patients’ with Alzheimer’s disease (AD), we devised an innovative meta-analytic method for analyzing voxel-based morphometry data. This methodology enabled us to discover that in AD gray matter alterations do not occur randomly across the brain but, on the contrary, follow identifiable patterns of distribution. This alteration pattern exhibits a network-like structure composed of coaltered areas that can be defined as coatrophy network. Within the coatrophy network of AD, we were able to further identify a core subnetwork of coaltered areas that includes the left hippocampus, left and right amygdalae, right parahippocampal gyrus, and right temporal inferior gyrus. In virtue of their network centrality, these brain areas can be thought of as pathoconnectivity hubs.
Introduction
Widespread alterations of gray matter commonly characterize brain disorders. It has been suggested that neuropathological processes can selectively affect certain assemblies of neurons (1), which typically are at the center of crucial functional networks (1–7). Because of their topological centrality, these areas or network hubs form a core set that is more likely to be affected by neuropathological processes (1, 8–16). In particular, neurodegenerative diseases exhibit structural alterations that seem to distribute across the brain in network-like patterns (17, 18). These patterns, which we propose to call morphometric coalteration networks or, in the case of gray matter decreases, coatrophy networks, can be thought of as a form of pathological anatomical covariance (19, 20) and appear to develop according to the organization of brain connectivity (3, 4, 7). Studies aiming to investigate the networks formed by coaltered cerebral areas in the pathological brain are providing new insight for a better transdiagnostic and neurobiological understanding of the mechanisms at the root of brain disorders (21–23).
This is particularly true in the case of Alzheimer’s disease (AD). So far great efforts have been made in order to identify a prototypical pattern of gray matter atrophy due to AD, and to put it into correlation with clinical symptoms (24). It is now known that cortical thinning of specific brain sites can be already detected even before the appearance of the symptomatology and that the atrophy tends to increase when the condition worsens (25). Although the cortical reduction is commonly found in normal aging (26, 27), the pathological fingerprints of AD are mainly observed in a temporoparietal set of brain areas, including hippocampus, entorhinal cortex, precuneus, and posterior cingulate cortex (28, 29). The involvement of these regions has been repeatedly confirmed by meta-analytical studies, which have additionally found the alteration of the right superior frontal gyrus (30). According to Ferreira et al. (31) the left medial temporal lobe is the most impaired area in AD, even in the preclinical phases of the disease, so much so that the impairment of this area can be a good predictor of the clinical worsening of AD. A study of the relationship between the cortical thinning in AD and large-scale structural organization of the brain has revealed that AD reduces both the nodal centrality of temporal and parietal heteromodal association cortices and the positive correlation of thickness values normally found bilaterally between the parietal regions. In contrast, authors reported an increase of positive correlation among brain areas that are part of the default mode network (DMN) (32).
Recently, investigations into the cognitive deficits caused by AD have taken advantage of the methodology of network analysis (33, 34). According to this approach, altered brain areas can be represented by means of a set of nodes, linked together by means of edges representing different statistical values. Studies in this line of research have found that AD increases the correlation between the values of cortical thickness of the fusiform gyrus, temporal pole, parahippocampal gyrus, and cingulum, which are all in proximity to each other. Conversely, a decrease of the correlation has been observed between distant areas (35). Of note, it has been suggested that, by combining different sources of information: (i) large-scale structural networks data, (ii) values of cortical thickness, and (iii) the pace of cortical thinning along time, it could be possible to distinguish patients with AD from healthy controls with an accuracy of 96.1%, as well as predict the conversion of mild cognitive impairment (MCI) into AD 6 months before its clinical onset (36). These studies raise the issue of moving from group analysis to single-subject results, which is an essential aspect when dealing with potential biomarkers for diagnostic purposes and surrogate endpoints for disease-modifying clinical trials. Recent methods of single-subject graph measurements have allowed to link network alterations and cognitive decline. For instance, it has been showed that the more the network becomes disorganized, the worse the clinical condition is (37). Moreover, even in healthy subjects, it has been found an association between Aβ42 CSF low levels and alteration of network properties, which might be interpreted as a very early indication of an underlying pathological process (38). All these results provide evidence that the approach based on network analysis can bring valuable insight to clinical practice (33).
So far, at least four important mechanisms have been proposed to account for the distribution of brain alterations: transneuronal spread, nodal stress, shared vulnerability, and trophic failure (4, 5).
The first mechanism suggests that misfolded proteins (native peptides with an incomplete or incorrect folding, as well as de novo polypeptides that become prone to self-aggregation) can diffuse along neuronal pathways (18, 39–41). Increasing evidence indicate that the spread of misfolded proteins presents several similarities to the plasma membrane prion protein intercellular transfer, along axonal fibers, potentially contributing to disease progression (42). This mechanism has been demonstrated in neurodegenerative diseases, such as Alzheimer’s, Parkinson’s, Huntington’s, amyotrophic lateral sclerosis, and tauopathies (43, 44); more recently it has been also generalized to other brain disorders (45).
The second mechanism hypothesizes that the functional stress of the network hubs may result in a greater vulnerability of these areas (1, 4, 14, 46). This susceptibility has been supported in human beings with in vivo neuroimaging techniques and voxel-based meta-analyses (14).
The third mechanism suggests that certain brain regions sharing gene or protein expressions may be more vulnerable to neuropathology (4, 47–51), with a potential relationship between gene expressions and connectivity patterns (51, 52).
Finally, the fourth mechanism hypothesizes a disruption in the production of trophic factors, which could bring about the deterioration of neural wiring (4, 5, 53, 54).
If we consider the case of AD, neuropathological signatures, namely amyloid-β (Aβ) plaques and neurofibrillary tangles, are already present in the preclinical phase of the disease, with further spreading during progression. In fact several years before the clinical onset of AD, Aβ, and tau progressively accumulate in the brain with a certain degree of spatial specificity as well as a partial overlap among the two deposits (55). The relationship between tau and amyloid deposits in the cerebral cortex seems to have a hierarchical organization, with tau and Aβ clusters exhibiting distinctive intramodal and intermodal characterizations (56). These findings would support the view of AD as an amyloid-facilitated tauopathy (57). Furthermore, Aβ and tau propagation and the subsequent deposition and cytotoxicity effects appear to occur mainly between anatomically interconnected areas, thus affecting the functional communication among them (58).
The concept of a gradual spread of pathological signs is a crucial aspect put forward by recent theoretical models. Raj et al. (3) have proposed a network diffusion model of disease progression in dementia, according to which the propagation of pathogenic proteins follows the regional concentration gradients under the spatial constraints defined by brain connectivity. Other authors have proposed a stochastic epidemic spreading model to describe intra-brain Aβ propagation and deposition processes, according to which regions with a higher connectivity degree are the main target of Aβ, thus suggesting that brain hubs are the more exposed to the negative effects of these aberrant proteins (40). Finally, in addition to focusing on misfolded proteins and propagation pathways, a further interesting approach suggests the need to investigate the relationship between these two factors (18). This model considers molecular nexopathies as conjunctions of pathogenic protein and brain networks. Key factors are therefore supposed to be structural/functional developmental factors and differential vulnerability of neural connections. Accordingly, long-range axonal connections may be more vulnerable to Aβ, so that functional and structural alterations could occur within the large-scale distributed frontotemporoparietal network, such as the one that supports the DMN processing.
In order to identify and study the coatrophy network of AD, we devised an innovative meta-analytic method for analyzing voxel-based morphometry (VBM) data. This methodology enabled us to address the following issues:
a. How do gray matter alterations distribute across the brain affected by AD?
b. Is it possible to recognize a network-like structure in the pattern formed by these coaltered areas?
c. Can specific clusters of coaltered areas be identified within the coatrophy network of AD?
Materials and Methods
Selection of Studies
On March 2017, we performed with the software Sleuth an extensive meta-analytic search in the BrainMap VBM database (www.brainmap.org) (59–61). All the studies that fulfilled the following criteria were retrieved: “Contrast is Gray Matter”; “Context is Disease Effect”; “Observed Changes is Controls > Patients” and “Diagnosis is Alzheimer’s Disease.” Results were controlled so as to keep only experiments comparing subjects diagnosed with AD against healthy controls. Our search focused on gray matter decreased values only, as the development of AD is strongly characterized by axonal deterioration and neuronal loss that result in brain atrophy (62). Furthermore, thus far just a few VBM studies have investigated gray matter increase in AD, so that these data were not sufficient for obtaining reliable results with our meta-analytical methods.
To ensure a transparent description of the selection process, we followed the “PRISMA Statement” international guidelines (63, 64) (Figure S1 in Supplementary Material). The characteristics of the sample can be viewed in Table 1.
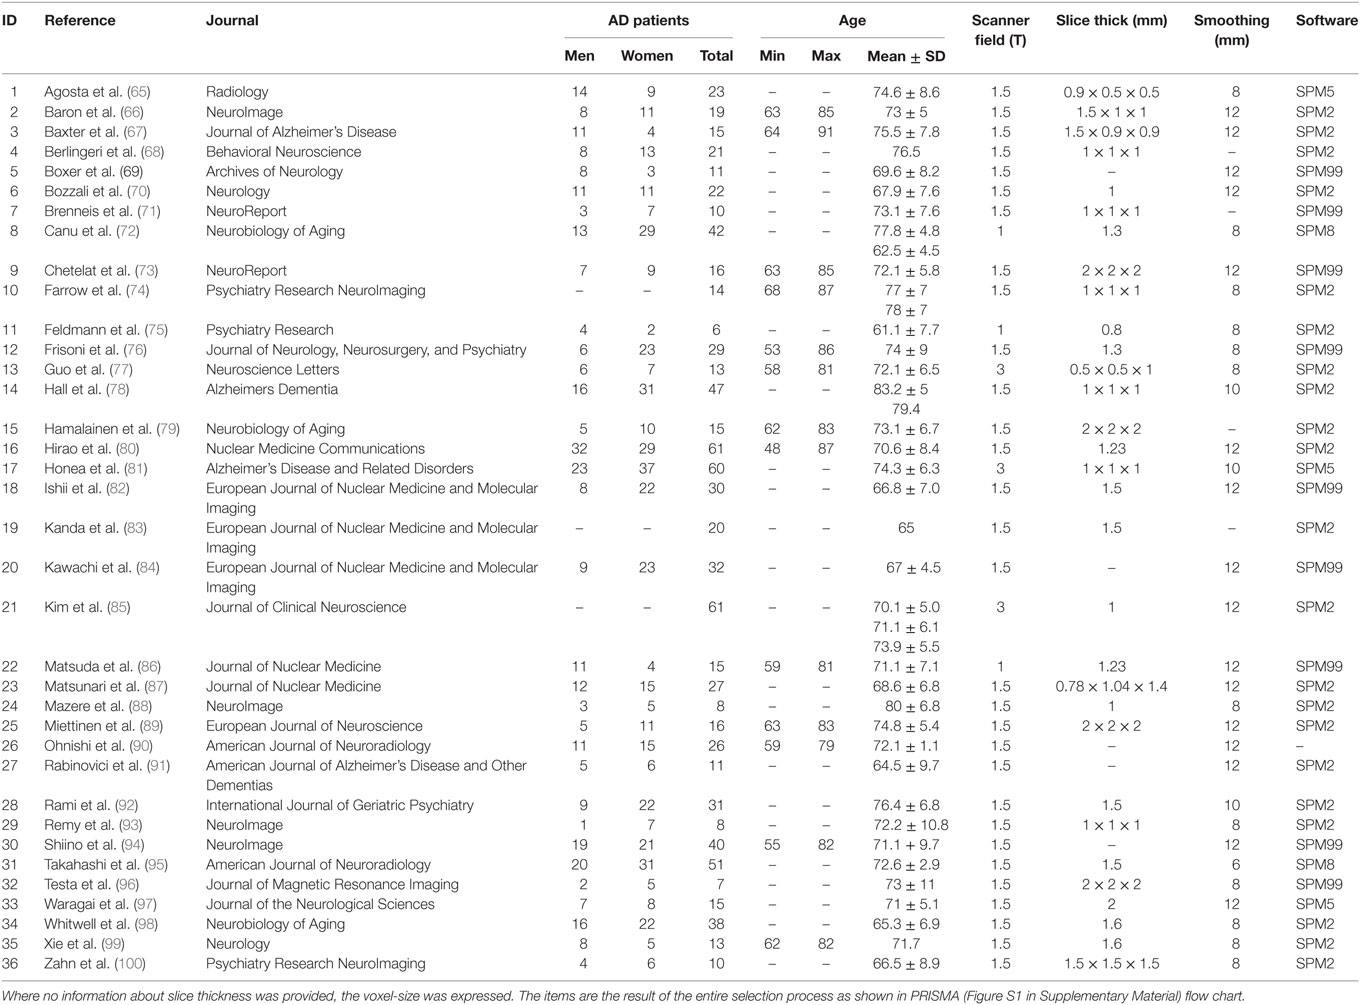
Table 1. Selected studies for the meta-analysis.
Anatomical Likelihood Estimation (ALE) and the Creation of Modeled Activation (MA) Maps
Voxel-based morphometry data were statistically elaborated with the procedure of the ALE. ALE is a voxel-based meta-analytical technique that models the spatial coherence of different results (101–103). A three-dimensional Gaussian probability distribution is then centered on each focus of every experiment, using the following formula:
in which d refers to the Euclidean distance between voxels and the considered focus, while e refers to the spatial uncertainty. The SD can be obtained by means of the full-width half-maximum, such as:
The combination of these Gaussian distributions constructs a MA map for each experiment. The definite ALE map is finally generated by uniting the MA maps. ALE maps were thresholded at a voxel-level FWD p < 0.05, in line with Eickhoff et al. (102, 104, 105). Given a specific threshold for cluster forming, a null distribution of cluster sizes was derived by simulating a long series of experiments with the same characteristics of real data and then by generating an ALE map. The score histogram so obtained was eventually employed to assign a threshold p-value.
Construction of the Morphometric Coatrophy Network
To identify the distribution of gray matter alterations, we have developed a novel methodology capable of constructing the morphometric coalteration networks associated with brain disorders. Our analysis can in fact discover whether an altered brain area, say A, is statistically related to the alteration of one or more other brain areas (B, C, etc.). Thus, our analysis can construct the morphometric coatrophy network composed of the areas occurring to be altered together and, subsequently, investigate within the coatrophy network (i) how an altered region is statistically associated with other altered regions and (ii) which regions are likely to be involved in a more widespread net of alterations.
Node Creation and Labeling
We superimposed the ALE map on the Talairach atlas so as to distinguish automatically the anatomical regions identified by the ALE algorithm. If (at least) 20 voxels of the ALE map were found to be inside a certain area of the atlas, then this area was considered to be altered. We chose this cluster threshold so that less relevant regions could be excluded. We employed a peak detection algorithm to identify the local maxima of the ALE map, and we subsequently selected only those peaks that were greater than the 90 percentile of the value distribution. This set was further reduced by applying a minimum interpeak distance of 10 mm. Finally, we positioned a node, labeled on the basis of the Talairach atlas, in correspondence of every survived peak.
Thresholding Values Applied during Nodes Creation and Their Rationale
As described in the previous paragraph, three thresholds were applied during the nodes creation procedure.
The first threshold regulates the minimum number of voxel (i.e., 20 voxels) necessary to consider a brain area as altered. The rationale behind this threshold is to exclude from the coatrophy network nodes representing minimally (or, from a meta-analytical point of view, rarely) altered brain areas, thus improving and simplifying the interpretability of the results without losing highly relevant information. However, even considering brain areas in which only one voxel is altered, the results would have not been spurious, since ALE maps were voxel-level thresholded, which implies that each single voxel contains statistically significant information (104) (see Figure S2 in Supplementary Material for the visualization of the network obtained with different threshold values). This choice, however, would have unnecessarily increased the complexity of the coatrophy network.
The second threshold, applied to the peaks-value distribution, allowed us to include in the network only nodes representing those areas for which there is a very high consensus between different experiments (i.e., high ALE value) (104). Even in this case, this threshold could have been removed; all the nodes that can be created with the present methodology represent statistically significant effects, since they can only lie inside the anatomical regions identified by the ALE algorithm, which already has its own statistical thresholding step (see Figure S3 in Supplementary Material for the visualization of the network obtained with different threshold values).
Finally, the interpeaks distance was chosen considering the mean value (10.2 mm; SD = 0.4 mm) of uncertainty in spatial location associated with the reported coordinate discussed in Eickhoff et al. (101).
Therefore, the only effect of those thresholds on our data is to decrease the redundancy of the network, so as to obtain clearer results to be visualized and further analyzed, minimizing the information loss.
Coatrophy Distribution
From the set of the nodes as defined in the previous paragraph, we constructed a N × M matrix or a coalteration matrix, in which each row referred to an experiment, whereas each column referred to a network node. On the basis of a Bernoulli generation data model, we constructed a probability distribution of joint alteration values for each pair of nodes. In other words, for any couple of nodes (a and b), we were able to describe their four conjoint states of alteration by means of two binary variables: (1) a and b both altered; (2) a and b both unaltered; (3) a altered and b unaltered; and (4) a unaltered and b altered. Consequently, the following four probabilities were obtained by the frequencies of the different combinations of all experiments:
These formulas refer to the conjoint frequencies of a couple of nodes (a and b) in all their four possible combinations. Table 2 shows the marginal probabilities for each couple of nodes.
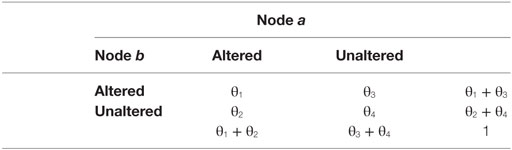
Table 2. Marginal probabilities between altered and unaltered nodes.
On the grounds of these four probabilities, we have applied the Patel’s k index (106)—which has been validated with simulated data by Smith et al. (107)—in order to calculate the degree of coalteration between nodes. This index can measure the probability that two nodes (a and b) are actually coaltered against the probability that node a and node b are altered independently of each other. Patel’s k is calculated as follows:
where
The numerator refers to the difference between the probability that a and b are altered together and the expected probability that a and b are altered independently of each other. The denominator refers to a weighted normalizing constant. Min (ϑ1) refers to the maximum value of the conjoint probability P(a,b), given P(a) and P(b), whereas max (ϑ1) refers to the minimum value of P(a,b), given P(a) and P(b). Patel’s k index has values that range from −1 to 1. A value of |k| that is close to 1 indicates a high degree of connectivity between nodes. The statistical significance of this index was assessed with a Monte Carlo algorithm that simulated a multinomial, generative model, which took into consideration the alteration of all nodes. This statistical procedure obtained an estimation of p(k|z) by sampling a Dirichlet distribution and by calculating the samples’ amount for which k > e, where e was the threshold of statistical significance set at p < 0.01.
Topological Analysis
We defined our system of interconnected nodes as a network of coatrophy areas and examined it with the network analyzer included in Cytoscape 3.5.1 (108, 109). We were therefore able to achieve a good and reliable description of the net formed by the coatrophy areas under both the aspects of brain structure and functional organization.
Node Degree and Edge Betweenness
The node degree was defined as the number of edges linked to a node. We employed this parameter in order to detect the nodes that were more connected within the network, which are commonly considered as brain hubs. In turn, the parameter of edge betweenness was defined as the number of the shortest routes that go through an edge in a graph or a network (110). Thus, edges exhibiting high values of betweenness are supposed to be involved in a large number of shortest routes, so that their elimination is likely to have an impact on communication between many couples of nodes.
Network Clustering
Given the great number of nodes as well as the high density of edges within the coatrophy network, we used the k-core decomposition algorithm (111, 112)–as it is implemented in the clusterMaker plugin for Cytoscape—to detect a central subnetwork of highly interconnected nodes. This algorithm eliminates all the nodes showing a degree that is lesser than a user-defined k, thus deriving from the original network the highest connected subgraph.
Results
Common Patterns of Morphometric Alterations
The ALE performed on all the data retrieved by our search (57 experiments, 883 subjects, and 691 foci) showed that gray matter alterations caused by AD are mainly located in the right medial frontal gyrus, the right inferior frontal gyrus, the left inferior parietal lobule, the right midcingulate gyrus, the left supramarginal gyrus, the right angular gyrus, the bilateral fusiform gyrus, the right precuneus, the bilateral insula, the right thalamus, the bilateral superior temporal gyrus, the bilateral superior temporal pole, the bilateral hippocampus, the bilateral parahippocampal gyrus, the bilateral amygdala, and the left caudate nucleus (Figure 1).
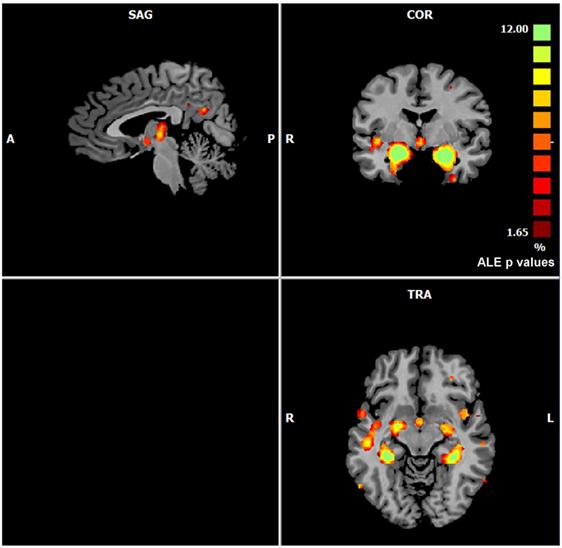
Figure 1. Gray matter anatomical likelihood estimation (ALE) results. The image summarizes the results of all the experiments considered in this meta-analysis. Colors from red to green show gray matter decreases [ALE maps were thresholded using voxel-level FWD p < 0.05 (104) and visualized using Brainvoyager QX].
Morphometric Coatrophy Network
The left panel of Figure 2 illustrates the 40 nodes used to build the coatrophy network, while the heat map in Figure 2 shows the relationship between the elements of each possible couple of nodes measured by Patel’s k index. Figure 3 illustrates the whole coatrophy network: the colors’ scale ranges from blue to red for the 146 edges and indicates an increase in k values. Edges are to be assumed as undirected.
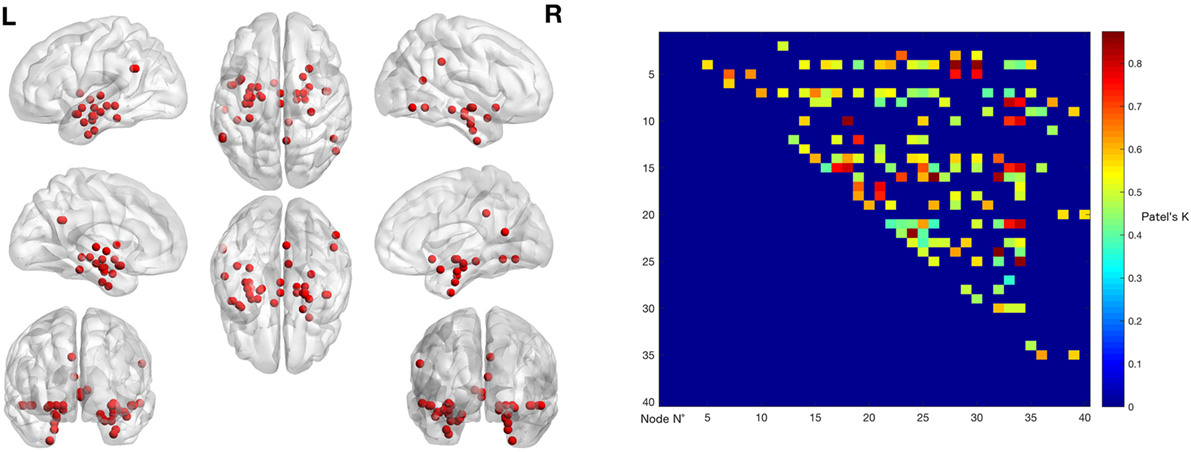
Figure 2. The left panels shows the nodes that entered the coatrophy calculation. The right panel shows the coatrophy matrix. Colors from blue to red indicate increasing Patel’s k values (i.e., increasing coalteration probabilities).
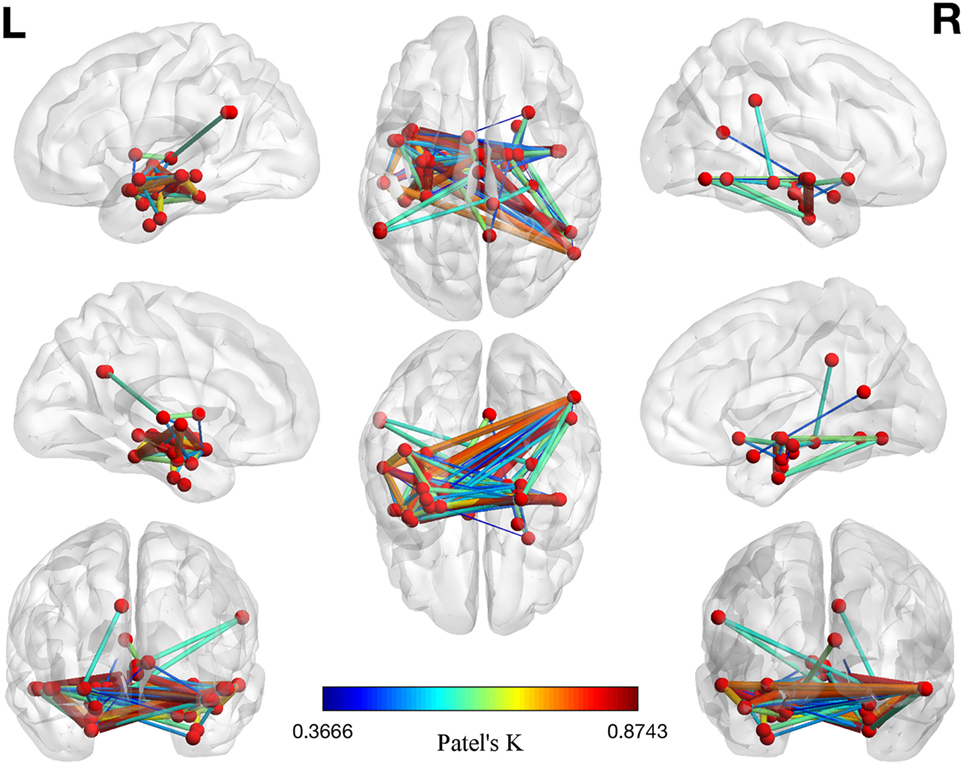
Figure 3. Morphometric coatrophy network results. Colors from blue to red indicate increasing Patel’s k values (i.e., increasing coalteration probabilities).
Many nodes densely interconnected characterize the temporal lobe, especially the hippocampus and the parahippocampal gyrus. In contrast, only one node characterizes other brain areas, such as the cingulate cortex and precuneus. Although all the edges that are shown are statistically significant, the ones with the highest k value are those involving the left hippocampus, bilateral amygdala, right parahippocampal gyrus, and right inferior temporal lobe (Tables S1 and S2 in Supplementary Material).
Figure 4 reports the organic option of the yFiles Layouts available in Cytoscape 3.5.1 (based on a spring-embedded algorithm) attributed to the coatrophy network. Thick links connect the nodes located in the temporal cortex, parahippocampal gyrus, amygdala, and thalamus. The right precuneus is connected to the rest of the network just through one edge projecting to the left hippocampus, whereas the right cingulate cortex is connected to the network core through the right hippocampus and the right parahippocampal gyrus. In Figure 4, colors and dimensions of nodes are proportional to their network degree values. In particular, Amyg_L_1 shows the highest degree value (17), followed by Temp_Inf_R (16). In turn, Fusiform_L, Amyg_L, Temp_Pole_Sup_R, SupraMarginal_L, and Cingulum_Mid_R exhibit the lowest degree value (1). The edges’ thickness is proportional to their degree of edge betweenness. The edge linking the nodes Hipp_R_2 and ParaHipp_R_2 shows the highest value, while the edge between Amyg_R and ParaHipp_L_1 shows the lowest one.
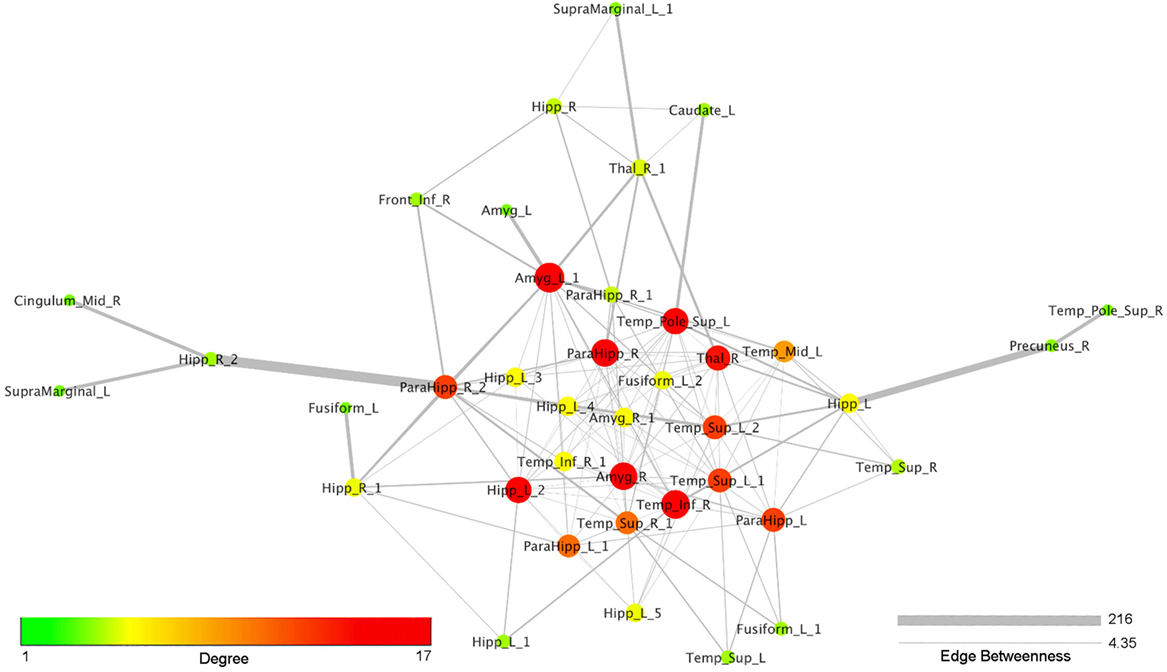
Figure 4. Topological analysis of the coatrophy network of Alzheimer’s disease (organic yFiles Layout). Colors and dimensions of nodes indicate their topological degree (smaller node = lower degree; from green to red = from lower to higher values). Thickness of edges indicate the degree of edge betweenness (smaller edge = lower degree).
Figure 5 shows the nodes according to their anatomical position. In order to simplify the visual interpretation, we have merged two or more nodes referring to the same brain area; however, we have kept the edges unchanged. It is worth noting that the coatrophy network of AD is composed of more interhemispheric (75) than intrahemispheric edges (71). Apart from the hippocampus, most of the inter-hemispheric connections link structures in the medial temporal lobes. Furthermore, unilateral nodes in the right inferior temporal gyrus and right precuneus are linked to areas of both hemispheres.
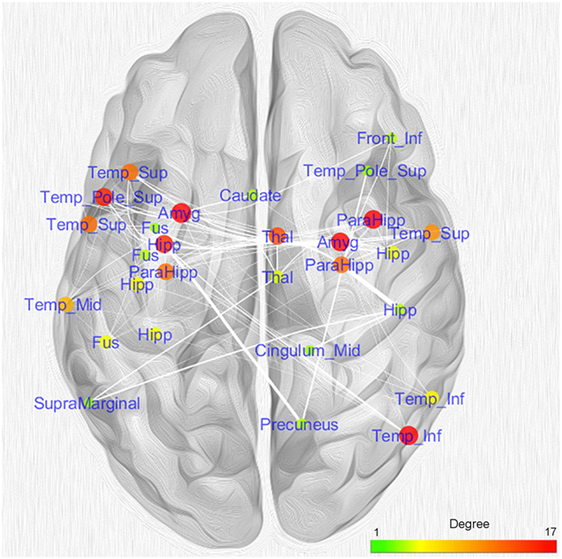
Figure 5. Topological analysis of the coatrophy network of Alzheimer’s disease. Nodes referring to the same brain areas or strictly close one to the other have been collapsed in a single node.
As many nodes populate the hippocampi, we projected them on a 2D template in order to better clarify their spatial localization (Figure 6). Five out of the six nodes in the left hippocampus were found to be located in the anterior part, while the remaining one was found to be located in the posterior section. In contrast, the right hippocampus exhibits a more uniform pattern, with two anterior nodes and one posterior.
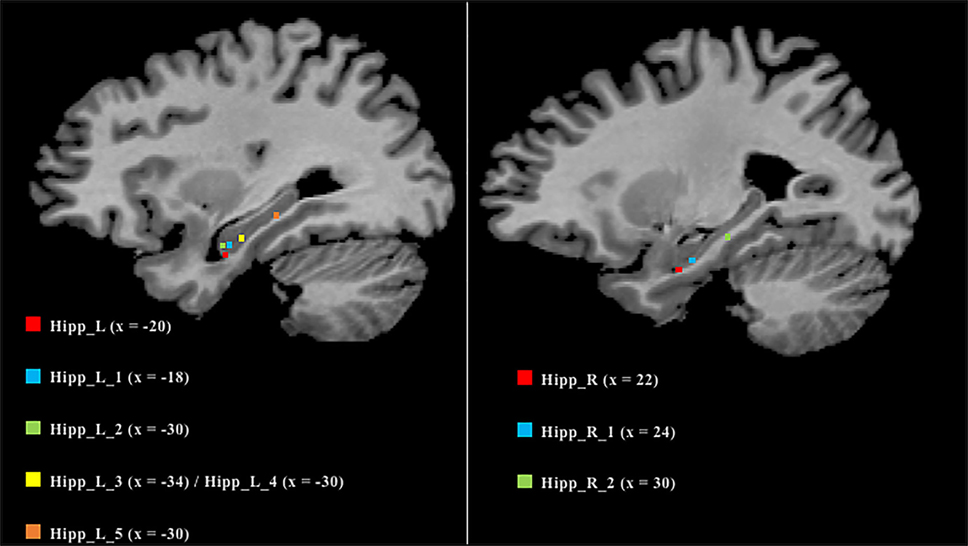
Figure 6. Anatomical localization of the nodes in the hippocampi. Coordinates refers to Talairach space (right sagittal slice x = 25, left x = 30). Nodes are numerically labeled according to a rostrocaudal criterion.
We also analyzed the connectivity profile of the hippocampi within the coatrophy network so as to better understand their relationship with the other nodes of the network (Figure 7). Even though hippocampi have a lot of connections, they are scarcely interconnected (red edges) and, in particular, between the nodes of the right hippocampus there are no direct paths linking them to each other. What is more, the left hippocampus presents a greater number of edges (45) than the right hippocampus (15); however, these edges are generally characterized by a low degree of edge betweenness. In contrast, the 15 edges linking the right hippocampus to the other nodes of the coatrophy network are characterized by a high degree of edge betweenness. Overall, considering the anatomical topology of nodes (Figure 6), the left anterior hippocampus appears to be the most densely connected.
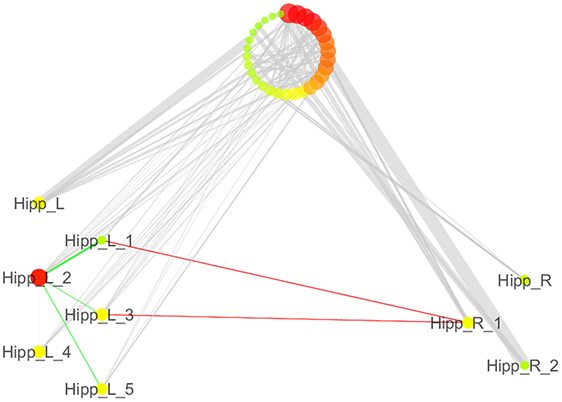
Figure 7. Detailed illustration of the role of the hippocampi in the coatrophy network of Alzheimer’s disease. Green edges are intrahemispheric, while red edges are interhemispheric.
Given the great number of nodes and the high density of edges of the coatrophy network, we used the k-core algorithm to identify the most connected components of the network. The analysis reported a core subnetwork formed by eight interhemispheric nodes (Figure 8), including the left and right amygdalae, left hippocampus, right parahippocampal gyrus, and right temporal inferior gyrus. The bilateral presence of nodes within this core subnetwork is consistent with the finding that the coatrophy network is characterized by a large number of interhemispheric edges.
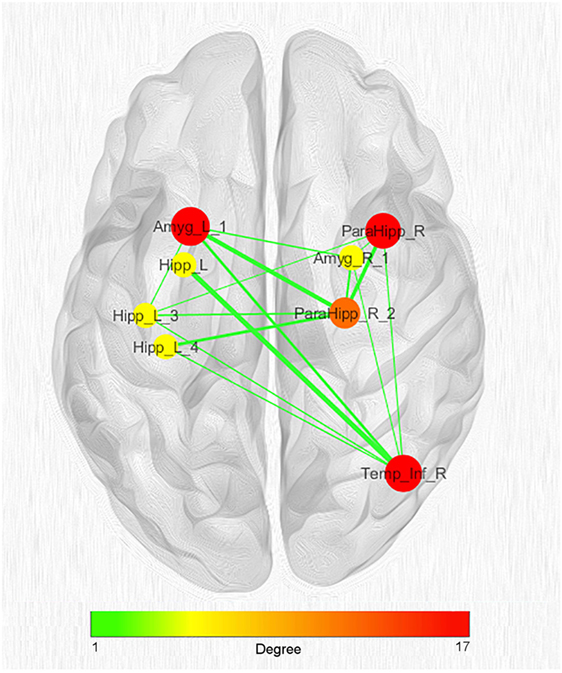
Figure 8. Network clustering with k-core decomposition algorithm. Colors and dimensions of nodes indicate their topological degree (smaller node = lower degree; from green to red = from lower to higher values). Thickness of edges indicate the degree of edge betweenness (smaller edge = lower degree). Both node degree and edge betweenness values refer to the original coatrophy network.
Discussion
With an innovative voxel-based meta-analytic method, this study aimed to find out whether gray matter decreases caused by AD distribute throughout specific and identifiable areas rather than affect randomly the whole brain. After constructing a morphometric coatrophy network, we intended to identify which brain areas are more likely to be altered in conjunction with other ones rather than alone. Finally, we examined the potential existence of relevant subcomponents within the coatrophy network.
The gray matter decreases evaluated by ALE involve limbic and temporal areas, in particular the hippocampus and parahippocampal gyrus. This finding is in accordance with most of previous research (30, 113). Nine out of 40 nodes of the coatrophy network are localized within the hippocampus. Specifically, six nodes are in the left hippocampus (five in its anterior part, one in its posterior part) and three in the right one (two anterior, one posterior). This is consistent with the neuropathological studies suggesting that AD is characterized by an earlier and greater involvement of anatomical structures (including hippocampus) in the left hemisphere (114–116). Although there is still debate about the exact functional organization of the hippocampus (117), the neuroscientific community has achieved a substantial consensus on its role in learning and memory (118), which are both deteriorated cognitive functions in AD. According to Thal et al. (119) the hippocampus (in particular the subfields CA1 and subiculum), along with the amygdala, are pretty soon affected by Aβ plaques during AD evolution (120). In line with AD diagnostic criteria (121) hippocampal and mesial temporal lobe atrophy have been considered as biomarkers of neuronal degeneration, potentially increasing the probability of an underlying AD pathophysiological process. Currently, however, the routinely utilization of hippocampal atrophy in clinical practice is not fully standardized, but preferentially applied in investigational studies and clinical trials. Furthermore, hippocampal atrophy rate could be better accounted for as a sensitive marker of disease progression (122, 123), being able to trace AD natural development and potentially representing an interesting surrogate marker for disease-modifying clinical trials (124, 125). Interestingly, an increased hippocampus and an asymmetry in the shape of the amygdala during the development of AD have been recently demonstrated, with significant correlation to cognitive impairment (126).
According to our analysis, the gray matter coatrophy network of AD appears to be densely interconnected, as suggested by the presence of 146 edges and 40 nodes, 39 of which have at least one connection. The existence of a set of nodes (altered areas) is not a proof per se that the disease is spreading. In fact, generally speaking, Patel’s k is not always able to identify edges between nodes, which means that, even though some areas are altered, there is no apparent temporal coherence in their capitulation to the disease. The fact, though, that our analysis was able to discover a significant number of edges between nodes is proof of the good reliability of our results pointing out that the alteration cooccurrence really happens, as well as of the consistency of our sample.
Our analysis suggests that AD tends to target a somewhat limited set of brain regions, rather than randomly affecting distinct sites. Furthermore, the left hippocampus, bilateral amygdala, right parahippocampal gyrus, and right inferior temporal lobe seem to follow a very similar pace of degeneration (Figure S4 in Supplementary Material).
In order to evaluate the likelihood of each node of the coatrophy network to be coaltered with other ones rather than as an individual spot we calculated their node degree. The highest value pertains to the node of the left amygdala, which is reached by 17 edges, but we found other 13 nodes with at least 10 edges. These nodes are localized in the temporal lobes, right amygdala, parahippocampal gyrus, left hippocampus, and right thalamus. The high degree of pathoconnectivity of these nodes suggests that, when gray matter alteration affects one of them, it is highly probable that many other regions are also found to be altered. It is also true the other way round, that is, when nodes characterized by low degree show atrophy, it is very likely that this process cooccurs in one of the high-degree nodes, rather than in another low-degree node. These results, as well as the k-core decomposition, provide evidence that in the coatrophy network of AD certain nodes have the characteristic of being pathoconnectivity hubs. Furthermore, the values of the edge betweenness distribution indicate the existence of a dense subnetwork, which is composed of the nodes with the higher degree of pathoconnectivity.
The paucity of connections linking the two hippocampi suggests a limited cooccurrence of alterations between them. The hippocampus is known to be greatly affected by AD, and the MRI volume estimation of this structure is currently considered one of the most reliable in vivo biomarker of this disease (62). Our results suggest that both the hippocampi are substantially altered, albeit somewhat independently. According to previous studies, certain molecular alterations typical of AD are more evident in the left hippocampus compared to the right one (127, 128). This discovery might explain the abundance of edges connecting the nodes in the left hippocampus, as well as support the transneuronal spread mechanism in AD. The nodal stress hypothesis could also play a role in virtue of the intense functional activity of this region. Finally, our finding that the anterior part of the hippocampus exhibits a greater number of edges than the posterior part seems consistent with the suggestion that the deterioration of CA1 and subiculum appears to be more correlated with the development of AD than the deterioration of CA3, which appears to be more correlated with healthy aging (11, 120). Recently, the presubicular–subicular complex has been described as one of the earliest site of atrophy in AD, with a significant correlation with memory performances (even in MCI phase), potentially reflecting the ongoing degenerative process through the subiculum passing from entorhinal cortex to dentate gyrus (129, 130).
In addition to the interpretation of the coatrophy network as a whole, some specific aspects deserve a detailed consideration. The first is the relationship between hippocampus and precuneus. In the coatrophy network of AD these regions are linked through an edge exhibiting a very high degree of edge betweenness, which reveals a direct interaction. According to the “hippocampus disconnection hypothesis” proposed by Tahmasian et al. (131), the disruption of functional connectivity between hippocampus and precuneus could induce the characteristic alterations in the hippocampus that we find in AD. Tahmasian et al. (131) have in fact demonstrated that in AD the hippocampus is much less inhibited, and this disinhibition may result in its hypermetabolism. A similar situation could induce neurotoxicity, which might be one of the causes behind gray matter decrease measured with VBM, thus explaining the identification of a significant number of nodes in the hippocampus.
A second interesting aspect is the relationship between the left hippocampus and right inferior temporal gyrus, which was highlighted by k-core decomposition. This result is in agreement with the study of Wang et al. (132), which found that the interaction between these two areas is typical of AD. Of note, Wang et al. (132) examined 80 pathological subjects using Bayesian network analysis and prior-defined regions of interest, while the present study has applied a meta-analytical approach on a substantially bigger VBM database of 883 patients diagnosed with AD. This agreement supports the sensitivity of our novel methodology. Furthermore, the slight prevalence of inter-hemispheric connections in the coatrophy network of AD (see Figure S5 in Supplementary Material) is consistent with the deterioration of white matter bundles in AD, in particular concerning the corpus callosum (133–137). Callosal atrophy has been associated with cognitive decline rate as well as to disease progression (138, 139).
Gray matter alterations found in the hippocampus, precuneus, and inferior parietal cortex can be ascribed to the general disruption of the DMN in patients with AD (58, 140). Recently, a study has showed that the DMN dysfunction, as well as the disruption of the interaction between different resting state functional networks, can be attributed to amyloid burden (58). What is more, Chang et al. (141) have found that amyloid burden in the cingulate cortex might promote gray matter atrophy in the other areas constituting the DMN.
Overall, the crucial role played by pathological proteins in AD supports the transneuronal spread hypothesis at the basis of gray matter alterations’ distribution (4, 5, 39, 40, 42, 45). However, the complex relationship among different factors (such as amyloid burden, Tau deposition, gray matter atrophy, and disrupted functional connectivity) and the presence of several hub nodes within the coatrophy network of AD suggest that the nodal stress mechanism could as well be involved in the development of the disease (142). Therefore, it is extremely likely that different spreading mechanisms, which are not mutually exclusive, may be involved in the etiology of AD.
Limitations and Future Directions
The present investigation and the methodology on which it is based aim to better understand the nature of AD by examining its pathological fingerprints over the brain. To do so, we were able to get access to a very large sample size of patients. If this is an advantage on the one hand, it can also be a limitation on the other, as within this sample it was not possible to determine the average duration of disease, due to unavailability of information in the original studies. This aspect makes it difficult to associate the coatrophy network with a specific stage of AD progression. However, the methodological procedure for defining the areas to be included in the coatrophy network considers primarily the frequency of every single area to be found altered. In case of a neurodegenerative condition such as Alzheimer’s we could imagine, generally speaking, a group of patients with a recent diagnosis exhibiting alterations in area A, another group with an intermediate development of the disease exhibiting alterations in areas A–B, and another group with an advanced development of the disease exhibiting alterations in areas A–B–C. Since our methodology privileges the frequency of each area to be found altered, in the final network area A will be more likely to be represented, while area C may be even excluded. Moreover, even if the group of patients exhibiting alterations in A–B–C were greater than the other groups, the pattern A–B–C would be less likely to be represented than the sole area A. For this reason, even if our input data could contain an overrepresented sample of patients in a specific stage of the disease, the resulting coalteration network would not represent the pattern of altered areas which is typical of that stage.
Future studies on longitudinal data analyzed by different methods are needed in order to investigate the sequential formation of the coatrophy network identified in this study, so as to achieve a more detailed picture of the temporal evolution of AD.
Conclusion
This meta-analysis was able to address the following important issues.
a. In AD, gray matter alterations do not occur randomly across the brain but, on the contrary, follow identifiable patterns of distribution.
b. This alteration pattern exhibits a network-like structure composed of coaltered areas that can be defined as coatrophy network.
c. Within the coatrophy network of AD, certain brain areas, in virtue of their node degree and values of edge betweenness, can be considered as pathoconnectivity hubs. The alteration of these areas is supposed to imply a wider distribution of gray matter abnormalities across the brain.
d. Within the coatrophy network we can identify a core subnetwork of coaltered areas that includes the left hippocampus, left and right amygdalae, right parahippocampal gyrus, and right temporal inferior gyrus.
The innovative methodological analysis developed in this study for constructing the morphometric coatrophy network of an important neurodegenerative disease such as AD opens a new window into the comprehension of the pathological brain. Increasing evidence is supporting the idea that brain alterations distribute according to a network-like structure. The analysis carried out in this study not only provides support for this hypothesis but also puts forward the significant finding that certain nodes of the coatrophy network may play the role of pathoconnectivity hubs. What is more, our methodology can be equally applicable to study the morphometric coalteration network of any other neuropathological condition. Future investigations into this line of research on databases of different diseases promise to provide valuable insight to the study of the dynamics of brain disorders, so as to achieve a better predictive diagnostic power as well as to improve medical care and treatment.
Author Contributions
JM and AN implemented data collection, analyzed the data, drafted, and revised the article. EP, BB, and KT drafted and revised the article. TC designed the analysis tool, supervised data analysis, drafted, and revised the article. DL retrieved information of the sampled population and implemented bibliographic research. SD revised the article. FC conceived the experiment, supervised data collection, supervised data analysis, drafted, and revised the article.
Conflict of Interest Statement
The authors declare that the research was conducted in the absence of any commercial or financial relationships that could be construed as a potential conflict of interest.
The reviewer AK and handling editor declared their shared affiliation.
Funding
This study was supported by the Fondazione Carlo Molo (FC, PI), Turin and by CSP UNITO Excellent Young PI grant CSTO162182 (FC, PI), Turin.
Supplementary Material
The Supplementary Material for this article can be found online at http://www.frontiersin.org/articles/10.3389/fneur.2017.00739/full#supplementary-material.
References
1. Saxena S, Caroni P. Selective neuronal vulnerability in neurodegenerative diseases: from stressor thresholds to degeneration. Neuron (2011) 71(1):35–48. doi:10.1016/j.neuron.2011.06.031
2. Cauda F, Torta DM, Sacco K, Geda E, D’Agata F, Costa T, et al. Shared “core” areas between the pain and other task-related networks. PLoS One (2012) 7(8):e41929. doi:10.1371/journal.pone.0041929
3. Raj A, Kuceyeski A, Weiner M. A network diffusion model of disease progression in dementia. Neuron (2012) 73(6):1204–15. doi:10.1016/j.neuron.2011.12.040
4. Zhou J, Gennatas ED, Kramer JH, Miller BL, Seeley WW. Predicting regional neurodegeneration from the healthy brain functional connectome. Neuron (2012) 73(6):1216–27. doi:10.1016/j.neuron.2012.03.004
5. Fornito A, Zalesky A, Breakspear M. The connectomics of brain disorders. Nat Rev Neurosci (2015) 16(3):159–72. doi:10.1038/nrn3901
6. Iturria-Medina Y, Evans AC. On the central role of brain connectivity in neurodegenerative disease progression. Front Aging Neurosci (2015) 7:90. doi:10.3389/fnagi.2015.00090
7. Cauda F, Costa T, Nani A, Fava L, Palermo S, Bianco F, et al. Are schizophrenia, autistic, and obsessive spectrum disorders dissociable on the basis of neuroimaging morphological findings? A voxel-based meta-analysis. Autism Res (2017) 10(6):1079–95. doi:10.1002/aur.1759
8. Etkin A, Wager TD. Functional neuroimaging of anxiety: a meta-analysis of emotional processing in PTSD, social anxiety disorder, and specific phobia. Am J Psychiatry (2007) 164(10):1476–88. doi:10.1176/appi.ajp.2007.07030504
9. Ellison-Wright I, Bullmore E. Anatomy of bipolar disorder and schizophrenia: a meta-analysis. Schizophr Res (2010) 117(1):1–12. doi:10.1016/j.schres.2009.12.022
10. Hamilton JP, Etkin A, Furman DJ, Lemus MG, Johnson RF, Gotlib IH. Functional neuroimaging of major depressive disorder: a meta-analysis and new integration of base line activation and neural response data. Am J Psychiatry (2012) 169(7):693–703. doi:10.1176/appi.ajp.2012.11071105
11. Jagust W. Vulnerable neural systems and the borderland of brain aging and neurodegeneration. Neuron (2013) 77(2):219–34. doi:10.1016/j.neuron.2013.01.002
12. Menon V. Developmental pathways to functional brain networks: emerging principles. Trends Cogn Sci (2013) 17(12):627–40. doi:10.1016/j.tics.2013.09.015
13. Baker JT, Holmes AJ, Masters GA, Yeo BT, Krienen F, Buckner RL, et al. Disruption of cortical association networks in schizophrenia and psychotic bipolar disorder. JAMA Psychiatry (2014) 71(2):109–18. doi:10.1001/jamapsychiatry.2013.3469
14. Crossley NA, Mechelli A, Scott J, Carletti F, Fox PT, McGuire P, et al. The hubs of the human connectome are generally implicated in the anatomy of brain disorders. Brain (2014) 137(Pt 8):2382–95. doi:10.1093/brain/awu132
15. Douaud G, Groves AR, Tamnes CK, Westlye LT, Duff EP, Engvig A, et al. A common brain network links development, aging, and vulnerability to disease. Proc Natl Acad Sci U S A (2014) 111(49):17648–53. doi:10.1073/pnas.1410378111
16. Goodkind M, Eickhoff SB, Oathes DJ, Jiang Y, Chang A, Jones-Hagata LB, et al. Identification of a common neurobiological substrate for mental illness. JAMA Psychiatry (2015) 72(4):305–15. doi:10.1001/jamapsychiatry.2014.2206
18. Warren JD, Rohrer JD, Schott JM, Fox NC, Hardy J, Rossor MN. Molecular nexopathies: a new paradigm of neurodegenerative disease. Trends Neurosci (2013) 36(10):561–9. doi:10.1016/j.tins.2013.06.007
19. Mechelli A, Friston KJ, Frackowiak RS, Price CJ. Structural covariance in the human cortex. J Neurosci (2005) 25(36):8303–10. doi:10.1523/jneurosci.0357-05.2005
20. Evans AC. Networks of anatomical covariance. Neuroimage (2013) 80:489–504. doi:10.1016/j.neuroimage.2013.05.054
21. Buckholtz JW, Meyer-Lindenberg A. Psychopathology and the human connectome: toward a transdiagnostic model of risk for mental illness. Neuron (2012) 74(6):990–1004. doi:10.1016/j.neuron.2012.06.002
22. McTeague LM, Goodkind MS, Etkin A. Transdiagnostic impairment of cognitive control in mental illness. J Psychiatr Res (2016) 83:37–46. doi:10.1016/j.jpsychires.2016.08.001
23. Sprooten E, Rasgon A, Goodman M, Carlin A, Leibu E, Lee WH, et al. Addressing reverse inference in psychiatric neuroimaging: meta-analyses of task-related brain activation in common mental disorders. Hum Brain Mapp (2017) 38(4):1846–64. doi:10.1002/hbm.23486
24. Du AT, Schuff N, Kramer JH, Rosen HJ, Gorno-Tempini ML, Rankin K, et al. Different regional patterns of cortical thinning in Alzheimer’s disease and frontotemporal dementia. Brain (2007) 130(Pt 4):1159–66. doi:10.1093/brain/awm016
25. Dickerson BC, Bakkour A, Salat DH, Feczko E, Pacheco J, Greve DN, et al. The cortical signature of Alzheimer’s disease: regionally specific cortical thinning relates to symptom severity in very mild to mild AD dementia and is detectable in asymptomatic amyloid-positive individuals. Cereb Cortex (2009) 19(3):497–510. doi:10.1093/cercor/bhn113
26. Fjell AM, McEvoy L, Holland D, Dale AM, Walhovd KB. What is normal in normal aging? Effects of aging, amyloid and Alzheimer’s disease on the cerebral cortex and the hippocampus. Prog Neurobiol (2014) 117:20–40. doi:10.1016/j.pneurobio.2014.02.004
27. Minkova L, Habich A, Peter J, Kaller CP, Eickhoff SB, Kloppel S. Gray matter asymmetries in aging and neurodegeneration: a review and meta-analysis. Hum Brain Mapp (2017) 38(12):5890–904. doi:10.1002/hbm.23772
28. Head D, Snyder AZ, Girton LE, Morris JC, Buckner RL. Frontal-hippocampal double dissociation between normal aging and Alzheimer’s disease. Cereb Cortex (2005) 15(6):732–9. doi:10.1093/cercor/bhh174
29. Chapleau M, Aldebert J, Montembeault M, Brambati SM. Atrophy in Alzheimer’s disease and semantic dementia: an ALE meta-analysis of voxel-based morphometry studies. J Alzheimers Dis (2016) 54(3):941–55. doi:10.3233/jad-160382
30. Wang WY, Yu JT, Liu Y, Yin RH, Wang HF, Wang J, et al. Voxel-based meta-analysis of grey matter changes in Alzheimer’s disease. Transl Neurodegener (2015) 4:6. doi:10.1186/s40035-015-0027-z
31. Ferreira LK, Diniz BS, Forlenza OV, Busatto GF, Zanetti MV. Neurostructural predictors of Alzheimer’s disease: a meta-analysis of VBM studies. Neurobiol Aging (2011) 32(10):1733–41. doi:10.1016/j.neurobiolaging.2009.11.008
32. He Y, Chen Z, Evans A. Structural insights into aberrant topological patterns of large-scale cortical networks in Alzheimer’s disease. J Neurosci (2008) 28(18):4756–66. doi:10.1523/jneurosci.0141-08.2008
33. Tijms BM, Wink AM, de Haan W, van der Flier WM, Stam CJ, Scheltens P, et al. Alzheimer’s disease: connecting findings from graph theoretical studies of brain networks. Neurobiol Aging (2013) 34(8):2023–36. doi:10.1016/j.neurobiolaging.2013.02.020
34. Matsuda H. MRI morphometry in Alzheimer’s disease. Ageing Res Rev (2016) 30:17–24. doi:10.1016/j.arr.2016.01.003
35. Yao Z, Zhang Y, Lin L, Zhou Y, Xu C, Jiang T. Abnormal cortical networks in mild cognitive impairment and Alzheimer’s disease. PLoS Comput Biol (2010) 6(11):e1001006. doi:10.1371/journal.pcbi.1001006
36. Li Y, Wang Y, Wu G, Shi F, Zhou L, Lin W, et al. Discriminant analysis of longitudinal cortical thickness changes in Alzheimer’s disease using dynamic and network features. Neurobiol Aging (2012) 33(2):.e415–30. doi:10.1016/j.neurobiolaging.2010.11.008
37. Tijms BM, Yeung HM, Sikkes SA, Moller C, Smits LL, Stam CJ, et al. Single-subject gray matter graph properties and their relationship with cognitive impairment in early- and late-onset Alzheimer’s disease. Brain Connect (2014) 4(5):337–46. doi:10.1089/brain.2013.0209
38. Tijms BM, Kate MT, Wink AM, Visser PJ, Ecay M, Clerigue M, et al. Gray matter network disruptions and amyloid beta in cognitively normal adults. Neurobiol Aging (2016) 37:154–60. doi:10.1016/j.neurobiolaging.2015.10.015
39. Goedert M, Clavaguera F, Tolnay M. The propagation of prion-like protein inclusions in neurodegenerative diseases. Trends Neurosci (2010) 33(7):317–25. doi:10.1016/j.tins.2010.04.003
40. Iturria-Medina Y, Sotero RC, Toussaint PJ, Evans AC. Epidemic spreading model to characterize misfolded proteins propagation in aging and associated neurodegenerative disorders. PLoS Comput Biol (2014) 10(11):e1003956. doi:10.1371/journal.pcbi.1003956
41. Brettschneider J, Del Tredici K, Lee VM, Trojanowski JQ. Spreading of pathology in neurodegenerative diseases: a focus on human studies. Nat Rev Neurosci (2015) 16(2):109–20. doi:10.1038/nrn3887
42. Chevalier-Larsen E, Holzbaur EL. Axonal transport and neurodegenerative disease. Biochim Biophys Acta (2006) 1762(11–12):1094–108. doi:10.1016/j.bbadis.2006.04.002
43. Clavaguera F, Lavenir I, Falcon B, Frank S, Goedert M, Tolnay M. “Prion-like” templated misfolding in tauopathies. Brain Pathol (2013) 23(3):342–9. doi:10.1111/bpa.12044
44. Bourdenx M, Koulakiotis NS, Sanoudou D, Bezard E, Dehay B, Tsarbopoulos A. Protein aggregation and neurodegeneration in prototypical neurodegenerative diseases: examples of amyloidopathies, tauopathies and synucleinopathies. Prog Neurobiol (2017) 155:171–93. doi:10.1016/j.pneurobio.2015.07.003
45. Guest WC, Silverman JM, Pokrishevsky E, O’Neill MA, Grad LI, Cashman NR. Generalization of the prion hypothesis to other neurodegenerative diseases: an imperfect fit. J Toxicol Environ Health A (2011) 74(22–24):1433–59. doi:10.1080/15287394.2011.618967
46. Buckner RL, Snyder AZ, Shannon BJ, LaRossa G, Sachs R, Fotenos AF, et al. Molecular, structural, and functional characterization of Alzheimer’s disease: evidence for a relationship between default activity, amyloid, and memory. J Neurosci (2005) 25(34):7709–17. doi:10.1523/JNEUROSCI.2177-05.2005
47. Lichtman JW, Sanes JR. Ome sweet ome: what can the genome tell us about the connectome? Curr Opin Neurobiol (2008) 18(3):346–53. doi:10.1016/j.conb.2008.08.010
48. Prieto C, Risueno A, Fontanillo C, De las Rivas J. Human gene coexpression landscape: confident network derived from tissue transcriptomic profiles. PLoS One (2008) 3(12):e3911. doi:10.1371/journal.pone.0003911
49. French L, Tan PP, Pavlidis P. Large-scale analysis of gene expression and connectivity in the rodent brain: insights through data integration. Front Neuroinform (2011) 5:12. doi:10.3389/fninf.2011.00012
50. Wolf L, Goldberg C, Manor N, Sharan R, Ruppin E. Gene expression in the rodent brain is associated with its regional connectivity. PLoS Comput Biol (2011) 7(5):e1002040. doi:10.1371/journal.pcbi.1002040
51. Cioli C, Abdi H, Beaton D, Burnod Y, Mesmoudi S. Differences in human cortical gene expression match the temporal properties of large-scale functional networks. PLoS One (2014) 9(12):e115913. doi:10.1371/journal.pone.0115913
52. French L, Pavlidis P. Relationships between gene expression and brain wiring in the adult rodent brain. PLoS Comput Biol (2011) 7(1):e1001049. doi:10.1371/journal.pcbi.1001049
53. Appel SH. A unifying hypothesis for the cause of amyotrophic lateral sclerosis, parkinsonism, and Alzheimer disease. Ann Neurol (1981) 10(6):499–505. doi:10.1002/ana.410100602
54. Salehi A, Delcroix JD, Belichenko PV, Zhan K, Wu C, Valletta JS, et al. Increased App expression in a mouse model of Down’s syndrome disrupts NGF transport and causes cholinergic neuron degeneration. Neuron (2006) 51(1):29–42. doi:10.1016/j.neuron.2006.05.022
55. Goedert M. Neurodegeneration. Alzheimer’s and Parkinson’s diseases: the prion concept in relation to assembled Abeta, tau, and alpha-synuclein. Science (2015) 349(6248):1255555. doi:10.1126/science.1255555
56. Sepulcre J, Grothe MJ, Sabuncu M, Chhatwal J, Schultz AP, Hanseeuw B, et al. Hierarchical organization of tau and amyloid deposits in the cerebral cortex. JAMA Neurol (2017) 74(7):813–20. doi:10.1001/jamaneurol.2017.0263
57. Braak H, Del Tredici K, Schultz C, Braak E. Vulnerability of select neuronal types to Alzheimer’s disease. Ann N Y Acad Sci (2000) 924:53–61. doi:10.1111/j.1749-6632.2000.tb05560.x
58. Weiler M, de Campos BM, Teixeira CV, Casseb RF, Carletti-Cassani AF, Vicentini JE, et al. Intranetwork and internetwork connectivity in patients with Alzheimer disease and the association with cerebrospinal fluid biomarker levels. J Psychiatry Neurosci (2017) 42(3):160190. doi:10.1503/jpn.160190
59. Fox PT, Lancaster JL. Opinion: mapping context and content: the BrainMap model. Nat Rev Neurosci (2002) 3(4):319–21. doi:10.1038/nrn789
60. Laird AR, Fox PM, Price CJ, Glahn DC, Uecker AM, Lancaster JL, et al. ALE meta-analysis: controlling the false discovery rate and performing statistical contrasts. Hum Brain Mapp (2005) 25(1):155–64. doi:10.1002/hbm.20136
61. Laird AR, Eickhoff SB, Kurth F, Fox PM, Uecker AM, Turner JA, et al. ALE meta-analysis workflows via the brainmap database: progress towards a probabilistic functional brain atlas. Front Neuroinform (2009) 3:23. doi:10.3389/neuro.11.023.2009
62. Teipel SJ, Grothe M, Lista S, Toschi N, Garaci FG, Hampel H. Relevance of magnetic resonance imaging for early detection and diagnosis of Alzheimer disease. Med Clin North Am (2013) 97(3):399–424. doi:10.1016/j.mcna.2012.12.013
63. Liberati A, Altman DG, Tetzlaff J, Mulrow C, Gotzsche PC, Ioannidis JP, et al. The PRISMA statement for reporting systematic reviews and meta-analyses of studies that evaluate healthcare interventions: explanation and elaboration. BMJ (2009) 339:b2700. doi:10.1136/bmj.b2700
64. Moher D, Liberati A, Tetzlaff J, Altman DG. Preferred reporting items for systematic reviews and meta-analyses: the PRISMA statement. J Clin Epidemiol (2009) 62(10):1006–12. doi:10.1016/j.jclinepi.2009.06.005
65. Agosta F, Pievani M, Sala S, Geroldi C, Galluzzi S, Frisoni GB, et al. White matter damage in Alzheimer disease and its relationship to gray matter atrophy. Radiology (2011) 258:853–63. doi:10.1148/radiol.10101284
66. Baron JC, Chetelat G, Desgranges B, Perchey G, Landeau B, de la Sayette V, et al. In vivo mapping of gray matter loss with voxel-based morphometry in mild Alzheimer’s disease. Neuroimage (2001) 14:298–309. doi:10.1006/nimg.2001.0848
67. Baxter LC, Sparks DL, Johnson SC, Lenoski B, Lopez JE, Connor DJ, et al. Relationship of cognitive measures and gray and white matter in Alzheimer’s disease. J Alzheimer Dis (2006) 9:253–60. doi:10.3233/JAD-2006-9304
68. Berlingeri M, Bottini G, Basilico S, Silani G, Zanardi G, Sberna M, et al. Anatomy of the episodic buffer: a voxel-based morphometry study in patients with dementia. Behav Neurosci (2008) 19:29–34. doi:10.1155/2008/828937
69. Boxer AL, Rankin KP, Miller BL, Schuff N, Weiner MW, Gorno-Tempini ML, et al. Cinguloparietal atrophy distinguishes Alzheimer disease from semantic dementia. Arch Neurol (2003) 60:949–56. doi:10.1001/archneur.60.7.949
70. Bozzali M, Filippi M, Magnani G, Cercignani M, Franceschi M, Schiatti E, et al. The contribution of voxel-based morphometry in staging patients with mild cognitive impairment. Neurology (2006) 67:453–60. doi:10.1212/01.wnl.0000228243.56665.c2
71. Brenneis C, Wenning GK, Egger KE, Schocke M, Trieb T, Seppi K, et al. Basal forebrain atrophy is a distinctive pattern in dementia with Lewy bodies. Neuroreport (2004) 15:1711–4. doi:10.1097/01.wnr.0000136736.73895.03
72. Canu E, Frisoni GB, Agosta F, Pievani M, Bonetti M, Filippi M. Early and late onset Alzheimer’s disease patients have distinct patterns of white matter damage. Neurobiol Aging (2010) 33(6):1023–33. doi:10.1016/j.neuro-biolaging.2010.09.021
73. Chetelat G, Desgranges B, de la Sayette V, Viader F, Eustache F, Baron JC. Mapping gray matter loss with voxel-based morphometry in mild cognitive impairment. Neuroreport (2002) 13:1939–43. doi:10.1097/00001756-200210280-00022
74. Farrow TFD, Thiyagesh SN, Wilkinson ID, Parks RW, Ingram L, Woodruff PWR. Fronto-temporal-lobe atrophy in early-stage Alzheimer’s disease identified using an improved detection method. Psychiatry Research NeuroImaging (2007) 155:11–9. doi:10.1016/j.pscychresns.2006.12.013
75. Feldmann A, Trauninger A, Toth L, Kotek G, Kosztolanyi P, Illes E, et al. Atrophy and decreased activation of fronto-parietal attention areas contribute to higher visual dysfunction in posterior cortical atrophy. Psychiatry Res (2008) 164:178–84. doi:10.1016/j.pscychresns.2008.01.006
76. Frisoni GB, Testa C, Zorzan A, Sabattoli F, Beltramello A, Soininen H, et al. Detection of grey matter loss in mild Alzheimer’s disease with voxel based morphometry. J Neurol Neurosurg Psychiatry (2002) 73:657–64. doi:10.1136/jnnp.73.6.657
77. Guo X, Wang Z, Li K, Li Z, Qi Z, Jin Z, et al. Voxel-based assessment of gray and white matter volumes in Alzheimer’s disease. Neurosci Lett (2010) 468:146–50. doi:10.1016/j.neulet.2009.10.086
78. Hall AM, Moore RY, Lopez OL, Kuller L, Becker JT. Basal forebrain atrophy is a presymptomatic marker for Alzheimer’s disease. Alzheimers Dement (2008) 4:271–9. doi:10.1016/j.jalz.2008.04.005
79. Hamalainen A, Pihlajamaki M, Tanila H, Hanninen T, Niskanen E, Tervo S, et al. Increased fMRI responses during encoding in mild cognitive impairment. Neurobiol Aging (2007) 28:1889–903. doi:10.1016/j.neurobiolaging.2006.08.008
80. Hirao K, Ohnishi T, Matsuda H, Nemoto K, Hirata Y, Yamashita F, et al. Functional interactions between entorhinal cortex and posterior cingulate cortex at the very early stage of Alzheimer’s disease using brain perfusion single-photon emission computed tomography. Nucl Med Commun (2006) 27:151–6. doi:10.1097/01.mnm.0000189783.39411.ef
81. Honea RA, Thomas GP, Harsha A, Anderson HS, Donnely JE, Brooks WM, et al. Cardiorespiratory fitness and preserved medial temporal lobe volume in Alzheimer disease. Alzheimer Dis Relat Disord (2009) 23:188–97. doi:10.1097/WAD.0b013e31819cb8a2
82. Ishii K, Sasaki H, Kono AK, Miyamoto N, Fukuda T, Mori E. Comparison of gray matter and metabolic reduction in mild Alzheimer’s disease using FDG-PET and voxel-based morphometric MR studies. Eur J Nucl Med Mol Imaging (2005) 32:959–63. doi:10.1007/s00259-004-1740-5
83. Kanda T, Ishii K, Uemura T, Miyamoto N, Yoshikawa T, Kono AK, et al. Comparison of grey matter and metabolic reductions in frontotemporal dementia using FDG-PET and voxel-based morphometric MR studies. Eur J Nucl Med Mol Imaging (2008) 35:2227–34. doi:10.1007/s00259-008-0871-5
84. Kawachi T, Ishii K, Sakamoto S, Sasaki M, Mori T, Yamashita F, et al. Comparison of the diagnostic performance of FDG-PET and VBM-MRI in very mild Alzheimer’s disease. Eur J Nucl Med Mol Imaging (2006) 33:801–9. doi:10.1007/s00259-005-0050-x
85. Kim S, Young CY, Hsiung G-YR, Ha S-Y, Park K-Y, Shin H-W, et al. Voxel-based morphometric study of brain volume changes in patients with Alzheimer’s disease assessed according to the Clinical Dementia Rating score. J Clin Neurosci (2011) 18:916–21. doi:10.1016/j.jocn.2010.12.019
86. Matsuda H, Kitayama N, Ohnishi T, Asada T, Nakano S, Sakamoto S, et al. Longitudinal evaluation of both morphologic and functional changes in the same individuals with Alzheimer’s disease. J Nucl Med (2002) 43:304–11.
87. Matsunari I, Samuraki M, Chen WP, Yanase D, Takeda N, Ono K, et al. Comparison of 18F-FDG PET and optimized voxel-based morphometry for detection of Alzheimer’s disease: aging effect on diagnostic performance. J Nucl Med (2007) 48:1961–70. doi:10.2967/jnumed.107.042820
88. Mazere J, Prunier C, Barret O, Guyot M, Hommet C, Guilloteau D, et al. In vivo SPECT imaging of vesicular acetylcholine transporter using [(123)I]-IBVM in early Alzheimer’s disease. Neuroimage (2008) 40:280–8. doi:10.1016/j.neuroimage.2007.11.028
89. Miettinen PS, Pihlajamaki M, Jauhiainen AM, Niskanen E, Hanninen T, Vanninen R, et al. Structure and function of medial temporal and posteromedial cortices in early Alzheimer’s disease. Eur J Neurosci (2011) 34:320–30. doi:10.1111/j.1460-9568.2011.07745.x
90. Ohnishi T, Matsuda H, Tabira T, Asada T, Uno M. Changes in brain morphology in Alzheimer disease and normal aging: is Alzheimer disease an exaggerated aging process? Am J Neuroradiol (2001) 22:1680–5.
91. Rabinovici GD, Seeley WW, Kim EJ, Gorno-Tempini ML, Rascovsky K, Pagliaro TA, et al. Distinct MRI atrophy patterns in autopsy-proven Alzheimer’s disease and frontotemporal lobar degeneration. Am J Alzheimers Dis Other Demen (2007) 22:474–88. doi:10.1177/1533317507308779
92. Rami L, Gomez-Anson B, Monte GC, Bosch B, Sanchez-Valle R, Molinuevo JL. Voxel based morphometry features and follow-up of amnestic patients at high risk for Alzheimer’s disease conversion. Int J Geriatr Psychiatry (2009) 24:875–84. doi:10.1002/gps.2216
93. Remy F, Mirrashed F, Campbell B, Richter W. Verbal episodic memory impairment in Alzheimer’s disease: a combined structural and functional MRI study. Neuroimage (2005) 25:253–66. doi:10.1016/j.neuroimage.2004.10.045
94. Shiino A, Watanabe T, Maeda K, Kotani E, Akiguchi I, Matsuda M. Four subgroups of Alzheimer’s disease based on patterns of atrophy using VBM and a unique pattern for early onset disease. Neuroimage (2006) 33:17–26. doi:10.1016/j.neuroimage.2006.06.010
95. Takahashi R, Ishii K, Miyamoto N, Yoshikawa T, Shimada K, Ohkawa S, et al. Measurement of gray and white matter atrophy in dementia with Lewy bodies using diffeomorphic anatomic registration through exponentiated lie algebra: a comparison with conventional voxel-based morphometry. Am J Neuroradiol (2010) 31:1873–8. doi:10.3174/ajnr.A2200
96. Testa C, Laakso MP, Sabattoli F, Rossi R, Beltramello A, Soininen H, et al. A comparison between the accuracy of voxel-based morphometry and hippocampal volumetry in Alzheimer’s disease. J Magn Reson Imaging (2004) 19:274–82. doi:10.1002/jmri.20001
97. Waragai M, Okamura N, Furukawa K, Tashiro M, Furumoto S, Funaki Y, et al. Comparison study of amyloid PET and voxel-based morphometry analysis in mild cognitive impairment and Alzheimer’s disease. J Neurol Sci (2009) 285:100–8. doi:10.1016/j.jns.2009.06.005
98. Whitwell JL, Jack CR, Kantarci K, Weigand SD, Boeve BF, Knopman DS, et al. Imaging correlates of posterior cortical atrophy. Neurobiol Aging (2007) 28:1051–61. doi:10.1016/j.neurobiolaging.2006.05.026
99. Xie S, Xiao JX, Gong GL, Zang YF, Wang YH, Wu HK, et al. Voxel-based detection of white matter abnormalities in mild Alzheimer disease. Neurology (2006) 66:1845–9. doi:10.1212/01.wnl.0000219625.77625.aa
100. Zahn R, Buechert M, Overmans J, Talazko J, Specht K, Ko CW, et al. Mapping of temporal and parietal cortex in progressive nonfluent aphasia and Alzheimer’s disease using chemical shift imaging, voxel-based morphometry and positron emission tomography. Psychiatry Res (2005) 140:115–31. doi:10.1016/j.pscychresns.2005.08.001
101. Eickhoff SB, Laird AR, Grefkes C, Wang LE, Zilles K, Fox PT. Coordinate-based activation likelihood estimation meta-analysis of neuroimaging data: a random-effects approach based on empirical estimates of spatial uncertainty. Hum Brain Mapp (2009) 30(9):2907–26. doi:10.1002/hbm.20718
102. Eickhoff SB, Bzdok D, Laird AR, Kurth F, Fox PT. Activation likelihood estimation meta-analysis revisited. Neuroimage (2012) 59(3):2349–61. doi:10.1016/j.neuroimage.2011.09.017
103. Turkeltaub PE, Eickhoff SB, Laird AR, Fox M, Wiener M, Fox P. Minimizing within-experiment and within-group effects in activation likelihood estimation meta-analyses. Hum Brain Mapp (2012) 33(1):1–13. doi:10.1002/hbm.21186
104. Eickhoff SB, Nichols TE, Laird AR, Hoffstaedter F, Amunts K, Fox PT, et al. Behavior, sensitivity, and power of activation likelihood estimation characterized by massive empirical simulation. Neuroimage (2016) 137:70–85. doi:10.1016/j.neuroimage.2016.04.072
105. Eickhoff SB, Laird AR, Fox PM, Lancaster JL, Fox PT. Implementation errors in the GingerALE Software: description and recommendations. Hum Brain Mapp (2017) 38(1):7–11. doi:10.1002/hbm.23342
106. Patel RS, Bowman FD, Rilling JK. A Bayesian approach to determining connectivity of the human brain. Hum Brain Mapp (2006) 27(3):267–76. doi:10.1002/hbm.20182
107. Smith SM, Miller KL, Salimi-Khorshidi G, Webster M, Beckmann CF, Nichols TE, et al. Network modelling methods for FMRI. Neuroimage (2011) 54(2):875–91. doi:10.1016/j.neuroimage.2010.08.063
108. Shannon P, Markiel A, Ozier O, Baliga NS, Wang JT, Ramage D, et al. Cytoscape: a software environment for integrated models of biomolecular interaction networks. Genome Res (2003) 13(11):2498–504. doi:10.1101/gr.1239303
109. Smoot ME, Ono K, Ruscheinski J, Wang PL, Ideker T. Cytoscape 2.8: new features for data integration and network visualization. Bioinformatics (2011) 27(3):431–2. doi:10.1093/bioinformatics/btq675
110. Girvan M, Newman ME. Community structure in social and biological networks. Proc Natl Acad Sci U S A (2002) 99(12):7821–6. doi:10.1073/pnas.122653799
111. Bader GD, Hogue CW. An automated method for finding molecular complexes in large protein interaction networks. BMC Bioinformatics (2003) 4:2. doi:10.1186/1471-2105-4-2
112. Alvarez-Hamelin I, Dall’asta L, Barrat A, Vespignani A. K-Core decomposition: a tool for the visualization of large scale networks. Adv Neural Inform Process Syst (2005) 18:41.
113. Yang J, Pan P, Song W, Huang R, Li J, Chen K, et al. Voxelwise meta-analysis of gray matter anomalies in Alzheimer’s disease and mild cognitive impairment using anatomic likelihood estimation. J Neurol Sci (2012) 316(1–2):21–9. doi:10.1016/j.jns.2012.02.010
114. Thompson PM, Hayashi KM, Dutton RA, Chiang MC, Leow AD, Sowell ER, et al. Tracking Alzheimer’s disease. Ann N Y Acad Sci (2007) 1097:183–214. doi:10.1196/annals.1379.017
115. Woolard AA, Heckers S. Anatomical and functional correlates of human hippocampal volume asymmetry. Psychiatry Res (2012) 201(1):48–53. doi:10.1016/j.pscychresns.2011.07.016
116. Long X, Zhang L, Liao W, Jiang C, Qiu B. Distinct laterality alterations distinguish mild cognitive impairment and Alzheimer’s disease from healthy aging: statistical parametric mapping with high resolution MRI. Hum Brain Mapp (2013) 34(12):3400–10. doi:10.1002/hbm.22157
117. Strange BA, Witter MP, Lein ES, Moser EI. Functional organization of the hippocampal longitudinal axis. Nat Rev Neurosci (2014) 15(10):655–69. doi:10.1038/nrn3785
118. Zeidman P, Maguire EA. Anterior hippocampus: the anatomy of perception, imagination and episodic memory. Nat Rev Neurosci (2016) 17(3):173–82. doi:10.1038/nrn.2015.24
119. Thal DR, Attems J, Ewers M. Spreading of amyloid, tau, and microvascular pathology in Alzheimer’s disease: findings from neuropathological and neuroimaging studies. J Alzheimers Dis (2014) 42(Suppl 4):S421–9. doi:10.3233/jad-141461
120. Pievani M, Galluzzi S, Thompson PM, Rasser PE, Bonetti M, Frisoni GB. APOE4 is associated with greater atrophy of the hippocampal formation in Alzheimer’s disease. Neuroimage (2011) 55(3):909–19. doi:10.1016/j.neuroimage.2010.12.081
121. McKhann GM, Knopman DS, Chertkow H, Hyman BT, Jack CR Jr, Kawas CH, et al. The diagnosis of dementia due to Alzheimer’s disease: recommendations from the National Institute on Aging-Alzheimer’s Association workgroups on diagnostic guidelines for Alzheimer’s disease. Alzheimers Dement (2011) 7(3):263–9. doi:10.1016/j.jalz.2011.03.005
122. Apostolova LG, Morra JH, Green AE, Hwang KS, Avedissian C, Woo E, et al. Automated 3D mapping of baseline and 12-month associations between three verbal memory measures and hippocampal atrophy in 490 ADNI subjects. Neuroimage (2010) 51(1):488–99. doi:10.1016/j.neuroimage.2009.12.125
123. Sabuncu MR, Desikan RS, Sepulcre J, Yeo BT, Liu H, Schmansky NJ, et al. The dynamics of cortical and hippocampal atrophy in Alzheimer disease. Arch Neurol (2011) 68(8):1040–8. doi:10.1001/archneurol.2011.167
124. Schuff N, Woerner N, Boreta L, Kornfield T, Shaw LM, Trojanowski JQ, et al. MRI of hippocampal volume loss in early Alzheimer’s disease in relation to ApoE genotype and biomarkers. Brain (2009) 132(Pt 4):1067–77. doi:10.1093/brain/awp007
125. Whitwell JL. Biomarkers in randomized clinical trials: magnetic resonance imaging. Front Neurol Neurosci (2016) 39:101–8. doi:10.1159/000445419
126. Wachinger C, Salat DH, Weiner M, Reuter M. Whole-brain analysis reveals increased neuroanatomical asymmetries in dementia for hippocampus and amygdala. Brain (2016) 139(Pt 12):3253–66. doi:10.1093/brain/aww243
127. Hovorkova P, Kristofikova Z, Horinek A, Ripova D, Majer E, Zach P, et al. Lateralization of 17beta-hydroxysteroid dehydrogenase type 10 in hippocampi of demented and psychotic people. Dement Geriatr Cogn Disord (2008) 26(3):193–8. doi:10.1159/000151778
128. Kristofikova Z, Kozmikova I, Hovorkova P, Ricny J, Zach P, Majer E, et al. Lateralization of hippocampal nitric oxide mediator system in people with Alzheimer disease, multi-infarct dementia and schizophrenia. Neurochem Int (2008) 53(5):118–25. doi:10.1016/j.neuint.2008.06.009
129. Carlesimo GA, Piras F, Orfei MD, Iorio M, Caltagirone C, Spalletta G. Atrophy of presubiculum and subiculum is the earliest hippocampal anatomical marker of Alzheimer’s disease. Alzheimers Dement (Amst) (2015) 1(1):24–32. doi:10.1016/j.dadm.2014.12.001
130. Hirjak D, Wolf RC, Remmele B, Seidl U, Thomann AK, Kubera KM, et al. Hippocampal formation alterations differently contribute to autobiographic memory deficits in mild cognitive impairment and Alzheimer’s disease. Hippocampus (2017) 27(6):702–15. doi:10.1002/hipo.22726
131. Tahmasian M, Pasquini L, Scherr M, Meng C, Forster S, Mulej Bratec S, et al. The lower hippocampus global connectivity, the higher its local metabolism in Alzheimer disease. Neurology (2015) 84(19):1956–63. doi:10.1212/wnl.0000000000001575
132. Wang Y, Chen K, Yao L, Jin Z, Guo X. Structural interactions within the default mode network identified by Bayesian network analysis in Alzheimer’s disease. PLoS One (2013) 8(8):e74070. doi:10.1371/journal.pone.0074070
133. Teipel SJ, Bayer W, Alexander GE, Zebuhr Y, Teichberg D, Kulic L, et al. Progression of corpus callosum atrophy in Alzheimer disease. Arch Neurol (2002) 59(2):243–8. doi:10.1001/archneur.59.2.243
134. Ardekani BA, Bachman AH, Figarsky K, Sidtis JJ. Corpus callosum shape changes in early Alzheimer’s disease: an MRI study using the OASIS brain database. Brain Struct Funct (2014) 219(1):343–52. doi:10.1007/s00429-013-0503-0
135. Bachman AH, Lee SH, Sidtis JJ, Ardekani BA. Corpus callosum shape and size changes in early Alzheimer’s disease: a longitudinal MRI study using the OASIS brain database. J Alzheimers Dis (2014) 39(1):71–8. doi:10.3233/jad-131526
136. Walterfang M, Luders E, Looi JC, Rajagopalan P, Velakoulis D, Thompson PM, et al. Shape analysis of the corpus callosum in Alzheimer’s disease and frontotemporal lobar degeneration subtypes. J Alzheimers Dis (2014) 40(4):897–906. doi:10.3233/jad-131853
137. Fischer FU, Wolf D, Scheurich A, Fellgiebel A. Altered whole-brain white matter networks in preclinical Alzheimer’s disease. Neuroimage Clin (2015) 8:660–6. doi:10.1016/j.nicl.2015.06.007
138. Wang PN, Chou KH, Chang NJ, Lin KN, Chen WT, Lan GY, et al. Callosal degeneration topographically correlated with cognitive function in amnestic mild cognitive impairment and Alzheimer’s disease dementia. Hum Brain Mapp (2014) 35(4):1529–43. doi:10.1002/hbm.22271
139. Wang XD, Ren M, Zhu MW, Gao WP, Zhang J, Shen H, et al. Corpus callosum atrophy associated with the degree of cognitive decline in patients with Alzheimer’s dementia or mild cognitive impairment: a meta-analysis of the region of interest structural imaging studies. J Psychiatr Res (2015) 63:10–9. doi:10.1016/j.jpsychires.2015.02.005
140. Greicius MD, Srivastava G, Reiss AL, Menon V. Default-mode network activity distinguishes Alzheimer’s disease from healthy aging: evidence from functional MRI. Proc Natl Acad Sci U S A (2004) 101(13):4637–42. doi:10.1073/pnas.0308627101
141. Chang YT, Huang CW, Chang YH, Chen NC, Lin KJ, Yan TC, et al. Amyloid burden in the hippocampus and default mode network: relationships with gray matter volume and cognitive performance in mild stage Alzheimer disease. Medicine (Baltimore) (2015) 94(16):e763. doi:10.1097/md.0000000000000763
Keywords: brain alterations, coatrophy network, pathoconnectivity hubs, Alzheimer’s disease, tauopathy, gray matter atrophy, voxel-based morphometry
Citation: Manuello J, Nani A, Premi E, Borroni B, Costa T, Tatu K, Liloia D, Duca S and Cauda F (2018) The Pathoconnectivity Profile of Alzheimer’s Disease: A Morphometric Coalteration Network Analysis. Front. Neurol. 8:739. doi: 10.3389/fneur.2017.00739
Received: 28 June 2017; Accepted: 21 December 2017;
Published: 25 January 2018
Edited by:
Ashish Raj, Cornell University, United StatesReviewed by:
Gianfranco Spalletta, Fondazione Santa Lucia (IRCCS), ItalyAmy Kuceyeski, Cornell University, United States
Copyright: © 2018 Manuello, Nani, Premi, Borroni, Costa, Tatu, Liloia, Duca and Cauda. This is an open-access article distributed under the terms of the Creative Commons Attribution License (CC BY). The use, distribution or reproduction in other forums is permitted, provided the original author(s) or licensor are credited and that the original publication in this journal is cited, in accordance with accepted academic practice. No use, distribution or reproduction is permitted which does not comply with these terms.
*Correspondence: Tommaso Costa, tommaso.costa@unito.it
†These authors have contributed equally to this work.