Origin of Hyperbolicity in Brain-to-Brain Coordination Networks
 Bosiljka Tadić
 Miroslav Andjelković
 Milovan Šuvakov
- 1Department of Theoretical Physics, Jožef Stefan Institute, Ljubljana, Slovenia
- 2Institute of Nuclear Sciences, Vinča, University of Belgrade, Belgrade, Serbia
- 3Institute of Physics Belgrade, University of Belgrade, Belgrade, Serbia
Hyperbolicity or negative curvature of complex networks is the intrinsic geometric proximity of nodes in the graph metric space, which implies an improved network function. Here, we investigate hidden combinatorial geometries in brain-to-brain coordination networks arising through social communications. The networks originate from correlations among EEG signals previously recorded during spoken communications comprising of 14 individuals with 24 speaker-listener pairs. We find that the corresponding networks are δ-hyperbolic with δmax = 1 and the graph diameter D = 3 in each brain. While the emergent hyperbolicity in the two-brain networks varies satisfying δmax/D/2 ≤ 1 and can be attributed to the topology of the subgraph formed around the cross-brains linking channels. We identify these subgraphs in each studied two-brain network and decompose their structure into simple geometric descriptors (triangles, tetrahedra and cliques of higher orders) that contribute to hyperbolicity. Considering topologies that exceed two separate brain networks as a measure of coordination synergy between the brains, we identify different neural correlation patterns ranging from weak coordination to super-brain structure. These topology features are in qualitative agreement with the listener's self-reported ratings of own experience and quality of the speaker, suggesting that studies of the cross-brain connector networks can reveal new insight into the neural mechanisms underlying human social behavior.
1. Introduction
Recent advances in brain imaging techniques resulted in extensive empirical data calling for interdisciplinary science approaches to reveal hidden features of the structure and function of the brain. In this regard, a systematic mapping of the imaging data on networks and the use of objective graph theory analysis [1–3] represents a significant leap. Recently, we have extended this approach to analyse the multi-brain networks [4]; the underlying data obtained in the original experiment [5] represent the simultaneous EEG brain imaging in a group of participants during spoken communications. Mapping the recorded data to a multi-brain graph where each EEG channel is designated as a node, arranged a fine-grain network suitable for analysis of coordination between brains. Furthermore, it was demonstrated that the methods of algebraic topology provide adequate measures of inter-brain coordinations by uncovering the simple geometric descriptors which arrange themselves into higher organized structures [4]. Referring to this work, Falk et al. in recent Feature Review [6] stated that “these approaches pave the way to understand the manners in which brain network dynamics in one person might influence or reflect the brain network dynamics in another.” Social neurology uses the term social brain to distinguish the brain functions underlying the social conduct of humans [7, 8]. Platforms for simultaneous recording of brain functions in pairs or groups of individuals are being developed generating the appropriate data that allow study of the social brain structure in various situations [5, 9–12]. Potentials of these experimental and theoretical approaches still remain elusive. Some recent studies [13–15] imply that EEG imaging supplemented by proper nonlinear analysis can detect changes in the emotional states of the brain that play an important role in traversing from the social brain functions to social networking [16].
In the brain networks, the nodes represent brain areas that have been recognized as functional units, and the anatomical or functional connections between them represent edges [17]. Currently, a consensus exists among researchers as regards the anatomical brain network [18]. On the other hand, functional brain connectivities can be significantly different from the anatomical structure that underlies them and vary in time and depending on contents (emotional and cognitive) of the processing data [13, 15, 19]. In this context, the social brain is a kind of functional brain network. It consists of processing information in different dynamically organized brain areas that allows inference of intentions, thought, feelings that are going on in the brains of others [7]. The information received continues to influence the functioning of the receiver's brain to adapt social behavior accordingly. Compared to individual brain areas involved in processing specific information, for instance, distance and language interpretation [20], the social brain can include several brain regions. The structure of the social brain can vary from individual to individual, and depend on the subject and the way of communications [12, 21].
Based on the set of data from Kuhlen et al. [5] analyzed in our recent work Tadić et al. [4], here we study hidden geometries of two-brain coordination networks. In particular, we consider all speaker-listener pairs in the underlying communication dataset of Stimulus-1. This Stimulus consists of two superimposed audiovisual recordings (about 4 min long) where two speakers, women and men, are telling two different fairy tales. The Stimulus is presented at the same time to two groups of six listeners; each group is instructed to follow a speaker who is first presented to the group in the first 5 s. For speakers, EEG recording took place during the narration, while scanning for all listeners is done simultaneously during the session. For a detailed description of the experimental set-up and the composition of the Stimuli as well as the psychology background of the experiment we refer to the original work [5]. The Stimulus-1 and the signals that we consider here are also described in Tadić et al. [4].
In these two-brain networks, we analyse the emergent negative curvature (δ-hyperbolicity) as a signature of the closeness of nodes in the graph metric space that—as we will show—is related with the appearance of higher organized structures between two brain networks. In recent years, the notion of δ-hyperbolicity [22] has been generalized and studied in different types of networks [23–28]. It has been shown that the occurrence of negative curvature has implications on the navigability and dynamic processes in networks [29, 30]. The issue of precise mechanisms is still open, perhaps depending on the type of dynamics. In this context, neural connectivity represents a more specific example [31]. To contribute to the efficient flow of information different brain regions continuously communicate with one another, resulting in synchronous fluctuations within characteristic frequency intervals. For this reason, the underlying functional mechanisms can be probed effectively by coupling functions [32], which accurately describes the paths to and from the synchronization [33]. In the case of brain-to-brain coordination networks, the links are emanating from the dynamics—correlations among EEG signals in various pairs of channels across two brains [4]. Moreover, considering neuroanatomy, the brain can be seen as a network embedded in a hyperbolic space [34]. Here, we will show that the corresponding single-brain graphs from EEG data are 1-hyperbolic. Therefore, the emergent negative curvature in two-brain coordination networks and its difference from the involved single-brain graphs appears as a geometric measure of the inter-brain cooperation during the dynamics. Furthermore, for a comprehensive understanding of these geometric features, we examine the structure of simplicial complexes in these networks; these are aggregates of the primary geometric descriptors, i.e., triangles, tetrahedrons, and cliques of higher orders that are present and the ways how they combine making the structure of two-brain graphs. Thanks to the careful design of the original experiment [5] which is complemented with a questionnaire of the listener's experience, we can compare these topology findings with the listeners self-rating of the quality of speaker-listener coordination; the survey was provided with the original data [5]. Based on the analysis of 24 different speaker-listener pairs, our findings indicate that the excess topology structure formed around the channels that have cross-brain connections directly impacts the emergent hyperbolicity of the two-brain coordination networks and correlates well with the improved listeners' experience.
2. Two-Brain Coordination Networks in Spoken Communications Data
The networks comprising of brain-to-brain coordination in the above-mentioned spoken communications are subgraphs of the multi-brain network which is constructed in Tadić et al. [4]. The approach resulting in the adjacency matrix of the studied multi-brain graph is here illustrated in Figure 1. The correlation coefficients among all pairs of EEG signals are considered; for illustration, a pair of such signals is displayed in Figure 1 emanating from two identified channels in different regions on the scalp, shown in the left part of the Figure. In the experiment described in Kuhlen et al. [5], these signals were recorded at 63 points on the scalp of each participant—two speakers and two groups of six listeners. As explained in detail in Tadić et al. [4], to capture the causal effects between the speaker and the listener, we determined the time-delayed correlations between their channels. The exact delay that we apply (6,250 time units by 500 Hz resolution) was first observed in the original work [5] and confirmed by psychologists who also designed this experiment. While the transmission of information within the brain is much faster (about 100 time units), the apparent time delay in cross-brain correlations is likely to relate to some processes relevant to the social brain, such as mentalizing, which allows the participant to perceive and understand the mental state of the speaker and oneself during communications. Comparably, the correlations within each brain are practically instantaneous, as well as the correlations between the two listeners, which are computed without delay. It should be noted that other ways developed in the literature to capture the dynamical causality on different scales for signals originating from physical units are used to analyse EEG signals but with different objectives, see for example Friston [31], Stankovski et al. [33], and Staniek and Lehnertz [35].
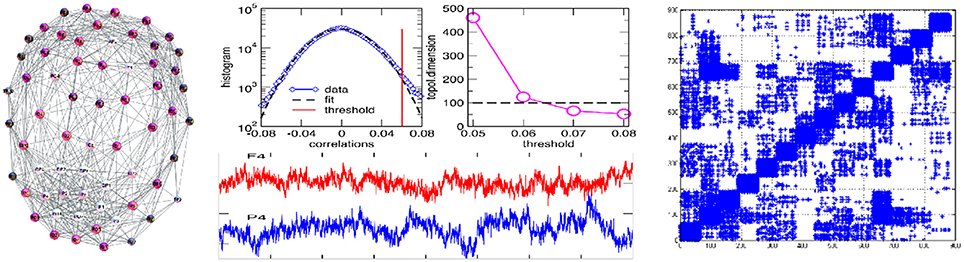
Figure 1. (Left) Single-brain network (speaker S2) with the labels of EEG channels; (Middle) EEG signals originating from the channels F4 in frontal, and P4 in parietal brain region (lower panel); central part of the histogram of correlations with the marked threshold, and the topological dimension of the simplicial complex vs. threshold (top panels). (Right) Multi-brain correlation matrix after filtering, see text and Tadić et al. [4] for more details and the data.
Following the standard procedure for mapping multivariate time series to networks [36, 37], the obtained correlation matrix is filtered to reduce spurious correlations, and then a threshold is applied to distinguish stronger correlations that comprise the adjacency matrix links. It should be noted that, while each channel has a contribution in all segments of correlations, see Figure 1 in Tadić et al. [4], the wights of the links within a brain are generally greater than the weights connecting two different brains. Therefore, the choice of a threshold is the appropriate method for determining a multi-brain network. The chosen threshold satisfies three types of criteria: (i) a formal—deviation of the histogram from Gaussian fits, (ii) a structural—stabilization of the topological dimension of the simplicial complexes, see the image Figure 1 of the middle plates, and (iii) a neurological—modular decomposition as an essential feature of functional brain networks in a conscious state [38, 39] above the threshold. In this mapping, each channel (in total 882) represents a network node while the signal's correlation above the applied threshold indicates that a link occurs between the considered pair of channels. We keep a unique list of the names of nodes indicating the channel and the individual participant, e.g., S2 − Fz indicates the channel Fz on the speaker-2 scalp, and L15 − PO4 stands for the PO4 channel related to L15–the listener number k = 5 in the group g = 1. In the adjacency matrix in Figure 1, the channels are ordered such that groups of 63 channels belong to the speaker-1, speaker-2, then the listeners L1k and L2k, k = 1, 2, ⋯6 in groups g = 1, 2, respectively.
In the adjacency matrix in Figure 1 each diagonal block of the size 63 × 63 nodes represents Single-Brain-Network (SBN), the connectivity pattern related to the brain activity of a particular participant. Whereas, two diagonal blocks together with the points in the off-diagonal block that connects them comprise a Brain-to-Brain Coordination Network (B2BCN). For this work, we consider the speaker-listener pairs resulting in 24 different B2BCN. As it was shown in Tadić et al. [4], the differences in the topology of SBNs indicate that different activity patterns occur in the brains of individuals during the communication process. In the social communication context, the activity of each brain affects the quality of communication while at the same time being under the impact from the others. In the experimental situation that we study, the impact of the speakers on the listeners occurs, and it is contained in the corresponding set of B2BCNs. Figure 2 illustrates some examples of SBNs of particular participants. In the literature, various brain imaging data suggest that community structure appears as an essential feature of functional brain networks [38]. In the present context SBNs exhibit two communities [4] (F–related to channels in the frontal lobe, and P-related to parietal and occipital lobes) that are compatible with the conscious state [38, 39]. In the following, the cross-brain coordination patterns of these and other speaker-listener pairs will be studied. Four examples of B2BCN exhibiting characteristic cross-brain linking are shown in Figure 3.
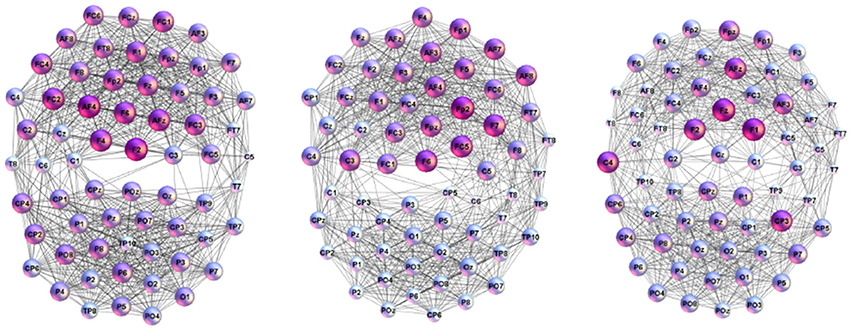
Figure 2. Examples of the connectivity patterns occurring during the spoken communications inside individual brains of the listeners (Left to Right) L16, L21, and L23.
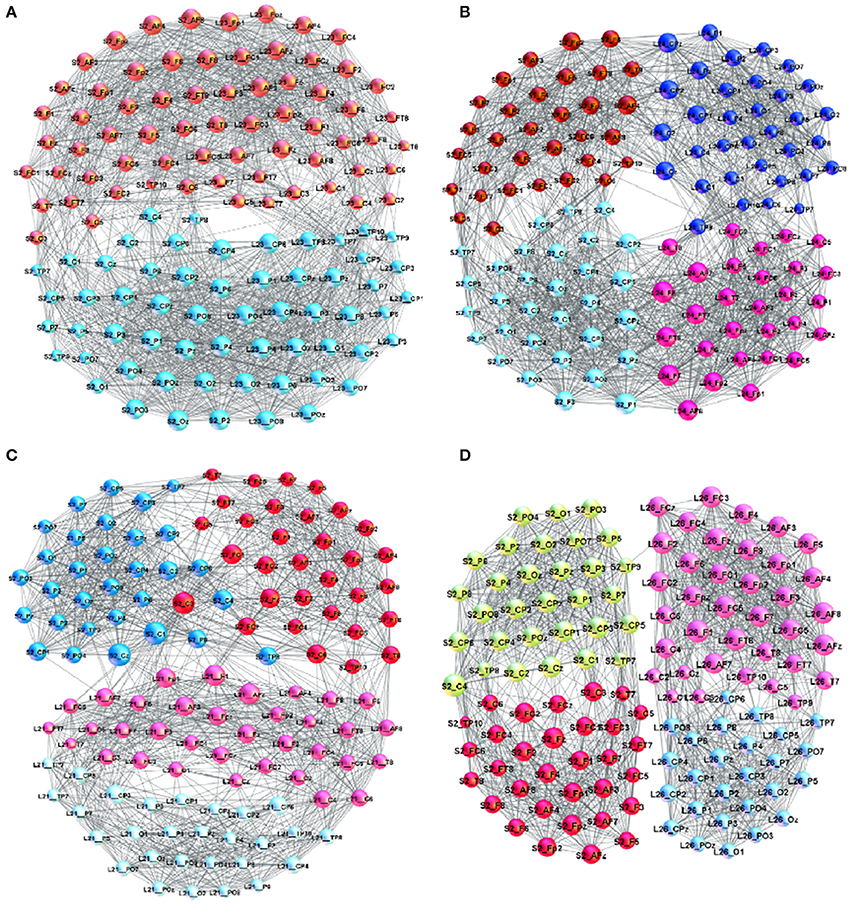
Figure 3. Examples of brain-to-brain coordination networks with a “good” speaker (speaker S2) and (A) L23 (superbrain community structure), (B) L24, (C) L21, and (D) L26.
A detailed analysis of B2BCNs for all speaker-listener pairs in the dataset indicates that significant differences can occur in the patterns of cross-brain connections as well as their community structure. The examples that illustrate four typical patterns occurring in the considered spoken communications data are shown in Figure 3. Apart from the differences of connections among channels in each brain, these B2BCN differ not only in the number of cross-brain connections but also in the brain areas (channels) that are mutually interconnected across two brains as well as the structure occurring among these channels. In the following Section, we quantify these differences with the precise topology analysis of B2BCNs. Moreover, these differences can be connected with the self-rated listener's experience during the communication and the speaker's quality, cf. Table A2 in Appendix.
Here, we briefly describe typical cross-brain connectivity patterns resulting in different global B2BCN structure. In Figure 3A, a large number of cross-brain connections among the listener's frontal lobe and the speaker's frontal lobe and similarly, the listener's parietal with the speaker's parietal lobe results in a “superbrain” community structure. The appearance of two significant F- and P-communities of the B2BCN resembling a single-brain pattern is the topological signature of a good coordination, which also agrees with the listener's self-rated experience and the rates of the speaker's qualities. This example represents an extrem case of inter-brain synchronization. A more typical situation is that four communities occur that are inherited from the two-community structure of each brain. Consequently, the average rating of the quality of coordination is lower than in the case of superbrain structure. Two different patterns can be found, shown in Figures 3B–D. In Figure 3C the cross-brain connections involve only the channels in the listener's frontal lobe linking to both F- and P-channels in the speaker's brain. A situation in Figure 3B shows that a relatively large number of inter-brain connections occur between the listener's frontal with speaker's parietal lobe and similarly the listener's parietal with the speaker's frontal lobe. The number of connections can vary in the pairs until an extreme case with only one cross-brain connection, as in Figure 3D.
In the following, we substantiate on these findings and show how these cross-brain connectivity features impact the emergent hyperbolicity and the occurrence of the higher organized structures between two communicating brains.
3. Emergent Hyperbolicity in Brain-to-Brain Coordination Networks
To quantify the emergent hyperbolicity in various B2BCNs we adopt methodology described in Kennedy et al. [25]; it uses the 4-point criterion for Gromov δ-hyperbolicity [22] measured in the shortest path metric space of the graph. According to Aksoy and Jin [40] there are three equivalent definitions of the δ-hyperbolicity of the shortest path metric of a graph. In particular, for an arbitrary four nodes A, B, C, and D, the distances between all distinct pairs of these nodes are found and their three combination d(A, B) + d(C, D), d(A, C) + d(B, D), and d(A, D) + d(B, C) are sorted ≥ ≥ . For instance, the largest sum corresponds to = d(A, D) + d(B, C), the middle to = d(A, C) + d(B, D), and the smallest to = d(A, B) + d(C, D). The graph is called δ-hyperbolic if there is a fixed value δ>0 for which any four nodes of the graph satisfy the 4-point condition
that is, the difference between the two largest sums does not exceed 2δ. The upper bound, corresponding to the triangle equality, implies that ( − )/2 ≤ dmin, where dmin = min{d(A, B), d(C, D)} refers to the smaller distance in . Therefore, the plot of ( − )/2 against dmin allows investigating the worst case growth of the curvature with the graph diameter.
As also pointed in Kennedy et al. [25], the advantage of the 4-point condition is that the exact path between the pair of nodes is not required, in contrast to 3-point condition. For a given network, we first compute the matrix of the shortest-path distances between all pairs of nodes. Then sampling sets of distinct four nodes, we compute δA, B, C, D defined in Equation (1) and the corresponding dmin. Considering a large number (107) of distinct 4-tuples, we eventually determine 〈δ〉— the average of all δA, B, C, D at given dmin, and plot it against dmin. The evidence of the graph's hyperbolicity is found when this curvature plot saturates at a small value (constant hyperbolicity), or its growth is asymptotically slower (weak hyperbolicity) compared with the graph diameter. We also keep track of the maximum value occurring in all 4-tuples.
As mentioned earlier, the networks from EEG data representing the activity patterns inside each SBN are dense graphs containing large simplicial complexes that are studied in Tadić et al. [4]; here we checked that they are 1-hyperbolic according to the 4-point criterion Equation (1) and have a small diameter D = 3. While δmax = 1 in all cases, their worst case average hyperbolicity 〈δ〉 does not exceed 0.257. Then the hidden geometries of the B2BCN strongly depend on the edges established between two individual brain networks, as we show in the following. Figure 4 displays histograms of the shortest-path distances in all studied B2BCN while Figure 5 shows the corresponding curvature plots.
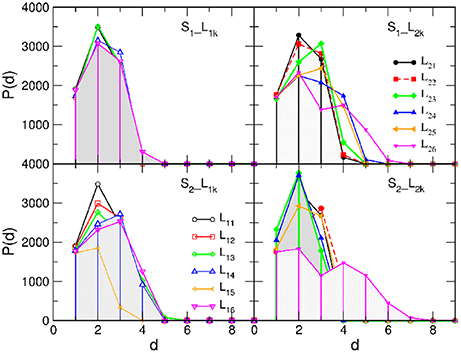
Figure 4. Histograms of the shortest-path distances between nodes in brain-to-brain coordination networks of different listeners (indicated in the legend) with the speaker S1 (Top) and S2 (Bottom) panels.
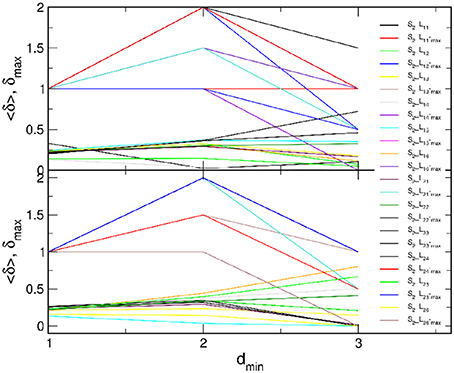
Figure 5. Curvature plots of B2BCN of all speaker-listener pairs: (Top) all listeners with speaker S1 and (Bottom) all listeners with speaker S2 (legend). In each panel, lower curves refer to the average hyperbolicity 〈δ〉 and upper curves to δmax found in the entire network, plotted against dmin.
In the majority of speaker-listener pairs, the distances between nodes in B2BCN are limited to d ≤ 5 with the most probable distance d = 2, in the cases when the listener's group form a network with the appointed speaker (S1L1k and S2L2k), or d = 3, when the speaker is not appointed to the group. The exceptions are the pairs S1L26 and S2L26 where only a few cross-brain links occur, cf. Figure 3D. Consequently, larger distances are observed between certain pairs of nodes (channels) in the two brains and the histogram of the distances exhibits a second peak at d = 4 or d = 5. The appearance of short distances between the channels across the two brains suggests a rather rich structure of connections between the two brain networks. These structures also manifest in the curvature plots in Figure 5. Specifically, for the majority of B2BCN, we find a small value for 〈δ〉 ≤ 0.5. Here, the exceptions are the pairs S2L16 and S2L25 with the speaker S2, and the pair S1L24, with S1. In all cases, we find that the reference distance dmin does not exceed 3 and that the δmax ≤ 2. Apart from the pairs mentioned above with the small number of cross-brain links, where small δ directly refers to the individual SBN, the small values of 〈δ〉 in B2BCN correlate well with the richness of the cross-brain structure. Therefore, to further elucidate the origin of hyperbolicity in B2BCN, in the following we examine the occurrence of simplicial complexes in these networks as well as their parts formed immediately around the channels that make these cross-brain connections.
4. Structure of Simplicial Complexes in Bbrain-to-Brain Coordination Networks
The appearance of higher-order structures, i.e., simplicial complexes, in networks is suitably studied by Q-analysis [41–43] based on the algebraic topology of graphs [44–46]. In the clique complex method [47, 48] that we use here, the elementary geometrical descriptors of the network structure are identified as cliques of different orders q = 0, 1, 2⋯qmax, i.e., nodes, links, triangles, tetrahedra and higher-order cliques up to the largest size qmax + 1 that occurs in the network. Moreover, the method identifies the nodes that make a particular clique, which allows determining the ways that different cliques interconnect with each other via shared faces—cliques of the lower order, to form a simplicial complex. Consequently, based on Q-analysis [41–43], these combinatorial topologies are adequately quantified by the structure vectors of the graph, specifically:
• The first structure vector (FSV) whose components {Qq} represent the number of q-connected classes;
• The second structure vector (SSV) components {nq} are the number of cliques of the order q and higher;
• The third structure vector (TSV) components derived as are used [49] to describe the connectivity among cliques at each topology level.
Here, we compute these structure vectors for each of 24 brain-to-brain coordination networks of speaker-listener pairs. The results are shown in Figure 6. For better comparisons, pairs with the speaker S1 and speaker S2 are displayed in two separate figures, Figures 6A,B, respectively. Also, the results involving the listeners in group-1 are separated (left panels) from the group-2 (right panels in each figure).
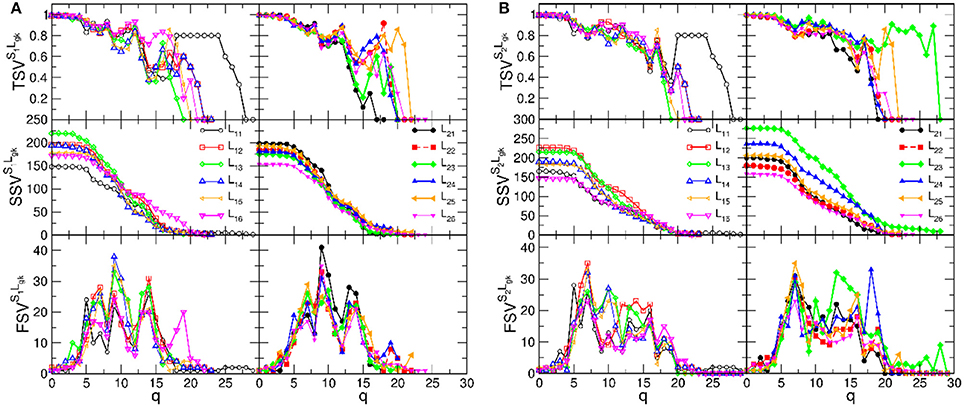
Figure 6. The components of the structure vectors plotted against the topology level q for B2BCN of various speaker-listener pairs. (A) Is for the speaker S1 paired with the listeners in group-1, left panels, and group-2, right panels. (B) Shows the corresponding vectors for same groups of listeners with the speaker S2.
We recall that the structure of each B2BCN consists of two individual SBNs and the cross-brain connections. The topology of the SBNs was studied in detail in Tadić et al. [4]. The observed topology measures, cf. Figure 6, show that networks of the pairs of brains exhibit a richer structure compared to the sum of the two independent brains, suggesting a synergy effect due to coordination between the brains. It is indicative that the new features in the topology vectors of B2BCN are more likely in the speaker-listener pairs involving the appointed speaker than with the other speaker (cf. left panels in the figure A, for the S1, and right panels in the figure B, for the S2). For instance, SSV exhibits considerable values at high q levels for the pairs S2L23 and S2L24, that are missing in the attached left panel. Similarly, SSV has significant value for q > 12 for the pair S1L16, in contrast to the associated right panel. Consequently, the components of the FSV and TSV have large values at these topology levels. The variations of SVs for other speaker-listener pairs are smaller or limited to the lower values of q. Note that some SBNs, such as L11 and L25 exhibit stronger connectivity (seen in TSV) but they do not appear to contribute to the synergy effects in the respective SSV.
Next, we analyse the origin of these synergy effects. At the level of FSV, whose components are additive, we can decompose the contributions for each participating SBN from the combined B2BCN. The results for all speaker-listener pairs depicted in Figure 7 indicate the difference of the corresponding components of the FSV along the topology levels. Again, top panels refer to S1 and listener in two groups and lower panels to S2 with the same listener groups. The deviation of a curve from zero indicates the excess topology, due to the brain-to-brain connections, that does not exist in any one of the participating brains. Again, the diagonal panels (each listener group with the appointed speaker) exhibit more complex extra structure than the off-diagonal panels. The above mentioned pairs S2L23 and S2L24 show particularly large new structure for q > 14. Note that these findings agree with the networks in Figures 3A,B. In the same spirit, but a bit weaker structure refers to the pair S1L16. All other pairs show smaller excess structures, mostly limited to lower topology levels. An exception is the pair S1L21, with a structure at the level q = 10, cf. top right panel in Figure 7. Overall, the synergy between the group-2 with the speaker S2 is stronger compared to the group-1 with the speaker S1. It is interesting to point out that these topology findings compare well with the listener's rating of the speaker's attributes (see Table A2 in Appendix).
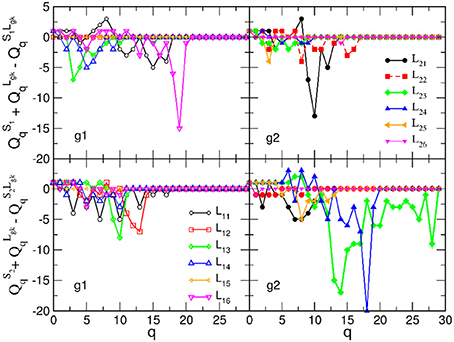
Figure 7. Excess topology beyond the sum of two separated brains in the brain-to-brain coordination networks for all speaker-listener pairs, measured by the difference of the components of the first structure vector at each topology level q and plotted against q. The symbols and colors correspond to Figure 6.
The pattern of cross-brain connections varies from pair to pair both in the number of nodes (channels) that have links to channels in the other brain as well as in the identity of these channels. Here, we identify all channels that are connected across two brains and find out how they are connected to themselves making a sub-graph in the corresponding two-brain network, here termed cross-brain connectivity network (XBCN). In Figure 8 we show some of these cross-brain connection patterns that are related to the excess topology in pairs mentioned above. Table A1 in Appendix lists the graph metric and the hyperbolicity parameters of the XBCN for the pairs in the two groups with their appointed speaker. For comparisons, for each pair, we also list the average rates of the listener's own experience and the speaker's quality, derived from the empirical data (see Table A2 in Appendix). The normalized hyperbolicity of all 24 speaker-listener pairs is summarized in Figure 9 both the XBCN and the corresponding entire B2BCN.
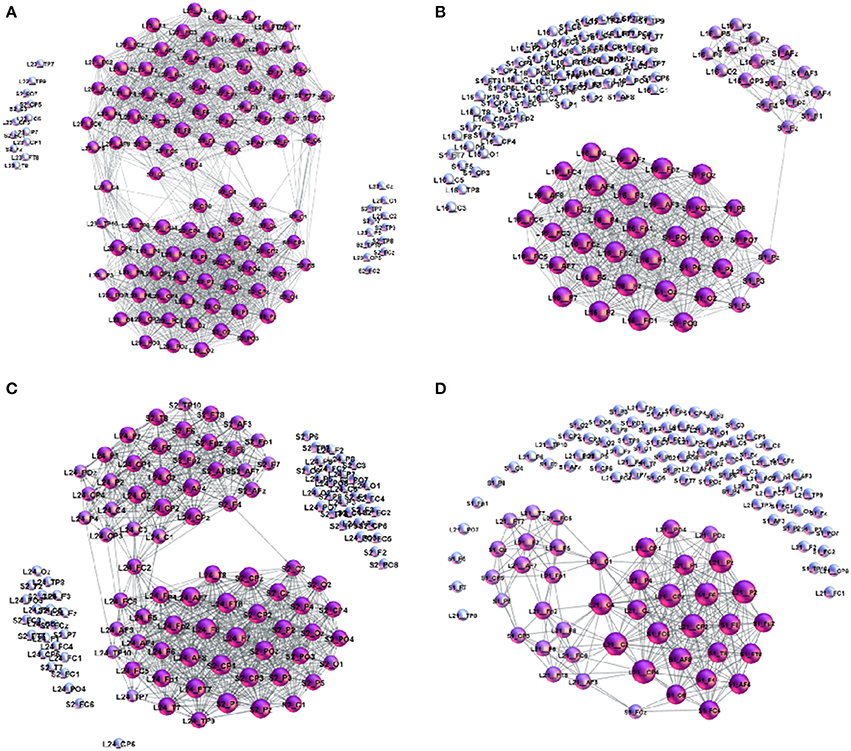
Figure 8. Examples of cross-brain connectivity patterns corresponding to the largest excess topology in Figure 7: (A) S2L23–superbrain, (B) S1L16, (C) S2L24, and (D) S1L21.
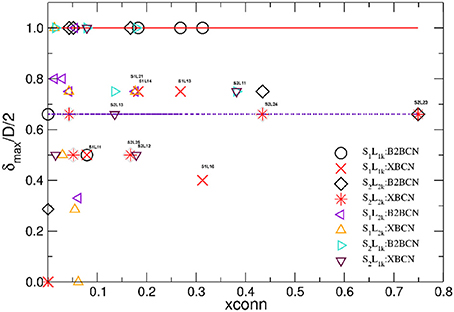
Figure 9. Hyperbolicity δmax/D/2 normalized by the half diameter D of the corresponding network for the brain-to-brain coordination networks (B2BCN) and their cross-brain subgraphs (XBCN) are plotted against the fraction xconn of links in XBCN relative to the entire B2BCN of various speaker-listener pairs. Large symbols are for the groups with the corresponding appointed speaker, while different triangles indicate the pairs with the not-appointed speaker. Full line at the top is the theoretical limit, while the dotted line indicates the hyperbolicity of single-brain networks.
The number of channels that take part in the cross-brain coordination is high in the case of super-brain In Figure 8A, comprising close to 75% of all links; it gradually decreases in other three cases, in agreement with the excess topology features in Figure 7. Above a plausible threshold 15% for the cross-brain connectivity, in Figure 9 we immediately find that: (i) the number of pairs with the appointed speaker is higher than the pairs with the non-appointed speaker; the pairs with the speaker S2 have better connectivity than with the speaker S1. (ii) Few pairs with the non-appointed speaker, namely, S2L11, S2L12 and S1L21 also appear above the threshold connectivity; they also exhibit a nontrivial excess topology in Figure 7. Interestingly, these listeners reported relatively good own experience, see Table A1 in Appendix. The pair S2L13 is not far in the connectivity plot. For the experimental data under consideration, the thresholds show how topological measures can be translated into the people's estimates of the quality of their own experience. Among other pairs exhibiting the cross-brain connectivity below 10% the differences in topology between the pairs with the appointed and non-appointed speaker are less clear.
5. Discussion and Conclusions
Following the algebraic topology approach developed for the multi-brain network in Tadić et al. [4] which is based on the aggregate EEG data measured during spoken communications experiment in Kuhlen et al. [5], we have here analyzed the structure of cross-brain connections in the different speaker-listener pairs. As topological signatures of brain-to-brain coordination, we have studied the appearance of higher organized geometries in the corresponding two-brain coordination networks and their emergent hyperbolicity. Our analysis reveals that the brain activity pattern in each single-brain network is 1-hyperbolic with δmax/D/2 = 0.66. Whereas, hidden geometry in two-brain coordination networks varies within the theoretical limits δmax/D/2 ≤ 1, strictly depending on the connections between brains. In this regard, the key structure is the cross-brain connectivity network, a subgraph containing the channels that have correlations with the channels in the other brain and the direct links between them in both brains. We have identified and analyzed these networks for 24 different speaker-listener pairs related to the stimulus-1 in the experiment mentioned above. The cross-brain connectivity network embodies the synergy of each pair; it can be quantified by the occurrence of an excess topology of the simplicial complexes that are not present in the sum of the two separate single-brain networks along different topology levels. We find that the geometrical complexity of these cross-brain connectivity networks (higher excess topology) improves the hyperbolicity of the two-brain coordination networks. On the other hand, the emergence of surplus topologies closely matches a positive assessment by the listeners of both their own experience and the quality of the speaker.
A particular outcome depends on the number of channels that correlate across the pair of brains (connectivity level) as well as the location of these channels in each brain. The topology features are clear when the cross-brain connectivity is above a plausible threshold, say 10% of all links. In this situation, the listeners make a better coordination with the appointed speaker, in agreement with the statistical analysis in Kuhlen et al. [5]. The pairs with the speaker S2 exhibit more complex topology than those with the speaker S1. Interestingly, their average rates <rSQ> = 5.05 for S1, and <rSQ> = 2.05 for S2, agree with this bias. A few pairs with non-appointed speaker also have a comparable topology measures. In these cases, the listener's self-rating experience is also favorable.
Considering the type of channels involved in cross-brain topologies, we find several prototypal patterns that are described below, cf. Figure 8.
• (a) Super-brain topology patterns consists of a large number of cross-brain connections predominantly between the channels in the listener's frontal area and the speaker's frontal area (FL − FS) and also parietal-to-parietal (PL − PS). The structure is 1-hyperbolic and exhibits two super-brain communities in full analogy to single-brain networks. In these empirical data, an excellent example is the pair of speaker S2 with the listener L23, the network is shown in Figure 3A; in this case, the listener's rates of the speaker's quality as well as own experience are high (1.33), see Table A2 in Appendix, and the graph features in Table A1 (Appendix).
• (b) FL − PS patterns with the connections between the channels in different segments of the scalp; it involves a smaller number of channels and a simpler structure, cf. Figure 8B. The density of the cross-brain connections is lower compared to own-brain connections, which results in four communities inherited from the corresponding single-brain graphs, see Figure 3 for the case S2L24. The listener's rating, in this case, indicates good speaker quality (2.33) however, listener concentration, interest and understanding is average (3.00). A similar structure of channels but a somewhat simpler structure is found in the pair S1L16 (shown in Figure 8C). In this case, the listener's rating of own experience is average (3.00) while the speaker's quality average rate is lower (3.66). The pairs S1L13, S1L14, and S1L11 also have the elements of this pattern.
• (c) FL − PS&FS patterns connects the channels in the listener's frontal area to both the speaker's frontal and parietal wheres the listener's parietal region practically does not have cross-brain connections, cf. Figure 3C of the pair S2L21. The listener's interest in the story was low (4.00) while the average speaker's rate is competent (2.00). Note that the listener L21 also shows an excess topology measure in the pair with the speaker S1, cf. Figure 7 (top right panel) and the corresponding cross-brain graph in Figure 8D.
• (d) Vanishing excess-topology patterns appear in the situations with a few cross-brain links established or, otherwise, the inter-brain correlations are weaker compared to other participants such that they are removed by the filtering on the multi-brain network level. Consequently, the topology of two-brain network is reducible to two independent single-brain networks; the low hyperbolicity parameter δ refers to two single-brain networks. Two extreme examples are involving the listeners L15 and L26 with both speakers, cf. Figures 3D, 7. However, their ratings differ considerably, for instance, L15 ratings show the listener's low interest in the story and low rates for the speaker, while L26 has rather good ratings of the speaker as well as own experience. The deviation from other systematic patterns suggests that these data need further inspection.
In summary, we have demonstrated that the patterns of cross-brain coordination during spoken communication recorded by EEG can be revealed in great details by topology analysis of the corresponding two-brain networks. The occurrence of higher organized structures detectable by algebraic topology methods and with them related emergent hyperbolicity of two-brain graphs is a signature of the quality of brain-to-brain coordination in agreement with the listener's self-rating scores and statistics. Specifically, a good coordination results in the excess topology around the cross-brain connector channels that is not reducible to the patterns observed in the two brains considered separately.
These results show that an appropriate topological analysis of brain activity networks can reveal building blocks of human experience at the level of the individual brain and social brain. Therefore, one may expect that the study of brain-to-brain coordination networks can reveal new insights into the neural mechanisms on which self-awareness and social behavior is based. Among the interesting issues to explore are the changes in topology that follows the shifts in attention and understanding of the content and the possible impact of emotions on interactive communications. This study is still at the beginning, and the amount of data on brain imaging during social communication is continuously increasing. The methodology is not limited to networks that originate directly from the signals of the brain. It is applicable for various types of graphs that result from the actions of individuals controlled by the conscious activity of the brain with possible emotional undercurrents, such as the use of words in textual web communications [50]. In networks that map different types of texts [51–53], the syntactic dependencies of the words and the writing style of each individual are subtle factors that can contribute to the appearance of a local structure with simplicial complexes and a specific hyperbolic geometry. Potentials for the quantification of mental processes by which we detect the information and state of the mind of others and ourselves can initiate further research into the dynamics and topology of particular cross-brain links and can encourage the psychologist to design new experiments, for example, suitable for exploring the relevance of specific contents and emotions in human interactions.
Data Statement
This study is based solely on data derived from and published in Kuhlen et al. [5]. The derived dataset underlying the research in this paper is located in figshar https://figshare.com/s/0a694ad571f18f492fdf. The authors did not have access to identifiable data. An ethics approval was not required as per institutional and national guidelines.
Author Contributions
BT has designed the research. MŠ has contributed analysis tools. MA and BT have performed the analysis. BT has prepared figures and wrote the paper. All the authors have edited the paper.
Funding
BT received financial support from the Slovenian Research Agency under the program P1-0044; MŠ and MA received financial support from the Ministry of Education, Science and Technological Development of the Republic of Serbia, under the projects OI 171037, III 41011 and project OI 174014, respectively.
Conflict of Interest Statement
The authors declare that the research was conducted in the absence of any commercial or financial relationships that could be construed as a potential conflict of interest.
Acknowledgments
We thank the authors of Kuhlen et al. [5] for providing the part of their data for the current analysis; EEG data acquisition was supported by a postdoctoral scholarship to Anna Kuhlen by the Center for Integrative Life Sciences at the Berlin School of Mind and Brain, Humboldt-Universität zu Berlin. The authors acknowledge the support for research visits from the Department of Theoretical Physics, Jožef Stefan Institute.
References
1. Rubinov M, Sporns O. Complex network measures of brain connectivity: uses and interpretations. NeuroImage (2010) 52:1059–69. doi: 10.1016/j.neuroimage.2009.10.003
2. Sporns O. Structure and function of complex brain networks. Dial Clin Neurosci. (2013) 15:247–62.
3. Fallani FDV, Richardi J, Chavez M, Achard S. Graph analysis of functional brain networks: practical issues in translational neuroscience. Philos Trans R Soc Lond B Biol Sci. (2014) 369:20130521. doi: 10.1098/rstb.2013.0521
4. Tadić, B, Andjelković, M, Boshkoska BM, Levnajić, Z. Algebraic topology of multi-brain connectivity networks reveals dissimilarity in functional patterns during spoken communications. PLoS ONE (2016) 11:e0166787. doi: 10.1371/journal.pone.0166787
5. Kuhlen A, Allefeld C, Haynes JD. Content-specific coordination of listeners' to speakers' eeg during communication. Front Hum Neurosci. (2012) 6:266. doi: 10.3389/fnhum.2012.00266
6. Falk E, Bassett D. Brain and social networks: fundamental building blocks of human experience. Trends Cogn Sci. (2017) 21:674–90. doi: 10.1016/j.tics.2017.06.009
7. Adolphs R. The social brain: neural basis of social knowledge. Annu Rev Psychol. (2009) 60:693–716. doi: 10.1146/annurev.psych.60.110707.163514
8. Amodio D, Frith C. Meeting of minds: the medial frontal cortex and social cognition. Nat Rev Neurosci. (2006) 7:268–77. doi: 10.1038/nrn1884
9. Duan L, Liu WJ, Dai RN, Li R, Lu CM, Huang YX, et al. Cross-brain neurofeedback: scientific concept and experimental platform. PLoS ONE (2013) 8:e64590. doi: 10.1371/journal.pone.0064590
10. Duan L, Dai R, Xiao X, Sun P, Li Z, Zhu C. Cluster imaging of multi-brain networks (cimbn): a general framework for hyperscanning and modeling a group of interacting brains. Front Neurosci. (2015) 9:267. doi: 10.3389/fnins.2015.00267
11. Liu N, Mok C, Witt EE, Pradhan AH, Chen JE, Reiss AL. Nirs-based hyperscanning reveals inter-brain neural synchronization during cooperative jenga game with face-to-face communication. Front Hum Neurosci. (2016) 10:82. doi: 10.3389/fnhum.2016.00082
12. Müller V, Sänger J, Lindenberger U. Intra- and inter-brain synchronization during musical improvisation on the guitar. PLoS ONE (2013) 8:e73852. doi: 10.1371/journal.pone.0073852
13. García-Martínez B, Martínez-Rodrigo A, Alcaraz R, Fernández-Caballero A, González P. Nonlinear Methodologies Applied to Automatic Recognition of Emotions: An EEG Review. Cham: Springer International Publishing (2017).
14. García-Martínez B, Martínez-Rodrigo A, Zangróniz Cantabrana R, Pastor García JM, Alcaraz R. Application of entropy-based metrics to identify emotional distress from electroencephalographic recordings. Entropy (2016) 18:221. doi: 10.3390/e18060221
15. Hassan M, Dufor O, Merlet I, Berrou C, Wendling F. EEG source connectivity analysis: from dense array recordings to brain networks. PLoS ONE (2014) 9:e105041. doi: 10.1371/journal.pone.0105041
16. Tadić, B, Gligorijević, V, Mitrović M, Šuvakov M. Co-evolutionary mechanisms of emotional bursts in online social dynamics and networks. Entropy (2013) 15:5084–120. doi: 10.3390/e15125084
17. Zalesky A, Fornito A, Harding IH, Cocchi L, Yocel M, Pantelis C, et al. Whole-brain anatomical networks: does the choice of nodes matter? NeuroImage (2010) 50:970–83. doi: 10.1016/j.neuroimage.2009.12.027
18. Parker CS, Deligianni F, Cardoso MJ, Daga P, Modat M, Dayan M, et al. Consensus between pipelines in structural brain networks. PLoS ONE (2014) 9:e111262. doi: 10.1371/journal.pone.0111262
19. Deco G, Tononi G, Boly M, Kringelbach ML. Rethinking segregation and integration: contributions of whole-brain modelling. Nat Rev Neurosci. (2015) 16:430–9. doi: 10.1038/nrn3963
20. Kim SY, Qi T, Feng X, Ding G, Liu L, Cao F. How does language distance between L1 and L2 affect the L2 brain network? an fmri study of korean chinese english trilinguals. NeuroImage (2016) 129:25–39. doi: 10.1016/j.neuroimage.2015.11.068
21. Jiang J, Dai B, Peng D, Zhu C, Liu L, Lu C. Neural synchronization during face-to-face communication. J Neurosci. (2012) 32:16064–9. doi: 10.1523/JNEUROSCI.2926-12.2012
23. Krioukov D, Papadopoulos F, Kitsak M, Vahdat A, Boguñá M. Hyperbolic geometry of complex networks. Phys Rev E (2010) 82:036106. doi: 10.1103/PhysRevE.82.036106
24. Chen W, Fang W, Hu G, Machoney M. On the Hyperbolicity of Small-World and Tree-Like Random Graphs. LNCS 7676. Berlin; Heidelberg: Springer-Verlag (2012).
25. Kennedy WS, Saniee I, Narayan O. On the hyperbolicity of large-scale networks and its estimation. In: 2016 IEEE International Conference on Big Data (Big Data) (Washington, DC) (2016). p. 3344–51.
26. Bianconi G, Rahmede C. Emergent hyperbolic network geometry. Sci Rep. (2017) 7:41974. doi: 10.1038/srep41974
27. Šuvakov M, Andjelković, M, Tadić, B. Hidden geometries arising in cooperative self-assembly. Sci Rep. (2018) 8:1987. doi: 10.1038/s41598-018-20398-x
28. Cohen N, Coudert D, Ducoffe G, Lancin A. Applying clique-decomposition for computing gromov hyperbolicity. Theor Comput Sci. (2017) 690:114–39. doi: 10.1016/j.tcs.2017.06.001
29. Narayan O, Saniee I. Large-scale curvature of networks. Phys Rev E (2011) 84:066108. doi: 10.1103/PhysRevE.84.066108
30. Albert R, DasGupta B, Mobasheri N. Topological implications of negative curvature for biological and social networks. Phys Rev E (2014) 89:032811. doi: 10.1103/PhysRevE.89.032811
31. Friston KJ. Functional and effective connectivity: a review. Brain Connect. (2011) 1:13. doi: 10.1089/brain.2011.0008
32. Stankovski T, Pereira T, McClintock PVE, Stefanovska A. Coupling functions: universal insights into dynamical interaction mechanisms. Rev Mod Phys. (2017) 89:045001. doi: 10.1103/RevModPhys.89.045001
33. Stankovski T, Ticcinelli V, McClintock PVE, Stefanovska A. Neural cross-frequency coupling. Front Syst Neurosci. (2017) 11:33. doi: 10.3389/fnsys.2017.00033
34. Thomas J, Muscoloni A, Ciucci S, Bianconi G, Cannistraci C. Machine learning meets network science: dimensionality reduction for fast and efficient embedding of networks in the hyperbolic space. Nat Comm. (2017) 8:1615. doi: 10.1038/s41467-017-01825-5
35. Staniek M, Lehnertz K. Symbolic transfer entropy. Phys Rev Lett. (2008) 100:158101. doi: 10.1103/PhysRevLett.100.158101
36. Živković J, Tadić B, Wick N, Thurner S. Statistical indicators of collective behavior and functional clusters in gene networks of yeast. Eur Phys J B (2006) 50:255–8. doi: 10.1140/epjb/e2006-00103-4
37. Živković J, Mitrović M, Tadić B. Correlation patterns in gene expressions along the cell cycle of yeast. In: Fortunato S, Mangioni G, Menezes R, Nicosia V, editors. Complex Networks. Studies in Computational Intelligence, Vol. 207. Berlin; Heidelberg: Springer (2009). p. 23–34. doi: 10.1007/978-3-642-01206-8_3
38. Gronchi G, Guazzini A, Massaro E, Bagnoli F. Mapping cortical functions with a local community detection algorithm. J Comp Netw. (2014) 2:637–53. doi: 10.1093/comnet/cnu035
39. Padovani E. Structure of large scale functional brain networks during Ketamine-Medetomidine anesthetic induction. arxiv:1606.04719 (2016).
40. Aksoy A, Jin S. The apple doesn't fall far from the (metric) tree: the equivalence of definitions. In: Proceedings of the First Conference on Classical and Functional Analysis. Azuga (2014). p. 25–36.
41. Freeman LC. Q-analysis and the structure of friendship networks. Int J Man-Mach Stud. (1980) 12:367–78. doi: 10.1016/S0020-7373(80)80021-6
42. Gould P. Q-analysis, or a language of structure: an introduction for social scientists, geographers and planners. Int J Man-Mach Stud. (1980) 13:169–99. doi: 10.1016/S0020-7373(80)80009-5
43. Atkin R. An algebra for patterns on a complex, II. Int J Man-Mach Stud. (1976) 8:483–98. doi: 10.1016/S0020-7373(76)80015-6
45. Jonsson J. Simplicial Complexes of Graphs. Lecture Notes in Mathematics, Berlin: Springer-Verlag (2008).
46. Kozlov D. Combinatorial Algebraic Topology. Algorithms and Computation in Mathematics, Vol. 21. Berlin; Heidelberg: Springer-Verlag (2008).
47. Bandelt HJ, Chepoi V. Metric graph theory and geometry: a survey. In: Goodman JE, Pach J, Pollack R, editors. Surveys on Discrete and Computational Geometry: Twenty Years Later, vol. 453 (Providence, RI: AMS) (2008). p. 49–86.
49. Andjelković M, Tadić B, Maletić S, Rajković M. Hierarchical sequencing of online social graphs. Physica A (2015) 436:582–95. doi: 10.1016/j.physa.2015.05.075
50. Gonzales AL. Text-based communication influences self-esteem more than face-to-face or cellphone communication. Comput Hum Behav. (2014) 39:197–203. doi: 10.1016/j.chb.2014.07.026
51. Ferrer I, Cancho R, Sole RV, Kohler R. Patterns in syntactical dependendency networks. Phys Rev E (2004) 69:051915. doi: 10.1103/PhysRevE.69.051915
52. Amancio DR, Oliveira ON Jr, da Fontoura Costa L. Structure-semantics interplay in complex networks and its effects on the predictability of similarity in texts. Physica A (2012) 391:4406-19. doi: 10.1016/j.physa.2012.04.011
53. Amancio DR. A complex network approach to stylometry. PLoS ONE (2015) 10:e0136076. doi: 10.1371/journal.pone.0136076
Appendix
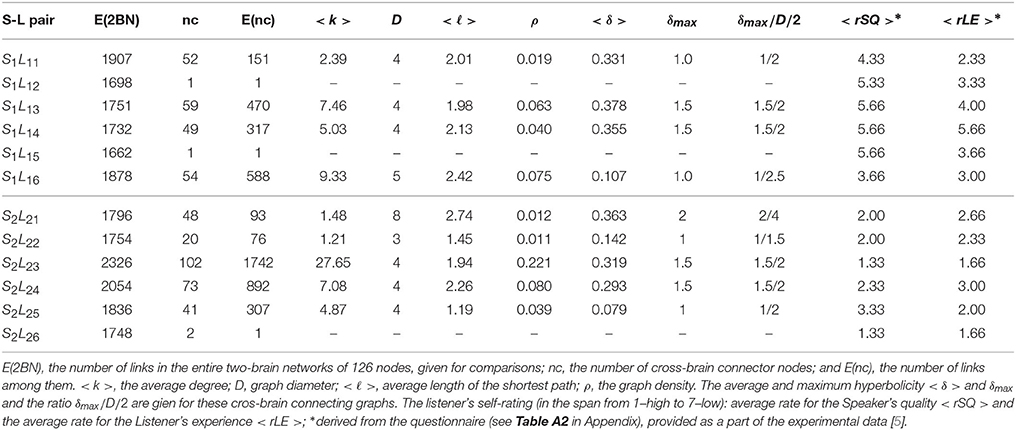
Table A1. Properties of the subgraphs formed by the cross-brain connector nodes, cf. Figure 8, in different Speaker-Listener pairs in group one (top part) and group two (lower part).
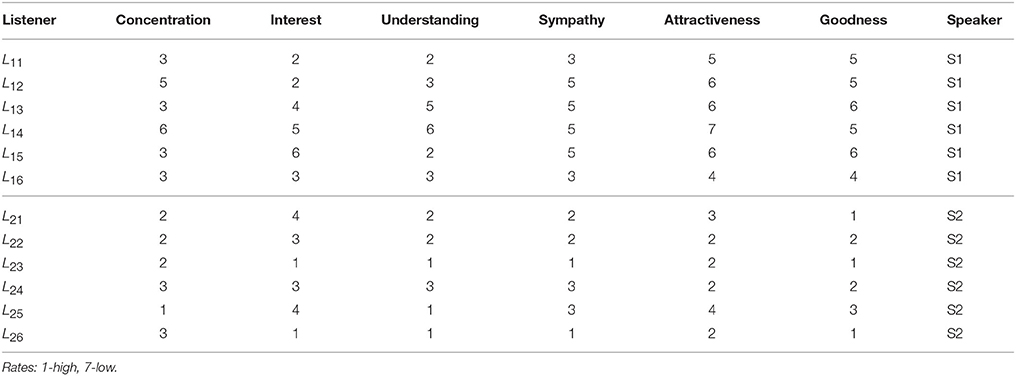
Table A2. Results of the Questionnaire provided with the original data [5]: Listeners, the first column, self-rating experience (concentration, interest, understanding) of an unknown story, and sympathy to the appointed speaker and the speaker's attractiveness and goodness.
Keywords: brain-to-brain coordination networks, hyperbolicity of graphs, algebraic topology, social brain, multi-brain networks
Citation: Tadić, Andjelković M and Šuvakov M (2018) Origin of Hyperbolicity in Brain-to-Brain Coordination Networks. Front. Phys. 6:7. doi: 10.3389/fphy.2018.00007
Received: 06 December 2017; Accepted: 25 January 2018;
Published: 12 February 2018.
Edited by:
Matjaž Perc, University of Maribor, SloveniaReviewed by:
Diego R. Amancio, University of São Paulo, BrazilTomislav Stankovski, Saints Cyril and Methodius University of Skopje, Macedonia
Copyright © 2018 Tadić, Andjelković and Šuvakov. This is an open-access article distributed under the terms of the Creative Commons Attribution License (CC BY). The use, distribution or reproduction in other forums is permitted, provided the original author(s) and the copyright owner are credited and that the original publication in this journal is cited, in accordance with accepted academic practice. No use, distribution or reproduction is permitted which does not comply with these terms.
*Correspondence: Bosiljka Tadić, bosiljka.tadic@ijs.si