
ORIGINAL RESEARCH article

Front. Phys., 30 June 2021
Sec. Chemical Physics and Physical Chemistry
Volume 9 - 2021 | https://doi.org/10.3389/fphy.2021.691727

Controlling H3+ Formation From Ethane Using Shaped Ultrafast Laser Pulses

www.frontiersin.orgTiana Townsend1 www.frontiersin.orgCharles J. Schwartz1 www.frontiersin.orgBethany Jochim2 www.frontiersin.orgKanaka Raju P.2,3 www.frontiersin.orgT. Severt2 www.frontiersin.orgNaoki Iwamoto1 www.frontiersin.orgJ. L. Napierala1 www.frontiersin.orgPeyman Feizollah2 www.frontiersin.orgS. N. Tegegn1 www.frontiersin.orgA. Solomon1 www.frontiersin.orgS. Zhao1 www.frontiersin.orgK. D. Carnes2 www.frontiersin.orgI. Ben-Itzhak2 www.frontiersin.orgE. Wells1*
  • 1Department of Physics, Augustana University, Sioux Falls, SD, United States
  • 2J. R. Macdonald Laboratory, Physics Department, Kansas State University, Manhattan, KS, United States
  • 3School of Quantum Technology, DIAT(DU), Pune, India

An adaptive learning algorithm coupled with 3D momentum-based feedback is used to identify intense laser pulse shapes that control H3+ formation from ethane. Specifically, we controlled the ratio of D2H+ to D3+ produced from the D3C-CH3 isotopologue of ethane, which selects between trihydrogen cations formed from atoms on one or both sides of ethane. We are able to modify the D2H+:D3+ ratio by a factor of up to three. In addition, two-dimensional scans of linear chirp and third-order dispersion are conducted for a few fourth-order dispersion values while the D2H+ and D3+ production rates are monitored. The optimized pulse is observed to influence the yield, kinetic energy release, and angular distribution of the D2H+ ions while the D3+ ion dynamics remain relatively stable. We subsequently conducted COLTRIMS experiments on C2D6 to complement the velocity map imaging data obtained during the control experiments and measured the branching ratio of two-body double ionization. Two-body D3+ + C2D3+ is the dominant final channel containing D3+ ions, although the three-body D + D3+ + C2D2+ final state is also observed.

1 Introduction

The intramolecular migration of hydrogen continues to be an active area of investigation in ultrafast science [111] with implications for topics ranging from combustion [12] to peptide dissociation [13] and characterizing conformational differences in molecules [14, 15]. In some cases the migration of hydrogen leads to the formation of new molecular ions, such as H3+ [5, 1621], by processes such as H2 roaming or double hydrogen migration [18, 19, 22, 23].

The formation of H3+ is usually a multi-step process that often involves the association of hydrogen atoms from different sites of the parent molecule. In allene (C3H4), at least one hydrogen migration to the other side of the molecule is required [24, 25]. Even in molecules that contain a methyl group with three hydrogen atoms close together, there are H3+ formation pathways that involve hydrogen atoms from other parts of the parent molecule. Methanol is perhaps the best studied example of this behavior [5, 1621, 2629]. In methanol (CH3OH), there is clear evidence that H3+ may form when a roaming H2 from the methyl side abstracts the hydroxyl proton in addition to alternative mechanisms that only involve the methyl side. For ethanol (CH3CH2OH) and several slightly longer alcohol molecules, multiple pathways to H3+ formation exist that involve hydrogen migration, although the relative importance of these pathways decreases as the carbon chain length increases [19, 20].

Ethane (C2H6) is composed of two back-to-back methyl groups, and thus it is an excellent baseline system for examining hydrogen-related bond rearrangement. H3+ formation following double ionization of ethane has been examined in several previous experimental and theoretical studies [16, 3035]. Kraus and co-workers theoretically identified a minimum-energy-path transition state with a neutral hydrogen molecule attached to a C2H42+ ion that led to the H3+ + C2H3+ final state [31]. Their calculations were in good agreement with the measured kinetic energy release (KER) of these final products, in which the KER is essentially the reverse activation energy along the proposed reaction path. Kanya et al. showed, using different isotopologues of ethane, that hydrogen atoms are statistically scrambled between the initial and final states following double ionization [32]. In a later study, Boran et al. proposed a pathway that begins with hydrogen elimination (H + C2H52+) and continues through a sequence of transition states leading to a neutral hydrogen molecule attached to a C2H32+ ion followed by dissociation into C2H2+ + H3+ [34]. Recent electron impact studies by Zhang et al. suggest the presence of an additional roaming-induced isomerization pathway that leads to H3+ formation on a longer timescale than the transition-state pathways [35].

Motivated by significant H3+ yields from the dissociation of ethane dications, the suggestions of multiple pathways that lead to H3+ formation following double ionization of ethane, and the sensitivity of the H3+ production to laser pulse parameters reported by Schirmel and co-workers [33], this article reports our efforts to manipulate the formation of H3+ using shaped ultrafast laser pulses.

2 Experimental Method

The experimental techniques applied in this study have recently been discussed elsewhere [21, 36], and in this section we will only highlight a few key points. Two different approaches are used to examine the interactions of intense laser pulses with ethane gas: First, the laser pulses are shaped using an acousto-optic programmable dispersive filter (AOPDF) [37] and the ethane reaction products are measured using velocity map imaging (VMI) [38, 39]. Second, COLd Target Recoil Ion Momentum Spectroscopy (COLTRIMS) [40, 41] characterizes the dissociation dynamics of the ethane molecule following strong-field ionization.

2.1 Shaped Pulses and Velocity Map Imaging

In the shaped pulse/VMI portion of the experiment linearly polarized pulses with a duration of 35 fs full-width at half-maximum (FWHM) in intensity and a center wavelength of 785 nm are generated at 1 kHz by a Ti:Sapphire laser system named KLS. In this laser system, the compressor grating pair is in the Treacy configuration [42] while the stretcher gratings are in the Martinez configuration [43]. The amplified pulse energy of about 1.5 mJ was attenuated to the levels needed in the experiment. These near-Fourier-transform limited pulses will be denoted as TL pulses in this article. The acousto-optic programmable dispersive filter [37] was placed between the laser oscillator and multi-pass amplifier. In this experiment, we controlled only the spectral phase of the laser pulse. Pulse characteristics were determined using a second-harmonic-generation frequency-resolved-optical-grating (SHG-FROG) [44] device. Our version of VMI [4547] integrates the momentum image of a given m/q time-of-flight peak over many laser shots by fully powering the detector within a specific time window. For a typical trial pulse, we collected VMI data for 5,000 laser shots for D2H+ and 35,000 laser shots for D3+ in order to obtain similar statistics for each ion. While our VMI approach does not measure correlated information about all the products from a specific laser-molecule interaction, it enables rapid data acquisition, making adaptive control experiments possible [48, 49]. Typical VMI data obtained with the online inversion method [47] are shown in Figures 1A,B.

FIGURE 1
www.frontiersin.org

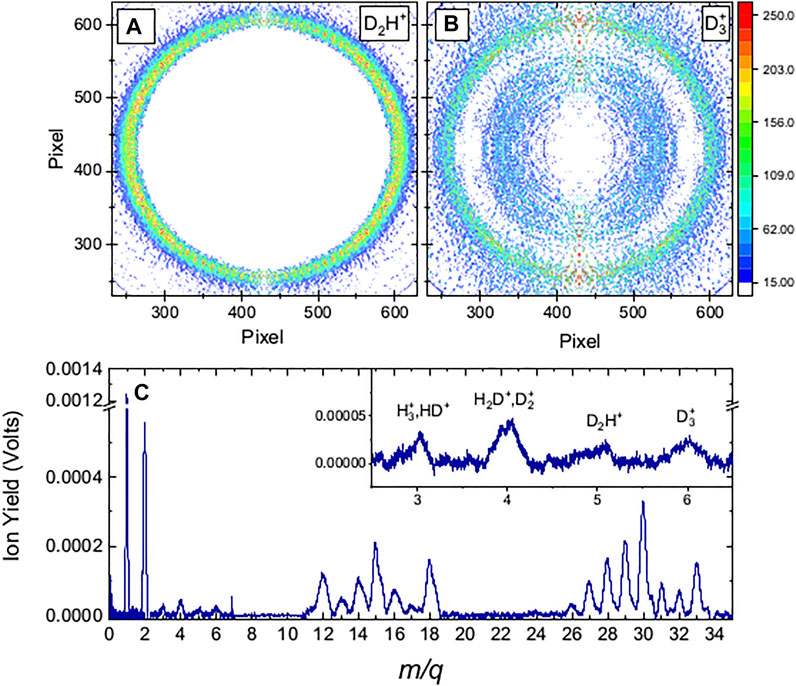
FIGURE 1. Molecular fragmentation data obtained with 35 fs FWHM, 1.3 × 10¹⁴ W/cm2 pulses centered at 785 nm, the conditions used in the closed-loop experiment. (A) Inverse Abel transformed VMI of D2H+ ions. (B) Inverse Abel transformed VMI of m/q=6, which contains D3+ and C2+ ions. At this intensity, the two features are separated, with the C2+ ions inside the D3+ ring. The laser polarization is vertical for the VMI data. (C) Current mode time-of-flight (shown as a function of m/q) showing that the integrated yield of the m/q=5 and m/q=6 peaks are similar. When only the yield from the higher momentum feature in the m/q=6 is considered, the ratio of D2H+ to D3+ is approximately 7:1, in agreement with the results of Kanya et al. [32]. The laser polarization is perpendicular to the time-of-flight axis in (C).

In the closed-loop adaptive control approach, ion-specific three-dimensional momentum information provides the feedback to drive a genetic algorithm that optimizes the pulse shapes to a control objective [46, 47]. The raw VMI data is inverted on-the-fly to recover a slice through the center of the three-dimensional momentum distribution using a modified “onion-peeling” algorithm as described by Rallis et al. [47]. The yield within user-defined regions of interest on the momentum plot is then evaluated, resulting in a numerical value that defines the “fitness” of the laser pulse being examined. The adaptive search parameterizes the pulse characteristics in terms of the spectral phase, which is broken into 16 evenly spaced segments between 734 and 830 nm. Since a portion of this range is beyond the pulse bandwidth, the effective number of search parameters is somewhat smaller than 16. Linear interpolation fills in the values between the adjacent phases. The algorithm is allowed to adjust each phase value between 0 and 2π.

To complement the closed-loop studies, systematic scans of the second- and third-order pulse dispersion were made for a few values of fourth-order dispersion. In this pulse-parameterization scheme [21, 50, 51], we describe the spectral phase, φ(ω), as a Taylor series expansion [52]:

φ(ω)=φ(0)+φ(1)(ωω0)1!+φ(2)(ωω0)22!+φ(3)(ωω0)33!+φ(4)(ωω0)44!+.(1)

2.2 Coincidence Momentum Imaging

In the COLTRIMS [40, 41] measurement, the laser pulses are produced by the PULSAR laser [53] at 10 kHz, with 25-fs (FWHM in intensity) pulse duration, a central wavelength of 790 nm, and maximum pulse energy of 2 mJ. The laser pulses were again characterized with SHG-FROG. The pulses are focused by a f=7.5-cm spherical mirror onto randomly oriented target molecules in the supersonic molecular beam of the COLTRIMS apparatus. Following the laser-molecule interaction within the electric field of the spectrometer, all the charged ethane photofragments are directed toward a time- and position-sensitive detector where they are measured in coincidence. The base pressure in the spectrometer region was below 2 × 10⁻¹⁰ Torr. Since the charged fragments are recorded on an event-by-event basis, we can use the measured time and position of all the charged fragments along with conservation of momentum to determine the three-dimensional momentum distributions.

3 Results and Discussion

The experiments on D3C-CH3 (1,1,1-d3 ethane, 98% pure) with shaped pulses and VMI detection used both an adaptive search strategy and a systematic search of pulse parameters. With this target, D3+ fragments must originate from only one side of the parent molecule, while D2H+ fragment formation must involve both sides of the parent molecule. While the D3C-CH3 target allows us to determine which hydrogen atoms participate in the bond rearrangement process, the m/q=6 channel contains both the D3+ channel of interest and C2+ fragments [30]. At laser intensities that did not have a significant yield of C+ ions (around 8×10¹³ W/cm2), for which we could assume there was no C2+ signal, the D3+ signal rate was too low for adaptive control experiments.

As the intensity was increased, the VMI of the m/q=6 ions began to have two features, as shown in Figure 1B. The outer feature, corresponding to a KER of around 5 eV, remained at that KER as the intensity increased. In contrast, both the signal size of the inside feature relative to the ≈5 eV feature and the radius of the inner feature in Figure 1B increased with intensity. We assume this inner feature, which is more aligned with the laser polarization at higher intensities, is caused by C2+ ions. At 1.3 × 10¹⁴ W/cm2, the total yields of m/q=5 and m/q=6 are similar, as shown in Figure 1C. Using the VMI information, we can separate the two features in momentum space. The range of interest is shown by the vertical lines in Figures 2B,C. After separation of the C2+ from the D3+ and correction for different image exposure times, the ratio of D2H+ to D3+ is approximately 7:1, as expected from the time-of-flight studies performed by Kanya et al. on different isotopologues of ethane [32].

FIGURE 2
www.frontiersin.org

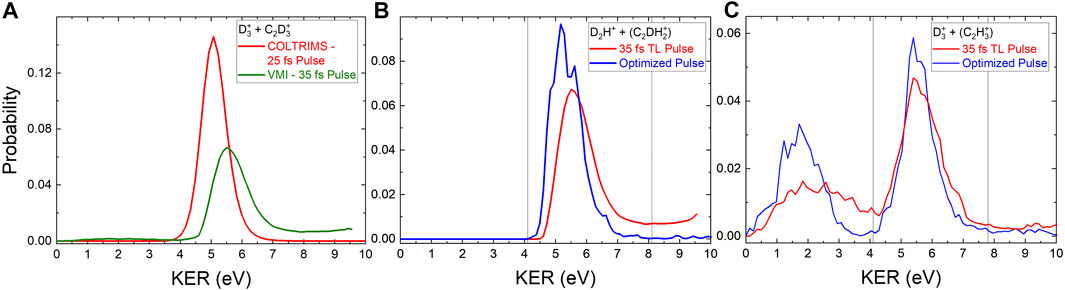
FIGURE 2. (A) The red line shows the probability for two-body D3+ + C2D3+ fragmentation as a function of kinetic energy release (KER) measured with COLTRIMS. To compare the COLTRIMS and VMI measurements, we added the D2H+ and D3+ ions measured with VMI in a 7:1 ratio and plotted the combined probability for dissociation as a function of KER (olive line). (B) The VMI-derived KER distribution for D2H+ ions assuming two-body breakup of D3C-CH3 into D2H+ + C2DH2+. The red line represents the KER distribution produced by the transform limited (TL) pulse. The blue line is the KER distribution produced by the optimized pulse. The peak of the KER distribution from the optimized pulse is 0.3 eV lower than the peak of the KER distribution from the TL pulse. (C) The KER distributions for the D3+ channel assuming two-body breakup into D3+ + C2H3+ initiated by a TL (red) and optimized (blue) pulse. The vertical lines in (B) and (C) indicate the edges of the regions used to calculate the fragment yield in the adaptive control experiment. The lower-KER structure in (C) is thought to be C2+.

3.1 Pulse Shaping and Control

We were able to increase the D2H+:D3+ ratio by a factor of 3.2 ± 0.7 using adaptive control. With phase-only shaping the pulse energy is kept constant at around 11 μJ/pulse, which corresponds to a peak intensity of 1.3 × 10¹⁴ W/cm2. Experiments at slightly higher pulse energy also resulted in a D2H+:D3+ ratio higher than obtained with a TL pulse, but we observed significant overlap between the C2+ and D3+ fragments making it difficult to evaluate these results. When attempting to optimize the inverse D3+:D2H+ ratio, we did not observe any improvement over the TL 35-fs pulse.

Figure 2 shows the KER distributions obtained for the D2H+ and D3+ fragments with the optimized pulses and TL pulses. For the VMI data, we calculate the KER by assuming a two-body breakup of the D3C-CH3 parent molecule into an ion pair. For comparison, the KER distribution of C2D62+D3++C2D3+ directly measured with COLTRIMS is shown in Figure 2A. The KER distributions are similar, although the COLTRIMS measurement is slightly lower. This could be due to small differences in the respective momentum/energy calibration or the slightly different pulse characteristics. As described in the introduction, Kraus et al. [31] and Boran et al. [34] have examined the dissociation pathways leading to H3+ formation from ethane and found KER values peaked between 5.2 and 5.5 eV. Zhang and co-workers have observed a slightly lower KER in recent electron-impact studies and suggested a different dissociation pathway [35].

Notably, the D2H+ KER distribution obtained with the pulse optimized to increase the D2H+:D3+ ratio is shifted about 0.3 eV lower than the KER distribution obtained with the TL pulse. The corresponding KER distribution for the D3+ yield, which is in the denominator of the control objective, shows no significant shift. In addition, the increase in the D2H+:D3+ ratio was due to an increase in D2H+ yield, not a reduction of D3+ yield. In some similar experiments, this combination of indicators has been a signature of a barrier-suppression mechanism [46]. Several of the theoretical efforts with ethane [31, 34, 35] identified one or more transition states in the dissociation process. If the energy of the transition state was modified by the field at an appropriate time, it could promote D2H+ production.

The characteristics of the optimized pulse are shown in Figure 3. While there is indeed a trailing secondary pulse around 125 fs after the main pulse, there are other features of the pulse shape that could be significant. To try and determine which pulse parameters are important for the manipulation of the control objective, we systematically scanned the linear chirp and third-order dispersion for three values of fourth-order dispersion. During these systematic scans we recorded the D2H+ and D3+ yields, shown in Figure 4, using the same gates on the VMI data as in the adaptive control experiment.

FIGURE 3
www.frontiersin.org

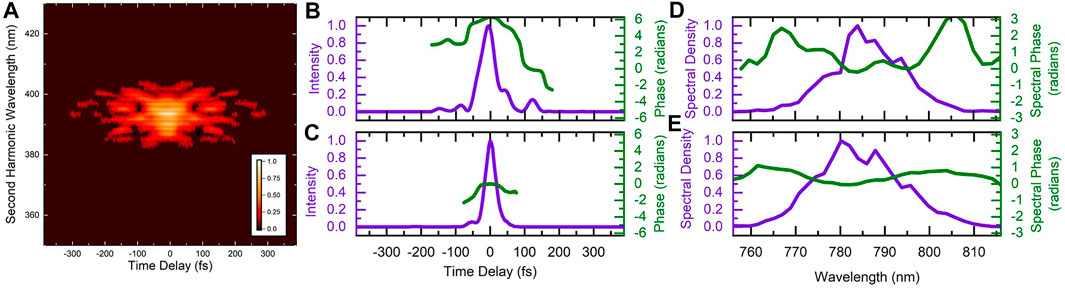
FIGURE 3. (A) Measured frequency-resolved-optical-grating trace of the laser pulse optimized to increase the D2H+:D3+ ratio. (B) The retrieved intensity (violet) and temporal phase (green) of the optimized pulse. While second-harmonic-generation is symmetric with respect to time, this ambiguity can be removed with the additional information from the pulse shape parameters. (C) The retrieved intensity and temporal phase of an unshaped laser pulse for comparison, using the same color scheme. (D) The retrieved spectral density (violet) and phase (green) of the optimized pulse. (E) The unshaped spectral density and phase for comparison, again with the same color scheme.

FIGURE 4
www.frontiersin.org

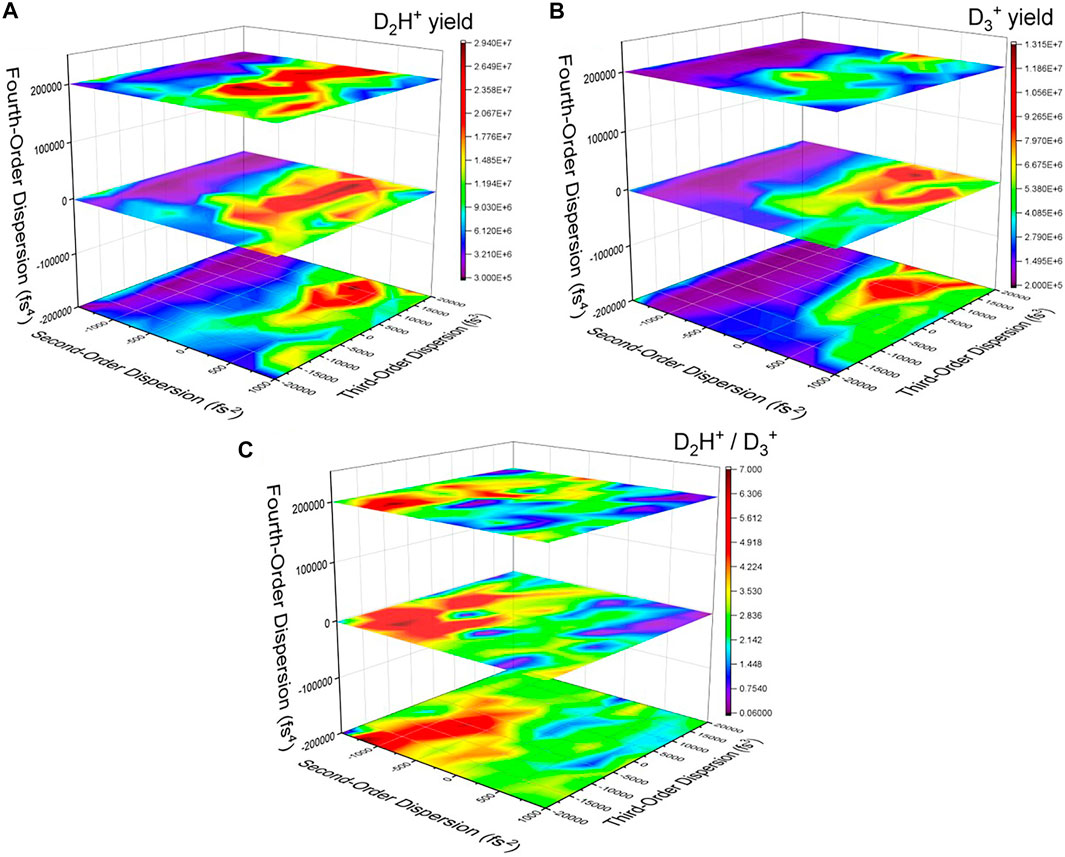
FIGURE 4. The yield of (A) D2H+ and (B)D3+ as a function of second—and third-order dispersion for three values of fourth-order dispersion. In these measurements, the pulse energy is kept constant, so the intensity decreases as the dispersion lengthens the pulses. (C) The D2H+:D3+ ratio as a function of the same pulse parameters. The ratio is defined to be 1.0 at φ(2)=φ(3)=φ(4)=0.

From a time-domain perspective, the second–and fourth-order dispersions lengthen the pulse symmetrically, while the third-order dispersion adds a pedestal either before or after the main pulse (see, e.g., Ref. 50). Thus, some of the temporal characteristics of the optimized pulse (Figure 3) can be reproduced, but the secondary pulse would be more difficult to construct using dispersive pulse parameters. As shown in Figure 4C, there are a number of combinations of pulse parameters that reach nearly the same level of effectiveness at manipulating the D2H+:D3+ ratio as the optimized pulse. The highest values of the D2H+:D3+ ratio are seen at negative values of both φ(2) and φ(3). In this region of parameter space, the yield of the individual channels have both been reduced by roughly a factor of 10. Therefore, while the adaptive and systematic search strategies can both find pulses that improve the control objective, and thus distinguish between formation of trihydrogen cations from one side of the parent molecule or both sides of the parent molecule, the adaptive search result maintains the overall yield better than the systematic search. This result is similar to the observations in a recent methanol experiment [21].

One curious element of the dispersion scan is the comparison to the previous work of Schirmel et al., who also examined H3+, D2H+, and D3+ yields from various isotopologues of ethane as a function of second-order dispersion (linear chirp) [33]. Our results match the results of Schirmel et al. in the sense that the sign of the linear chirp matters in the production of H3+. This is somewhat unusual, since dissociation rates rarely seem to depend on the sign of the chirp [54]. Our results show increases in D2H+ and D3+ yields, as well as an increasing D2H+:D3+ ratio, for positive linear chirp, with a maximum around φ(2)=+250fs2. This is in direct contrast to the result of Shirmel and co-workers who reported that negative linear chirp increases the yield of H3+ and other fragments from ethane, with a maximum at φ(2)1000fs2. They also report an essentially constant D2H+:D3+ ratio as a function of chirp.

One possible explanation for the seemingly conflicting results is that different intensities lead to different dissociation dynamics. The TL intensity of 1.3 × 10¹⁴ W/cm2 used in this experiment is higher by about a factor of two than the highest intensity pulses used by Schirmel et al. [33]. In both our scans of the dispersion parameters and those of Schirmel et al., the pulse energy was kept constant. Schirmel et al. also noted that as the pulse energy increased in their experiments, the value of linear chirp that produced the most fragmentation became closer to zero (more positive). It is possible that our results simply continue this trend, although if the intensity is becoming the dominant factor in the dynamics it is unclear why zero dispersion does not produce a maximum or a minimum. We note that our D2H+ and D3+ yields also increased for φ(3)>0 and changing φ(4) had limited effect. Additional work, including a more detailed study of how dispersion and intensity combine to influence the dissociation dynamics, is needed to resolve these issues.

3.2 Branching Ratio

Another factor potentially confounding our understanding of how the production of H3+ can be manipulated with shaped laser pulses is the likelihood that more than one dissociation pathway is active. To partially address this issue, we performed COLTRIMS measurements of laser-induced dissociation of C2D6. We selected C2D6 as a target because D3C-CH3 was financially prohibitive for use in a supersonic jet without a buffer gas. While the peak intensities were similar in the COLTRIMS and VMI measurements, the pulse duration in the COLTRIMS measurements was 25 fs, i.e., significantly shorter than the 35 fs in the VMI case. As an approximate guide, we note that the Keldysh parameter [55] is approximately 0.9 for 1.3 × 10¹⁴ W/cm2 pulses and the 11.52 eV ionization potential of ethane [56]. When the pulses are lengthened by pulse shaping the corresponding decrease in intensity raises the Keldysh parameter. The quasi-static approximation used in tunnel ionization is therefore not clearly valid in any of the experiments described here. Figure 5 shows the relevant portion of the coincidence-time-of-flight (CTOF) plot. Following the procedure outlined in Ref. 36 for removing false coincidences, we use this data to obtain the two-body double-ionization branching ratio reported in Table 1.

FIGURE 5
www.frontiersin.org

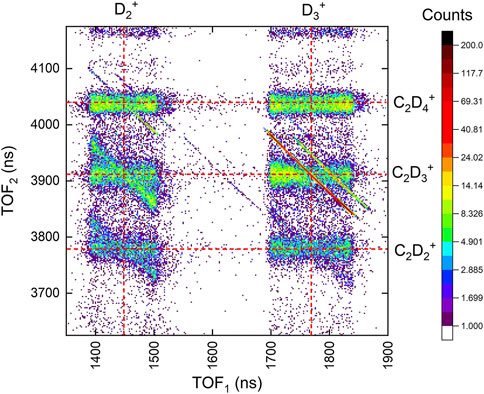
FIGURE 5. The portion of the coincidence-time-of-flight map of two-body channels including D2+ and D3+ fragments from C2D6 exposed to a 25-fs, 790-nm, 1.5 × 10¹⁴ W/cm2 laser pulse.

TABLE 1
www.frontiersin.org

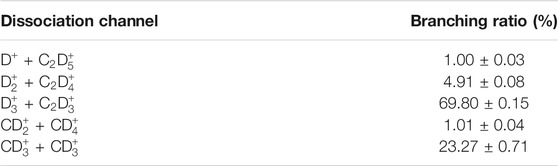
TABLE 1. Ethane (C2D6) branching ratios for two-body double ionization by 25-fs, 1.5 × 10¹⁴-W/cm2 laser pulses centered at 790-nm.

We also analyzed the three-body D + D3+ + C2D3+ channel. While the D3+ + C2D2+ ion pair is visible in Figure 5, the momentum carried by the neutral deuterium atom smears out the corresponding island in the CTOF plot compared to the sharp two-body channels. The detailed corrections needed to reach the level of precision given in Table 1 for three-body channels is time-consuming because of contributions from three-body channels containing three ions. By making some simplifying assumptions about which channels provide the most significant background, however, we estimate the D + D3+ + C2D2+ yield is 16 times smaller than the main D3+ +C2D3+ channel.

Using momentum conservation to deduce the contribution from the deuterium atom gives a KER distribution for this three-body channel, shown in Figure 6. The KER distribution is similar to the C2D62+D3++C2D3+ KER distribution shown in Figure 2C and also the prediction of Boran et al. [34] for a C2D62+D+C2D52+D+D3++C2D2+ process.

FIGURE 6
www.frontiersin.org

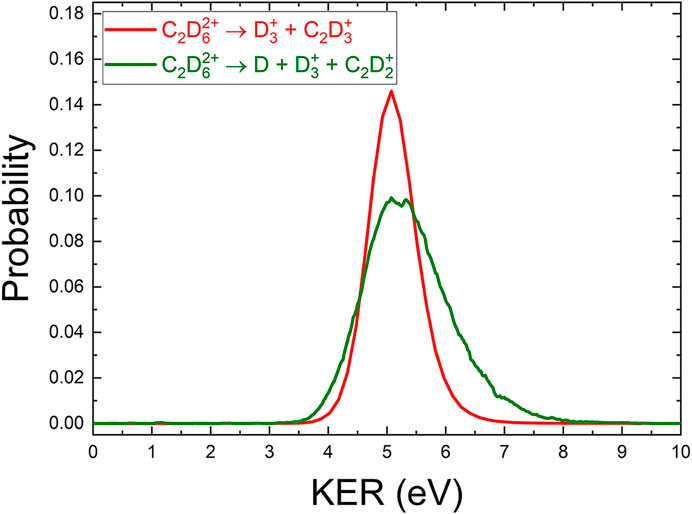
FIGURE 6. A comparison of the (COLTRIMS-derived) KER spectrum of D3+ + C2D3+ (red) and D + D3+ + C2D2+ (olive) produced by 25 fs, 1.5 × 10¹⁴ W/cm2 laser pulses centered at 790 nm.

In addition, we did not find any significant evidence for D3+ production from the monocation, that is, D3+ + neutral fragments. Such a process would typically have low KER and there are negligibly few D3+ ions at low kinetic energy. Thus, we can conclude that we observe two, and only two, final channels that result in D3+ ions: two-body D3+ + C2D3+ and three-body D + D3+ + C2D2+. Of these, the two-body channel has the larger yield. When considering the results of our control experiments, it is likely that the main channel involved is a two-body double ionization process.

3.3 Angular Distributions

Since the control experiments with the D3C-CH3 isotopologue of ethane are designed to distinguish between the involvement of the hydrogen atoms on one or both sides of the molecule, the angular distributions from the VMI data might provide information about the dissociation dynamics beyond the KER shift shown in Figure 2B. Since the angular COLTRIMS data can be readily corrected using available experimental symmetries [36], we compared the COLTRIMS-measured D3+ + C2D3+ angular distribution to the weighted sum of the D2H+ and D3+ VMI angular distributions to derive a function that ensured uniform detection efficiency across the VMI detector.

The angular distributions of the D2H+ and D3+ ions are shown in Figure 7 for both TL and optimized pulses. These angular distributions were fit using a Legendre polynomial in cosθ, and the resulting coefficients are shown in Table 2. The most notable difference between the TL and optimized pulses is that the latter pulses produce a D2H+ distribution that is much more aligned with the laser polarization direction than the TL pulses. This trend is also apparent in the D3+ results, although to a lesser extent. In addition, both of the optimized pulses yield angular distributions that are better fit to 4th-order Legendre polynomials, while adding a 4th-order term does not improve the fit of the angular distributions produced by TL pulses.

FIGURE 7
www.frontiersin.org

FIGURE 7. The angular distributions of D2H+ and D3+ from VMI measurements of D3C-CH3 dissociation. (A) D2H+ fragments from a TL pulse. (B) D2H+ fragments produced from pulses optimized to increase the D2H+:D3+ ratio. In the right column are the same distributions for D3+ fragments by the (C) TL and (D) optimized pulses. The molecular ions forming the angular distributions are from within the areas on interest shown in Figure 2. The angle θ is between the laser polarization direction and the fragment dissociation direction. The solid lines in each panel are fits of the data to a Legendre polynomial in cosθ. The fit coefficients are shown in Table 2.

TABLE 2
www.frontiersin.org

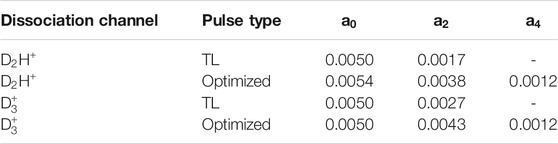
TABLE 2. Legendre polynomial coefficients, an, obtained by fitting the probability of dissociation of D2H+ and D3+ as a function of cosθ.

The optimized pulse, therefore, is observed to have a significant impact on the yield, KER, and angular distribution of the D2H+ ions. In contrast, the D3+ ions display relatively similar dynamics for the optimized and TL pulses. A close comparison of Figures 4A,B shows that while the D3+ yield changes by a factor of 65 over the range of the dispersion scan, the D2H+ yield changes by a factor of 122 over the same parameter space. The relative stability of the D3+ formation process under the range of laser conditions may be a result of the limited combinations of atoms that could be involved. The greater multiplicity available for D2H+ formation might make that process more flexible and therefore more susceptible to the influence of the laser pulse changes.

4 Summary

By using the D3C-CH3 isotopologue of ethane we were able to separate two different types of dissociation processes leading to the formation of trihydrogen cations: D3+ formation which involves atoms from only one side of the molecule and D2H+ that involves atoms from both sides of the molecule. Using shaped laser pulses, we increased the D2H+:D3+ ratio by a factor of up to three. The laser pulses optimized with an adaptive search strategy were more effective at improving the D2H+:D3+ ratio while maintaining the overall ion yield than the most effective pulses found with a systematic scan of pulse dispersion parameters. Using coincident ion detection available in a COLTRIMS measurement of C2D6, we verified that while three-body D + D3+ + C2D3+ is observed, two-body D3+ + C2D3+ is the dominant fragmentation channel containing D3+ ions. The pulse optimized with an adaptive search produces D2H+ fragments with a lower KER and an angular distribution more strongly peaked along the laser polarization direction than the TL pulse. This could be a signature of a barrier suppression mechanism. A multiple-pulse experiment probing the time dependence of H3+ formation in this process could be informative, as could further theoretical investigation of the timescales of some of the proposed H3+ formation mechanisms.

Data Availability Statement

The raw data supporting the conclusions of this article will be made available by the authors, without undue reservation.

Author Contributions

TT and TS led the analysis of the COLTRIMS measurements, while CS led the VMI analysis with assistance from TT, NI, and ST. BJ led the adaptive control experiments and KP led the dispersion scan experiments with assistance from NI, CS, JN, AS, TS, PF, ST, and EW. TS, BJ, SZ, KC, IB-I, and EW carried out the COLTRIMS experiment. IB-I and EW mentored the students and postdocs. EW wrote the manuscript with assistance from TT, TS, BJ, KP, KC, and IB-I. All authors reviewed the manuscript prior to submission.

Funding

Augustana University personnel and equipment are supported by the National Science Foundation grant PHYS-2011864. JR Macdonald Laboratory personnel and equipment are supported by the Chemical Sciences, Geosciences, and Biosciences Division, Office of Basic Energy Science, Office of Science, United States Department of Energy under award #DE-FG02-86ER1349.

Conflict of Interest

The authors declare that the research was conducted in the absence of any commercial or financial relationships that could be construed as a potential conflict of interest.

Acknowledgments

We thank Charles Fehrenbach for assistance with the PULSAR laser and the members of Vinod Kumarappan’s group for assistance with the KLS laser.

References

1. Endo T, Neville SP, Wanie V, Beaulieu S, Qu C, Deschamps J, et al. Capturing Roaming Molecular Fragments in Real Time. Science 370 (2020) 1072–7. doi:10.1126/science.abc2960

PubMed Abstract | CrossRef Full Text | Google Scholar

2. Kling NG, Díaz-Tendero S, Obaid R, Disla MR, Xiong H, Sundberg M, et al. Time-resolved Molecular Dynamics of Single and Double Hydrogen Migration in Ethanol. Nat Commun 10 (2019). doi:10.1038/s41467-019-10571-9

CrossRef Full Text | Google Scholar

3. Ando T, Shimamoto A, Miura S, Iwasaki A, Nakai K, Yamanouchi K. Coherent Vibrations in Methanol Cation Probed by Periodic H3+ Ejection after Double Ionization. Commun Chem 1 (2018). doi:10.1038/s42004-017-0006-7

CrossRef Full Text | Google Scholar

4. Kübel M, Siemering R, Burger C, Kling NG, Li H, Alnaser AS, et al. Steering Proton Migration in Hydrocarbons Using Intense Few-Cycle Laser fields. Phys Rev Lett 116 (2016) 193001. doi:10.1103/physrevlett.116.193001

PubMed Abstract | CrossRef Full Text | Google Scholar

5. Livshits E, Luzon I, Gope K, Baer R, Strasser D. Time-resolving the Ultrafast H2 Roaming Chemistry and H3+ Formation Using Extreme-Ultraviolet Pulses. Commun Chem 3 (2020). doi:10.1038/s42004-020-0294-1

CrossRef Full Text | Google Scholar

6. Ma P, Wang C, Li X, Yu X, Tian X, Hu W, et al. Ultrafast Proton Migration and Coulomb Explosion of Methyl Chloride in Intense Laser fields. J Chem Phys 146 (2017) 244305. doi:10.1063/1.4989565

PubMed Abstract | CrossRef Full Text | Google Scholar

7. Xu S, Zhao H, Zhu X, Guo D, Feng W, Lau K-C, et al. Dissociation of [HCCH]2+ to H2+ and C2+: a Benchmark Reaction Involving H Migration, H-H Combination, and C-H Bond Cleavage. Phys Chem Chem Phys 20 (2018) 27725–9. doi:10.1039/c8cp05780j

PubMed Abstract | CrossRef Full Text | Google Scholar

8. Michie MJ, Ekanayake N, Weingartz NP, Stamm J, Dantus M. Quantum Coherent Control of H3+ Formation in strong fields. J Chem Phys 150 (2019) 044303. doi:10.1063/1.5070067

PubMed Abstract | CrossRef Full Text | Google Scholar

9. Jochim B, Berry B, Severt T, Feizollah P, Zohrabi M, P KR, Dependence on the Initial Configuration of strong Field-Driven Isomerization of C2H2 Cations and Anions. J Phys Chem Lett 10 (2019) 2320–7. doi:10.1021/acs.jpclett.9b00520

PubMed Abstract | CrossRef Full Text | Google Scholar

10. McDonnell M, LaForge AC, Reino-González J, Disla M, Kling NG, Mishra D, et al. Ultrafast Laser-Induced Isomerization Dynamics in Acetonitrile. J Phys Chem Lett 11 (2020) 6724–9. doi:10.1021/acs.jpclett.0c01344

PubMed Abstract | CrossRef Full Text | Google Scholar

11. Wang E, Shan X, Chen L, Pfeifer T, Chen X, Ren X, et al. Ultrafast Proton Transfer Dynamics on the Repulsive Potential of the Ethanol Dication: Roaming-Mediated Isomerization versus Coulomb Explosion. The J Phys Chem A 124 (2020) 2785–91. doi:10.1021/acs.jpca.0c02074

PubMed Abstract | CrossRef Full Text | Google Scholar

12. Sharma S, Raman S, Green WH. Intramolecular Hydrogen Migration in Alkylperoxy and Hydroperoxyalkylperoxy Radicals: Accurate Treatment of Hindered Rotors. J Phys Chem A 114 (2010) 5689–701. doi:10.1021/jp9098792

PubMed Abstract | CrossRef Full Text | Google Scholar

13. Zhao J, Song T, Xu M, Quan Q, Siu KWM, Hopkinson AC, et al. Intramolecular Hydrogen Atom Migration along the Backbone of Cationic and Neutral Radical Tripeptides and Subsequent Radical-Induced Dissociations. Phys Chem Chem Phys 14 (2012) 8723. doi:10.1039/c2cp40708f

PubMed Abstract | CrossRef Full Text | Google Scholar

14. Hoerner JK, Xiao H, Dobo A, Kaltashov IA. Is There Hydrogen Scrambling in the Gas Phase? Energetic and Structural Determinants of Proton Mobility within Protein Ions. J Am Chem Soc 126 (2004) 7709–17. doi:10.1021/ja049513m

PubMed Abstract | CrossRef Full Text | Google Scholar

15. Shen Y, Zhao X, Wang G, Chen DDY. Differential Hydrogen/deuterium Exchange during Proteoform Separation Enables Characterization of Conformational Differences between Coexisting Protein States. Anal Chem 91 (2019) 3805–9. doi:10.1021/acs.analchem.9b00558

PubMed Abstract | CrossRef Full Text | Google Scholar

16. Hoshina K, Furukawa Y, Okino T, Yamanouchi K. Efficient Ejection of H3+ from Hydrocarbon Molecules Induced by Ultrashort Intense Laser fields. J Chem Phys 129 (2008) 104302. doi:10.1063/1.2973588

PubMed Abstract | CrossRef Full Text | Google Scholar

17. Ando T, Iwasaki A, Yamanouchi K. Strong-field Fourier Transform Vibrational Spectroscopy of Methanol Cation and its Isotopologues Using Few-Cycle Near-Infrared Laser Pulses. Mol Phys 117 (2019) 1732–40. doi:10.1080/00268976.2019.1572244

CrossRef Full Text | Google Scholar

18. Ekanayake N, Nairat M, Kaderiya B, Feizollah P, Jochim B, Severt T, et al. Mechanisms and Time-Resolved Dynamics for Trihydrogen Cation (H3+) Formation from Organic Molecules in strong Laser fields. Scientific Rep 7 (2017). doi:10.1038/s41598-017-04666-w

CrossRef Full Text | Google Scholar

19. Ekanayake N, Severt T, Nairat M, Weingartz NP, Farris BM, Kaderiya B, et al. H2 Roaming Chemistry and the Formation of H3+ from Organic Molecules in strong Laser fields. Nat Commun 9 (2018). doi:10.1038/s41467-018-07577-0

CrossRef Full Text | Google Scholar

20. Ekanayake N, Nairat M, Weingartz NP, Michie MJ, Levine BG, Dantus M. Substituent Effects on H3+ Formation via H2 Roaming Mechanisms from Organic Molecules under strong-field Photodissociation. J Chem Phys 149 (2018) 244310. doi:10.1063/1.5065387

PubMed Abstract | CrossRef Full Text | Google Scholar

21. Iwamoto N, Schwartz CJ, Jochim B, PK R, Feizollah P, Napierala JL, et al. Strong-field Control of H3+ Production from Methanol Dications: Selecting between Local and Extended Formation Mechanisms. J Chem Phys 152 (2020) 054302. doi:10.1063/1.5129946

PubMed Abstract | CrossRef Full Text | Google Scholar

22. Townsend D, Lahankar SA, Lee SK, Chambreau SD, Suits AG, Zhang X, et al. The Roaming Atom: Straying from the Reaction Path in Formaldehyde Decomposition. Science 306 (2004) 1158–61. doi:10.1126/science.1104386

PubMed Abstract | CrossRef Full Text | Google Scholar

23. Luzon I, Livshits E, Gope K, Baer R, Strasser D. Making Sense of Coulomb Explosion Imaging. J Phys Chem Lett 10 (2019) 1361–7. doi:10.1021/acs.jpclett.9b00576

PubMed Abstract | CrossRef Full Text | Google Scholar

24. Mebel AM, Bandrauk AD. Theoretical Study of Unimolecular Decomposition of Allene Cations. J Chem Phys 129 (2008) 224311. doi:10.1063/1.3037204

PubMed Abstract | CrossRef Full Text | Google Scholar

25. Xu H, Okino T, Yamanouchi K. Tracing Ultrafast Hydrogen Migration in Allene in Intense Laser fields by Triple-Ion Coincidence Momentum Imaging. J Chem Phys 131 (2009) 151102. doi:10.1063/1.3251032

PubMed Abstract | CrossRef Full Text | Google Scholar

26. Furukawa Y, Hoshina K, Yamanouchi K, Nakano H. Ejection of Triatomic Hydrogen Molecular Ion from Methanol in Intense Laser fields. Chem Phys Lett 414 (2005) 117–21. doi:10.1016/j.cplett.2005.07.108

CrossRef Full Text | Google Scholar

27. Kotsina N, Kaziannis S, Kosmidis C. Phase Dependence of OD+, HOD+, and H3+ Ions Released from the Deuterated Dication of Methanol under ω/2ω Laser Field Irradiation. Int J Mass Spectrom 380 (2015) 34–9. doi:10.1016/j.ijms.2015.03.001

CrossRef Full Text | Google Scholar

28. Nakai K, Kato T, Kono H, Yamanouchi K. Communication: Long-Lived Neutral H2 in Hydrogen Migration within Methanol Dication. J Chem Phys 139 (2013) 181103. doi:10.1063/1.4830397

PubMed Abstract | CrossRef Full Text | Google Scholar

29. Kotsina N, Kaziannis S, Kosmidis C. Hydrogen Migration in Methanol Studied under Asymmetric Fs Laser Irradiation. Chem Phys Lett 604 (2014) 27–32. doi:10.1016/j.cplett.2014.04.040

CrossRef Full Text | Google Scholar

30. Hoshina K, Kawamura H, Tsuge M, Tamiya M, Ishiguro M. Metastable Decomposition and Hydrogen Migration of Ethane Dication Produced in an Intense Femtosecond Near-Infrared Laser Field. J Chem Phys 134 (2011) 064324. doi:10.1063/1.3549137

PubMed Abstract | CrossRef Full Text | Google Scholar

31. Kraus PM, Schwarzer MC, Schirmel N, Urbasch G, Frenking G, Weitzel KM. Unusual Mechanism for H3+ Formation from Ethane as Obtained by Femtosecond Laser Pulse Ionization and Quantum Chemical Calculations. J Chem Phys 134 (2011) 114302. doi:10.1063/1.3561311

PubMed Abstract | CrossRef Full Text | Google Scholar

32. Kanya R, Kudou T, Schirmel N, Miura S, Weitzel KM, Hoshina K, et al. Hydrogen Scrambling in Ethane Induced by Intense Laser fields: Statistical Analysis of Coincidence Events. J Chem Phys 136 (2012) 204309. doi:10.1063/1.4720503

PubMed Abstract | CrossRef Full Text | Google Scholar

33. Schirmel N, Reusch N, Horsch P, Weitzel KM. Formation of Fragment Ions (H+, H3+, CH3+) From Ethane in Intense Femtosecond Laser fields – From Understanding to Control. Faraday Discuss 163 (2013) 461. doi:10.1039/c3fd20152j

PubMed Abstract | CrossRef Full Text | Google Scholar

34. Boran Y, Gutsev GL, Kolomenskii AA, Zhu F, Schuessler A, Strohaber J. Dissociative Ionization of Ethane with Femtosecond Pulses of Radiation. J Phys B: At Mol Opt Phys 51 (2018) 035003. doi:10.1088/1361-6455/aa98d4

CrossRef Full Text | Google Scholar

35. Zhang Y, Ren B, Yang CL, Wei L, Wang B, Han J, et al. Formation of H3+ from Ethane Dication Induced by Electron Impact. Commun Chem 3 (2020). doi:10.1038/s42004-020-00415-9

CrossRef Full Text | Google Scholar

36. Zhao S, Jochim B, Feizollah P, Rajput J, Ziaee F, P KR, et al. Strong-field-induced Bond Rearrangement in Triatomic Molecules. Phys Rev A 99 (2019). doi:10.1103/physreva.99.053412

CrossRef Full Text | Google Scholar

37. Verluise F, Laude V, Cheng Z, Spielmann C, Tournois P. Amplitude and Phase Control of Ultrashort Pulses by Use of an Acousto-Optic Programmable Dispersive Filter: Pulse Compression and Shaping. Opt Lett 25 (2000) 575. doi:10.1364/ol.25.000575

PubMed Abstract | CrossRef Full Text | Google Scholar

38. Chandler DW, Houston PL. Two-dimensional Imaging of State-Selected Photodissociation Products Detected by Multiphoton Ionization. J Chem Phys 87 (1987) 1445–7. doi:10.1063/1.453276

CrossRef Full Text | Google Scholar

39. Eppink ATJB, Parker DH. Velocity Map Imaging of Ions and Electrons Using Electrostatic Lenses: Application in Photoelectron and Photofragment Ion Imaging of Molecular Oxygen. Rev Scientific Instr 68 (1997) 3477–84. doi:10.1063/1.1148310

CrossRef Full Text | Google Scholar

40. Dörner R, Mergel V, Jagutzki O, Spielberger L, Ullrich J, Moshammer R, et al. Cold Target Recoil Ion Momentum Spectroscopy: a ‘momentum Microscope’ to View Atomic Collision Dynamics. Phys Rep 330 (2000) 95–192. doi:10.1016/s0370-1573(99)00109-x

CrossRef Full Text | Google Scholar

41. Ullrich J, Moshammer R, Dorn A, Dörner R, Schmidt LPH, Schmidt-Böcking H. Recoil-ion and Electron Momentum Spectroscopy: Reaction-Microscopes. Rep Prog Phys 66 (2003) 1463. doi:10.1088/0034-4885/66/9/203

CrossRef Full Text | Google Scholar

42. Treacy E. Optical Pulse Compression with Diffraction Gratings. IEEE J Quan Electronics 5 (1969) 454–8. doi:10.1109/jqe.1969.1076303

CrossRef Full Text | Google Scholar

43. Martinez O. Design of High-Power Ultrashort Pulse Amplifiers by Expansion and Recompression. IEEE J Quan Electronics 23 (1987) 1385–7. doi:10.1109/jqe.1987.1073518

CrossRef Full Text | Google Scholar

44. Trebino R. Frequency-Resolved Optical Gating (Kluwer Academic Publishers) (2000).

45. Kling NG, Paul D, Gura A, Laurent G, De S, Li H, et al. Thick-lens Velocity-Map Imaging Spectrometer with High Resolution for High-Energy Charged Particles. J Instrumentation 9 (2014) P05005. doi:10.1088/1748-0221/9/05/P05005

CrossRef Full Text | Google Scholar

46. Wells E, Rallis C, Zohrabi M, Siemering R, Jochim B, Andrews P, et al. Adaptive strong-field Control of Chemical Dynamics Guided by Three-Dimensional Momentum Imaging. Nat Commun 4 (2013) 2895. doi:10.1038/ncomms3895

PubMed Abstract | CrossRef Full Text | Google Scholar

47. Rallis CE, Burwitz TG, Andrews PR, Zohrabi M, Averin R, De S, et al. Incorporating Real Time Velocity Map Image Reconstruction into Closed-Loop Coherent Control. Rev Scientific Instr 85 (2014) 113105. doi:10.1063/1.4899267

CrossRef Full Text | Google Scholar

48. Judson RS, Rabitz H. Teaching Lasers to Control Molecules. Phys Rev Lett 68 (1992) 1500–3. doi:10.1103/PhysRevLett.68.1500

PubMed Abstract | CrossRef Full Text | Google Scholar

49. Brif C, Chakrabarti R, Rabitz H. Control of Quantum Phenomena: Past, Present and Future. New J Phys 12 (2010) 075008. doi:10.1088/1367-2630/12/7/075008

CrossRef Full Text | Google Scholar

50. Lev U, Graham L, Madsen CB, Ben-Itzhak I, Bruner BD, Esry BD, et al. Quantum Control of Photodissociation Using Intense, Femtosecond Pulses Shaped with Third Order Dispersion. J Phys B: At Mol Opt Phys 48 (2015) 201001. doi:10.1088/0953-4075/48/20/201001

CrossRef Full Text | Google Scholar

51. Nairat M, Lozovoy VV, Dantus M. Order of Magnitude Dissociative Ionization Enhancement Observed for Pulses with High Order Dispersion. J Phys Chem A 120 (2016) 8529–36. doi:10.1021/acs.jpca.6b08659

PubMed Abstract | CrossRef Full Text | Google Scholar

52. Weiner A Ultrafast Optics (WILEY) (2009).

53. Ren X, Summers AM, P KR, Vajdi A, Makhija V, Fehrenbach CW, et al. Single-shot Carrier-envelope-phase Tagging Using an F–2f Interferometer and a Phase Meter: a Comparison. J Opt 19 (2017) 124017. doi:10.1088/2040-8986/aa9865

CrossRef Full Text | Google Scholar

54. Lozovoy VV, Zhu X, Gunaratne TC, Harris DA, Shane JC, Dantus M. Control of Molecular Fragmentation Using Shaped Femtosecond Pulses. J Phys Chem A 112 (2008) 3789–812. doi:10.1021/jp071691p

PubMed Abstract | CrossRef Full Text | Google Scholar

55. Joachain CJ, Kylstra NJ, Potvliege RM. Atoms in Intense Laser Fields (Cambridge University Press) (2011).

56. [Dataset] Linstrom P. NIST Chemistry Webbook, NIST Standard Reference Database 69 (2018). doi:10.18434/T4D303

CrossRef Full Text | Google Scholar

Keywords: coherent control, molecular dynamics, bond rearrangement, laser physics, imaging, ultrafast science

Citation: Townsend T, Schwartz CJ, Jochim B, P. KR, Severt T, Iwamoto N, Napierala JL, Feizollah P, Tegegn SN, Solomon A, Zhao S, Carnes KD, Ben-Itzhak I and Wells E (2021) Controlling H3+ Formation From Ethane Using Shaped Ultrafast Laser Pulses. Front. Phys. 9:691727. doi: 10.3389/fphy.2021.691727

Received: 06 April 2021; Accepted: 10 June 2021;
Published: 30 June 2021.

Edited by:

Tamar Seideman, Northwestern University, United States

Reviewed by:

Arkaprabha Konar, Kent State University, United States
Balakrishnan Naduvalath, University of Nevada, Las Vegas, United States

Copyright © 2021 Townsend, Schwartz, Jochim, P., Severt, Iwamoto, Napierala, Feizollah, Tegegn, Solomon, Zhao, Carnes, Ben-Itzhak and Wells. This is an open-access article distributed under the terms of the Creative Commons Attribution License (CC BY). The use, distribution or reproduction in other forums is permitted, provided the original author(s) and the copyright owner(s) are credited and that the original publication in this journal is cited, in accordance with accepted academic practice. No use, distribution or reproduction is permitted which does not comply with these terms.

*Correspondence: E. Wells, eric.wells@augie.edu

Download