Tree Cover Is Unevenly Distributed Across Cities Globally, With Lowest Levels Near Highway Pollution Sources
 Theodore Endreny
 Francesco Sica2
 - 1Department of Environmental Resources Engineering, State University of New York College of Environmental Science and Forestry, Syracuse, NY, United States
- 2Doctoral School of Architecture and Construction, Department of Architecture and Design of Sapienza University, Rome, Italy
- 3USDA Forest Service, Northern Research Station, Syracuse, NY, United States
Obtaining accurate tree cover maps within cities is a first step toward managing for equitable access to their ecosystem services. For example, by removing air pollutants trees contribute to fewer health impacts, and tree cover expansion could extend these benefits by targeting the most polluted areas and vulnerable populations. To support strategic tree expansion, this research created urban tree cover maps using the 2017 NASA MOD44B satellite 250 m pixel product for 35 megacities, areas with large levels of pollution and vulnerable populations. Estimates of tree cover from photo-interpretation (PI) were used to characterize map error, city-wide, and from low to high tree cover, using 21 bins from 0 to 100% tree cover. Map accuracy was highest when MOD44B percent tree cover was combined with its tree cover standard deviation product, with average difference of 1.8% compared with PI estimates of 19.9% city-wide tree cover. MOD44B estimates of tree cover spatial patterns had strong explanatory value. The maps explained the PI estimates of low to high tree cover at 5% tree cover intervals with an R2 = 0.97. The Getis Ord Gi* statistic determined a non-random spatial distribution of tree cover within the megacities, with significant clustering into hot spots of relatively high tree cover and cold spots of relatively low tree cover. Tree cover hot spots were most often furthest from downtown, at the rural-urban interface or within higher elevation terrain. Tree cover cold spots were most often in areas of concentrated development and along traffic corridors known for high levels of particulate matter and other air pollutants that could be reduced by trees. Given small increases in exposure to particulate matter are associated with significant increases in death rates from viruses, and that climate change and associated heat waves are forecast to exacerbate health risks to air pollution, we need to improve global urban tree cover. These map products can be used to expand tree cover that strategically contributes to pollutant abatement, human well-being, and sustainable cities.
Introduction
Trees in cities provide numerous benefits to society by altering the local physical, biological and social environment, providing billions of dollars in annual benefits mostly not considered by traditional economic accounting (Nowak and Dwyer, 2007; Endreny et al., 2017; Nowak and Greenfield, 2018b). These benefits accrue from ecosystem services categorized as (1) provisioning, e.g., food, fiber, fuel, water; (2) regulating, e.g., climate, flood, pollution, and disease control; (3) supporting, e.g., pollination, soil formation, nutrient cycling; and (4) cultural, e.g., spiritual and recreational (Millennium Ecosystem Assessment, 2005; Endreny, 2018). Tree benefits of reduced air pollution, particularly particulate matter smaller than 2.5 μm (PM2.5), have been monetized using pulmonary and cardiovascular disease healthcare data (Nowak et al., 2014). By reducing 5 air pollutants, including <1% reductions in PM2.5, tree benefits were estimated to average $482 million/yr across 10 megacities (Endreny et al., 2017), which are cities with 10 million or more residents. Preliminary data from the global 2019–20 coronavirus pandemic shows a decrease in long-term PM2.5 exposure could have reduced fatality by 15%, based on 1905 deaths in 685 US counties (Wu et al., 2020). Urban trees have been estimated to return an average of $2.25 for every $1 invested, which accounts for the cost of disservices like injuries, allergies, and maintenance (Vibrant Cities Lab, 2018). The return on investment is considered an underestimate given it does not include the value trees contribute to disease prevention and recovery, school performance, and happiness, which are connected to society's greatest expenses of healthcare, education, and defense (Hodson and Sander, 2017; Endreny, 2018).
Globally, cities have available land to nearly double their tree cover (Endreny et al., 2017), yet the actual tree cover is declining due to numerous natural forces, climatic disruptive forces, and anthropogenic forces (Nowak and Greenfield, 2018a; IPCC, 2019). The limited and declining tree cover impacts biological diversity, carbon storage, air quality, and numerous other factors that affect human health and well-being (Costanza et al., 1997; Seto et al., 2012; Nowak and Greenfield, 2018b). Risks to human health and well-being are increased by climate change, which brings unprecedented interactions of heat waves, infectious disease, and air pollution to a growing urban population (World Health Organization, 2010b; McDonald et al., 2011).
Urban tree cover has been shown to advance 9 of the 17 UN Sustainable Development Goals (United Nations, 2016) of no poverty, zero hunger, good health and well-being, clean water and sanitation, affordable and clean energy, descent work and economic growth, climate action, life on land, and most directly the goal #11 of sustainable cities and communities (FAO, 2016; Endreny, 2018). The accurate quantification of tree cover within cities is a first step toward utilizing tree cover to reach these SDG goals. Maps allow for measurement of tree cover extent and subsequent estimation of tree cover benefits. Maps also help identify critical needs and disparities in the spatial distribution of urban tree cover. Urban tree cover in megacities are of particular concern because of their rapid expansion and concentrated pollution (Parrish and Zhu, 2009). The growth of megacities is exceeding expectations, having increased from 3 to 47 between 1975 and 2020, and their number may reach twice the projected total of 27 megacities by 2025 (Parrish and Zhu, 2009). Megacities are also home to a concentrated population with low socioeconomic status who have greater vulnerability to the adverse health impacts of urban pollution (World Health Organization, 2010a; Brisbois and O'Campo, 2019). Maps of social and economic data when combined with maps of urban tree cover can assist in strategic designs addressing the environmental, social and economic components comprising urban sustainability.
There are two basic means to quantify tree cover: (1) top-down aerial- or space-based approaches or (2) bottom-up ground-based assessments (Nowak, 2018). Top down assessments provide basic metrics on tree and other cover types (e.g., percent tree cover) and can include specific locations of these cover elements when maps are produced. Tree cover can be estimated by photo-interpretation of aerial photographs, by developing tree cover maps using moderate to very high resolution imagery, or combining LiDAR and imagery (Nowak, 2012b; Antonarakis et al., 2014; Erker et al., 2019). If just city-wide tree cover area is needed and its spatial location can be neglected, photo-interpretation has proven cost-effective and higher accuracy than LandSat remote sensing imagery (Greenfield et al., 2009). By contrast, imagery classified into tree cover maps provide both tree cover area as well as spatial locations (Basu et al., 2015). Tree cover area and its spatial distribution are important elements in characterizing overall urban forest structure as they provide a means to convey the magnitude and distribution of the forest resource and benefits. Ground based assessments are often needed to get details of urban forest structure, such as species composition, tree condition, and leaf area. Combining top down maps with ground-based assessments provides a more complete picture of the urban forest structure, spanning spatial and temporal scales, important for management.
This paper addresses the estimation of tree cover area and its spatial distribution for urban areas globally, in order to help our urban areas inventory and use this important renewable resource to achieve sustainable development. The goal of this research is to obtain accurate maps of percent tree cover for cities in order to investigate the spatial distribution of tree cover and support improved tree cover management. To achieve this goal, the research will characterize the error of satellite imaged urban tree cover maps available globally. The manuscript first provides details of the map suitability for estimating city-wide tree cover area and tree cover spatial distribution, and then uses the maps to examine spatial patterns of tree cover clustering across the cities. The clustering analysis considers areas with relatively high and relatively low tree cover, and examines clustering trends across the megacities. The discussion provides a critical review of the results and then explores the potential implications of the maps for more strategic urban tree cover management that sustains human health and well-being.
Methods
Tree cover maps in 35 megacities (Table 1) were obtained from the space-based MOD44B version 6 product for the period March 5, 2016 to March 6, 2017. The MOD44B product, also known as MODerate Resolution Imaging Spectroradiometer (MODIS) Terra Vegetation Continuous Fields yearly global product, has a 250 m pixel spatial resolution across all land areas. The MOD44B product contains 7 data bands or layers, including three 250 m grid layers that estimate percent tree, non-tree vegetation, and non-vegetated cover. The remaining layers relate to quality assurance, and are: (a) a quality control indicator, (b) standard deviation of percent tree cover, (c) standard deviation of not vegetated, and (d) a cloud cover indicator. The MOD44B data were downloaded from the NASA Earth Data (https://search.earthdata.nasa.gov/) as a geographic coordinate system with WGS 1984 datum and projected to the UTM coordinate system with the same datum. The downloaded MOD44B.hdf file for each megacity was converted into 7 separate sub-datasets as.tif files, each file holding an individual data layer.
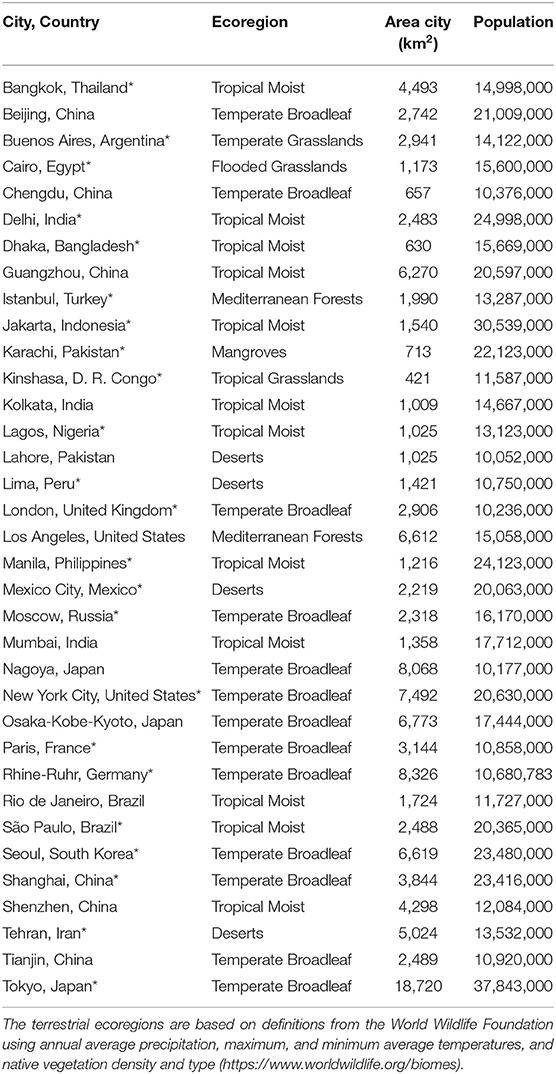
Table 1. Summary of continent and ecoregion for the 35 analyzed megacities in 23 countries, 5 continents.
Townshend et al. (2013) developed the algorithms used to produce the MOD44B, explaining the percent tree cover estimate for each 250 m grid cell is an average of estimates from 30 independent regression trees. The regression used the explanatory variable of MODIS Terra 32-day surface reflectance composite, and was limited to land cover areas defined by the MODIS Global 250 m Land/Water Map. The regression trees were developed with training data provided by georeferenced LandSat data, broken into 4 quartile classes of relative percent tree cover, i.e., 0–25%, 26–50%, 51–80%, and 80–100%. Each regression model was applied to 8 separate 32-day composites to obtain the yearly estimate of percent tree cover for each pixel. The standard deviation of percent tree cover for each pixel was calculated from the variation in the 30 regression model estimates, and can be added or subtracted to the percent tree cover estimate to represent the range in actual tree cover.
The megacity metropolitan areas were delineated by the Natural Earth polygon boundary shape file of urban areas, at a scale of 1:10 m. These megacity boundary polygons include the functional city, which typically includes the commuting zone beyond the political boundary, and were systematically defined as the edge of remotely sensed intensive land use (Schneider et al., 2010). In cases where the megacity boundary polygon excluded an internal polygon of low density land use that was < = 10% of the megacity area, the internal polygon area was considered part of the megacity. In these cases, the internal polygon was dissolved (i.e., removed) and the area was included in the megacity polygon.
The above datasets were then used to create maps of tree cover. The megacity polygons, projected to UTM, were used to clip the 7 MOD44B data layers to only include megacity pixels. The clipped data layers were converted from.tif files to ASCII grid files with 250 m pixel resolution. Each megacity ASCII grid file was used to compute the average percent tree cover for each megacity. Each megacity ASCII grid file of percent tree cover, standard deviation of percent tree cover, and quality were analyzed for quality assurance. The quality data for all tree cover pixels in the megacity were used to create a city average, and in each megacity the percent of tree cover pixels with at least 1 clear 32-day date range was computed. The number of percent tree cover pixels, standard deviation of percent tree cover pixels assigned as fill, and unclassified were counted. For each megacity, the ASCII grid file of percent tree cover was converted from grid to point data, called an XY data file, which contained a row of data for each pixel with tree cover. The XY data rows recorded the UTM Easting and Northing values for the pixel center, and the percent tree cover value as an integer. The XY data files were used for two assessments, to compare random points of percent tree cover with tree cover values obtained from photo-interpretation, and to identify clusters of high and low percent tree cover.
Two separate photo-interpretation assessments were performed to establish an reference tree cover estimate and compute the difference with MOD44B tree cover data. The first photo-interpretation used 35 megacities to assess MOD44B spatial distribution of tree cover. It used percent tree cover values within 21 discrete bins, the first bin equal to 0% tree cover, and the next twenty bins in 5% intervals starting at 1–5%, ending at 96–100%. The XY data files from each megacity were searched and each point was assigned to one of the 21 bins, with the UTM coordinates and percent tree cover value written to a new XY data file named for the bin. To reduce the number of points to cross-compare in photo-interpretation, a random number generator was then used to select 200 points of data from these binned XY data files. Each randomly selected point was then assigned two a random adjustments between −125 and +125 m, one each to its UTM Easting and Northing values, to move the point off the center of the 250 m pixel. This process resulted in 18 bins of XY data, with 200 points in each bin from 0 to 76–80%, and only 82 points (all points) in the bin 81–85% tree cover. Each bin of XY data was loaded into Google Earth, and photo-interpretation was used to record if the aerial imagery at the point was tree cover or not tree cover, using the latest aerial imagery from year 2019 or 2018.
The second photo-interpretation used 23 megacities to assess MOD44B city-wide estimates of tree cover. Photo-interpretation of 23 megacities, representing each of the 23 countries from the list of 35 megacities, were used to compare with the city-wide MOD44B tree cover estimates. Within each city, 1,000 random points were laid on Google Earth imagery to assess cover types. The average tree cover was 22.9% at 200 points, 21.6% at 500 points, 21.1% at 800 points, and 19.9% at 1,000 points. A trained photo-interpreter classified each point as to whether it fell on either: trees, including shrubs; grass or herbaceous cover; impervious cover such as buildings, roads, other impervious; agricultural areas including soil or herbaceous cover in crop areas; or other such as bare soil and water (Table S1). The most recent image was analyzed, with the date of the image recorded and all points analyzed as close to the most recent date as possible. Overall 68% of images had the same year within a city and 98% were within 3 years of that date. Occasionally points could not be assessed due to cloud cover or poor imagery. Within each city, the fraction of each cover class (p) was calculated as the number of sample points (x) hitting the cover attribute divided by the total number of interpretable sample points (n) within the area of analysis (p = x/n). The standard error of the estimate (SE) in cover class j was calculated as SEj = [pj(1-pj)/n]0.5 (Box et al., 1978); SE decreases based on sample size and is also dependent on the tree cover estimate and decreases as one moves away from 50% tree cover. SE was 4% at 200 points, 1.8% at 500 points, 1.4% at 800 points, and 1.2% at 1,000 points.
Percent tree cover maps in each megacity were analyzed for spatial patterns. The XY data files of percent tree cover for each megacity were processed with the Getis Ord Gi* statistic (Getis and Ord, 1992), also called hot spot analysis, using a fixed distance bound. The Gi* statistic tests the null hypothesis that the pattern of percent tree cover is complete spatial randomness, and uses z-scores and p-values for each point to determine if the null hypothesis can be rejected (Getis and Ord, 1992). This research defined statistically significant at 5% clusters of low percent tree cover to cold spots (z-value <0, p < 5%), and statistically significant at 5% clusters of high percent tree cover to hot spots (z-value > 0, p < 5%). The Gi* is a spatial statistic for cluster detection that has been shown to detect local clusters of dependence that may go undetected by global statistics such as Moran's I (Getis and Ord, 1992). The points identified as hot spots were converted to 250 m pixel grid files, which were then converted to un-simplified polygons with interior boundaries dissolved. The same was done for cold spots. Maps of hot and cold spot clusters were examined for spatial asymmetries relative to the megacity rural to urban gradient, using references such as surrounding waters, high elevation terrain, city centers, and major airports, marine ports, rivers, roads, and railroads. Google Earth was used to identify some of these features, including elevation profiles using trace path.
Results
The best tree cover maps were obtained by adding the MOD44B percent tree cover to the MOD44B standard deviation product, which increased the city-wide average tree cover to 18.1%, with an average difference of 1.8% compared with the photo-interpreted value of 19.9% ± 1.2% standard error (Table 2). The city-wide median tree cover was 17.3% for MOD44B with standard deviation and was 22% for photo-interpreted products. The MOD44B tree cover standard deviation was added into each 250 m pixel of tree cover, incorporating the uncertainty across the 30 separate MOD44B estimates of tree cover. Without the MOD44B standard deviation product added into the tree cover map, the average city-wide estimate of tree cover would be 11.1%, with a difference of 8.8% (see Table 2). The difference between photo-interpreted and MOD44B tree cover and standard deviation varied from smallest in Istanbul, with a difference of 0.1%, to largest in Kinshasa, with a differences of 11.8%. Adding the tree cover standard deviation to the MOD44B tree cover product improved accuracy of city-wide estimates for 74% of cities. Of the 6 cities where error increased when standard deviation was added to MOD44B, Seoul and Delhi had the lowest differences, which were <1% for the MOD44B tree cover product without standard deviation.
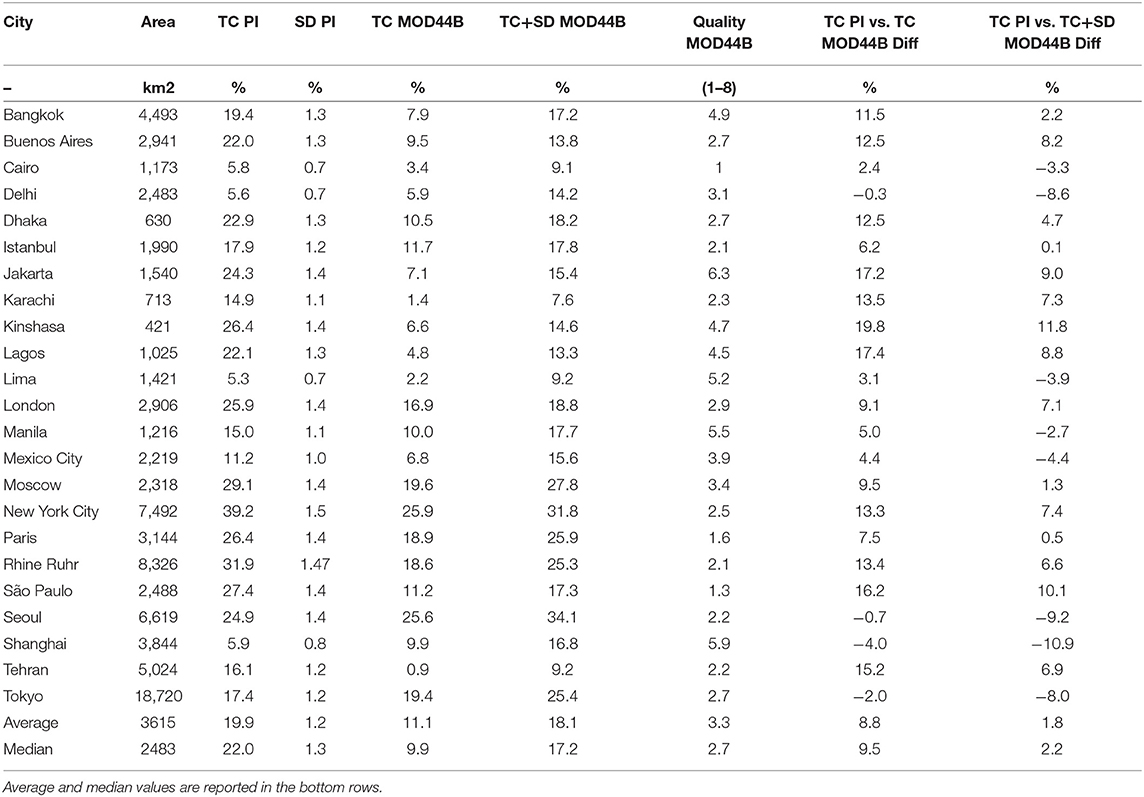
Table 2. Megacity metropolitan area (km2) and city-wide photo-interpreted (PI) tree cover (TC) percent (%), PI TC standard error, MOD44B TC_1 without its standard deviation, MOD44B TC_2 with its standard deviation, MOD44B quality on a scale of 0 to 8, with 0 best and 8 worst, difference between PI TC and MOD44B TC_1 (%), and difference between PI TC and MOD44B TC_2 (%).
The MOD44B percent tree cover had a relative uniform underestimation of tree cover that allowed for it to capture with an R2 of 0.97 the trend in photo-interpreted estimates from low to high tree cover (see red dotted line Figure 1). The regression between MOD44B tree cover (without standard deviation) and photo-interpreted tree cover was consistently above the 1:1 line, which is evident in the intercept value of 10.889 in the regression equation (see equation of MOD44B_TC(%) in Figure 1). When MOD44B tree cover and standard deviation were combined, the regression with photo-interpreted tree cover had the desired intercept of 0, and the bins up until 30% tree cover were within 5% of the photo-interpreted value (see blue dashed line and equation of MOD44B_TC_SD(%) in Figure 1).
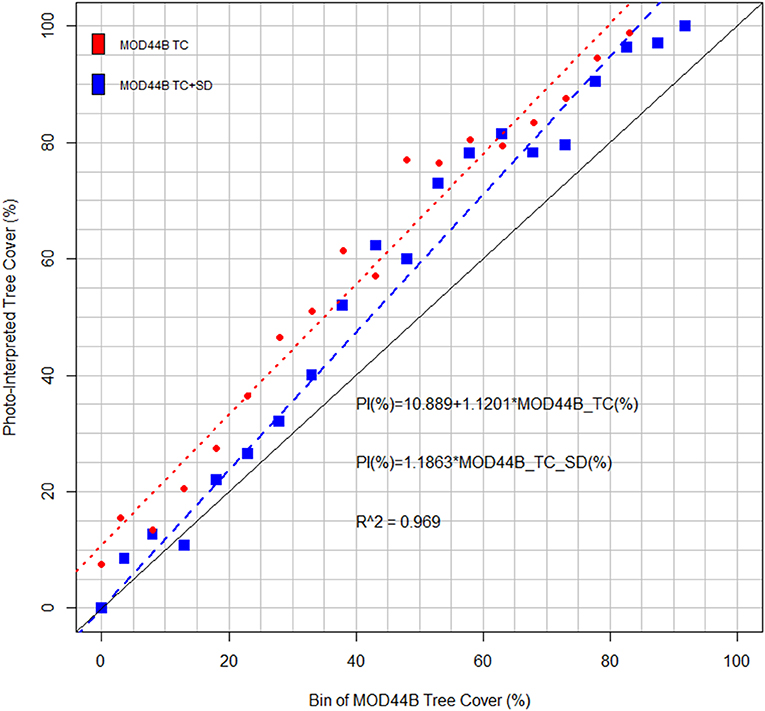
Figure 1. Regression between photo-interpreted (PI) tree cover (%) and two forms of MOD44B tree cover, with (blue dashed line) and without (red dotted line) standard deviation (%), across 5% intervals. Each data label indicates the number of megacities sampled in the PI analysis.
The maps of tree cover combined with its standard deviation were used to create a statistical snapshot of tree cover central tendency and variation within the 35 megacities. Box-and-whisker plots show the median value and inter-quartile range of percent tree cover tended to associate with the megacity ecoregion (Figure 2). The 12 Tropical Moist megacities had a median tree cover of 7% (± 7.8%) and upper quartile (75th percentile) tree cover of 11.7%, close to the median tree cover of 6.1% (± 4.2%) and upper quartile tree cover of 10.2% for the 1 Temperate Grasslands megacity of Buenos Aires. The 13 Temperate Broadleaf megacities had a median tree cover of 13.1% (± 7.2%) and upper quartile tree cover of 24.2%. The 1 Flooded Grasslands megacity of Cairo had a median tree cover of 0.2% (± 5.7%) and upper quartile tree cover of 5.7%. The 2 Mediterranean Forests megacities of Istanbul and Los Angeles had a median tree cover of 4.6% (± 6.5%) and upper quartile tree cover of 10.2%. The 1 Mangroves megacity of Karachi had a median tree cover of 0.2% (± 6.2%) and upper quartile tree cover of 0.9%. The 1 Tropical Grasslands megacity of Kinshasa had a median tree cover of 7.5% (± 8.0%) and upper quartile tree cover of 11.3%. The 4 Deserts megacities had a median tree cover of 2.5% (± 8.0%) and upper quartile tree cover of 4.8%, greater median percent tree cover than the Flooded Grasslands and Mangroves.
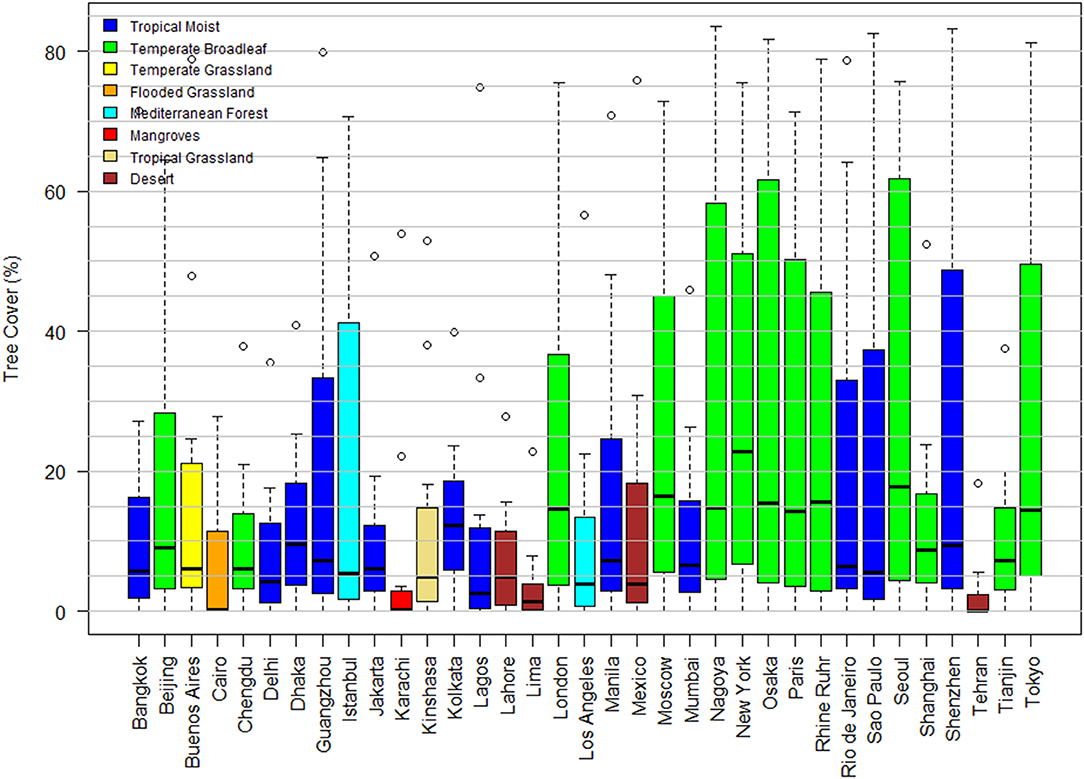
Figure 2. The distribution of tree cover (%) within each of the 35 megacities, represented with box plots showing the median (50th percentile, black line), lower quartile (25th percent, bottom of box), upper quartile (75th percent, top of box), 1.5 inter-quartile range (IQR, top whisker), and maximum values greater than the IQR (open circles). The box colors represent the ecoregions.
The maps were then transformed into maps of tree clusters, showing tree cover was not uniformly distributed nor random (Table 3 and Figure 3). Tree cover exhibited significant spatial clustering into hot spots of relatively high tree cover and cold spots of relatively low tree cover, but not zero tree cover (see Figure 3 where green denotes hot spots, red denotes cold spots). The tree cover hot spots occupied on average 20% of the megacity area, and these hot spots had an average tree cover of 25%. New York City had 43% of its area in hot spots, and Karachi had 4% of its area in hot spots, while 90% of the megacities were within 10% of the average hot spot area. The megacities of Lima and Tehran had hot spots with an average tree cover of 4% (± 7.7%), which was a statistically significant cluster due to their city-average tree cover of 1.6%. The cold spots occupied on average 24% of the megacity area, and these cold spots had an average tree cover of 5%. The megacities of Karachi and Tehran had 0% of area in cold spots due to the low city-average tree cover of 1.2%; Buenos Aires had 0.1% of area in cold spots. In the tree cover cold spots the land cover types of non-tree cover vegetation and non-vegetation occupied the majority of the area. A descriptive characterization of the statistically significant percent tree cover clusters is provided in the Supplemental Materials for 23 cities.
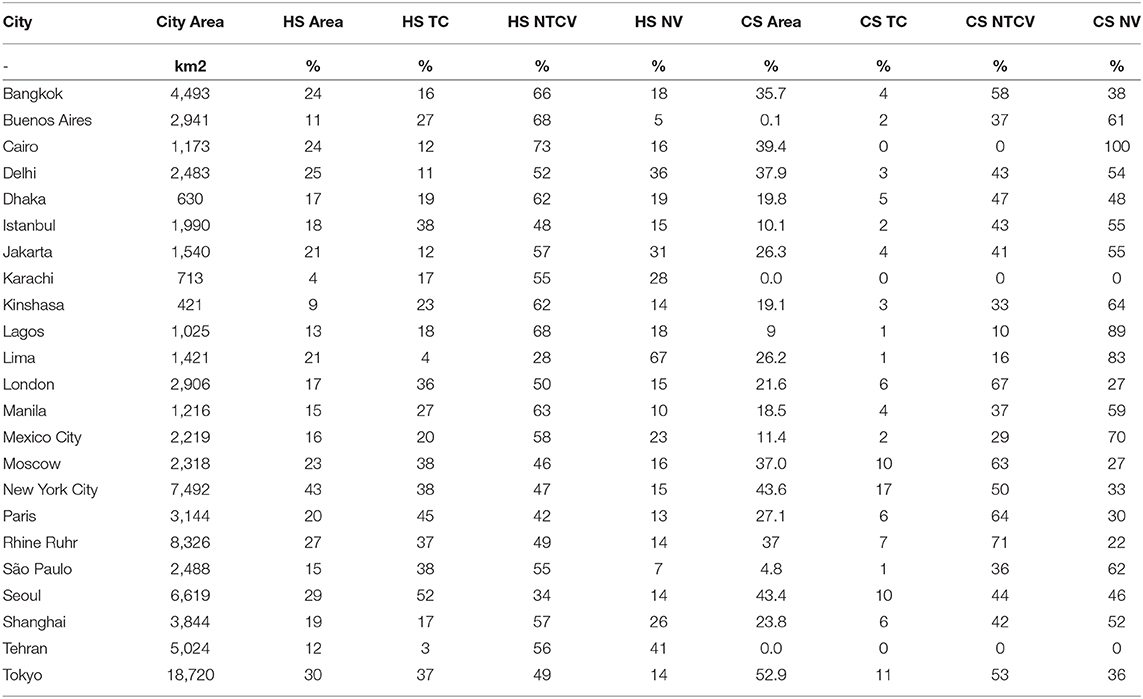
Table 3. Megacity area (%) in tree cover (TC) hot spots (HS) and TC cold spots (CS), identified at a 5% significance based on Getis Ord analysis of MOD44B TC data, and the average estimated TC, non-tree cover vegetation (NTCV), and non-vegetation (NV) in those hot spot and cold spot areas.
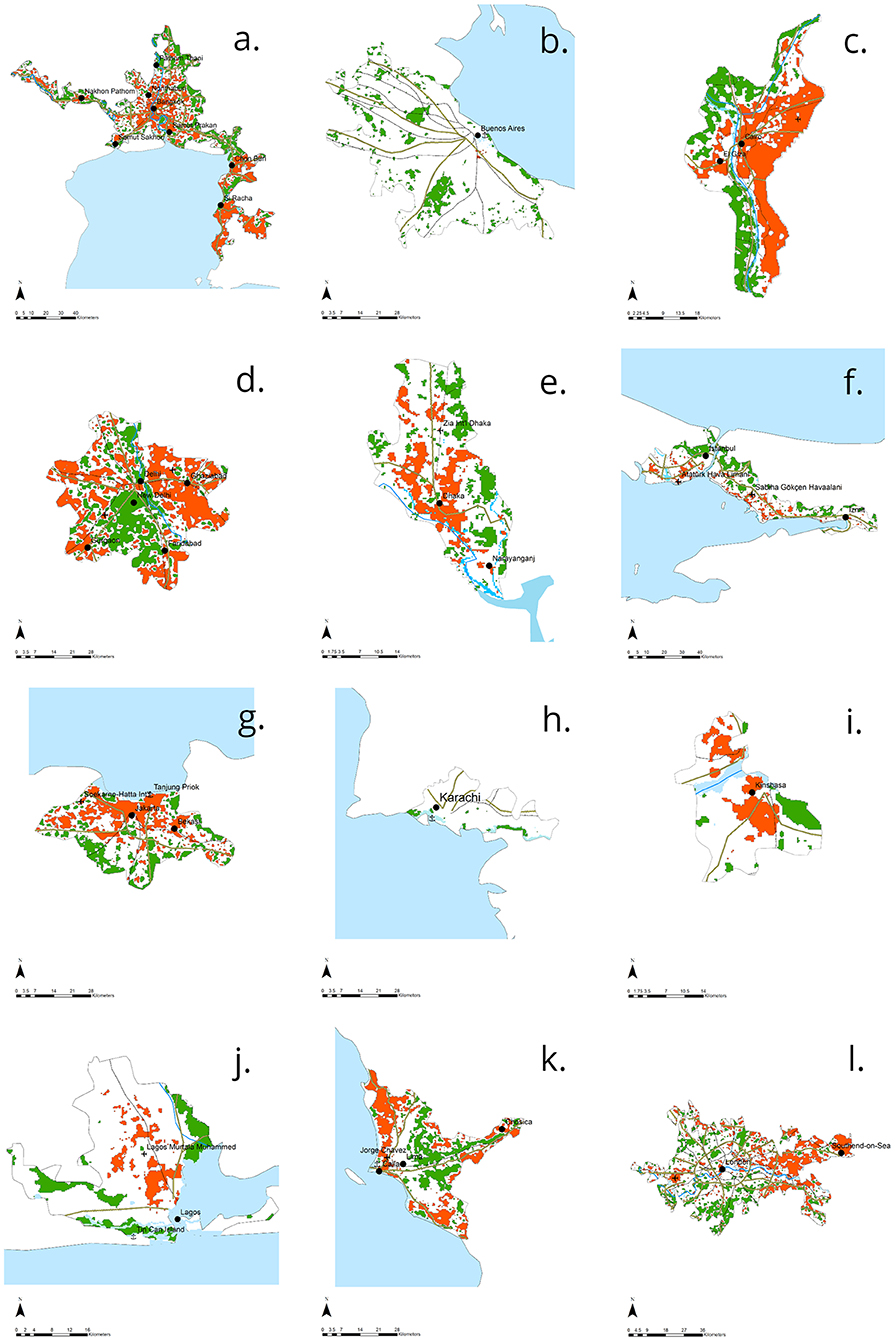
Figure 3A. The hot spot (green) and cold spot (red) clusters, city centers (dots), waters (blue), expressways (yellow lines), railways (black hashed lines), marine ports (anchors), airports (airplanes) within the metropolitan areas of: (a) Bangkok, (b) Buenos Aires, (c) Cairo, (d) Delhi, (e) Dhaka, (f) Istanbul, (g) Jakarta, (h) Karachi, (i) Kinshasa, (j) Lagos, (k) Lima, (l) London.
The spatial pattern of percent tree cover hot spots across the megacities (green color in Figure 3) was largely organized around the rural-urban interface, abutting agriculture or wetlands, within higher elevation terrain, in parks and other recreation areas (e.g., zoos or golf courses), and in some low-density residential districts. These categories were then ranked from most to least common across the megacities, and were: (1) high elevation terrain in 11 cities; (2) wetlands in 11 cities; (3) parks in 10 cities; (4) agricultural areas in 8 cities; (5) low-density residential in 6 cities; and (6) bordering facilities like airports and military bases in 4 cities.
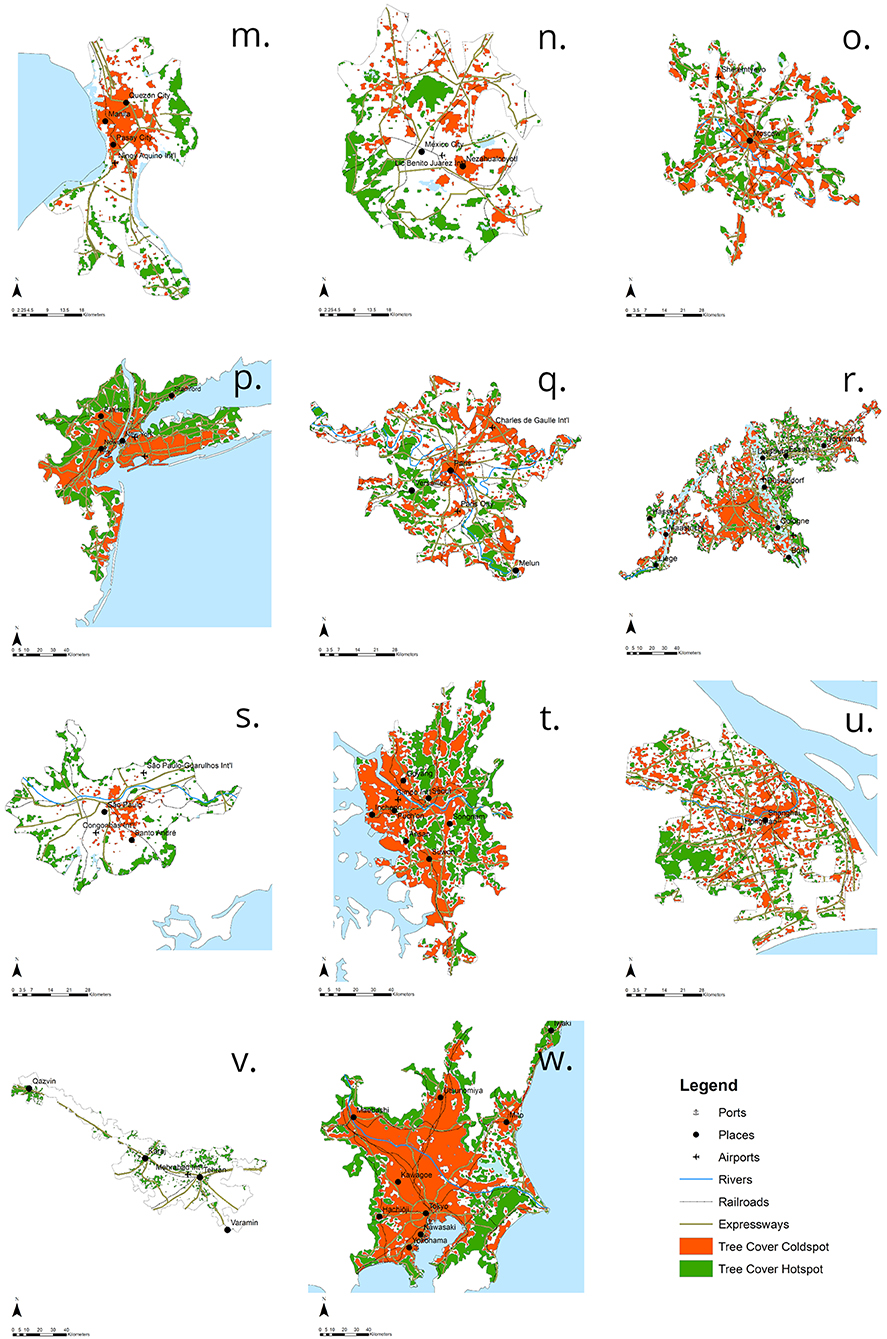
Figure 3B. The hot spot (green) and cold spot (red) clusters, city centers (dots), waters (blue), expressways (yellow lines), railways (black hashed lines), marine ports (anchors), airports (airplanes) within the metropolitan areas of: (a) Manila, (b) Mexico City, (c) Moscow, (d) New York City, (e) Paris, (f) Rhine Ruhr, (g) Sáo Paulo, (h) Seoul, (i) Shanghai, (j) Tehran, (k) Tokyo, (m) Manila, (n) Mexico City, (o) Moscow, (p) New York City, (q) Paris, (r) Rhine Ruhr, (s) Sáo Paulo, (t) Seoul, (u) Shanghai, (v) Tehran, (w) Tokyo.
The spatial pattern of percent tree cover cold spots across the megacities (red color in Figure 3) was largely organized around areas of concentrated urban land use, including downtown, shipping ports, and high density residential, commercial or industrial zones; it often followed expressways or railways. The tree cover cold spots were also analyzed for spatial congruence with land cover categories, which ranked from most to least common as: (1) expressways in 18 cities; (2) downtown and concentrated development in 14 cities; (3) railways in 12 cities; (4) waterfront development in 11 cities; and (5) airports in 4 cities.
Discussion
The MOD44B tree cover maps that use standard deviation of tree cover are a transformative product allowing global access to estimates of tree cover area and spatial patterns, and these maps now enable environmental modeling, monitoring, and management. These global maps had an average difference of 1.8% in their estimate of city-wide tree cover, which ranged from 0.1 to 11.8%, compared with the photo-interpreted estimate. While the differences for some cities can be large relative to the city-wide tree cover provided by photo-interpretation, there is no other global product with the ability to provide equivalent quality, and MOD44B provides it freely with updated maps each year to help track temporal trends. Better than the city-wide estimates of tree cover is the maps ability to explain spatial trends in tree cover. In bins ranging from 0 to 85% tree cover, the agreement had an R2 = 0.97, and for bins < = 30% tree cover, the maps provided >95% accuracy. The 35 megacity maps identified 22,837 km2 of tree cover area among the estimated 0.6 billion residents, generating $117 billion/yr in air pollution reduction benefits based on the urban forest ecosystem benefit analysis of Endreny et al. (2017). The benefits analysis of Endreny et al. (2017) was limited to city-wide tree cover values obtained from photo-interpretation, and these maps together with their i-Tree tools enable analysis of spatial variation in benefits. Low percent tree cover areas of the city may be a priority use for these maps, given such areas are prime candidates for tree cover expansion.
The cause for tree cover underestimation by the MOD44B product, without the standard error added, is attributed to urban pixels containing a mixed spectral signal with development features that the regression models were not trained to classify. The tree cover within a 250 m2 pixel may be part of any variety of tree cover plantings, including larger urban city parks and forests >0.5 ha, pocket parks and gardens, trees on streets or in public squares, and other green spaces with trees, such as riparian corridors, rooftops, and nurseries (FAO, 2016). The issue of tree cover underestimation is not attributed to the quality of the satellite imagery used to generate MOD44B products; images were only used if they passed criteria for clarity of view and lack of cloud cover. Of the 8 imagery date ranges, which effectively span the calendar year, on average 5.7 had no visibility concerns and >90% of pixels provided by MOD44B had at least 1 date range with no visibility concerns.
Alternatives to the MOD44B derived tree cover maps depend on the need for global coverage or freely available products. The global and publicly available LandSat satellite product, although at 30 m resolution, has also been found to underestimate percent tree cover by 9.7% in tests of urban areas across the United States (Greenfield et al., 2009). LandSat does not provide a standard deviation product to correct the error; such correction lowered the MOD44B error to 1.8%. If global coverage is not a requirement, a growing list of individual cities are providing tree cover maps from very high resolution multi-spectral imagery or LiDAR. At the resolution of 1-m tree cover maps and with advanced classification algorithms, Basu et al. (2015) achieved 74% accuracy in California cities, and Erker et al. (2019) achieved 79% accuracy in Wisconsin cities, both using the publicly available US National Agriculture Imagery Program (NAIP) multi-spectral aerial imagery. Erker et al. (2019) also classified tree cover with segments, by combining 1-m pixels, and achieved accuracies >90% for segments 30-m or larger, and a city-wide accuracy of 99.7%. Accuracy is based on classification algorithm, image resolution, and target complexity, demonstrated by accuracies ranging from 80 to 96% for 5 separate segment based classification studies using sub meter imagery (Erker et al., 2019). Some classification algorithms fuse multi-spectral data with LiDAR data to classify the urban tree cover and even tree species, with Alonzo et al. (2014) achieving species accuracy of 83% for a city in California. Ahles et al. (2016) also fuse LiDAR with multi-spectral aerial imagery and hand editing to create urban tree cover maps with > 90% accuracy. As the classification algorithms improve and more high resolution global imagery becomes publicly available, tree cover maps for the global megacities should improve.
The MOD44B tree cover product has previously been limited to tree cover area estimates where development was a small fraction of total cover. In the Brazilian Amazon, tests of the MOD44B product showed it was 90% accurate in detection of deforestation for areas larger than 3 hectares (Morton et al., 2005). In inter-tropical zone forested areas of Mexico, the MOD44B product was used successfully estimate trends in above ground biomass (Aguirre-Salado et al., 2012). Tests of the MOD44B product across all of China, aggregated to 1 km spatial resolution segments, showed it captured patterns of increasing tree cover in different forest biomes, with its accuracy highest in alpine and evergreen forests, and lowest in deciduous broadleaf and deciduous needle-leaf forests (Liu et al., 2006). The main reason for the small error of the MOD44B product in many places across the world is its use of regional calibration to develop regression tree models, which contrasts with global calibration for most other satellite-derived land cover products (Schwarz et al., 2004). If this regional regression were to extend to urban areas with varying tree cover, it may result in a MOD44B product that offers greater accuracy for urban forestry research and management.
The detailed maps of tree cover hot spots, tree cover cold spots, and areas without tree cover can assist global, regional, and local efforts to use urban forests to address more than half of the 17 UN Sustainable Development Goals. Using maps for strategic tree cover management may help with complex threats caused by climate change disruptions. These disruptions indirectly reduce tree cover expansion due to redirected budgets, and also directly reduce tree cover expansion due to extreme temperatures, wildfire, sea-level rise, flooding, drought, salinization of soils, and invasive pathogens, pests (Endreny, 2018). In addition, there are more perceived tree cover disservices with higher temperatures triggering more pollen allergens and pollution pre-cursor emissions from trees (Endreny, 2018). A self-reinforcing feedback loop is possible for expanding urban tree cover, with benefits paying for new discoveries and public-private partnerships that help in specific areas such as tree species selection and broader areas of socialecological frameworks, ecological engineering designs, and eco-technologies that together reshape the urban form to sustainably meet the needs of humans and nature (Endreny, 2018).
The best strategies for urban tree cover expansion will anticipate the drivers of tree cover spatial variation and the causes for expansion, protection, and removal. Locke et al. (2016) describe 4 broad theories that explain drivers of tree cover variation: (1) population density explanation as a zero-sum game of urban growth displacing existing tree cover and opportunities for future tree cover; (2) social stratification explanation as wealthier residents having personal and political power to protect tree cover on their own and nearby public and private lands, with the desire for purchasing tree cover sometimes originating from a habit of consumerism, called the luxury effect; (3) lifestyle explanation as a desire for social acceptance and the tendency to adopt the tree stewardship behaviors of the neighborhood, sometimes called ecology of prestige; and (4) a landscape legacy explanation as a tree cover outcome from historical decisions, noting the lag time between planting, and growth. Multiple drivers can intersect in unexpected ways, as evidenced by the widespread tree cover regeneration and natural expansion in neglected vacant urban lots (Nowak, 2012a). Other drivers of tree cover include high elevation with steep slopes making removal and planting difficult, and urban form such as buildings and expressways, perhaps a subset of the population density explanation (Locke et al., 2016). These drivers may explain tree cluster patterns in the 35 megacities, regardless of their ecoregion, where hot spots were found in high elevation areas, and tree cover cold spots were along highways and other concentrated development comprising urban form.
Recognizing that inequalities in wealth and power help explain the uneven distribution of tree cover, environmental justice becomes a necessary strategy in managing for tree cover and services. In the US megacities of Los Angeles and New York City, tree cover was positively correlated with median household income (Schwarz et al., 2015). Landry and Chakraborty (2009) found the inequity hypothesis explained a significantly lower tree cover in public spaces within low-income and minority neighborhoods. A larger literature review found a non-uniform but established tendency for less tree cover in areas of low-income and minority residents, and concluded this is an environmental injustice given those communities are likely missing out on the associated ecosystem services (Gerrish and Watkins, 2018). Across European countries, the World Health Organization determined that regardless of tree cover proximity to low-income neighborhoods, residents in those neighborhoods are more vulnerable and suffer greater health impacts of air pollution (World Health Organization, 2010a,b).
Globally, vulnerability to air pollution, and particularly PM2.5, has been shown to increase with decreasing socioeconomic status, and exposure increases with proximity to high traffic major roadways. Hajat et al. (2015) found that even when air pollution exposure in Europe increased for higher income residents, across Africa, Asia, Europe and North America the adverse cardiovascular and pulmonary impacts from air pollution disproportionately affected those with low socioeconomic status. A literature review by Brugge et al. (2015) showed traffic related air pollutants extend beyond major roadways by 200–400 m, and residents within this range have the highest rates of cardiovascular and pulmonary impacts. Strategies for reducing health impacts of these air pollutants, beyond the mechanical measures (which are important) and include the use of trees as buffers, barriers and filters (Brugge et al., 2015). The exposure and impact to traffic related air pollutants extends beyond local residents and includes those commuting and working near major roadways (Brantley et al., 2014). Brantley et al. (2014) advocate for strategically using trees and associated vegetation to achieve air quality improvements, and obtain regulatory benefits of moderating temperature, stormwater, and noise pollution, as well as cultural, supporting, and provisioning services. To achieve the air quality benefits, Brantley et al. (2014) emphasize that tree planting proceed with expert input so as to avoid inadvertently trapping or concentrating pollutants and other disservices. There are even more incentives to increase tree cover and reduce air pollution given the preliminary findings shows reduced exposure to PM2.5 results in lower death rates from the virus SARS-CoV-2 that created the 2019–20 coronavirus pandemic (Wu et al., 2020).
Tree cover expansion should extend beyond the major roadways to benefit all residents and capture multiple benefits. Innovative ideas include the use of vertical forests for cities increasing in building height, more landscaping trees for those increasing in building coverage, and more forested parks near high density dwellings (Moller, 2015). Tree cover expansion plans should anticipate changes in urban form as cities respond to disruptive technologies, climate change and natural disasters, and increasing urban populations. Three gradual ways urban form has accommodated population growth are: (1) increasing building crowding, i.e., population per floor area; (2) increasing building height, i.e., ratio of floor area to footprint of residential building; and (3) increasing building coverage, i.e., urban sprawl and proportion of city occupied by residential buildings (The Economist, 2019). We should anticipate each urban area will need and want their tree maps to craft local strategies to manage tree cover and secure needed benefits. To this end, a global program called Tree Cities of the World was launched by the Food and Agriculture Organization of the UN and the Arbor Day Foundation to help cities achieve individual targets for tree cover expansion. Using the maps from this research, cities could provide programming that gets the most vulnerable and those with nature-deficit disorder into nearby tree cover hot spots and harvest their renewable resource benefits. Connecting citizens with the pleasures of the urban forest will result in more forest stewards helping to expand tree cover.
Conclusions
This study prepared, tested, and characterized percent tree cover maps using the 2017 MOD44B tree cover and standard deviation product for 35 megacities across the world. The study demonstrated:
1. The combined MOD44B tree cover and standard deviation of tree cover products generated maps with average city-wide tree cover within 1.8% of the photo-interpreted estimate 19.9%.
2. Across 35 megacities, the tree cover maps explained tree cover trends from low to high tree cover with a coefficient of determination of 0.97, and was most accurate in pixels that had 30% or less tree cover.
3. Statistical tests at p = 0.05 showed the tree cover spatial distribution was not random within megacities, and exhibited significant clustering into hot spots of relatively high tree cover and cold spots of relatively low tree cover.
4. The tree cover hot spots were primarily organized at the city edges abutting agriculture or wetlands, and in high elevation terrain likely difficult to develop.
5. The tree cover cold spots were primarily in highly developed areas and along expressway and other transportation corridors, where traffic related air pollution and lower-income residents often intersect and result in adverse health impacts.
The maps of tree cover provide needed inputs for predictive models of ecosystem services, such as i-Tree Tools, and they can be updated each year with new MOD44B data. The next steps involve using these maps, or better local maps when available, to assess the spatial distribution of ecosystem services and associated vulnerabilities within cities. Holistic tree cover expansion programs can diminish socioeconomic disparities and improve human well-being and biodiversity.
Headings
Permission to Reuse and Copyright
Figures, tables, and images will be published under a Creative Commons CC-BY license and permission must be obtained for use of copyrighted material from other sources (including re-published/adapted/modified/partial figures and images from the internet). It is the responsibility of the authors to acquire the licenses, to follow any citation instructions requested by third-party rights holders, and cover any supplementary charges.
Data Availability Statement
All datasets generated for this study are included in the article/Supplementary Material.
Author Contributions
TE and DN developed the research study. TE and FS completed the data processing. TE, FS, and DN analyzed the data and wrote the manuscript.
Funding
This work was from USDA Forest Service Northern Research Station i-Tree grant No. 15-JV-11242308-114.
Conflict of Interest
The authors declare that the research was conducted in the absence of any commercial or financial relationships that could be construed as a potential conflict of interest.
Acknowledgments
We acknowledge assistance from SUNY ESF student Natasha Duran for her assistance in obtaining and processing the MOD44B data, and from University of Maryland researcher Dr. John Townshend for guidance in using the MOD44B product.
Supplementary Material
The Supplementary Material for this article can be found online at: https://www.frontiersin.org/articles/10.3389/frsc.2020.00016/full#supplementary-material
References
Aguirre-Salado, C. A., Trevino-Garza, E. J., Aguirre-Calderon, O. A., Jimenez-Perez, J., Gonzalez-Tagle, M. A., Valdez-Lazalde, J. R., et al. (2012). Construction of aboveground biomass models with remote sensing technology in the intertropical zone in Mexico. J. Geogr. Sci. 22, 669–680. doi: 10.1007/s11442-012-0955-9
Ahles, N., MacFaden, S., O'Neil-Dunne, J., Royar, A., and Engel, T. (2016). “GEOBIA systems for massive data processing,” in GEOBIA 2016 : Solutions and Synergies (University of Twente Faculty of Geo-Information and Earth Observation (ITC)), 1–4. Available online at: https://proceedings.utwente.nl/457/
Alonzo, M. B., and Bookhagen, D. A. Roberts (2014). Urban tree species mapping using hyperspectral and lidar data fusion. Remote Sens. Environ. 148, 70–83.
Antonarakis, A. S., Munger, J. W., and Moorcroft, P. R. (2014). Imaging spectroscopy- and lidar-derived estimates of canopy composition and structure to improve predictions of forest carbon fluxes and ecosystem dynamics. Geophys. Res. Lett. 41, 2535–2542. doi: 10.1002/2013GL058373
Basu, S., Ganguly, S., Nemani, R., Mukhopadhyay, S., Zhang, G., Milesi, C., et al. (2015). A semiautomated probabilistic framework for tree-cover delineation from 1-m NAIP imagery using a high-performance computing architecture. IEEE Trans. Geosci. Remote Sens. 53, 5690–5708. doi: 10.1109/TGRS.2015.2428197
Box, G. E. P., Hunter, W. G., and Hunter, J. S. (1978). Statistics For Experimenter. New York, NY: John Wiley & Sons.
Brantley, H. L., Hagler, G. S., Deshmukh, P. J., and Baldauf, R. W. (2014). Field assessment of the effects of roadside vegetation on near-road black carbon and particulate matter. Sci. Total Environ. 468–469, 120–129. doi: 10.1016/j.scitotenv.2013.08.001
Brisbois, B., O'Campo, P., and Kamalanathan, J. (2019). Inequities in Cities and in Urban Health. Urban Health. New York, NY: Oxford University Press.
Brugge, D., Patton, A. P., Bob, A., Reisner, E., Lowe, L., Bright, O. M., et al. (2015) Developing community-level policy practice to reduce traffic-related air pollution exposure. Environ. Justice 8, 95–104. doi: 10.1089/env.2015.0007
Costanza, R., dArge, R., de Groot, R., Farber, S., Grasso, M., Hannon, B., et al. (1997). The value of the world's ecosystem services and natural capital. Nature 387, 253–260. doi: 10.1038/387253a0
Endreny, T., Santagata, R., Perna, A., Stefano, C. D., Rallo, R. F., and Ulgiati, S. (2017). Implementing and managing urban forests: a much needed conservation strategy to increase ecosystem services and urban wellbeing. Ecol. Model. 360, 328–335. doi: 10.1016/j.ecolmodel.2017.07.016
Endreny, T. A. (2018). Strategically growing the urban forest will improve our world. Nat. Commun. 9:1160. doi: 10.1038/s41467-018-03622-0
Erker, T., Wang, L., Lorentz, L., Stoltman, A., and Townsend, P. A. (2019). A statewide urban tree canopy mapping method. Remote Sens. Environ. 229, 148–158. doi: 10.1016/j.rse.2019.03.037
FAO (2016). “Guidelines on urban and peri-urban forestry,” in FAO Forestry Paper No. 178, eds F. Salbitano, S. Borelli, M. Conigliaro, and Y. Chen (Rome: Food and Agriculture Organization of the United Nations), 53–99. Available online from: http://www.fao.org/3/a-i6210e.pdf.
Gerrish, E., and Watkins, S. L. (2018). The relationship between urban forests and income: a meta-analysis. Landsc. Urban Plan. 170, 293–308. doi: 10.1016/j.landurbplan.2017.09.005
Getis, A., and Ord, J. K. (1992). The analysis of spatial association by use of distance statistics. Geogr. Anal. 24, 189–206. doi: 10.1111/j.1538-4632.1992.tb00261.x
Greenfield, E. J., Nowak, D. J., and Walton, J. T. (2009). Assessment of 2001 NLCD percent tree and impervious cover estimates. Photogramm. Eng. Remote Sens. 75, 1279–1286. doi: 10.14358/PERS.75.11.1279
Hajat, A., Hsia, C., and O'Neill, M. S. (2015). Socioeconomic disparities and air pollution exposure: a global review. Curr. Environ. Health Rep. 2, 440–450. doi: 10.1007/s40572-015-0069-5
Hodson, C. B., and Sander, H. A. (2017). Green urban landscapes and school-level academic performance. Landsc. Urban Plan. 160, 16–27. doi: 10.1016/j.landurbplan.2016.11.011
IPCC (2019). Climate Change and Land: IPCC Special Report on Climate Change, Desertification, Land Degradation, Sustainable Land Management, Food Security, and Greenhouse Gas Fluxes in Terrestrial Ecosystems.
Landry, S. M., and Chakraborty, J. (2009). Street trees and equity: evaluating the spatial distribution of an urban amenity. Environ. Plan. A 41, 2651–2670. doi: 10.1068/a41236
Liu, R. G., Liang, S. L., Liu, J. Y., and Zhuang, D. F. (2006). Continuous tree distribution in China: a comparison of two estimates from moderate-resolution imaging spectroradiometer and landsat data. J. Geophys. Res. Atmos. 111:11. doi: 10.1029/2005JD006039
Locke, D. H., Landry, S. M., Grove, J. M., and Roy Chowdhury, R. (2016). What's scale got to do with it? Models for urban tree canopy. J. Urban Ecol. 2, 1–16. doi: 10.1093/jue/juw006
McDonald, R. I., Green, P., Balk, D., Fekete, B. M., Revenga, C., Todd, M., et al. (2011). Urban growth, climate change, and freshwater availability. Proc. Natl. Acad. Sci. U.S.A. 108, 6312–6317. doi: 10.1073/pnas.1011615108
Millennium Ecosystem Assessment (2005). Ecosystems and Human Well-being: Synthesis. Washington, DC: Island Press.
Moller, E. (2015). Suggestions for the skyscrapers of tomorrow - international highrise award 2014. Stahlbau 84, 139–U195. doi: 10.1002/stab.201520242
Morton, D. C., DeFries, R. S., Shimabukuro, Y. E., Anderson, L. O., Espirito-Santo, F., Hansen, M., et al. (2005). Rapid assessment of annual deforestaion in the Brazilian Amazon using MODIS data. Earth Interact. 9:22. doi: 10.1175/EI139.1
Nowak, D. J. (2012a). Contrasting natural regeneration and tree planting in fourteen North American cities. Urban For. Urban Green. 11, 374–382. doi: 10.1016/j.ufug.2012.02.005
Nowak, D. J. (2012b). A Guide to Assessing Urban Forests, USDA Forest Service, Northern Research Station Resources Bulletin. NRS-INF-24-13. Newtown Square: PA.
Nowak, D. J. (2018). Improving city forests through assessment, modelling and monitoring. Unasylva 69, 30–36.
Nowak, D. J., and Dwyer, J. F. (2007). “Understanding the benefits and costs of urban forest ecosystems,” in Urban and Community Forestry in the Northeast, ed. J. E. Kuser (Dordrecht: Springer), 25–46.
Nowak, D. J., and Greenfield, E. J. (2018a). Declining urban and community tree cover in the United States. Urban For. Urban Green. 32, 32–55. doi: 10.1016/j.ufug.2018.03.006
Nowak, D. J., and Greenfield, E. J. (2018b). US Urban forest statistics, values, and projections. J. Forestry 116, 164–177. doi: 10.1093/jofore/fvx004
Nowak, D. J., Hirabayashi, S., Bodine, A., and Greenfield, E. (2014). Tree and forest effects on air quality and human health in the United States. Environ. Pollut. 193, 119–129. doi: 10.1016/j.envpol.2014.05.028
Parrish, D. D., and Zhu, T. (2009). Clean air for megacities. Science 326, 674–675. doi: 10.1126/science.1176064
Schneider, A. M. A., and Friedl, D. Potere (2010). Mapping global urban areas using MODIS 500-m data: New methods and datasets based on ‘urban ecoregions'. Remote Sens. Environ. 114, 1733–1746.
Schwarz, K., Fragkias, M., Boone, C. G., Zhou, W., McHale, M., Grove, J. M., et al. (2015). Trees grow on money: urban tree canopy cover and environmental justice. PLoS ONE 10:e0122051. doi: 10.1371/journal.pone.0122051
Schwarz, M., Zimmermann, N. E., Wildi, O., and Kienast, F. (2004). Mapping of land cover continuous fields using MODIS data in Switzerland. Botanica Helvetica 114, 151–167. doi: 10.1007/s00035-004-0693-4
Seto, K. C., Guneralp, B., and Hutyra, L. R. (2012). Global forecasts of urban expansion to 2030 and direct impacts on biodiversity and carbon pools. Proc. Natl. Acad. Sci. U.S.A. 109, 16083–16088. doi: 10.1073/pnas.1211658109
The Economist (2019). Urban growth: modern cities become less dense as they grow. Econ. Oct. 5. Available online at: https://www.economist.com/graphic-detail/2019/10/05/modern-cities-become-less-dense-as-they-grow
Townshend, J., Hansen, M., Carroll, M., DiMiceli, C., Sohlberg, R., and Huang, C. (2013). User Guide for the MODIS Vegetation Continuous Fields Product Collection 5 Version 1.
United Nations (2016). Sustainable Development Goals. Transforming Our World: The 2030 Agenda for Sustainable Development (2016). Retrieved online from: https://sustainabledevelopment.un.org/sdgs. (accessed on June 30, 2016)
Vibrant Cities Lab (2018). Urban and Community Forestry Program. Available online at: from https://www.fs.fed.us/ucf/supporting_docs/UCF-Brief-Feb2018.pdf (accessed 16, Feb 2018).
World Health Organization (2010a). Environment and Health Risks: a Review of the Influence and Effects of Social Inequalities. Copenhagen, Denmark: WHO Regional Office for Europe.
World Health Organization (2010b). Hidden Cities: Unmasking and Overcoming Health Inequities in Urban Settings. Geneva Switzerland: Population Division, Department for Economic and Social Affairs.
Keywords: megacities, MOD44B, tree cover inequality, social justice, air pollution, COVID-19
Citation: Endreny T, Sica F and Nowak D (2020) Tree Cover Is Unevenly Distributed Across Cities Globally, With Lowest Levels Near Highway Pollution Sources. Front. Sustain. Cities 2:16. doi: 10.3389/frsc.2020.00016
Received: 20 November 2019; Accepted: 16 April 2020;
Published: 15 May 2020.
Edited by:
Sergio Ulgiati, University of Naples Parthenope, ItalyReviewed by:
Luca Coscieme, Trinity College Dublin, IrelandJungho Im, Ulsan National Institute of Science and Technology, South Korea
Wendy Y. Chen, The University of Hong Kong, Hong Kong
Copyright © 2020 Endreny, Sica and Nowak. This is an open-access article distributed under the terms of the Creative Commons Attribution License (CC BY). The use, distribution or reproduction in other forums is permitted, provided the original author(s) and the copyright owner(s) are credited and that the original publication in this journal is cited, in accordance with accepted academic practice. No use, distribution or reproduction is permitted which does not comply with these terms.
*Correspondence: Theodore Endreny, te@esf.edu