Impact of Storm-Enhanced Density (SED) on Ion Upflow Fluxes During Geomagnetic Storm
 Shasha Zou
 Jiaen Ren1
  Zihan Wang
 Hu Sun
 Yang Chen
- 1Department of Climate and Space Sciences and Engineering, University of Michigan, Ann Arbor, MI, United States
- 2Department of Statistics, University of Michigan, Ann Arbor, MI, United States
The impact of the dynamic evolution of the Storm-Enhanced Density (SED) on the upward ion fluxes during the March 06, 2016 geomagnetic storm is studied using comprehensive multi-scale datasets. This storm was powered by a Corotating Interaction Region (CIR), and the minimum Sym-H reached ∼−110 nT. During the ionospheric positive storm phase, the SED formed and the associated plume and polar cap patches occasionally drifted anti-sunward across the polar cap. When these high-density structures encountered positive vertical flows, large ion upward fluxes were produced, with the largest upward flux reaching 3 × 10¹⁴ m−2s−1. These upflows were either the type-1 ion upflow associated with fast flow channels, such as the subauroral polarization stream (SAPS) channel, or the type-2 ion upflow due to soft particle precipitations in the cusp region. The total SED-associated upflow flux in the dayside cusp can be comparable to the total upflow flux in the nightside auroral zone despite the much smaller cusp area compared with the auroral zone. During the ionospheric negative storm phase, the ionospheric densities within the SED and plume decreased significantly and thus led to largely reduced upward fluxes. This event analysis demonstrates the critical role of the ionospheric high-density structures in creating large ion upward fluxes. It also suggests that the dynamic processes in the coupled ionosphere-thermosphere system and the resulting state of the ionospheric storm are crucial for understanding the temporal and spatial variations of ion upflow fluxes and thus should be incorporated into coupled geospace models for improving our holistic understanding of the role of ionospheric plasma in the geospace system.
Introduction
The Earth’s ionosphere is a crucial plasma source for the magnetosphere, in particular for heavy ions such as O+ (e.g., Yau et al., 2011; Moore and Horwitz, 2007; Lotko 2007; Welling et al., 2015; Chappell, 2015 and references therein). Once arriving the magnetosphere, these heavy ions have been shown to be able to regulate the magnetospheric dynamics (Kronberg et al., 2014 and references therein), such as increasing the heavy ion concentration in the ring current (e.g., Daglis et al., 1999 and references therein) and modulating the magnetotail dynamics (e.g., Garcia et al., 2010). The influence of the ionospheric O+ outflow on magnetospheric dynamics is found to depend on the source location (Yu and Ridley, 2013).
Ion upflow in the F-region and topside ionosphere is a critical first step for the ion outflow into the magnetosphere. The velocities of the upward moving ions at these altitudes typically have not reached their escaping values yet, and thus these ion flows are termed upflow and not outflow. The ion upflow pumps plasmas to higher altitudes (>∼1,000 km) and then additional energization processes at those altitudes can further accelerate plasmas to reach their escape velocities (e.g., Strangeway, 2005). Since those additional energization processes seem common, (Nilsson et al., 2008; Nilsson, 2011) suggested that the eventual ion ouflow is mainly determined by the initial ion upflow process. Besides the upward lifting, ion downward flows have also been observed in the F-region and topside ionosphere, which can push plasma to lower altitudes where the recombination rate is higher thereby resulting in enhanced losses (e.g., Loranc et al., 1991; Buchert et al., 2004; Ogawa et al., 2009; Ren et al., 2019, 2020). The downward flows can occur independently or together with upflows, i.e., divergent flows (e.g., Zou et al., 2017). Understanding the physical processes in the coupled ionosphere-thermosphere regime that could regulate the ion upflow fluxes is of central importance for understanding the mass, momentum and energy flow in the geospace system.
During geomagnetic storms, the ionospheric responses are often termed as positive/negative ionospheric storms phases. They refer to the period when the storm-time ionospheric density or TEC changes are positive/negative when comparing against the quiet-time values. During positive ionospheric storm phase, there are a few important high-density structures in the mid-to high-latitude ionosphere that could affect the ion upflow fluxes, such as the storm-enhanced density (SED) and SED plumes (e.g., Foster et al., 2005; Zou et al., 2013; Zou et al., 2014; Heelis, 2016; Foster et al., 2021), as well as polar cap patches (e.g., Zhang et al., 2013; Zhang et al., 2016; Ren et al., 2019, Ren et al., 2020; Zou et al., 2021). In this study, the SED base refers to the broadly distributed mid-latitude density enhancement, and the SED plume refers to the narrow and poleward extending portion of the SED, including when it is carried by the anti-sunward convection flows moving towards the nightside. Convective transport of such high-density structures into regions with enhanced precipitating particle fluxes or enhanced convection flows has been suggested to be an important mechanism of generating large ion upflow fluxes (Lotko, 2007 and references therein; Yau et al., 2011 and reference therein). Without energization, the field-aligned plasma flows within these high-density structures are usually downward (Zou et al., 2014; Ren et al., 2019; Ren et al., 2020). When these high-density structures drift poleward following the convection flows to regions, such as the dayside cusp and the nightside auroral zone, intense upflow fluxes and even divergent fluxes can form.
Large ion upflow fluxes that associated with the polar cap patches and SEDs have been observed before (Semeter et al., 2003; Yuan et al., 2008; Zhang et al., 2016). Semeter et al. (2003) used Sondrestrom incoherent scatter radar (ISR) and attributed a strong ion upflow flux event, i.e., ∼1.0 × 10¹⁴ m−2s−1, with a drifting polar cap patch. When the SED plume reached the nightside polar cap boundary, large vertical ion fluxes of ∼1.2 × 10¹⁴ m−2s−1 were measured by the DMSP satellite (Yuan et al., 2008). More recently, using the Poker Flat ISR (PFISR), (Zou et al., 2017) reported an event that the open-closed field-line boundary expanded equatorward into a SED plume and produced an intense upflow flux reaching ∼1.9 × 10¹⁴ m−2s−1 at 600 km. Using numerical simulations, (Zeng and Horwitz, 2007; Zeng and Horwitz, 2008) compared the efficiency of the O+ outflow produced by soft electron precipitation and the SED plasma and found that they can produce a comparable amount of outflow flux. Recently, (Cohen et al., 2015) found that increased initial density before the onset of precipitation leads to smaller electron temperature increases, lower upflow speeds, and longer upflow timescales but larger upflow fluxes. These observations and numerical simulation studies indicate the importance and efficiency of the high-density structures in producing large ion upflow fluxes.
Recent studies revealed considerable variations within the SED and SED plume, and that the dynamics of SED during storms is mainly determined by the dynamic interplay between the convection electric field and the thermospheric wind pattern during the positive ionospheric storm phase (Lu et al., 2012; Zou et al., 2013; Zou et al., 2014; Liu et al., 2016) and by the thermospheric composition change during the negative ionospheric storm phase (e.g., Prölss, 2008; Wang et al., 2021). In addition, the SED has large longitudinal variations because of the miss-match between the geomagnetic and geographic poles (Coster et al., 2007; Thomas et al., 2016). Coster et al. (2007) found that SED are usually stronger in the Northern America sector. In addition, high-density structures in the polar region are found to occur more frequently between 12 and 24 UT and during winter times (David et al., 2016). Since the SED and plume are highly dynamic during storms and they can significantly affect the ion upflow fluxes, it is critical to evaluate the mutual evolution of the SED and the upflow fluxes during storms.
In this study, we analyzed the evolution of the SED and plume using global TEC, convection and field-aligned currents (FACs) data, and its impact on the ion upflow fluxes measured by the DMSP satellites during March 06, 2016, geomagnetic storm. Datasets and Methodology describes the major datasets that we use in this study. Results describes the results of the event and our analyses and interpretations. We summarize and conclude the study in Summary and Conclusion.
Datasets and Methodology
GNSS TEC
Ionospheric TEC can be calculated using the different delays of two transmitted frequencies from multi-frequency GNSS, including GPS. Recent years have witnessed an increased interest in investigating the ionospheric density variations during geomagnetic disturbances due to the fast-growing number of ground-based GPS receivers and the resulting regional or even global scale 2-D GPS TEC maps. We use the world-wide GNSS Vertical TEC (VTEC) data distributed in the publicly available CEDAR Madrigal database. The processed and binned VTEC data have a spatial resolution of 1° × 1° in geographical coordinates and a temporal resolution of 5 min. Detailed information about the data processing procedure has been described in Rideout and Coster (2006).
The Madrigal TEC data were ingested into the recently developed TEC matrix completion tool called VISTA (Video Imputation with SoftImpute, Temporal smoothing and Auxiliary data) (Sun et al., 2021). The VISTA algorithm is based on the SoftImpute software and contains two extensions of temporal smoothing and auxiliary data. In this case, the auxiliary data is the spherical harmonic fitting of the Madrigal TEC data. The VISTA model is able to provide completed TEC map and preserves the meso-scale TEC features in the final output, which is important for tracking high-density structures in our study.
SuperDARN
The SuperDARN is an international collaboration operating high-frequency (HF) coherent radars in both the Northern and Southern Hemispheres (Greenwald et al., 1995; Chisham et al., 2007). They enable us to image the large-scale ionospheric convection and thus electric fields with high temporal resolution (∼1–2 min). The SuperDARN radars operate 24 h a day, 365 days a year and have been generating a large amount of data.
AMPERE
Based on measurement of magnetic field perturbations from the Iridium Communications constellation of more than 70 satellites at low Earth orbits (∼780 km), Active Magnetosphere and Planetary Electrodynamics Response Experiment (AMPERE) can provide a global view of Birkeland FACs in the high-latitude ionosphere. The orbits of the satellites form 12 longitudinal planes equally spaced by 2 h, and the satellites along each track are separated by 9 min. The magnetic field perturbation data are calibrated and then used in spherical harmonic inversion (Anderson et al., 2000). The FACs are derived by taking the curl of the fitted perturbations and are provided in the Altitude Adjustment Corrected GeoMagnetic (AACGM) coordinates on a 1 h local time by 1° latitude grid. More detailed description of the data product can be found in Anderson et al. (2014) and references therein.
DMSP
DMSP satellites are equipped with comprehensive instruments that can measure the precipitating particles from the solar wind and magnetosphere as well as the ionospheric thermal plasma characteristics. DMSP SSIES (Special Sensor for Ions, Electrons, and Scintillation) plasma instrument package is mainly used in this study and can measure the ionospheric thermal ion and electron temperatures, ion density and composition, as well as cross-track and vertical drifts. The DMSP horizontal velocities are shown in the inertial reference frame. In the auroral and polar region, vast majority of the ions at the DMSP altitude is O+ and the total ion density or plasma density is essentially the same as the O+ density. The product of the plasma density and vertical drift is used to study the vertical flux in the polar region (e.g., Coley et al., 2006). DMSP SSJ (Special Sensor J) precipitating particle instrument are also used to analyzing the generation mechanism of upflows. They can measure precipitating electrons and protons from 30 eV to 30 keV.
PFISR
The PFISR radar is part of the NSF-supported advanced modular incoherent scatter radar (AMISR) facility that is used to conduct studies of the upper atmosphere and to observe space weather events. It can simultaneously measure the altitude profiles of important ionospheric parameters, such as electron density, electron/ion temperatures, and line-of-sight ion velocity. PFISR was in the four-beam low-duty cycle mode during this period. Two types of pulses were transmitted, a long pulse and an alternating code pulse. The former is appropriate for F-region measurements (>175 km) and the latter for the E region (<175 km). Electron density measurements from these two pulses were combined to produce the altitude profiles in this study. The convection flows are calculated using the method described in Heinselman and Nicolls (2008).
TIMED GUVI
The Global Ultraviolet Imager (GUVI) onboard NASA TIMED can yield global maps of thermospheric composition, including maps of the ratio between the O and N2 column densities, which can monitor the neutral composition changes during geomagnetic activities (Strickland et al., 1995; Zhang et al., 2004). During this storm, the TIMED satellite was in the early afternoon to postmidnight orbital plane, which is ideal to observe the thermosphere composition change impact on the SED.
Results
Solar Wind and IMF
Figure 1 shows the solar wind and IMF conditions for this geomagnetic storm together with the AE and Sym-H indices at the bottom. During this storm, the Sym-H minimum reached ∼−110 nT, and thus this storm should be classified as an intense geomagnetic storm. During these 2 days, the solar wind speed gradually increased from ∼360 km/s to ∼600 km/s but no shock formed, and the IMF had large fluctuations during the velocity increasing period, which are classical signatures of corotating interaction region (CIR). The three vertical lines highlight the three important times. The first vertical line indicates the sudden negative IMF By increase (t1: ∼11:25 UT on March 06, 2016) and the beginning of the enhanced geomagnetic activities signaled by the gradually elevated AE. The IMF southward turning occurred at ∼15 UT and led to the rapid Sym-H decrease and supersubstorm with AE reaching 1,500 nT. The second vertical line indicates the time when the Sym-H reached minimum (t2: ∼21:20 UT on March 06, 2016). The last vertical line highlights the decline of the enhanced solar wind driving (t3: 06 UT on March 07), signaled by the solar wind dynamic pressure decrease and the reduction in the IMF fluctuation magnitude.
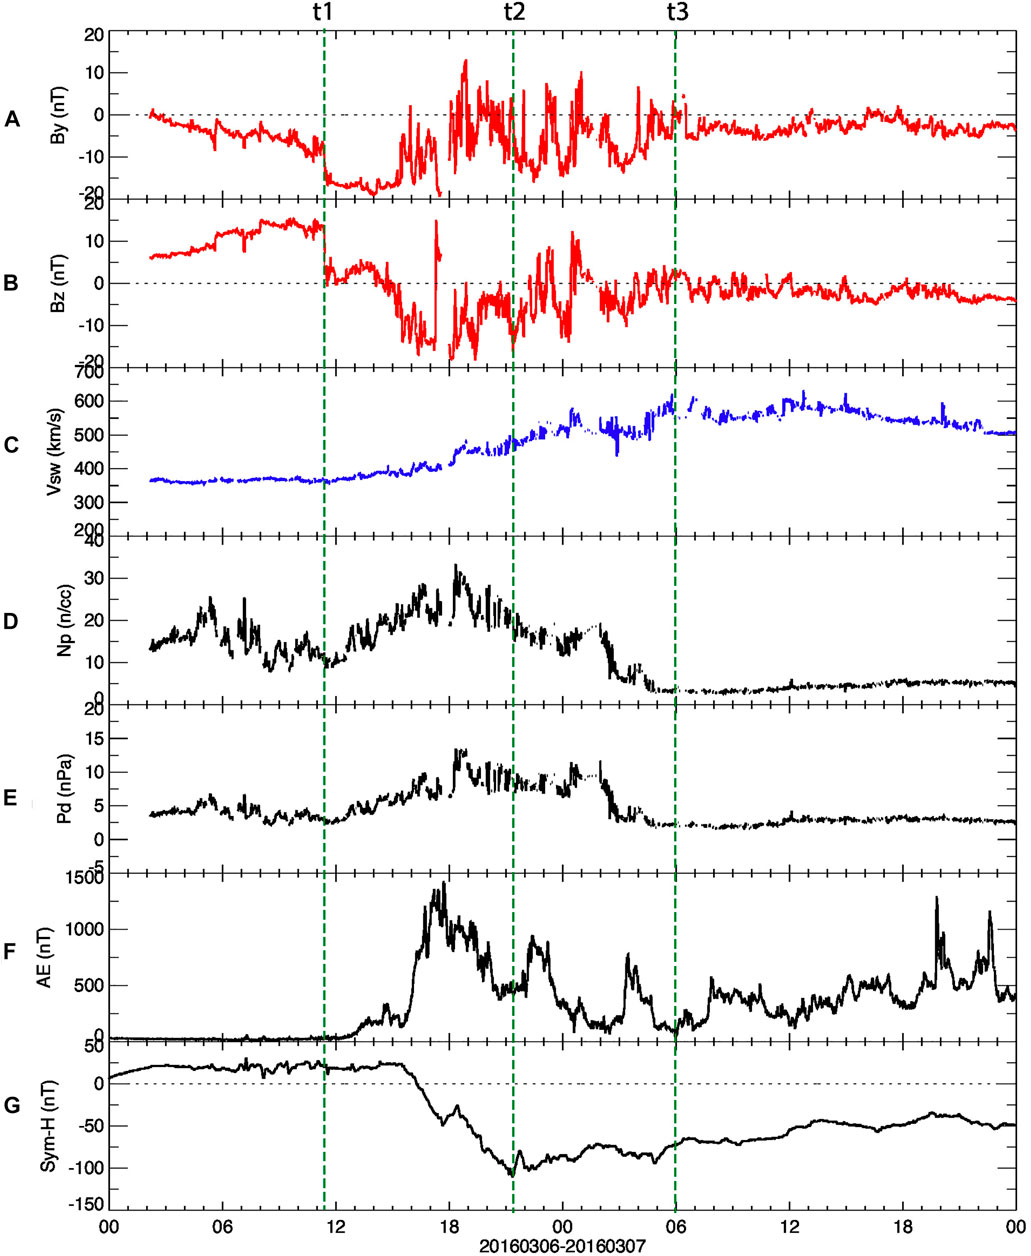
FIGURE 1. Solar wind and IMF observations for March 06–07, 2016. From top to bottom, (A) IMF By, (B) IMF Bz, (C) solar wind speed, (D) proton number density, (E) dynamic pressure, (F) auroral electrojet index (AE), and (G) Sym-H index are shown. The IMF components are shown in Geocentric Solar Magnetospheric (GSM) coordinates. The three vertical lines indicate the times of sudden IMF By increase (t1: 11:47 UT on March 06, 2016), Sym-H reaching minimum (t2: 21:20 UT on March 06, 2016), and ending of large IMF fluctuation (t3: 06 UT on March 07).
Evolution of SED During Storm
The TEC, SuperDARN convection and AMPERE FACs were combined and plotted in Figure 2 at a cadence of every 3 h starting at 11 UT on March 06. These combined data are shown in the magnetic local time (MLT) and magnetic latitude coordinates and reveal the mutual evolution of the ionospheric TEC and the electrodynamics resulted from the magnetosphere-ionosphere coupling processes. A supplementary movie in the same format as Figure 2 is also provided at a time cadence of every 2 min. Figure 2A shows the conditions just before the enhanced solar wind driving t1, and the TEC map shows the quiet time typical diurnal pattern with higher TEC on the day side and lower TEC on the night side. The convection and FACs were consistent with the quiet-time patterns confined near the pole. After t1 (Figure 2B), the convection and FACs started to expand to lower latitudes, and the SED began to develop in the early afternoon sector. Following the IMF southward turning, solar wind energy continuously entered the geospace system and the convection and FACs kept expanding to low latitudes (Figure 2C). Near the peak of the storm time t2 (Figure 2D), the Region-2 FAC system reached below 60° mlat in the afternoon sector and close to 55° mlat in the premidnight sector. During this period, the SED further developed and multiple polar cap patches and the SED plume entered the polar cap and drifted anti-sunward. Figures 2E–H show the decay of solar wind driving signaled by the shrinking of convection and weakening of the FACs. The impact of the negative ionospheric storm also became clear first in the morning sector and then gradually expanded to later local times. In particular, the SED plume narrowed, the TEC values decreased, and the plume eventually completely disappeared.
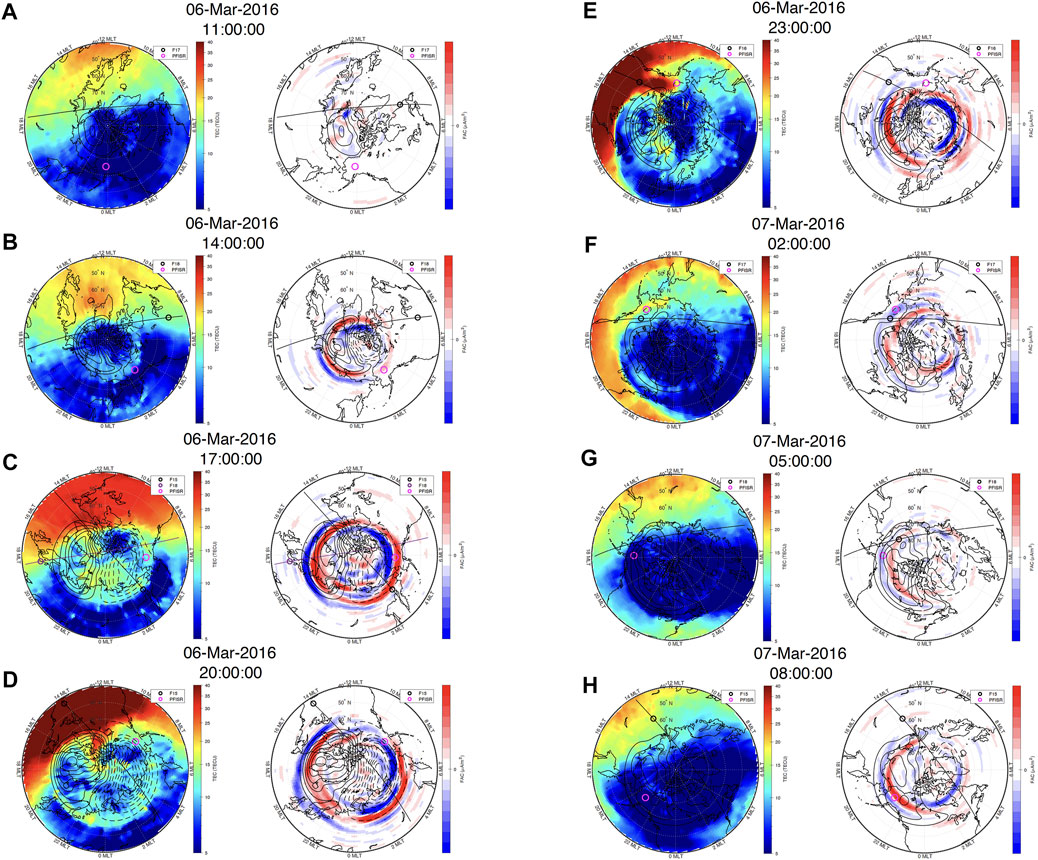
FIGURE 2. Polar view of the northern hemisphere TEC, SuperDARN convection, and AMPERE FACs in the MLT and magnetic latitude coordinates at a cadence of every 3 h starting at 11 UT on March 06. The low latitude boundary in each panel is 40° mlat. In addition, trajectories of the DMSP satellites and their locations (circles) at the time of the plot are shown. Upward FACs are positive and in red colors, while downward FACs are negative and in blue colors.
In order to capture the FACs and SED dynamics in a single plot, the time series of the TEC and FACs at 14 MLT from 40° mlat to 90° mlat are shown in Figure 3. The three vertical lines indicate the same important times as shown in Figure 1. As one can see, the FACs at 14 MLT strengthened and expanded equatorward after t1 and retreated to higher latitudes after t2 during the recovery phase of the storm. After that, their strength and location were relatively steady until the end of March 07. Several SED plume and polar cap patches can be seen extending to the pole, including two wide plumes drifting anti-sunward at ∼17 UT, 20 UT.
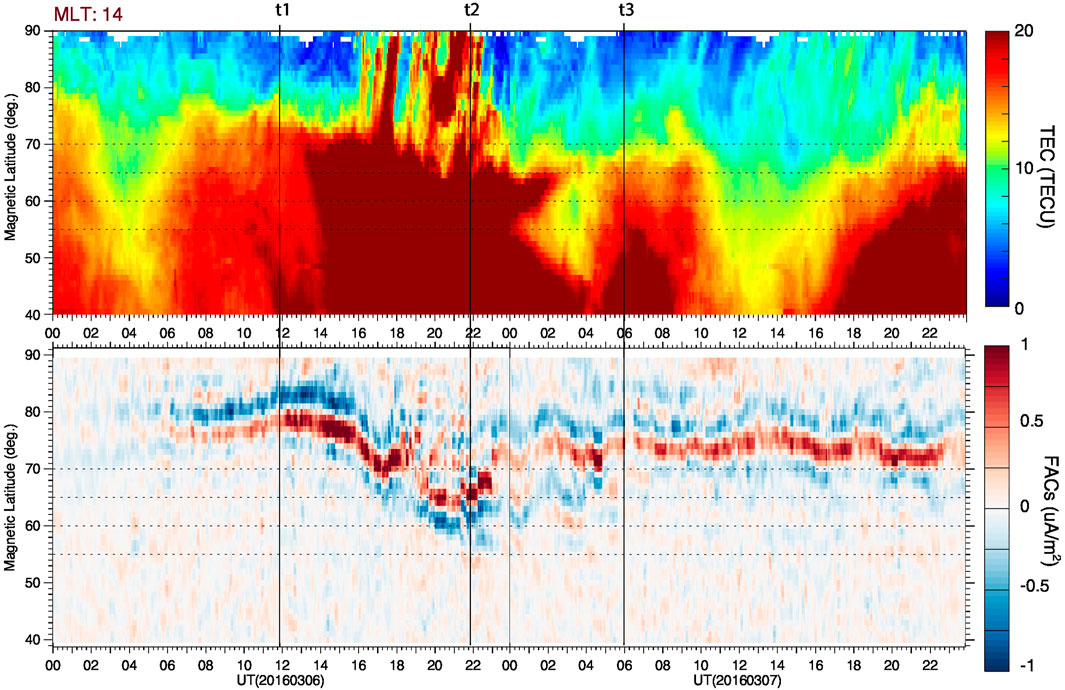
FIGURE 3. Time series of TEC and FACs at 14 MLT are shown for March 06–07 storm. Upward FACs are positive and in red colors, while downward FACs are negative and in blue colors.
The SED and plume disappeared during the ionospheric negative storm phase due to the large-scale thermosphere composition change. The daily TIMED GUVI O/N2 ratio of March 05–07 is shown in Figures 4A–C in geographic latitude and longitude coordinates. The quiet time values on March 05 were subtracted from the storm day values, and the delta O/N2 ratios are plotted in Figures 4D,E. In each panel, the trajectories of the TIMED satellite are shown and the UTs when the satellite crossed the 60° geographic latitude in the Northern Hemisphere are labeled at the top horizontal axis. The quiet time map reveals the classical hemispheric asymmetry of the O/N2 ratio with higher values in the winter hemisphere, i.e., the Northern Hemisphere. During storm time, in the low and mid-latitude regions, the O/N2 ratio increased during the storm, while in the auroral latitudes, the thermosphere O/N2 ratio change became negative after ∼17 UT on March 06, first in the Northern Hemisphere and then extended to low latitude in both hemispheres on March 07. This equatorward expansion of reduced O/N2 ratio was seen for all sectors except near 120° W in the Southern Hemisphere due to the dipole tilt effect and low magnetic latitudes comparing with other regions with similar geographic latitudes. The expansion of the negative O/N2 ratio change to low latitude is a classical signature for thermosphere composition change during a storm and the major reason for the negative ionospheric storm in the auroral and mid-latitude regions (Prölss, 2008; Fuller-Rowell, 2011; Wang et al., 2021). The impact of the thermosphere composition change on the ionospheric TEC can be seen clearly in Figures 2E–H and the supplementary movie.
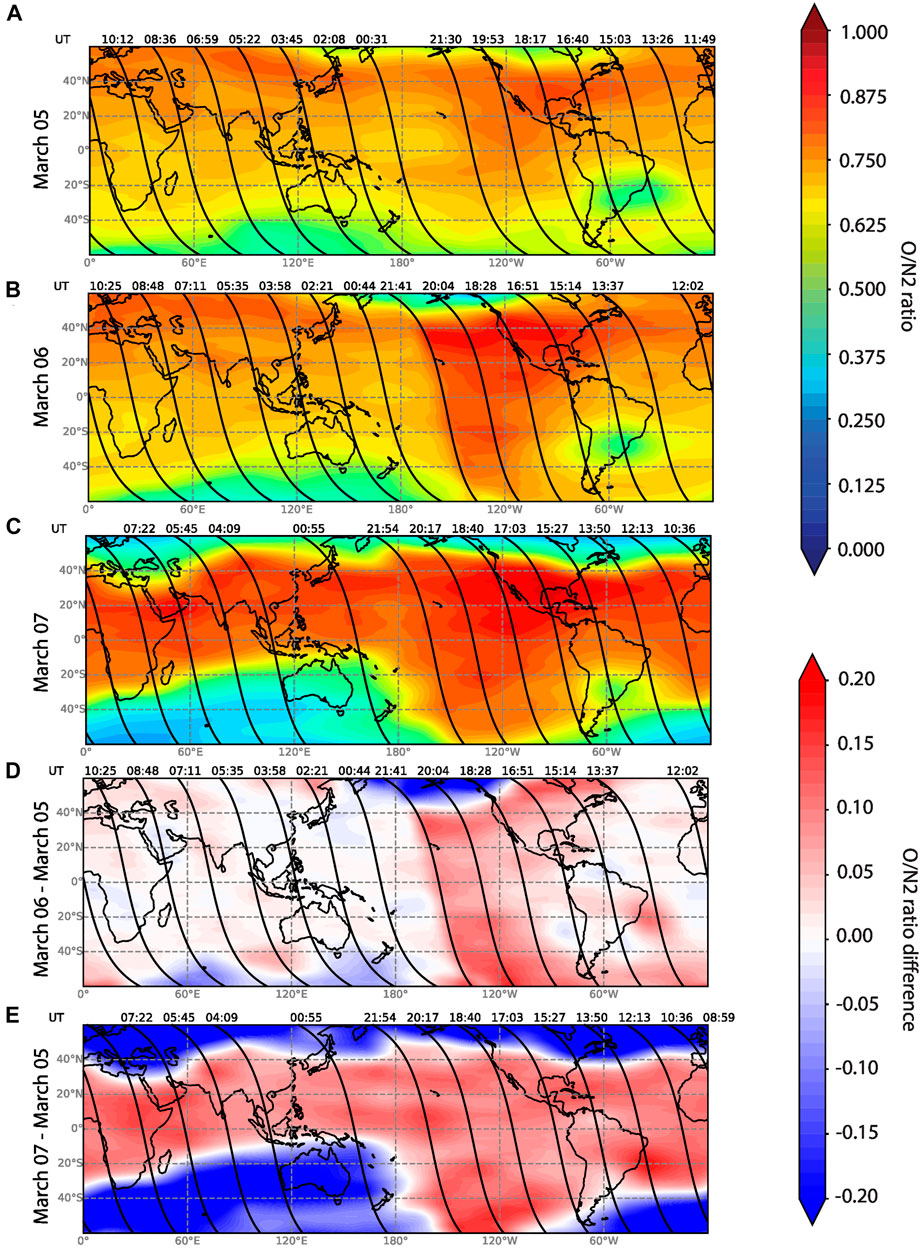
FIGURE 4. The TIMED GUVI O/N2 ratio of March 05–07 are shown in panels (A–C) in geographic coordinates. The quiet time O/N2 values on March 05 were subtracted from the storm day values and the delta O/N2 are plotted in panels (D–E). In each panel, the trajectories of the TIMED satellite are shown and the UTs when the satellite crossed the 60° latitude in the Northern Hemisphere are labeled at the top horizontal axis.
PFISR was right underneath the dayside SED plume during the early storm recovery phase (Figure 2E) and observed the altitude profiles of the SED plume during its decay phase. As shown Figures 2E,F and in the supplementary movie, the width of the SED plume rapidly reduced after 00 UT on March 07. This width reduction mainly happened near the poleward boundary of the plume and was associated with the horizontal transport of lower density plasma from later MLTs due to the enhanced convection driven by the short-lived but intense southward IMF Bz after 23:30 UT on March 06. Figure 5 shows the PFISR observations from 17 UT on March 06 to 06 UT on March 07 and the TEC/FAC map at 01 UT on March 07. From top to bottom, Figures 5B-G show the direction, magnitude and vector of convection flows, vertical flow due to a combination of the convection and field-aligned flow, and altitude profiles of electron densities from beam 4 and beam 2. In Figure 5A, the magenta circle indicates the location of PFISR at 01 UT, right near the poleward edge of the SED plume. In Figure 5G, the density profiles of the SED plume, the low-density plasma from later MLTs at the poleward shoulder of the SED plume (∼01–03 UT) and the mid-latitude trough (after ∼03 UT) revealed large density gradients near the poleward edge of the SED plume. The PFISR beam looking at higher latitudes and with lower elevation angle observed the poleward edge earlier at ∼00:30 UT. The peak SED electron density exceeded ∼1012 m−3 at ∼400 km at ∼00 UT on March 07.
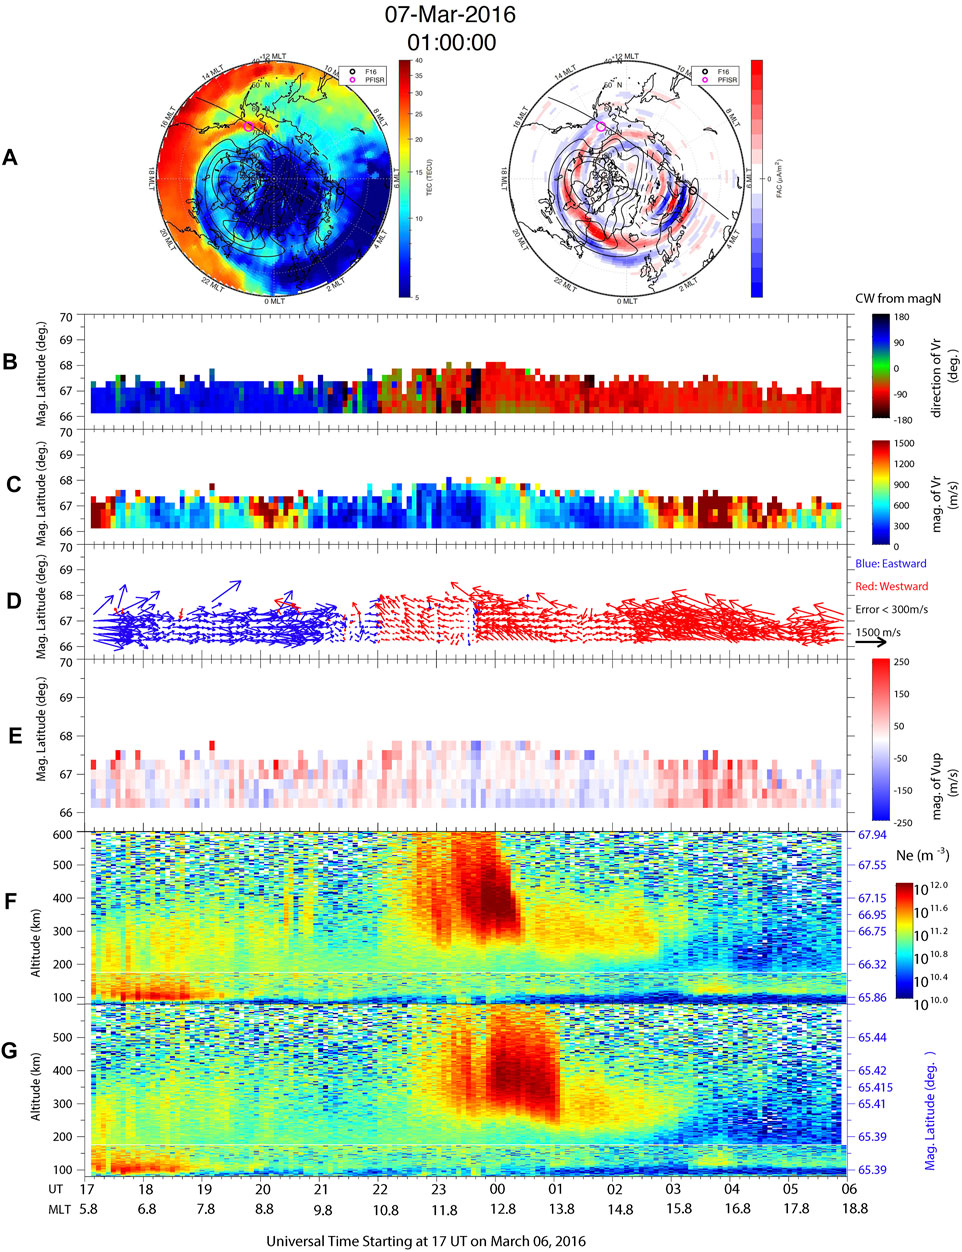
FIGURE 5. PFISR observations from 17 UT on March 06 to 06 UT on March 07. TEC/convection/FAC maps at 01 UT on March 07 are shown at the top in (A). The top three panels show (B) the convection flow direction with 0 means northward and positive means eastward, (C) the magnitude of the convection flow, (D) vector plots of the convection flows, (E) vertical flow due to a combination of the E x B convection and field-aligned flow. The bottom two panels show the altitude profiles of the ionosphere density observed by beam 4 (F) and beam 2 (G, field-aligned). The SED plume, its poleward shoulder, and the mid-latitude trough were observed by these two beams.
During this decay phase of the SED plume, the accompanied plasma convection flows were weakly northwestward (Figures 5A,C), while the vertical flows due to the combined E × B convection and field-aligned flow component turned negative near the low latitude boundary of PFISR and weakly positive near 67° mlat (Figure 5D). These observations are consistent with the SED decay phase observations shown in Zou et al. (2014). Downward plasma flows can push plasma to lower altitudes with denser neutrals and thus speed up the loss process, more specifically, the charge exchange reactions during the first step of the dissociative recombination. The large westward convection flows observed after 03 UT were subauroral polarization streams (SAPS) accompanied with proton precipitations based on the DMSP F17 observations (not shown).
DMSP Observations of Ion Upflow Flux
Four DMSP satellites (F15, F16, F17, F18) operated during this period and provided the precipitating particles and thermal plasma measurements in the polar ionosphere. In particular, DMSP F15 was in the 14-02 MLT orbital plane, which is the most suitable for detecting the SED contribution to ion upflow fluxes among the available satellites. Figure 6 shows two periods of DMSP F15 measurements during the large negative IMF By period, i.e., 11:35-12:01 UT (A-E) and 13:17-13:41 UT (F-J). Two selected TEC/convection/FAC polar view plots at 11:46 UT and 13:26 UT are also shown at the top. These two periods were at the beginning of the enhanced solar wind driving, and the SED TEC in the dayside mid-latitude and subauroral regions just started to increase. In Figures 6B, G, the topside SED plasma, characterized by enhanced density and relatively low electron temperature, were measured by DMSP F15 at ∼11:47 UT and ∼13:27 UT. The accompanied anti-sunward horizontal convection flows in Figures 6D, I were larger than ∼2 km/s and sandwiched by the large negative By related upward and downward FACs near noon (Figures 6A, F), while the vertical flows were elevated to several hundred m/s and exceeded ∼1 km/s at 11:47 UT. The combination of the high density and large vertical flow produced the upward flux reaching ∼0.8–1 × 10¹⁴ m−2s−1 during these periods. The second DMSP orbit shown in Figure 6 also observed relatively enhanced densities at ∼13:35 UT at 2.5 MLT and produced ∼3 × 10¹³ m−2s−1 upward fluxes. Based on the movie, these enhanced densities were likely the remnant of the SED plasma transported to this location.
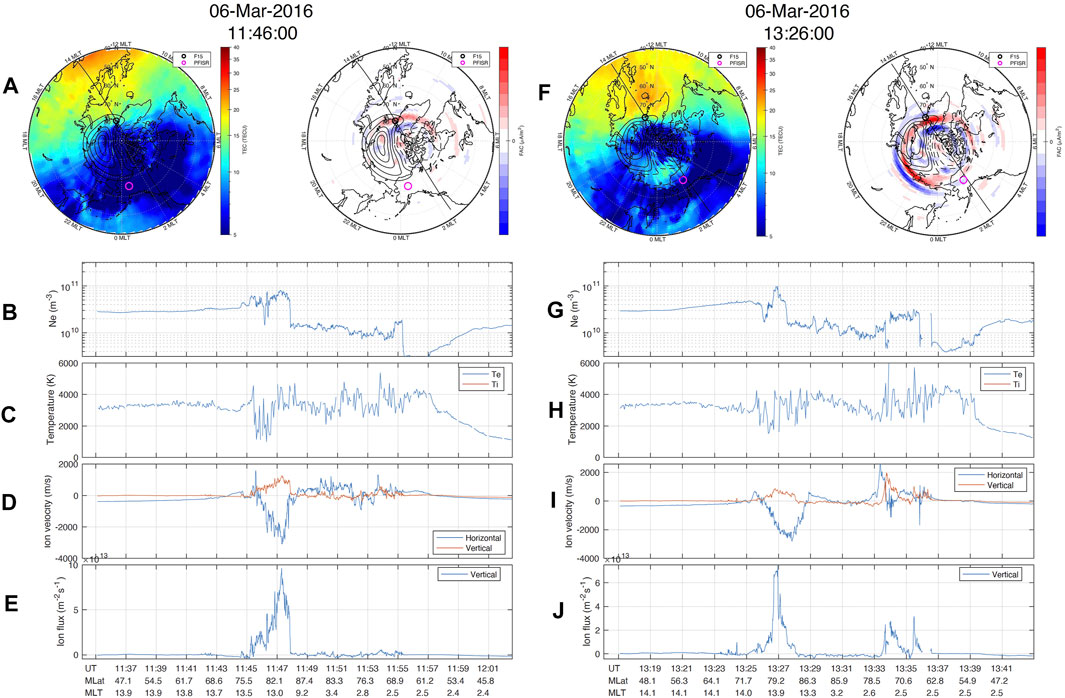
FIGURE 6. Two periods of DMSP F15 measurements during the large negative IMF By period, i.e., 11:35–12:01 UT (A–E) and 13:17–13:41 UT (F–J). Two selected TEC/convection/FAC polar view plots at 11:46 UT and 13:26 UT are also shown at the top (A , F). From top to bottom, the DMSP observations include plasma density, electron temperature, horizontal (blue) and vertical drift (red), and the vertical flux, which is the product of plasma density and vertical flow. The trajectory of the DMSP satellite during this period is shown in the polar view plot.
After the IMF Bz southward turning, clear Region-1 and Region-2 FACs and two-cell convection patterns developed. The TEC values within the SED continued to increase and then multiple patches and the SED plume were seen moving anti-sunward. Figure 7 shows the DMSP F15 measurements during the peak of the storm from 20:01 to 20:27 UT (A-E) and from 21:43 to 22:09 UT (F-J) on March 06. In the same format as Figure 6. In Figures 7A, F, the high-latitude convection and FACs had already expanded to beyond 60° mlat. The large SED density was observed near 65.7° mlat at ∼20:07 UT, and the plume was observed at ∼ 71.8° mlat (Figure 7B). The horizontal convection flows associated with SED were sunward, peaking at ∼2.5 km/s, and the vertical flows exceeded ∼1.2 km/s. The peak upward flux again reached ∼1 × 10¹⁴ m−2s−1 near the poleward shoulder of the SED. Interestingly, the ion fluxes within the SED plume at ∼ 71.8° mlat were downward, similar to previous observations deep in the polar cap (Ren et al., 2019). One orbit later, DMSP F15 observed the fully grown SED plasma, and the topside density at 850 km reached ∼2 × 10¹¹ m−3, tripled the value at the beginning of the storm in Figure 6B. In addition, the largest upflow fluxes during this storm was observed, exceeding 3 × 10¹⁴ m−2s−1 at ∼12 MLT.
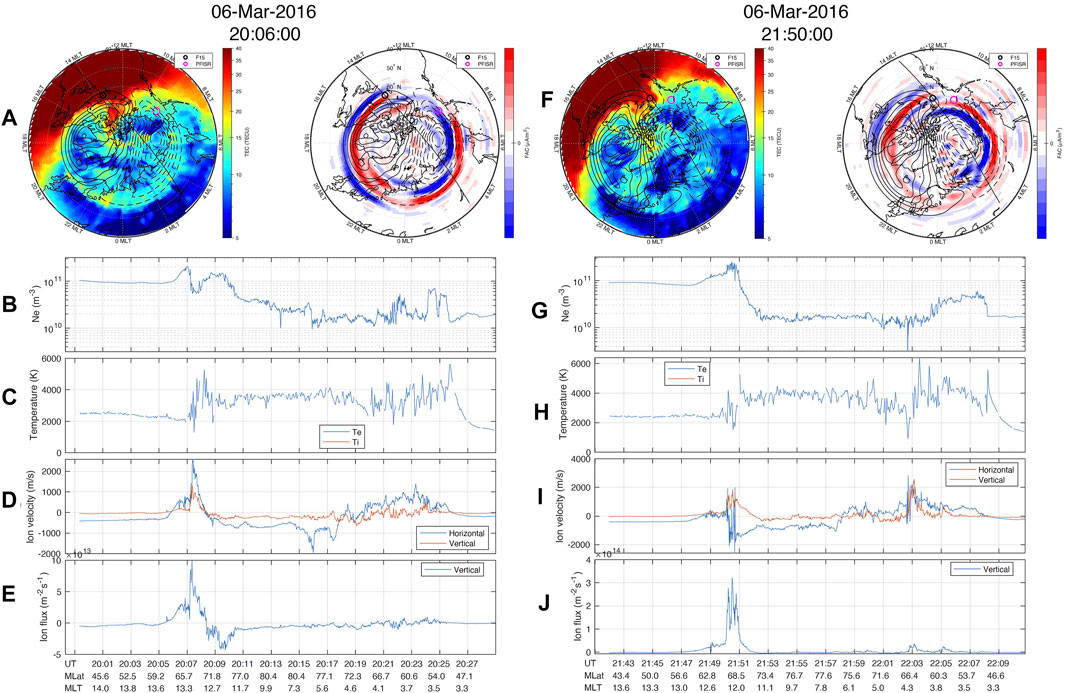
FIGURE 7. The same format as Figure 6 but near the peak of the storm time.
Figure 8 shows the DMSP F15 measurements during the negative ionospheric storm phase from 02:56 to 03:14 UT (A-E) and from 04:34 to 04:56 UT (F-J) on March 07. In the same format as Figures 6, 7. Evident in the TEC polar view plot, the TEC values in the Northern Hemisphere gradually reduced first in the noon sector and later in the pre-midnight sector. The topside ionosphere density shown in Figures 8B,G reduced to about 30% of the peak topside density shown in Figure 7. Despite the large vertical flows, i.e., several hundred m/s, due to the reduced ionospheric density, the upflow fluxes dropped to ∼2-3 x 10¹³ m−2s−1. When comparing the second DMSP orbit in Figure 8 with the first orbit in Figure 6, one can see that the convection flows (Figure 8I and Figure 6D) and the electron temperature (Figure 8H and Figure 6H) during these two time periods were nearly identical, while the upward fluxes differed significantly due to the status of the ionospheric storm and the change of the topside ionosphere condition.
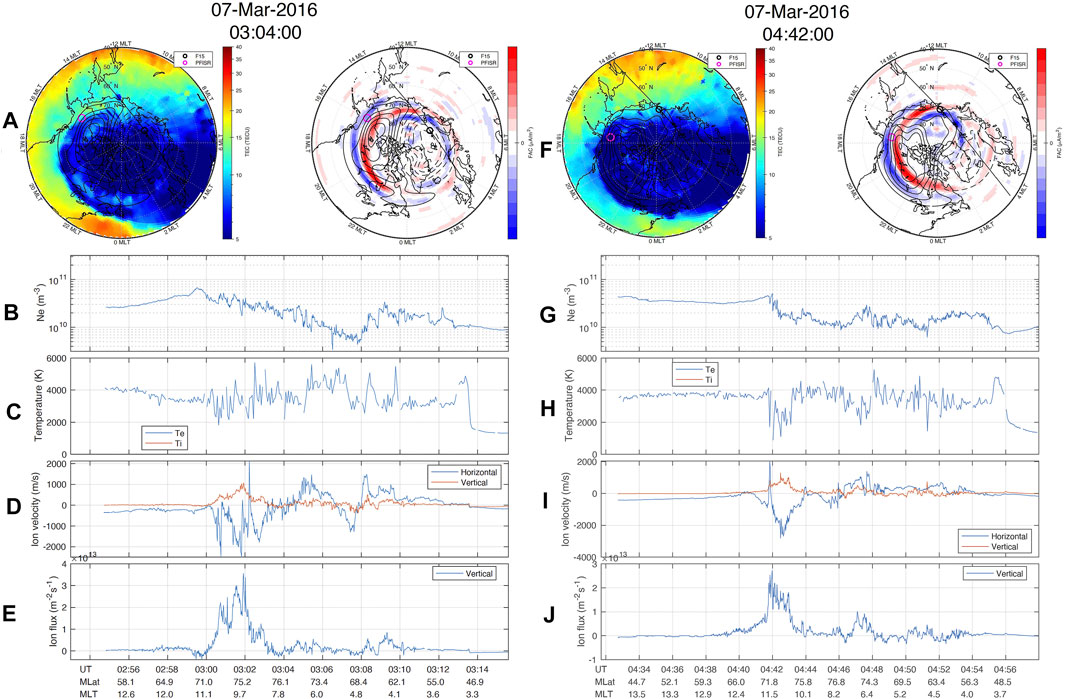
FIGURE 8. The same format as Figure 7 but during the ionospheric negative storm phase.
Generation Mechanism of Intense Ion Upflow Fluxes
Based on the plasma temperature associated with the ion upflow in the F region and the topside ionosphere, ion upflow events have been conventionally classified into two categories, type 1 and type 2 (Wahlund et al., 1992). The type 1 ion upflows are related to strong perpendicular electric fields, enhanced and anisotropic ion temperatures, and low electron densities below 300 km. The enhanced ion temperature results in pressure gradients that propel the ions to higher altitudes. The type 2 ion upflows are related to electron precipitation, electron temperature increase, and reduced or unaffected topside electron density. The largely increased electron temperature in the topside ionosphere leads to an increased ambipolar electric field and thus ions are pulled upward together with the expanding electrons. The type 2 ion upflows can sometimes be accompanied by enhanced ion temperature as well.
In order to analyze the generation mechanism of the intense ion upflow fluxes and the associated precipitating particles, selected DMSP F16 passes are shown in Figures 9–11. DMSP F16 was in the 15-03 MLT orbital plane. The format of these three figures is the same, and from top to bottom shows the TEC/FAC map (a), precipitating electron (b) and proton (c) energy fluxes in log scale, in situ density (d), plasma temperature €, horizontal and vertical velocities (f), and vertical fluxes (g). In Figure 9, DMSP F16 crossed the afternoon sector SED base before 19:37 UT and observed the increased in situ density of ∼1011 m−3, with a small peak near the equatorward edge of the proton precipitation and the SAPS flow region (highlighted by a dashed line). The density peak was clearly associated with the peak upflow flux, ∼6 × 10¹³ m−2s−1, and the SAPS. The westward flux transported by this SAPS channel was ∼2 × 10¹⁴ m−2s−1, comparable to the previous reported values (Erickson et al., 2011).
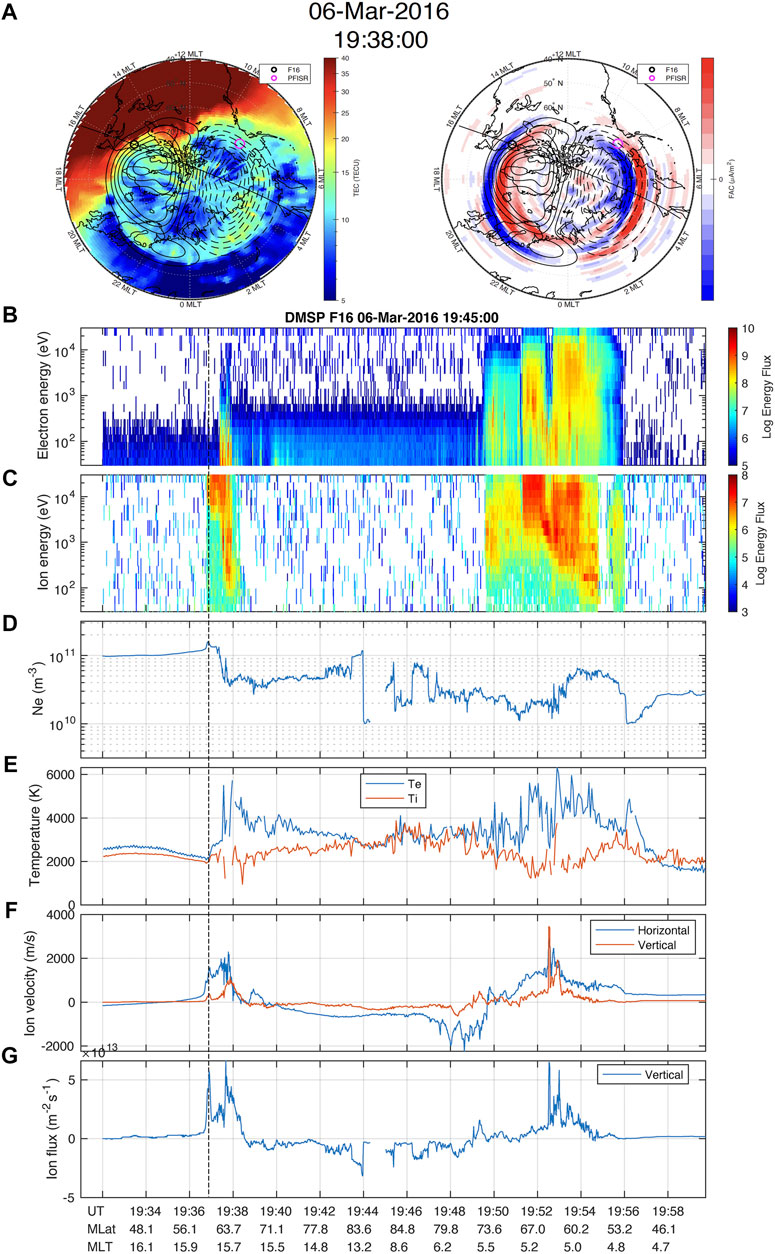
FIGURE 9. DMSP F16 measurements from 19:32 to 19:58 UT on March 06 revealing the SAPS-associated upflow fluxes. TEC/convection/FAC polar view plots at 19:38 UT are also shown at the top (A). From top to bottom, the DMSP observations include precipitating electron (B) and proton (C) fluxes, plasma density (D), electron (blue) and ion (red) temperature (E), horizontal (blue) and vertical drift (red) (F), and the vertical flux (G), which is the product of plasma density and vertical flow. The trajectory of the DMSP satellite during this period is shown in the polar view plot.
Both electron and ion temperatures associated with this SAPS upflow were lower than the surrounding region. The fact that this peak upflow flux was collocated with SAPS suggests that this is likely a type 1 upflow. The type 1 ion upflows are usually associated with strong perpendicular electric field (e.g., Sellek et al., 1991; Heelis et al., 1993). Sellek et al. (1991) used an ionosphere and plasmasphere model to study the effect of frictional heating due to a 2 km/s westward drift. Their results showed that the O+ temperature profile increases from ∼1000 to ∼3200 K between 200 and 500 km, decreases rapidly from ∼3200 to ∼2000 K between 500 and 750 km, and no enhancement above 750 km. Similarly, Heelis et al. (1993) studied the effect of frictional heating of a 2 km/s horizontal drift on O+ temperature and upflow velocity with a focus on their transient dynamic evolution. Their simulation results showed a negative temperature gradient between 300 and 1,000 km about several minutes after reaching the peak velocity. Therefore, it is not unexpected that there was no clear ion temperature enhancement signature associated with this SAPS upflow at the DMSP altitude.
Figures 10, 11 show the DMSP passes crossing the SED plume during its peak and its decaying phase, respectively. In Figure 10, the peak upflow fluxes increased to ∼1014 m−2s−1 at ∼23:05 UT, when the SED plume met with intense soft electron and proton precipitations. These soft particle precipitation signatures are classic cusp precipitations that directly coming from the equatorial magnetosheath. In Figure 11, the SED plume continued to contribute to the large ion upflow fluxes even during its decaying phase. DMSP F16 encountered the SED plume at ∼00:46–00:48 UT and observed the narrow plume contribution to the large upflow fluxes there. Like Figure 10, the precipitating soft electron and ion signatures indicate again this was near the dayside cusp region. Together with the signature of largely elevated electron temperature, the large ion upflowes shown in Figures 10, 11 should be classified as type 2 ion upflow seeded by the SED plume plasma. It is interesting to note that in Figures 10, 11, the ion vertical fluxes associated with the SED at lower latitudes were downward (before 23:02 UT in Figure 10 and at ∼00:46 UT in Figure 11), consistent with the PFISR observations described in the previous section and earlier studies (Zou et al., 2014; Ren et al., 2020).
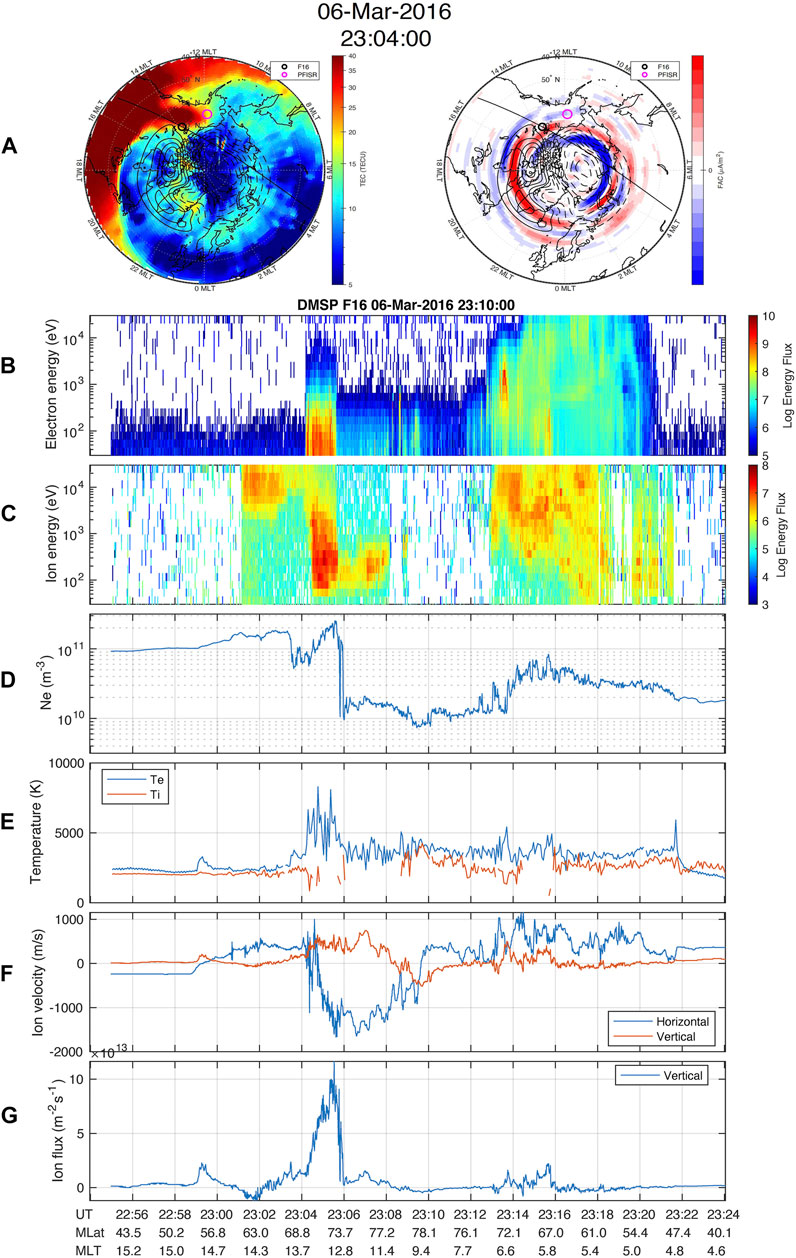
FIGURE 10. The same format as Figure 9 but the large upflow fluxes were associated with the fully grown SED plume.
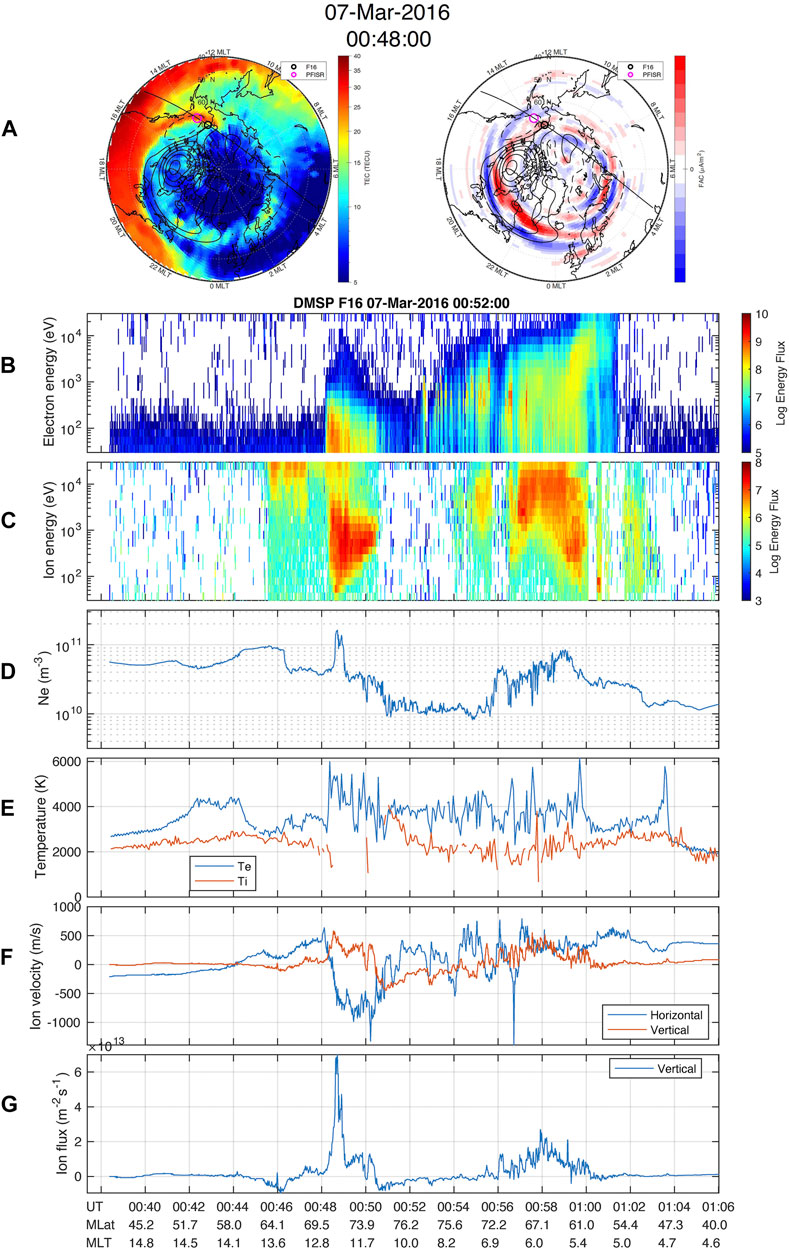
FIGURE 11. The same format as Figure 9 but the large upflow fluxes were associated with the SED plume during its decaying phase.
Temporal Evolution of the Integrated Upflow Fluxes
In order to show the temporal evolution of integrated upward fluxes, we integrated the upward fluxes above 45° mlat in the Northern Hemisphere for all DMSP F15 and F16 satellites and created the time series of integrated upflow flux in Figure 12. DMSP 15 and DMSP 16 have similar orbits, i.e., covering afternoon and postmidnight sectors, and their observations are also comparable. The integrated fluxes gradually increased during the positive ionospheric storm, due to a combination of the elevated SED plasma density and the increased vertical flow speed. The hemispheric integrated flux reached its peak at ∼22-23 UT, shortly after the ring current attainded its peak and the Sym-H approached its minimum. After the ionospheric negative storm initiated due to the thermospheric composition change, the integrated flux decreased significantly, despite the fact that the vertical flow speed was comparable to that during the earlier positive storm condition. These observations clearly demonstrate the importance of the ionospheric storm phase and status in determining the total available ion upflow fluxes. DMSP F17 and F18 were close to each other in the dusk and dawn orbital plane, and the SED contributions to the upflow fluxes there are difficult to quantify. Because at these two local times, the SED plasmas usually have already traveled a long distance from the dayside convection throat to the nightside auroral zone and on the way back to the dayside via the return convection flows. High quality convection flow pattern would be required to trace the SED plasma parcel to ensure that the enhanced densities observed at the dusk and dawn auroral zone are indeed part of the SED remnant. Therefore, the DMSP F17 and F18 observations are not shown here and further studies regarding the contribution of SED plasmas to the ion upflow fluxes in the return flow region of the auroral zone should be performed.
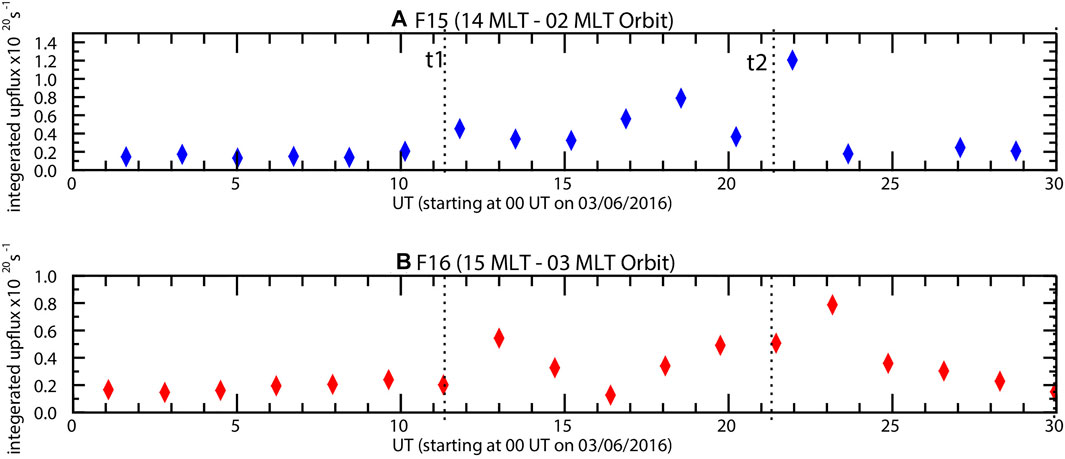
FIGURE 12. The upward fluxes in the Northern Hemisphere for DMSP F15 and F16 satellites were integrated along the trajectories when the satellite was poleward of 45° mlat and assuming a unit length in the cross-track direction. The upward flux values were normalized to 1 × 10²⁰ s−1. DMSP F15 pass at ∼01:16 UT on March 07 was not included due to large data gaps.
A back-of-the-envelope estimation of the SED contribution to the integrated upflow fluxes in the dayside cusp region is performed and compared with the integrated upflow fluxes in the nightside auroral zone. In Ren et al. (2020) paper, the average ion upflow fluxes observed by PFISR in the nightside auroral zone is ∼ 2-3 × 10¹³ m−2s−1. So, the SED-associated upflow fluxes in the cusp can be ∼5–10 times larger than the average upflow fluxes observed in the nightside auroral zone. If we assume the typical dayside cusp is located at 75° mlat and covers 2 h of MLT and 2° mlat, as suggested by the statistical picture shown in Newell, (2004), and the SED contributed upflow flux is ∼1-2 × 10¹⁴ m−2s−1, the integrated upflow flux in the cusp with SED contribution could be ∼ 2-4 × 1025 s−1. Similarly, if assuming the nightside auroral zone is located at ∼65° mlat and covers 6 h of MLT and 5° mlat and the upflow flux is ∼2-3 × 10¹³ m−2s−1, the total auroral zone upflow flux could be ∼4-6 × 1025 s−1. Based on the above estimations, the SED-associated upflow fluxes in the dayside cusp is comparable to the total upflow fluxes in the nightside auroral zone despite the much-limited spatial coverage of cusp.
Summary and Conclusion
In this study, we evaluated the impact of the SED dynamic evolution on the upward ion fluxes during the March 06, 2016 geomagnetic storm using comprehensive multi-scale datasets. Large-scale TEC, convection, and FACs were combined to reveal the mutual evolution of the ionospheric TEC and the high-latitude electrodynamics. The TIMED GUVI observations were used to monitor the thermosphere neutral composition change. In addition, localized ISR and in situ DMSP satellite observations were used to study the detailed ionospheric plasma property. During the ionospheric positive storm phase, large ion upward fluxes were produced when the high-density SED plasma encountered the dayside fast flow channel and soft particle precipitations. The peak upward flux observed was about 3 × 10¹⁴ m−2s−1 with the topside ionospheric density reaching 2 × 10¹¹ m−3 in the dayside cusp region. During the ionospheric negative storm phase, the thermospheric O/N2 ratio was reduced at the high latitude region due to neutral upwelling from lower altitudes, and this perturbation gradually propagated to lower latitudes. The ionospheric density was significantly reduced (e.g., the SED and plume disappeared), and thus the upward fluxes were severely suppressed. Even under similar convection and particle precipitation conditions, the reduced ionospheric density during the negative storm phase led to weakened upward fluxes. This event analysis demonstrates the critical role of the SED and SED plume in creating large ion upward fluxes. It also suggests that the dynamic coupling of the ionosphere-thermosphere and the resulting state of the ionospheric storm are crucial for understanding the temporal and spatial variations of ion upflow dynamics. Appropriately specifying these lower boundary conditions are important for global geospace models to fully evaluate the dynamic evolution of ion outflows and their impact on geospace system dynamics.
Data Availability Statement
The original contributions presented in the study are included in the article/Supplementary Material, further inquiries can be directed to the corresponding author.
Author Contributions
SZ oversaw and designed the research plan, analyzed the multi-instrument data, and wrote the manuscript. JR created the polar view plots and movie of the TEC, convection, and FACs, as well as visualized the DMSP data. ZW created the TIMED GUVI O/N2 plots. HS and YC produced the VISTA TEC data.
Funding
SZ, JR, and ZW at the University of Michigan are supported by NASA 80NSSC20K1313, 80NSSC20K0190, and 80NSSC20K0600. HS and YC are supported by NASA 80NSSC20K0600.
Conflict of Interest
The authors declare that the research was conducted in the absence of any commercial or financial relationships that could be construed as a potential conflict of interest.
The handling editor declared a past co-authorship with one of the authors SZ.
Publisher’s Note
All claims expressed in this article are solely those of the authors and do not necessarily represent those of their affiliated organizations, or those of the publisher, the editors and the reviewers. Any product that may be evaluated in this article, or claim that may be made by its manufacturer, is not guaranteed or endorsed by the publisher.
Acknowledgments
We acknowledge Dr. Anthea Coster and her colleagues at MIT Haystack to make the TEC data available on Madrigal database. We thank Patricia Doherty for making the DMSP data available on Madrigal database. The solar wind and IMF data are obtained from the OMNI web. The PFISR data are obtained from the SRI AMISR website. The SuperDARN data are obtained from the SuperDARN group at the Virginia Tech. We thank the AMPERE team and the AMPERE Science Center for providing the Iridium derived data products.
Supplementary Material
The Supplementary Material for this article can be found online at: https://www.frontiersin.org/articles/10.3389/fspas.2021.746429/full#supplementary-material
References
Anderson, B. J., Korth, H., Waters, C. L., Green, D. L., Merkin, V. G., Barnes, R. J., et al. (2014). Development of Large-Scale Birkeland Currents Determined from the Active Magnetosphere and Planetary Electrodynamics Response Experiment. Geophys. Res. Lett. 41, 3017–3025. doi:10.1002/2014gl059941
Anderson, B. J., Takahashi, K., and Toth, B. A. (2000). Sensing Global Birkeland Currents with Iridium Engineering Magnetometer Data. Geophys. Res. Lett. 27 (24), 4045–4048. doi:10.1029/2000gl000094
Buchert, S. C., Ogawa, Y., Fujii, R., and van Eyken, A. P. (2004). Observations of Diverging Field-Aligned Ion Flow with the ESR. Ann. Geophys. 22 (3), 889–899. doi:10.5194/angeo-22-889-2004
Chappell, C. R. (2015). The Role of the Ionosphere in Providing Plasma to the Terrestrial Magnetosphere-An Historical Overview. Space Sci. Rev. 192 (1-4), 5–25. doi:10.1007/s11214-015-0168-5
Chisham, G., Lester, M., Milan, S. E., Freeman, M. P., Bristow, W. A., Grocott, A., et al. (2007). A Decade of the Super Dual Auroral Radar Network (SuperDARN): Scientific Achievements, New Techniques and Future Directions. Surv. Geophys. 28 (1), 33–109. doi:10.1007/s10712-007-9017-8
Cohen, I. J., Lessard, M. R., Varney, R. H., Oksavik, K., Zettergren, M., and Lynch, K. A. (2015). Ion Upflow Dependence on Ionospheric Density and Solar Photoionization. J. Geophys. Res. Space Phys. 120 (11), 10039–10052. doi:10.1002/2015JA021523
Coley, W. R., Heelis, R. A., and Hairston, M. R. (2006). Characteristics of High-Latitude Vertical Plasma Flow from the Defense Meteorological Satellite Program. J. Geophys. Res. 111 (A11). doi:10.1029/2005JA011553
Coster, A. J., Colerico, M. J., Foster, J. C., Rideout, W., and Rich, F. (2007). Longitude Sector Comparisons of Storm Enhanced Density. Geophys. Res. Lett. 34 (18). doi:10.1029/2007GL030682
Daglis, I. A., Thorne, R. M., Baumjohann, W., and Orsini, S. (1999). The Terrestrial Ring Current: Origin, Formation, and Decay. Rev. Geophys. 37 (4), 407–438. doi:10.1029/1999RG900009
David, M., Sojka, J. J., Schunk, R. W., and Coster, A. J. (2016). Polar Cap Patches and the Tongue of Ionization: A Survey of GPS TEC Maps from 2009 to 2015. Geophys. Res. Lett. 43 (6), 2422–2428. doi:10.1002/2016GL068136
Erickson, P. J., Beroz, F., and Miskin, M. Z. (2011). Statistical Characterization of the American Sector Subauroral Polarization Stream Using Incoherent Scatter Radar. J. Geophys. Res. 116, A00J21. doi:10.1029/2010JA015738
Foster, J. C., Coster, A. J., Erickson, P. J., Holt, J. M., Lind, F. D., Rideout, W., et al. (2005). Multiradar Observations of the Polar Tongue of Ionization. J. Geophys. Res. 110, A09S31. doi:10.1029/2004JA010928
Foster, J. C., Zou, S., Heelis, R. A., and Erickson, P. J. (2021). ch6, in Ionosphere Dynamics and Applications. Editors C. Huang, G. Lu, Y. Zhang, and L. J. Paxton doi:10.1002/9781119815617
Fuller-Rowell, T. J. (2011). “Storm-Time Response of the Thermosphere-Ionosphere System,” in Aeronomy of the Earth's Atmosphere and Ionosphere, IAGA Spec. Sopron Book Ser. Editors M. A. Abdu, and D. Pancheva (Dordrecht, Netherlands: Springer), Vol. 2419, 435–434. doi:10.1007/978-94-007-0326-1_32
Garcia, K. S., Merkin, V. G., and Hughes, W. J. (2010). Effects of Nightside O+outflow on Magnetospheric Dynamics: Results of Multifluid MHD Modeling. J. Geophys. Res. 115 (A12), a–n. doi:10.1029/2010JA015730
Greenwald, R. A., Baker, K. B., Dudeney, J. R., Pinnock, M., Jones, T. B., Thomas, E. C., et al. (1995). DARN/SuperDARN. Space Sci. Rev. 71 (1-4), 761–796. doi:10.1007/BF00751350
Heelis, R. A., Bailey, G. J., Sellek, R., Moffett, R. J., and Jenkins, B. (1993). Field-Aligned Drifts in Subauroral Ion Drift Events. J. Geophys. Res. 98 (A12), 21493–21499. doi:10.1029/93JA02209
Heelis, R. A. (2016). “Longitude and Hemispheric Dependencies in Storm-Enhanced Density,” in Geophysical Monograph Series. Editors T. Fuller-Rowell, E. Yizengaw, P. H. Doherty, and S. Basu (Hoboken, NJ, USA: John Wiley & Sons), 59–70. doi:10.1002/9781118929216.ch5
Heinselman, C. J., and Nicolls, M. J. (2008). A Bayesian Approach to Electric Field andE-Region Neutral Wind Estimation with the Poker Flat Advanced Modular Incoherent Scatter Radar. Radio Sci. 43, a–n. doi:10.1029/2007RS003805
Kronberg, E. A., Ashour-Abdalla, M., Dandouras, I., Delcourt, D. C., Grigorenko, E. E., Kistler, L. M., et al. (2014). Circulation of Heavy Ions and Their Dynamical Effects in the Magnetosphere: Recent Observations and Models. Space Sci. Rev. 184 (1-4), 173–235. doi:10.1007/s11214-014-0104-0
Liu, J., Wang, W., Burns, A., Solomon, S. C., Zhang, S., Zhang, Y., et al. (2016). Relative Importance of Horizontal and Vertical Transports to the Formation of Ionospheric Storm‐enhanced Density and Polar Tongue of Ionization. J. Geophys. Res. Space Phys. 121, 8121–8133. doi:10.1002/2016JA022882
Loranc, M., Hanson, W. B., Heelis, R. A., and St.-Maurice, J.-P. (1991). A Morphological Study of Vertical Ionospheric Flows in the High-latitudeFregion. J. Geophys. Res. 96 (A3), 3627. doi:10.1029/90JA02242
Lotko, W. (2007). The Magnetosphere-Ionosphere System from the Perspective of Plasma Circulation: A Tutorial. J. Atmos. Solar-Terrestrial Phys. 69 (3), 191–211. doi:10.1016/j.jastp.2006.08.011
Lu, G., Goncharenko, L., Nicolls, M. J., Maute, A., Coster, A., and Paxton, L. J. (2012). Ionospheric and Thermospheric Variations Associated with Prompt Penetration Electric fields. J. Geophys. Res. 117, a–n. doi:10.1029/2012JA017769
Moore, T. E., and Horwitz, J. L. (2007). Stellar Ablation of Planetary Atmospheres. Rev. Geophys. 45 (3), a–n. doi:10.1029/2005RG000194
Newell, P. T. (2004). Maps of Precipitation by Source Region, Binned by IMF, with Inertial Convection Streamlines. J. Geophys. Res. 109, A10206. doi:10.1029/2004JA010499
Nilsson, H. (2011). “Heavy Ion Energization, Transport, and Loss in the Earth's Magnetosphere,” in The Dynamic Magnetosphere. Editors W. Liu, and M. Fujimoto (Dordrecht: Springer Netherlands), 315–327. doi:10.1007/978-94-007-0501-2_17
Nilsson, H., Waara, M., Marghitu, O., Yamauchi, M., Lundin, R., Rème, H., et al. (2008). Transients in Oxygen Outflow above the Polar Cap as Observed by the Cluster Spacecraft. Ann. Geophys. 26 (11), 3365–3373. doi:10.5194/angeo-26-3365-2008
Ogawa, Y., Buchert, S. C., Fujii, R., Nozawa, S., and van Eyken, A. P. (2009). Characteristics of Ion Upflow and Downflow Observed with the European Incoherent Scatter Svalbard Radar. J. Geophys. Res. 114 (A5), a–n. doi:10.1029/2008JA013817
Prölss, G. W. (2008). “Ionospheric Storms at Mid-Latitude: A Short Review,” in Geophysical Monograph Series. Editors P. M. Kintner, A. J. Coster, T. Fuller-Rowell, A. J. Mannucci, M. Mendillo, and R. Heelis (Washington, DC: American Geophysical Union), 181, 9–24. doi:10.1029/181GM03
Ren, J., Zou, S., Lu, J., Giertych, N., Chen, Y., Verney, R., et al. (2020). Statistical Study of Ion Upflow and Downflow Observed by the Poker Flat Incoherent Scatter Radar (PFISR). J. Geophys. Res. Space Phys. 125, e2020JA028179. doi:10.1029/2020ja028179
Rideout, W., and Coster, A. (2006). Automated GPS Processing for Global Total Electron Content Data. GPS Solut. 10 (3), 219–228. doi:10.1007/s10291-006-0029-5
Sellek, R., Bailey, G., Moffett, R., Heelis, R., and Anderson, P. (1991). Effects of Large Zonal Plasma Drifts on the Subauroral Ionosphere. J. Atmos. Terrestrial Phys. 53 (6-7), 557–565. doi:10.1016/0021-9169(91)90083-J
Semeter, J., Heinselman, C. J., Thayer, J. P., Doe, R. A., and Frey, H. U. (2003). Ion Upflow Enhanced by driftingF-Region Plasma Structure along the Nightside Polar Cap Boundary. Geophys. Res. Lett. 30 (22). doi:10.1029/2003GL017747
Strangeway, R. J. (2005). Factors Controlling Ionospheric Outflows as Observed at Intermediate Altitudes. J. Geophys. Res. 110 (A3). doi:10.1029/2004JA010829
Strickland, D. J., Evans, J. S., and Paxton, L. J. (1995). Satellite Remote Sensing of Thermospheric O/N2and Solar EUV: 1. Theory. J. Geophys. Res. 100, 12217. doi:10.1029/95ja00574
Sun, H., Hua, Z., Ren, J., Zou, S., Sun, Y., and Chen, Y. (2021). Matrix Completion Methods for the Total Electron Content Video Reconstruction. Ann. Appl. Stat., 15 (3).
Thomas, E. G., Baker, J. B. H., Ruohoniemi, J. M., Coster, A. J., and Zhang, S. R. (2016). The Geomagnetic Storm Time Response of GPS Total Electron Content in the North American Sector. J. Geophys. Res. Space Phys. 121, 1744–1759. doi:10.1002/2015JA022182
Wahlund, J.-E., Opgenoorth, H. J., Häggström, I., Winser, K. J., and Jones, G. O. L. (1992). EISCAT Observations of Topside Ionospheric Ion Outflows during Auroral Activity: Revisited. J. Geophys. Res. 97 (A3), 3019–3037. doi:10.1029/91JA02438
Welling, D. T., André, M., Dandouras, I., Delcourt, D., Fazakerley, A., Fontaine, D., et al. (2015). The Earth: Plasma Sources, Losses, and Transport Processes. Space Sci. Rev. 192 (1-4), 145–208. doi:10.1007/s11214-015-0187-2
Yau, A. W., Peterson, W. K., and Abe, T. (2011). “Influences of the Ionosphere, Thermosphere and Magnetosphere on Ion Outflows,” in The Dynamic Magnetosphere. Editors W. Liu, and M. Fujimoto (Dordrecht: Springer Netherlands), 283–314. doi:10.1007/978-94-007-0501-2_16
Yu, Y., and Ridley, A. J. (2013). Exploring the Influence of Ionospheric O + Outflow on Magnetospheric Dynamics: Dependence on the Source Location. J. Geophys. Res. Space Phys. 118 (4), 1711–1722. doi:10.1029/2012JA018411
Yuan, Z.-G., Deng, X.-H., and Wang, J.-F. (2008). DMSP/GPS Observations of Intense Ion Upflow in the Midnight Polar Ionosphere Associated with the SED Plume during a Super Geomagnetic Storm. Geophys. Res. Lett. 35, L19110. doi:10.1029/2008GL035462
Zeng, W., and Horwitz, J. L. (2007). Formula Representation of Auroral Ionospheric O+outflows Based on Systematic Simulations with Effects of Soft Electron Precipitation and Transverse Ion Heating. Geophys. Res. Lett. 34 (6). doi:10.1029/2006GL028632
Zeng, W., and Horwitz, J. L. (2008). Storm Enhanced Densities (SED) as Possible Sources for Cleft Ion Fountain Dayside Ionospheric Outflows. Geophys. Res. Lett. 35 (4). doi:10.1029/2007GL032511
Zhang, Q.-H., Zhang, B.-C., Lockwood, M., Hu, H.-Q., Moen, J., Ruohoniemi, J. M., et al. (2013). Direct Observations of the Evolution of Polar Cap Ionization Patches. Science 339, 1597–1600. doi:10.1123/science.123148710.1126/science.1231487
Zhang, Q. H., Zong, Q. G., Lockwood, M., Heelis, R. A., Hairston, M., Liang, J., et al. (2016). Earth's Ion Upflow Associated with Polar Cap Patches: Global and In Situ Observations. Geophys. Res. Lett. 43 (5), 1845–1853. doi:10.1002/2016GL067897
Zhang, Y., Paxton, L. J., Morrison, D., Wolven, B., Kil, H., Meng, C.-I., et al. (2004). O/N2changes during 1-4 October 2002 Storms: IMAGE SI-13 and TIMED/GUVI Observations. J. Geophys. Res. 109, A10308. doi:10.1029/2004JA010441
Zou, S., Moldwin, M. B., Ridley, A. J., Nicolls, M. J., Coster, A. J., Thomas, E. G., et al. (2014). On the Generation/decay of the Storm-Enhanced Density Plumes: Role of the Convection Flow and Field-Aligned Ion Flow. J. Geophys. Res. Space Phys. 119 (10), 8543–8559. doi:10.1002/2014JA020408
Zou, S., Perry, G. W., and Foster, J. C. (2021). “Recent Advances in Polar Cap Density Structure Research,” in Ionosphere Dynamics and Applications. Editors C. Huang, G. Lu, Y. Zhang, and L.J. Paxton, 67–82. doi:10.1002/9781119815617.ch4
Zou, S., Ridley, A., Jia, X., Boyd, E., Nicolls, M., Coster, A., et al. (2017). PFISR Observation of Intense Ion Upflow Fluxes Associated with an SED during the 1 June 2013 Geomagnetic Storm. J. Geophys. Res. Space Phys. 122, 2589–2604. doi:10.1002/2016JA023697
Keywords: storm-enhanced density (SED), SED plume, ion upflow, ionospheric convection, field-aligned currents, magnetosphere-ionosphere-thermosphere coupling
Citation: Zou S, Ren J, Wang Z, Sun H and Chen Y (2021) Impact of Storm-Enhanced Density (SED) on Ion Upflow Fluxes During Geomagnetic Storm. Front. Astron. Space Sci. 8:746429. doi: 10.3389/fspas.2021.746429
Received: 23 July 2021; Accepted: 13 September 2021;
Published: 23 September 2021.
Edited by:
Philip J. Erickson, Massachusetts Institute of Technology, United StatesReviewed by:
John C. Foster, Massachusetts Institute of Technology, United StatesAlexei V. Dmitriev, Lomonosov Moscow State University, Russia
Copyright © 2021 Zou, Ren, Wang, Sun and Chen. This is an open-access article distributed under the terms of the Creative Commons Attribution License (CC BY). The use, distribution or reproduction in other forums is permitted, provided the original author(s) and the copyright owner(s) are credited and that the original publication in this journal is cited, in accordance with accepted academic practice. No use, distribution or reproduction is permitted which does not comply with these terms.
*Correspondence: Shasha Zou, shashaz@umich.edu