Deciphering elapsed time and predicting action timing from neuronal population signals
- 1 Department of Physics, Graduate School of Science, Kyoto University, Kyoto, Japan
- 2 Department of Physiology, Tohoku University School of Medicine, Sendai, Japan
- 3 Brain Science Center, Tohoku University, Sendai, Japan
The proper timing of actions is necessary for the survival of animals, whether in hunting prey or escaping predators. Researchers in the field of neuroscience have begun to explore neuronal signals correlated to behavioral interval timing. Here, we attempt to decode the lapse of time from neuronal population signals recorded from the frontal cortex of monkeys performing a multiple-interval timing task. We designed a Bayesian algorithm that deciphers temporal information hidden in noisy signals dispersed within the activity of individual neurons recorded from monkeys trained to determine the passage of time before initiating an action. With this decoder, we succeeded in estimating the elapsed time with a precision of approximately 1 s throughout the relevant behavioral period from firing rates of 25 neurons in the pre-supplementary motor area. Further, an extended algorithm makes it possible to determine the total length of the time-interval required to wait in each trial. This enables observers to predict the moment at which the subject will take action from the neuronal activity in the brain. A separate population analysis reveals that the neuronal ensemble represents the lapse of time in a manner scaled relative to the scheduled interval, rather than representing it as the real physical time.
Introduction
The neural basis of temporal processing has gathered increasing interest in the field of neuroscience (Coull et al., 2004; Mauk and Buonomano, 2004; Buhusi and Meck, 2005; Buonomano and Laje, 2010). Recent studies have discovered brain regions that exhibit activity correlated to the elapsed time while animals were kept waiting for several seconds for a variety of actions; for instance, the basal ganglia and the cerebellum are activated during time perception tasks (Rao et al., 2001; Matell et al., 2003; Meck et al., 2008; Jin et al., 2009), the prefrontal and parietal cortices exhibit neuronal climbing activity in delay response tasks or motor planning (Niki and Watanabe, 1979; Brody et al., 2003; Durstewitz, 2003, 2004; Leon and Shadlen, 2003; Reutimann et al., 2004), and the pre-supplementary motor area (pre-SMA), as well as premotor and primary motor areas exhibits both ascending and descending neuronal activities in an interval timing task (Lebedev et al., 2008; Mita et al., 2009; Rickert et al., 2009; Kilavik et al., 2010).
Rather than detecting neuronal involvement in timing behavior, we attempt here to decode the lapse of time from neuronal population signals throughout the time period during which subjects were required to estimate the passage of time. We reason that it should be possible to assess the passage of time, by deciphering temporal information hidden in the noisy firing of a population of neurons, enabling the monitoring of time as if watching an hourglass. Accordingly, we apply a theoretical approach to determine the lapse of time in the range of seconds from time-dependent tendencies in the overall properties of the firing of individual neurons. Such inverse inference is thought to be given shape by conforming to the Bayesian principle that allots the probability to the possible causes that may have led to the given results (Rieke et al., 1997; MacKay, 2003; Beck et al., 2008; Quiroga and Panzeri, 2009; Jazayeri and Shadlen, 2010; Pillow et al., 2011).
For this study, we design a basic Bayesian algorithm that estimates the lapse of time from neuronal population signals averaged over a short interval, and apply it to neuronal spike trains recorded from the pre-SMA, previously found to exhibit salient modulation in firing activity over several seconds during which monkeys were kept waiting for action (Mita et al., 2009). In the experiment, monkeys were requested to recall a pre-assigned interval of time selected from several alternatives. We attempt to estimate not only the current lapse of time, but also the scheduled total waiting time-interval, both of which are needed for the agent in the brain that determines the timing of action. In the population analysis, we determine whether or not the neuronal representation of the elapsed time is influenced by a scheduled total time-interval in each waiting trial; we examine whether the elapsed time is represented as actual passage of time or relative to the entire scheduled interval.
Results
In a previous study (Mita et al., 2009), we reported that neurons in the pre-SMA exhibited systematic temporal variation in their firing rates while monkeys were estimating time-interval. In this experiment, the monkeys were trained to hold down a key for longer than a pre-assigned time-interval that was selected from several alternatives, including 4 and 8 s. Each trial began when the monkey pressed a hold key. Instruction light designating the waiting-interval was illuminated 1–2 s later for 2 s. The monkeys were rewarded with juice 0.5 s after releasing the key if they held it longer than the pre-assigned time-interval, and became skilled at these tasks with a success rate of over 80%. Neuronal firing data were obtained using a conventional single-unit recording method. The presumed single-neurons to which spikes were sorted out are called units. In the present analysis, we used 25 units that were selected as being significantly task-related (the Wilcoxon signed rank test, p < 0.01; Materials and Methods). While the previous study explored single-neuronal activities correlated to the passage of time, here we attempted to decode time from activity of neuronal populations.
Decoding the Elapsed Time from Neuronal Population Signals
First, we devised an algorithm for decoding the lapse of time (Figure 1; Materials and Methods) and applied it to an ensemble of 25 units that exhibited salient modulation in firing activity over several seconds. Simple average of their population activities was not an adequate measure to estimate the time, because the average activity indicated no prominent dependency on the time (Figure 2). By contrast, the Bayesian “TIME DECODER 1” developed here allowed us to draw an inference about the elapsed time by combining information of specific temporal variation in individual unit activity. Here, the passage of time was estimated only from N = 25 spike trains that were obtained by joining the recordings of different units across different trials. After selecting a single set of spike trains as a test set, the Bayesian decoder was adjusted to the rest of spike trains that were not used for the test set. The decoding capability was evaluated by repeating this validation test 100 times (Materials and Methods).
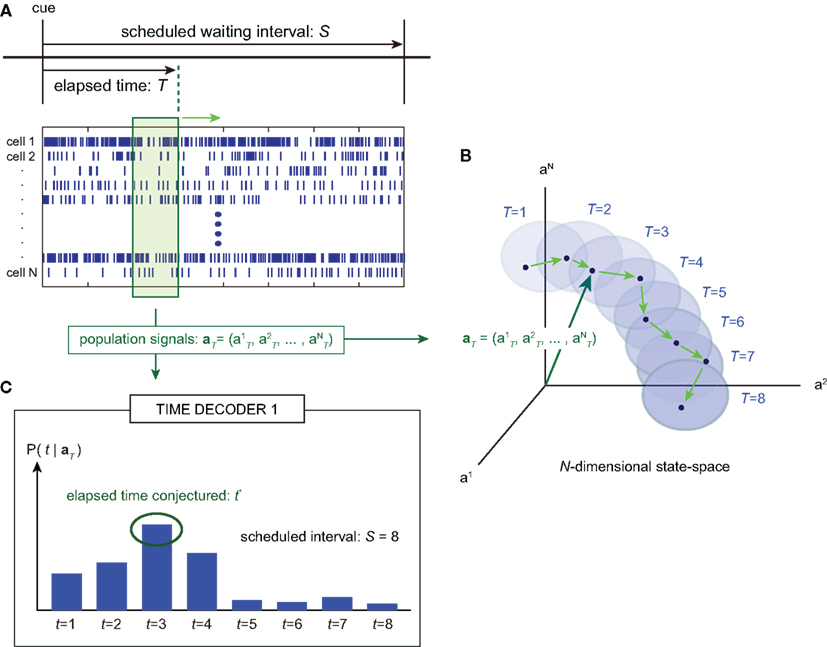
Figure 1. A device for decoding the elapsed time from neuronal signals. (A) Lapse of time in the waiting-interval and neuronal population activities. Neuronal spikes were recorded while monkeys held down a key longer than the pre-assigned waiting time-interval S = 4 or 8 s. Population signals  are referred to as a set of firing rates or the numbers of spikes elicited from N neurons in a 1-s interval just before the elapsed time T. (B) Schematic representation of neuronal population-activity trajectory in the N-dimensional state-space. A vector
  moves differently from trial to trial. The points connected by green arrows schematically represent trajectory of one trial. The colored ellipses represent their distributions,
  (Eq. 3). (C) The probability
  allotted to every elapsed time t given the population signals recorded at the actual time T (Eq. 1). For a given set of signals, the elapsed time t* is conjectured as the time that rendered the highest confidence (Eq. 4).
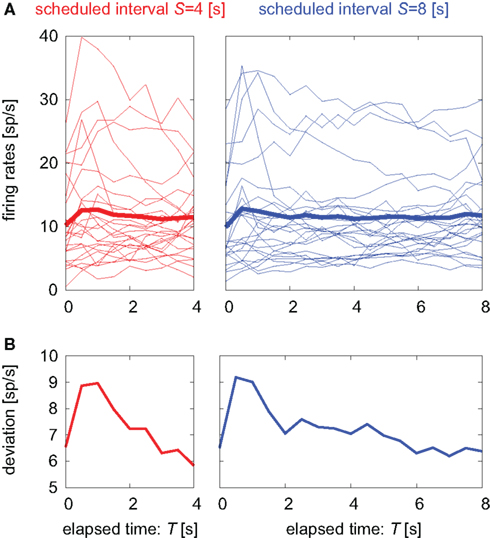
Figure 2. Temporal modulations of neuronal firing rates. (A) Temporal modulation of the firing rates of 25 pre-SMA neurons. Each thin line represents the average over repeated trials (12–91 times, average 44) aligned at the cue onset for each neuron. The thick line represents the firing rate averaged over all neurons. (B) SD of the firing rates of 25 units.
TIME DECODER 1 estimates the conditional probability of the elapsed time t given the population activities  at actual time T, which are given by the numbers of spikes that N = 25 units have generated in a 1-s interval of [T-1, T]. Here, the time decoding algorithm was independently applied to an individual waiting task of S = 4 or 8 s. For each test set of population signals derived from the actual elapsed time T, we selected the conjectured time t = t* that rendered the highest confidence level in the decoder. The conjectured times t* obtained for 100 test sets of the population signals were distributed narrowly around the actual time T and typically deviated on the order of 1 s (Figures 3A,B). The first and last time boxes gave higher confidence than others. This is presumably because a time box at each end has only one neighboring box, and accordingly the probability to leak out is smaller.
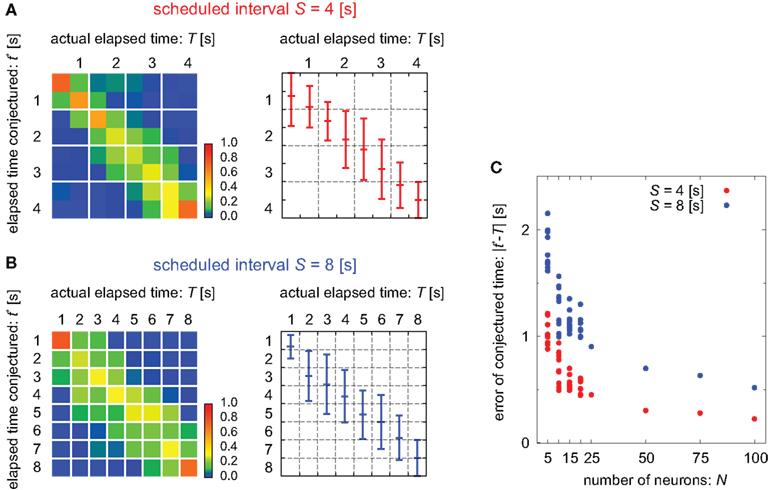
Figure 3. Estimation of the elapsed time. (A,B) The distribution of the elapsed time conjectured t* determined by the time decoder, given population signals at every actual time T for the cases of scheduled time-intervals of S = 4 and 8, respectively. Left: the color code represents the percentage of the population signals that gave the conjectured time t*. Right: the mean and SD of conjecture times t* at each actual time T. (C) Dependence of the average deviation of conjectured time t* from the actual time T on the number of neurons N. For the case of N < 25, a subset of neurons was randomly chosen. For N > 25, neuronal data were augmented by employing multiple spike trains from each neuron.
In addition, we examined the manner in which the accuracy in estimating time depends on the number of units (Figure 3C). Namely, we measured the error of the conjectured time t* from the actual time T by changing the number of units. For the case of N < 25, we randomly selected smaller subset of units. In these cases, the prediction accuracy fluctuated according to the selection of ensembles but it did not depend on particular units; this indicates that time is not represented at the single-unit level but is distributed over many units. The cases for N > 25 were tested by employing multiple spike trains from every unit and virtually regarding them as independent neuronal data. The prediction accuracy increased with the number of neurons.
Analyzing Neuronal Coding of the Elapsed Time and Scheduled Time-Interval
Next, we attempted to simultaneously estimate the scheduled waiting time-interval s as well as the elapsed time t by devising “TIME DECODER 2” (Figure 4; Materials and Methods). This algorithm allows us to estimate the elapsed time t = t** using only signals that have rendered the correct conjecture of the scheduled interval, s* = S (Figure 5A). The distribution of t** was very close to that of t* obtained with TIME DECODER 1 for each scheduled time-interval S = 4 or 8 s (Figure 3). Exclusive information that TIME DECODER 2 provides is the inference of the scheduled waiting time-interval, which is obtained by marginalizing the conditional probability distribution (Figure 4C). The percentage of correctly hitting the actual waiting time-interval, s*S, turned out to be significantly high (p ∼ 0.7), showing that the scheduled waiting time-interval S can be decoded from the activities of only N = 25 units even in the middle of the waiting period (Figure 5B).
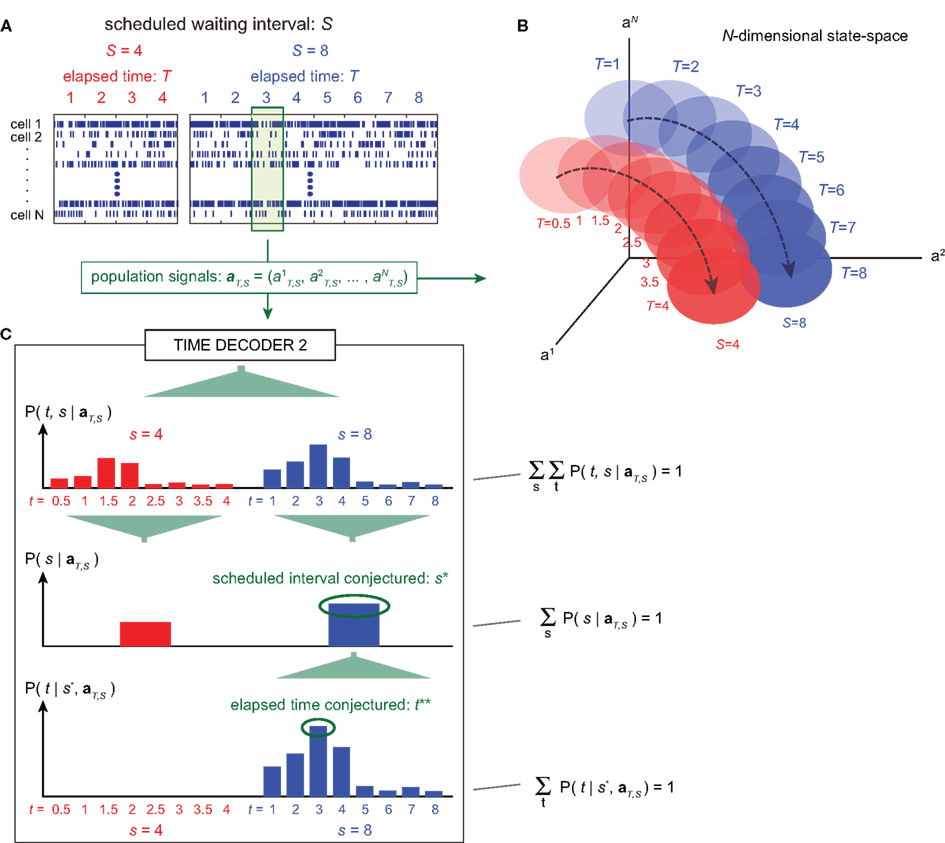
Figure 4. A device for simultaneously decoding the scheduled waiting-interval and the elapsed time. (A) Population signals derived from S = 4- and 8-s tasks. (B) Schematic representation of the motion of the population signals in N-dimensional state-space. For each task of S = 4 or 8 s, population signals  moves differently. Their average trajectories are schematically represented by the dashed lines. Colored ellipses represent the distributions of the training datasets
  at each elapsed time T in the scheduled waiting-interval S. (C) The probability
  allotted to each elapsed time t and scheduled waiting time-interval s given population signals recorded at the actual time T and schedule S (Eq. 5). The confidence for any population signals having been derived from the entire waiting time-interval s,
  is estimated by marginalizing the joint distribution (Eq. 6), which corresponds to collecting fragments of probability for (t, s). For a given set of signals, the scheduled time-interval s* is presumed as the time-interval that rendered the highest confidence (Eq. 7). The conditional probability of the elapsed time t given the conjecture scheduled time-interval s = s*,
  is given by dividing
  by
by  (Eq. 8). The elapsed time conjectured t** given s = s* is defined as the time that rendered the highest confidence (Eq. 9).
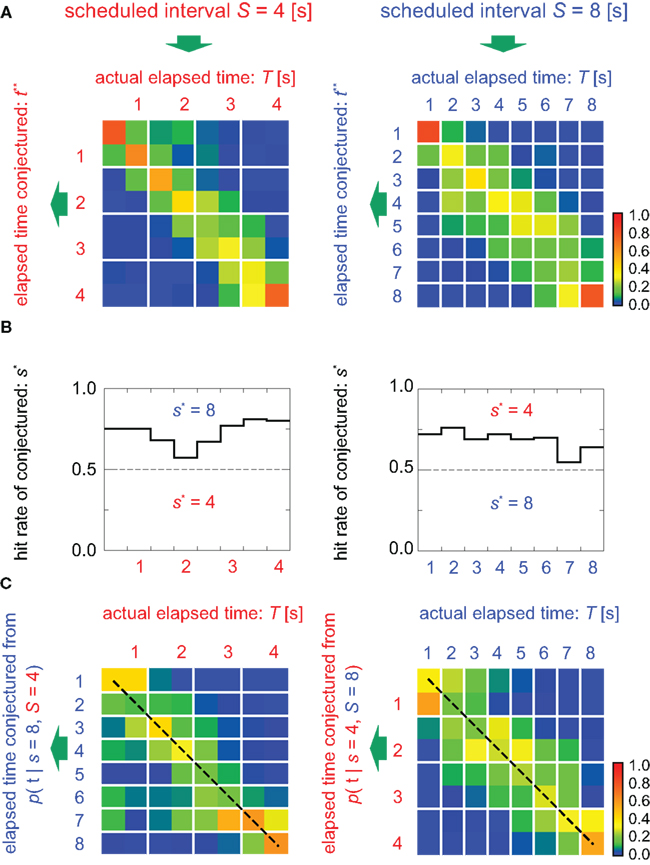
Figure 5. Estimation of the elapsed time and the scheduled time-interval. (A) Distribution of the elapsed time t** conjectured from samples that rendered the correct conjecture for the scheduled interval (s* = S). (B) Percentage of hitting the correct scheduled time-interval, s* = S, given 100 test sample sets of population signals at every time T. (C) The elapsed time was conjectured under the postulate that the scheduled waiting-interval s is different from the actual interval S (cases for incorrect postulate). Dashed lines represent the linear relationship between the conjectured (t*) and actual (T) elapsed time, representing two different sets of relative timescales; t* = 2T for s = 2S = 8 (left), or t* = T/2 for s = S/2 = 4 (right). The average probability of hitting the relative timescale was 0.33, while that of hitting the physical timescale is 0.22.
In addition, TIME DECODER 2 provided us more intriguing information of the manner in which the time is encoded in neuronal populations. This information was revealed by estimating the elapsed time t under the presumption that the scheduled waiting time-interval s is different from the actual S: if the conjectured time t indicates the original lapse of time T independently of the presumption of the entire waiting time-interval s, we should conclude that the neuronal populations encode the raw physical time. However, it turned out that the conjectured time t was scaled with an assumption about the entire scheduled interval s: the elements of the confusion matrix representing rescaled time schema, t/s = T/S, indicated the higher probability than the elements representing the raw physical time schema, t = T (Figure 5C). This fact implies that the neuronal ensemble is gaging the passage of time relatively to the entire scheduled interval (Renoult et al., 2006).
To visualize the neuronal encoding of the lapse of time, we mapped the temporal variation of the population activities in N-dimensional state-space onto a plane of the first two principal components (Nicolelis et al., 1995; Serruya et al., 2002): the neuronal trajectories of two waiting tasks ran almost in parallel, with the passage of time in the 4-s task moving at double the speed of the 8-s task (Figures 6A,B). This indicates that the neuronal populations represent the passage of time in a manner relative to the entire scheduled waiting-interval, T/S, rather than the raw physical time, T (Figure 6C). For 100 sets of sample trajectories for 4- and 8-s tasks, we compared the preference to either the raw physical timescale or the relative timescale, which is determined by the shorter average distance in the two-dimensional plane connecting either T = 1, 2, 3, and 4, or T/S = 1/4, 1/2, 3/4, and 1. The majority of the sample datasets exhibited the preference for relative time coding (77/100 samples), indicating again that timing is gaged in the relative timescale (Chi-squared test, p < 0.01).
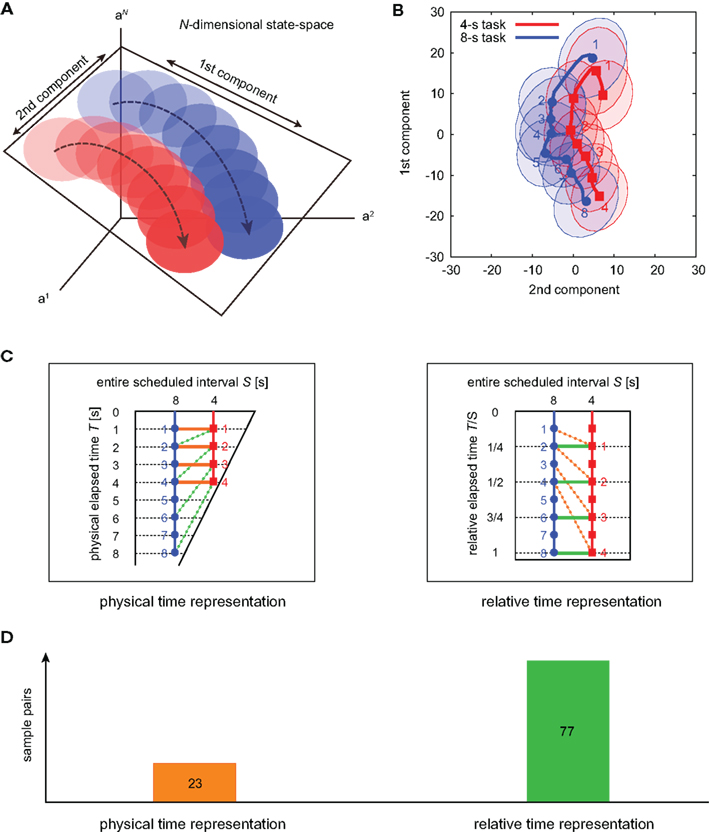
Figure 6. The state-space representation of neuronal population activities. (A) Schematic representation for the projection of N-dimensional orbits into two-dimensional plane spanned by the directions for the largest and second-largest deviations. (B) The state-space representation of the averaged orbits for two waiting tasks. The across-trial variance is shown by the ellipses representing the 1/2 quantile of a two-dimensional Gaussian distribution fitted to the data. (C) Two possible neuronal representations of elapsed time. In the left (right), the orange lines connecting identical physical times T = 1, 2, 3, and 4 [s] are shorter (longer) than the green lines connecting identical relative times T/S = 1/4, 1/2, 3/4, and 1. (D) The numbers of trajectory pairs that exhibited a preference for each of the two possible alternatives for time representation, determined by comparing the distance between physical time pairs and relative time pairs in the plane of two principal component axes. The average distances for the physical and relative time pairs were 17.1 and 13.6, respectively.
Analyzing Neuronal Data by Aligning at the Onset of Movement
In the above, we have shown the results of analysis performed on population signals aligned at the onset of the cue signal. We also performed the same analyses on the data aligned at the time of key release movement, in which case the time is measured retrogressively (Figure 7A). Here, we summarize quantitative results obtained by the data alignment at movement onset.
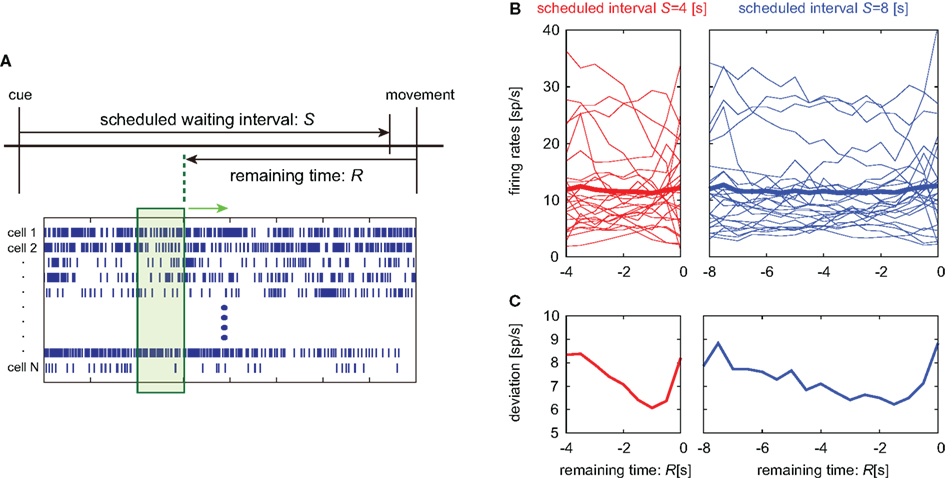
Figure 7. Alignment of spike trains at the movement onset. (A) Lapse of time in the waiting-interval and neuronal population firings aligned at the time of key release movement. Population signals in this analysis are referred to as a set of firing rates in a 1-s interval just before the remaining time R. (B,C) Temporal modulation of the firing rates of 25 pre-SMA neurons, their average, and SD, aligned at the movement onset.
Average activity of neuronal population activities neither indicated prominent dependency on the time (Figure 7B). It is noteworthy that their variance decreased in time until approximately 1 s prior to the initiation of motor action (Figure 7C).
The accuracy of decoding time using the two kinds of time decoders did not exhibit any notable difference between the cue onset and the motion onset analyses. In the state-space analysis measuring the orbit distance in the plane of two principal components, we observed subtle differences: in the analyses of cue onset data (Figure 6), the distances of the physical and relative time pairs were 17.1 and 13.6, and the sample pairs exhibiting shorter distances were 23 and 77, respectively. When analyzing movement onset data, we measured the distance retrogressively from the motion onset. In this case, the distances of the physical and relative time pairs were 14.3 and 12.4, and the sample pairs exhibiting shorter distances were 36 and 64, respectively. The relative time coding is dominant in both cases, but the latter results indicate that the physical time coding is slightly emerging in the late phase of the waiting period.
Discussion
In the present study, we developed a method for decoding time and applied it to neuronal population signals recorded in the pre-SMA. The decoding analysis provided two compelling conclusions with respect to the participation of the pre-SMA in interval timing. First, activity of the neuronal ensemble represents not only the lapse of time but also the scheduled waiting time-interval in each trial. These two pieces of information are necessary for an agent that determines the timing of action without receiving any information from external clocks. Second, the lapse of time is gaged in a manner scaled relative to the entire waiting time-interval, rather than in the raw physical timescale. Such representation of time is close to our naive sense of timing (Allan, 1979; Renoult et al., 2006; Brown et al., 2007).
In conventional neurophysiological analyses, neuronal correlates to the animal’s behavior are detected by superposing neuronal spike trains obtained from typically tens of repeated trials. The trial average is a standard method for removing high single-trial variability of the neuronal activity (Churchland et al., 2010). Here we adopted a method of population decoding in analyzing the neuronal activity in waiting time task. The knowledge that is added to the averaging analysis is the range of possible deviation of predicted time given a set of population data. One merit of our decoding analysis is the potential application in the brain–computer or brain–machine interface (BCI/BMI) for online prediction of movement timing.
The time-estimation accuracy of the order of 1 s could be rated highly in consideration of the fact that the decoding was performed using only N = 25 spike trains obtained from a single-trial. It should be noted, however, that the pre-SMA is not an exclusive area that participates in interval timing. Rickert et al. (2009) achieved accurate time inference from single-unit activities in premotor and primary motor areas. In that analysis of the behavioral tasks of shorter timescale, the temporal resolution was higher than the one achieved by the current analysis of pre-SMA in the tasks of longer timescale. It could occur that the different areas are taking over portions of time-estimation according to different timescales.
Reading intended motion from signals in the brain forms an important part of BCI/BMI, in which reliable identification of the intended movement from single-trial neuronal activity is crucial. On the other hand, the across-trial variability of single-neuron’s activity compromises the accurate estimation of the movements. Previous studies have demonstrated that this inaccuracy inherent in the single-neuronal activity could be overcome by analyzing the activity of the neuronal ensemble (Nicolelis et al., 1995; Serruya et al., 2002; Yu et al., 2009). The present study has demonstrated that the same approach makes it possible to reliably predict the timing of movement initiation. BCI/BMI performance would be improved by combining the estimation of movement and time of the voluntary action.
The present study has attempted to determine the timing of action from neuronal signals, under the assumption that the waiting task has already started. In considering real applications, it is equally important to know the task state itself, namely to determine whether or not the waiting task is currently running, as has been investigated by Achtman et al. (2007). It is worthwhile to examine the possibility of extending the present analysis into this direction.
The algorithms we implemented in this analysis are basic, and thus decoding efficiency can be improved by more complicated analyses. For the purpose of simply enhancing the capability in estimating time, we may consider introducing the Bayesian updating method that refers to the history of the neuronal states. As we were concerned with the neuronal time codes here, we attempted to determine time solely from neuronal population signals averaged over a short interval, without referring to its history. Even under this condition that limits the information to the activity in 1 s, it is still possible to overcome fluctuation by smoothing sequential states and selecting the essential signals as suggested for improving the current BCI/BMI technology (Nicolelis et al., 1995; Carmena et al., 2003; Lebedev and Nicolelis, 2006; Santhanam et al., 2006; Cunningham et al., 2009; Jacobs et al., 2009; Rickert et al., 2009; Bansal et al., 2011; Pillow et al., 2011). In the present analysis, we were rather free from such potential fluctuation as we used a small number of units that were already selected as being significantly task-related. In an actual situation in which signals are recorded from randomly sampled units that are not entirely correlated to the task, it would be worthwhile to consider introducing more elaborate techniques.
There has been a great deal of debate on the neuronal mechanisms of interval timing (Pillow et al., 2008; MacEvoy and Epstein, 2009). Although we have assumed here that timing is represented in the temporal modulation of the neuronal firing rate, there are other possible means that may account for determining a time-interval, such as assembling multiple oscillators (Miall, 1989, 1993; Matell and Meck, 2004), using delay lines (Fiala et al., 1996; Ivry, 1996) or observing complex neuronal states (Karmarkar and Buonomano, 2007; Szátmary and Izhikevich, 2009).
Rather than proposing a specific model, we propose here a hypothesis that will allow consistent comprehension of the experimental facts revealed in the present analysis: we focus on a fact that there are units that display both ascending and descending activities, and the firing frequencies of those different neurons are approaching similar values, as evidenced by the decrease in the deviation of firing rates among various units (Figure 2B). By aligning data at the time of movement onset, we observed that the frequency condensation is occurring approximately 1 s prior to the initiation of motor action (Figure 7A).
We wish to argue here a theoretical possibility of such frequency condensation for being related to movement initiation signal. It is noteworthy that frequency condensation of regular spike trains may induce coincidental occurrence of spike (Hopfield and Brody, 2001). Although interesting, this issue is based on firing regularity, which we found to be absent by using the metric of local variation (Shinomoto et al., 2003, 2009). If the units with ascending and descending activities consist of different types of neurons, such as excitatory and inhibitory neurons (Leon and Shadlen, 2003; Mongillo et al., 2008; Gavornik and Shouval, 2011), their frequency condensation must induce large modulation in outgoing signals. It has been argued that frequency condensation of excitatory and inhibitory neurons may facilitate rhythmic activity even in the presence of noise (Shimokawa and Shinomoto, 2006). Although we are not in the stage to narrow down to a single model to explain the present phenomena, there is room that the frequency condensation is related to an initiation of an action.
The present study demonstrated that an attempt to determine the timing from neuronal signals may provide insight for the neuronal mechanisms of gaging time, determining a given passage of time, and preparing and executing action. The estimation of the passage of time was possible even from dozens of neurons if they are selected from an appropriate brain region. In addition to providing a hypothesis for the neuronal coding of time, the present results also point to the possibility for developing devices that are capable of predicting the time for subjects to initiate voluntary action. Such devices may assist in the development of the BCI that provides signals for motor planning.
Materials and Methods
Waiting Task and Recording Procedure
Two Japanese monkeys (Macaca fuscata) were cared and trained to perform the “interval-generation task” designed in a former study (Mita et al., 2009). All procedures for animal care and experimentation were in accordance with the guidelines of the National Institutes of Health.
The monkeys were trained to hold down a key for longer than a pre-assigned time-interval that was selected from 2, 4, and 8 s. The required waiting-interval is instructed by the color of LED that was lit for the initial 2 s of the interval. In the present study, we analyze 4 and 8-s tasks that genuinely require estimating the time-lapse.
Neuronal firing data were obtained using a conventional single-unit recording method. Extracellular recordings of single-neuron discharges were made using a standard technique of transdural recording (Evarts, 1968). Glass-insulated Elgiloy-alloy microelectrodes, with impedances of 1.5–3 MΩ (measured at 1 KHz) were used. Up to two neuronal discharges were collected from a single recording using a window discriminator that produced a pulse for each valid spike that met both amplitude and time constraints (Bak and Schmidt, 1977). Extreme care was taken to sort out spikes belonging to each single-neuron, avoiding spurious contamination of spikes from other neurons. This was confirmed by real-time, high-speed monitoring of spikes on a computer display, which were triggered by each sorted pulses. The spiking signals were recorded while the waiting tasks were repeated dozens of times (ranges from 12 to 91 times, average 44). For the present analysis, we selected 25 units that were significantly task-related, exhibiting a significant modulation of the firing rate following the cue signals (the Wilcoxon signed rank test, p < 0.01) from among 200 units in the pre-SMA examined in the former study under a less significant criterion (p < 0.05). We analyze spike trains recorded from successful trials of 4- and 8-s tasks in which the holding times were distributed over a range of 5.0 ± 0.6 and 9.3 ± 1.0 s (mean ± SD), respectively.
Procedures for Time Decoding and Its Variation
We implement algorithms for decoding the lapse of time and applied them to the population signals. As neuronal signals are available here only from single-unit recordings, we construct virtual population signals by collecting single spike trains from individual units (N = 25) for each task of 4 and 8 s. The population signals are used for adjusting the decoder and validating the decoding capability in the following procedure.
(1) Extract single spike trains from individual units to construct a test set of population signals (one spike train from each neuron).
(2) Construct the time decoder by using the information of the mean and variance of the firing rates of the remaining spike trains, which were not used for the test set.
(3) Validate the capability of the time decoder by applying it to the test set of signals.
(4) Repeat (1) through (3) 100 times by randomly selecting test spike trains.
We attempt to estimate the lapse of time with an accuracy of 0.5 or 1 s, respectively, for a task involving waiting 4 or 8 s. It may appear difficult to achieve this accuracy using signals whose waiting times deviated on the same order. Nevertheless, an inference is drawn if decisions are made based on the majority of the population data. Here, we show the method of analysis performed on virtual population signals constructed by aligning recorded spike trains according to the onset of the cue signal that informs the initiation of the waiting-interval. We have also tested the case of aligning data at the time of movement onset (Figure 7A), but the essential features remained the same.
Here, we refer to the “population signals” or “population activities” as a set of firing rates of N units measured in 1 s (equivalently, the numbers of spikes elicited in a 1-s interval) prior to the “elapsed time” T (Figure 1A). Accordingly, a vector representing the population activities  moves in time T in the N-dimensional state-space (Figure 1B).
Decoding the Elapsed Time: Time Decoder 1
First, we attempt to decode the lapse of time from unit signals recorded in each task having a scheduled waiting time-interval of 4 or 8 s; we implement an algorithm that allots the probability to conjecture the elapsed times t given population signals (Figure 1C) using the Bayes theorem (Rieke et al., 1997; MacKay, 2003; Quiroga and Panzeri, 2009),
where  represents the population activities of N = 25 units observed at the real elapsed time T. Here, we divide the scheduled waiting time-interval of 4 or 8 s into 8 pieces, namely t = 0.5, 1, 1.5, …, 4, or t = 1, 2, 3, …, 8, and chose equal prior probabilities p(t) = 1/8. The denominator on the right-hand side is obtained by marginalizing joint probability,

The unit activities are mostly mutually independent at every T, because the data are the collection of unit recordings obtained from independent trials, in each of which only one or two units were sorted out. Thus the probability of population activity is factorized into the probabilities of individual unit firing rates as

We further assume that the firing activity  for each unit had a Gaussian distribution with given average and variance computed from the training signals at each given time T. Though the Gaussian distribution gives finite probability for the negative rate as an artifact, it gave the better prediction results than the Poisson distribution, presumably because the data do not obey the Poisson distribution due to large across-trial variability. We fitted the Gauss and Poisson distribution functions to the distributions of the firing rates
  recorded every second in 4-s task (T = 1, 2, 3, 4), for 5 units that were recorded most frequently (i = 1, 2, 3, 4, 5). It is plainly observed that the Gauss distribution is superior to the Poisson distribution in fitting the actual distribution (Figure 8).
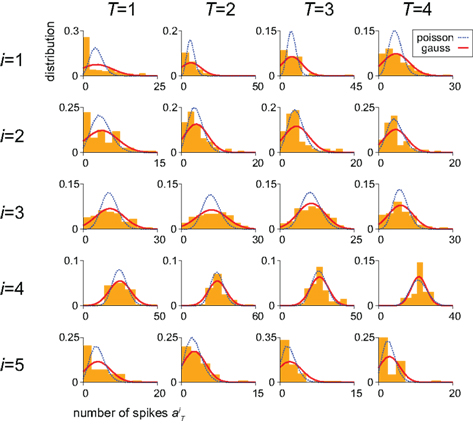
Figure 8. Distributions of the neuronal firing rates. Distributions of the numbers of spikes  recorded every second in 4-s task (T = 1, 2, 3, 4), for 5 units that were recorded most frequently (i = 1, 2, 3, 4, 5). Gauss and Poisson distribution functions fitted to individual data are superposed to each histogram (area normalized), respectively with red solid and blue dashed lines.
The procedure to estimate the probability of conjecturing the elapsed times t is summarized as follows.
(1) Construct the conditional probability distribution function  according to Eq. 3, as a product of the Gaussian functions given by the information of the mean and variance of the firing rates.
(2) Compute the marginal distribution  according to Eq. 2, with p(t) = 1/8.
(3) Construct the function  according to Eq. 1.
In presuming the elapsed time t at which population signals would have been recorded, we employ the maximum a posteriori (MAP) criterion, that is to choose a conjecture t = t* that rendered the highest confidence or  or
or

Decoding the Scheduled Time-Interval and the Elapsed Time: Time Decoder 2
Second, we augment the algorithm so that it may decode not only the current elapsed time but also the scheduled waiting time-interval assigned in each trial solely from population signals (Figure 4A). This inference is obtained by allotting the probability to the combination of the conjecture elapsed time t and the scheduled waiting-interval s. To allot equal prior probabilities to two tasks of different waiting-intervals, we evenly divide each total time-interval, s = 4 or 8 s, into the same number of pieces, namely, 8 pieces consisting of t = 0.5, 1, 1.5, …, 4 for s = 4, and t = 1, 2, 3, …, 8 for s = 8 (Figure 4B). In constructing the conditional probability,
we choose equal prior p(t, s) = constant = 1/16 for every combination of (t, s). Here in particular, we denote the population activities as  by specifying the real scheduled interval S (=4 or 8) in addition to the real elapsed time T. The degree in which the firing signals contain information of the scheduled waiting-interval s is estimated by marginalizing the joint probability distribution (Figure 4C),

In presuming the scheduled waiting time-interval s to which population signals would have belonged, we employed the MAP criterion again, that is to choose a conjecture s = s* that rendered the highest confidence  or
or

The conditional probability of the elapsed time t given the conjecture scheduled time-interval s can be obtained using Bayes’ relation again as
In presuming the elapsed time t under an assumption that the scheduled time-interval is s*, we employ the MAP criterion again, that is to choose a conjecture t = t** that rendered the highest confidence  or
or

Visualization of Neuronal Trajectories in the State-Space
To analyze the dynamics of the population signals, we map the N-dimensional vector representing the population activities  into a lower-dimensional space using a dimensionality–reduction method based on principal component analysis (PCA; Nicolelis et al., 1995; Serruya et al., 2002). The process of performing the PCA analysis is summarized as follows.
(1) Segment 4-s trials into 40 × 0.1 s intervals, and 8-s trials into 40 × 0.2 s
(2) Compute mean firing rate  averaged over all trials for each (ith) unit in 1 s prior to the elapsed time T.
(3) Construct a set of vectors representing average population activities 
(4) For those 80 population vectors, we determine their most significant covariance using PCA.
Then, the population neuronal trajectory is mapped to each principal component axis by weight-summing the activities of individual units with the coefficients of unit eigenvector that corresponds to each principal component axis. Here we analyzed the neuronal trajectories in a plane of the first two principal components.
Conflict of Interest Statement
The authors declare that the research was conducted in the absence of any commercial or financial relationships that could be construed as a potential conflict of interest.
Acknowledgments
We are grateful to Yoshio Sakurai for stimulating discussion, and two reviewers for their reading the manuscript with extreme care and giving comments that helped to improve the manuscript. This study was supported in part by Grants-in-Aid for Scientific Research to Shigeru Shinomoto from MEXT Japan (20300083, 23115510) and the Grant-in-Aid for the Global COE Program “The Next Generation of Physics, Spun from Universality and Emergence” from the MEXT of Japan. Takahiro Omi is supported by JSPS Research Fellowships for Young Scientists.
References
Achtman, N., Afshar, A., Santhanam, G., Yu, B. M., Ryu, S. I., and Shenoy, K. V. (2007). Free-paced high-performance brain-computer interfaces. J. Neural Eng. 4, 336–347.
Bak, M. J., and Schmidt, E. M. (1977). An improved time-amplitude window discriminator. IEEE Trans. Biomed. Eng. 24, 486–489.
Bansal, A. K., Vargas-Irwin, C. E., Truccolo, W., and Donoghue, J. P. (2011). Relationships among low-frequency local field potentials, spiking activity and 3-D reach and grasp kinematics in primary motor and ventral premotor cortices. J. Neurophysiol. 105, 1603–1619.
Beck, J. M., Ma, W. J., Kiani, R., Hanks, T., Churchland, A. K., Roitman, J., Shadlen, M. N., Latham, P. E., and Pouget, A. (2008). Probabilistic population codes for Bayesian decision making. Neuron 60, 1142–1152.
Brody, C. D., Hernández, A., Zainos, A., and Romo, R. (2003). Timing and neural encoding of somatosensory parametric working memory in macaque prefrontal cortex. Cereb. Cortex 13, 1196–1207.
Brown, G. D. A., Neath, I., and Chater, N. (2007). A temporal ratio model of memory. Psychol. Rev. 114, 539–576.
Buhusi, C. V., and Meck, W. H. (2005). What makes us tick? Functional and neural mechanisms of interval timing. Nat. Rev. Neurosci. 6, 755–765.
Buonomano, D. V., and Laje, R. (2010). Population clocks: motor timing with neural dynamics. Trends Cogn. Sci. (Regul. Ed.) 14, 520–527.
Carmena, J. M., Lebedev, M. A., Crist, R. E., O’Doherty, J. E., Santucci, D. M., Dimitrov, D. F., Patil, P. G., Henriquez, C. S., and Nicolelis, M. A. L. (2003). Learning to control a brain-machine interface for reaching and grasping by primates. PLoS Biol. 1, e42. doi: 10.1371/journal.pbio.0000042
Churchland, M. M., Yu, B. M., Cunningham, J. P., Sugrue, L. P., Cohen, M. R., Corrado, G. S., Newsome, W. T., Clark, A. M., Hosseini, P., Scott, B. B., Bradley, D. C., Smith, M. A., Kohn, A., Movshon, J. A., Armstrong, K. M., Moore, T., Chang, S. W., Snyder, L. H., Lisberger, S. G., Priebe, N. J., Finn, I. M., Ferster, D., Ryu, S. I., Santhanam, G., Sahani, M., and Shenoy, K. V. (2010). Stimulus onset quenches neural variability: a widespread cortical phenomenon. Nat. Neurosci. 13, 369–378.
Coull, J. T., Vidal, F., Nazarian, B., and Macar, F. (2004). Functional anatomy of the attentional modulation of time estimation. Science 303, 1506–1508.
Cunningham, J. P., Gilja, V., Ryu, S. I., and Shenoy, K. V. (2009). Methods for estimating neural firing rates, and their application to brain-machine interfaces. Neural Netw. 22, 1235–1246.
Durstewitz, D. (2003). Self-organizing neural integrator predicts interval times through climbing activity. J. Neurosci. 23, 5342–5353.
Evarts, E. V. (1968). A technique for recording activity of subcortical neurons in moving animals. Electroencephalogr. Clin. Neurophysiol. 24, 83–86.
Fiala, J. C., Grossberg, S., and Bullock, D. (1996). Metabotropic glutamate receptor activation in cerebellar Purkinje cells as substrate for adaptive timing of the classically conditioned eye-blink response. J. Neurosci. 16, 3760–3774.
Gavornik, J. P., and Shouval, H. Z. (2011). A network of spiking neurons that can represent interval timing: mean field analysis. J. Comput. Neurosci. 30, 501–513.
Hopfield, J. J., and Brody, C. D. (2001). What is a moment? Transient synchrony as a collective mechanism for spatiotemporal integration. Proc. Natl. Acad. Sci. U.S.A. 98, 1282–1287.
Ivry, R. B. (1996). The representation of temporal information in perception and motor control. Curr. Opin. Neurobiol. 6, 851–857.
Jacobs, A. L., Fridman, G., Douglas, R. M., Alam, N. M., Latham, P. E., Prusky, G. T., and Nirenberg, S. (2009). Ruling out and ruling in neural codes. Proc. Natl. Acad. Sci. U.S.A. 106, 5936–5941.
Jazayeri, M., and Shadlen, M. N. (2010). Temporal context calibrates interval timing. Nat. Neurosci. 13, 1020–1026.
Jin, D. Z., Fujii, N., and Graybiel, A. M. (2009). Neural representation of time in cortic-basal ganglia circuits. Proc. Natl. Acad. Sci. U.S.A. 106, 19156–19161.
Karmarkar, U. R., and Buonomano, D. V. (2007). Timing in the absence of clocks: encoding time in neural network states. Neuron 53, 427–438.
Kilavik, B. E., Confais, J., Ponce-Alvarez, A., Diesmann, M., and Riehle, A. (2010). Evoked potentials of motor cortical LFPs reflect task timing and behavioral performance. J. Neurophysiol. 104, 2338–2351.
Lebedev, M. A., and Nicolelis, M. A. L. (2006). Brain-machine interfaces: past, present and future. Trends Neurosci. 29, 536–546.
Lebedev, M. A., O’Doherty, J. E., and Nicolelis, M. A. L. (2008). Decoding of temporal intervals from cortical ensemble activity. J. Neurophysiol. 99, 166–186.
Leon, M. I., and Shadlen, M. N. (2003). Representation of time by neurons in the posterior parietal cortex of the macaque. Neuron 38, 317–327.
MacEvoy, S. P., and Epstein, R. A. (2009). Decoding the representation of multiple simultaneous objects in human occipitotemporal cortex. Curr. Biol. 19, 943–947.
MacKay, D. J. C. (2003). Information Theory, Inference and Learning Algorithms. Cambridge: Cambridge University Press.
Matell, M. S., and Meck, W. H. (2004). Cortico-striatal circuits and interval timing: coincidence detection of oscillatory processes. Brain Res. Cogn. Brain Res. 21, 139–170.
Matell, M. S., Meck, W. H., and Nicolelis, M. A. L. (2003). Interval timing and the encoding of signal duration by ensembles of cortical and striatal neurons. Behav. Neurosci. 117, 760–773.
Mauk, M. D., and Buonomano, D. V. (2004). The neural basis of temporal processing. Annu. Rev. Neurosci. 27, 307–340.
Meck, W. H., Penney, T. B., and Pouthas, V. (2008). Cortico-striatal representation of time in animals and humans. Curr. Opin. Neurobiol. 18, 145–152.
Miall, C. (1989). The storage of time intervals using oscillating neurons. Neural. Comput. 1, 359–371.
Mita, A., Mushiake, H., Shima, K., Matsuzaka, Y., and Tanji, J. (2009). Interval time coding by neurons in the presupplementary and supplementary motor areas. Nat. Neurosci. 12, 502–507.
Mongillo, G., Barak, O., and Tsodyks, M. (2008). Synaptic theory of working memory. Science 319, 1543–1546.
Nicolelis, M. A. L., Baccala, L. A., Lin, R. C. S., and Chapin, J. K. (1995). Sensorimotor encoding by synchronous neural ensemble activity at multiple levels of the somatosensory system. Science 268, 1353–1358.
Niki, H., and Watanabe, M. (1979). Prefrontal and cingulate unit activity during timing behavior in the monkey. Brain Res. 171, 213–224.
Pillow, J. W., Ahmadian, Y., and Paninski, L. (2011). Model-based decoding, information estimation, and change-point detection techniques for multineuron spike trains. Neural. Comput. 23, 1–45.
Pillow, J. W., Shlens, J., Paninski, L., Sher, A., Litke, A. M., Chichilnisky, E. J., and Simoncelli, E. P. (2008). Spatio-temporal correlations and visual signalling in a complete neuronal population. Nature 454, 995–999.
Quiroga, R. Q., and Panzeri, S. (2009). Extracting information from neuronal populations: information theory and decoding approaches. Nat. Rev. Neurosci. 10, 173–185.
Rao, S. M., Mayer, A. R., and Harrington, D. L. (2001). The evolution of brain activation during temporal processing. Nat. Neurosci. 4, 317–323.
Renoult, L., Roux, S., and Riehle, A. (2006). Time is a rubberband: neuronal activity in monkey motor cortex in relation to time estimation. Eur. J. Neurosci. 23, 3098–3108.
Reutimann, J., Yakovlev, V., Fusi, S., and Senn, W. (2004). Climbing neuronal activity as an event-based cortical representation of time. J. Neurosci. 24, 3295–3303.
Rickert, J., Riehle, A., Aertsen, A., Rotter, S., and Nawrot, M. P. (2009). Dynamic encoding of movement direction in motor cortical neurons. J. Neurosci. 29, 13870–13882.
Rieke, F., Warland, D., de Ruyter van Steveninck, R., and Bialek, W. (1997). Spikes: Exploring the Neural Code. Cambridge: MIT Press.
Santhanam, G., Ryu, S. I., Yu, B. M., Afshar, A., and Shenoy, K. V. (2006). A high-performance brain computer interface. Nature 442, 195–198.
Serruya, M. D., Hatsopoulos, N. G., Paninski, L., Fellows, M. R., and Donoghue, J. P. (2002). Instant neural control of a movement signal. Nature 416, 141–142.
Shimokawa, T., and Shinomoto, S. (2006). Inhibitory neurons can facilitate rhythmic activity in a neural network. Phys. Rev. E Stat. Nonlin. Soft Matter Phys. 73, 66221.
Shinomoto, S., Kim, H., Shimokawa, T., Matsuno, N., Funahashi, S., Shima, K., Fujita, I., Tamura, H., Doi, T., Kawano, K., Inaba, N., Fukushima, K., Kurkin, S., Kurata, K., Taira, M., Tsutsui, K.-I., Komatsu, H., Ogawa, T., Koida, K., Tanji, J., and Toyama, K. (2009). Relating neuronal firing patterns to functional differentiation of cerebral cortex. PLoS Comput. Biol. 5, e1000433. doi: 10.1371/journal.pcbi.1000433
Shinomoto, S., Shima, K., and Tanji, J. (2003). Differences in spiking patterns among cortical neurons. Neural. Comput. 15, 2823–2842.
Szátmary, B., and Izhikevich, E. M. (2009). Spike-timing theory of working memory. PLoS Comput. Biol. 6, e1000879. doi: 10.1371/journal.pcbi.1000879
Keywords: timing of action, prefrontal cortex, pre-supplementary motor area, Bayesian analysis, state-space, principal component analysis
Citation: Shinomoto S, Omi T, Mita A, Mushiake H, Shima K, Matsuzaka Y and Tanji J (2011) Deciphering elapsed time and predicting action timing from neuronal population signals. Front. Comput. Neurosci. 5:29. doi: 10.3389/fncom.2011.00029
Received: 22 February 2011; Accepted: 09 June 2011;
Published online: 21 June 2011.
Edited by:
David Hansel, University of Paris, FranceReviewed by:
Antonio Politi, Istituto dei Sistemi Complessi, ItalyMartin Nawrot, Free University, Berlin
Copyright: © 2011 Shinomoto, Omi, Mita, Mushiake, Shima, Matsuzaka and Tanji. This is an open-access article subject to a non-exclusive license between the authors and Frontiers Media SA, which permits use, distribution and reproduction in other forums, provided the original authors and source are credited and other Frontiers conditions are complied with.
*Correspondence: Shigeru Shinomoto, Department of Physics, Kyoto University, Kyoto 606-8502, Japan. e-mail: shinomoto@scphys.kyoto-u.ac.jp