1
Department of Neurobiology, Weizmann Institute of Science, Rehovot, Israel
2
Nobel Institute for Neurophysiology, Department of Neuroscience, Karolinska Institute, Stockholm, Sweden
3
Department of the History of Science, Harvard University, Cambridge, MA, USA
4
Brain Mind Institute, Ecole Polytechnique Fédérale de Lausanne, Lausanne, Switzerland
5
Warwick Systems Biology Centre, University of Warwick, Coventry, UK
Inter-pyramidal synaptic connections are characterized by a wide range of EPSP amplitudes. Although repeatedly observed at different brain regions and across layers, little is known about the synaptic characteristics that contribute to this wide range. In particular, the range could potentially be accounted for by differences in all three parameters of the quantal model of synaptic transmission, i.e. the number of release sites, release probability and quantal size. Here, we present a rigorous statistical analysis of the transmission properties of excitatory synaptic connections between layer-5 pyramidal neurons of the somato-sensory cortex. Our central finding is that the EPSP amplitude is strongly correlated with the number of estimated release sites, but not with the release probability or quantal size. In addition, we found that the number of release sites can be more than an order of magnitude higher than the typical number of synaptic contacts for this type of connection. Our findings indicate that transmission at stronger synaptic connections is mediated by multiquantal release from their synaptic contacts. We propose that modulating the number of release sites could be an important mechanism in regulating neocortical synaptic transmission.
Synaptic transmission is a key element in information processing in neuronal circuits. Revealing the mechanisms underlying synaptic properties is thus crucial to our understanding of the neural code. One such property, which is repeatedly observed at different brain regions and across layers, is the wide distribution of synaptic efficacies (Sayer et al., 1990
; Mason et al., 1991
; Markram et al., 1997
; Sjostrom et al., 2001
; Isope and Barbour, 2002
; Holmgren et al., 2003
; Song et al., 2005
; Feldmeyer et al., 2006
; Lefort et al., 2009
). Although ubiquitous, little is known about the relative contribution of different synaptic characteristics to this wide range. In particular, synaptic transmission can be described via the standard ‘Quantal model’, by assigning a synaptic connection with a given number of release sites, N. From each release site, a vesicle can be released following a pre-synaptic action potential, with probability p, and contribute a quantum of amplitude, q, to the post-synaptic response (del Castillo and Katz, 1954
). Accordingly, the distribution of synaptic efficacies could potentially be explained by differences in all three parameters.
Here, we focused on neocortical excitatory synaptic connections, for which the range of EPSP amplitudes can cover two orders of magnitudes (0.1–10 mV; e.g. Markram et al., 1997
; Song et al., 2005
; Lefort et al., 2009
), and asked: which of the parameters of the quantal model (N, p or q) best explains this wide range? Previous estimations of the parameters at cortical synapses suggest that N is constrained by the number of synaptic contacts that form a synaptic connection, i.e. only one vesicle, or quantum, can be released in the event of a pre-synaptic spike from each contact (Gulyas et al., 1993
; Silver et al., 2003
; Lawrence et al., 2004
; Biró et al., 2005
), in agreement with the ‘single vesicle hypothesis’ (Korn et al., 1981
, 1994
). At the hippocampus, this constraint is relieved when the release probability increases (either through short-term facilitation or pharmacologically), and multiquantal release from single contact points was implicated (Oertner et al., 2002
; Biró et al., 2006
; Christie and Jahr, 2006
). In the neocortex, though, at connections from layer-4 spiny stellate cells onto layer 2/3 pyramidal neurons, the baseline release probability is high (∼0.8), yet uniquantal release was observed (Silver et al., 2003
).
The amplitudes of neocortical synaptic responses can be significantly stronger than those studied in Silver et al. (2003
; ∼0.5 mV), with comparable number of contact points (2–8 contacts). In the framework of the single vesicle hypothesis, this would imply a higher quantal size at the stronger synaptic connections, or a higher release probability. An alternative explanation would be that at stronger synapses, several quanta, or vesicles, could be released from a given synaptic contact upon pre-synaptic activation. The different alternatives lead to distinct predicted effects on the properties of synaptic transmission beyond the changes to the response amplitude. For example, a higher release probability, or a higher number of release sites, results in a decrease in response variability, which is not the case for larger quantal size.
To illuminate these different scenarios, we studied synaptic connections between layer-5 pyramidal neurons, with EPSP amplitudes ranging from 0.54 to 7.2 mV. Our analysis method is based on the extension of the quantal model that accounts for the dynamics of short-term synaptic depression (Thomson and Deuchars, 1994
; Fuhrmann et al., 2002
). The extended model captures the effects of short-term depression by assuming that once a vesicle is released, the corresponding release site remains empty until being refilled by a new vesicle, as suggested by experimental observations (Thomson et al., 1993
; Debanne et al., 1996
; Varela et al., 1997
; Silver et al., 1998
; Zucker and Regehr, 2002
). When considering the average response to a pre-synaptic spike train, this model is equivalent to the deterministic model of synaptic depression (Abbott et al., 1997
; Tsodyks and Markram, 1997
). Hence, the probability of release can be estimated from the temporal dynamics of the average response of a synaptic connection to the spike train, and subsequently, the number of release sites, N, and quantal size, q, can be evaluated from the variance and mean of the response in the standard way. This novel approach allowed us to estimate the quantal parameters from a single set of experimental conditions, as opposed to previous studies (Silver et al., 1998
, 2003
; Foster and Regehr, 2004
; Biró et al., 2006
; but see Biró et al., 2005
; Brémaud et al., 2007
).
Our main finding is that the estimated number of release sites increases linearly with synaptic efficacy, indicating that it is the main determinant of the distribution of synaptic efficacies. As the number of release sites can be much higher (>100) than the number of synaptic contacts between layer-5 pyramidal neurons, we suggest that multiquantal release is a common feature of neocortical synaptic transmission.
Slice Preparation and Electrophysiology
All experimental procedures were carried out according to the regulations of the Swiss Federation and the Stockholm Regional Ethics Committee. Neocortical slices (Sagittal, 300-μm thick) were obtained from Wistar rats (postnatal days 13–16). Slices were incubated for 30 min at 33–35°C and then at room temperature (20–22°C) until transferred to the recording chamber (35 ± 0.5°C). Thick tufted pyramidal neurons in layer-5 of the somato-sensory area were selected for recording according to the morphology of their somata and proximal dendrites. The slice was visualized by IR-DIC optics using a Zeiss Axioscope and infrared camera (TILL photonics). The bathing solution consisted of (mM): NaCl 125, NaHCO3 25, glucose 25, KCl 2.5, CaCl2 2, NaH2PO4 1.25, MgCl2 1. Whole-cell recordings were made using patch pipettes (5–10 MOhm), containing (mM): potassium gluconate 110, KCl 10, Hepes 10, phosphocreatine(Na) 10, MgATP 4, NaGTP 0.3 and biocytin 4 mg/ml. Recordings were obtained using Axopatch 200B and Multiclamp 700B amplifiers (Axon Instruments). Data acquisition and analysis were performed using IgorPro (WaveMetrics, Inc.) and Matlab (Mathworks).
Once a pair of neurons was verified to be connected, the post-synaptic responses to a train of eight action potentials at 20 Hz, followed by a recovery test 550 ms later, were recorded (hereafter termed a single trace). The stimulation was repeated between 30 to 45 times, with a 5-s interval between repetitions. In 9 out of 20 pairs the stimulation protocol was repeated after a period of 10 min.
The Deterministic Model for Short-Term Synaptic Depression
The average temporal dynamics of short-term depression can be captured by assuming that a synaptic connection has a finite amount of resources (Abbott et al., 1997
; Tsodyks and Markram, 1997
; Tsodyks et al., 1998
). When an action potential arrives to the pre-synaptic terminal, a fraction of the resources is utilized to evoke a post-synaptic response. If a subsequent action potential arrives before all the utilized resources have recovered, the following post-synaptic response will be smaller. In mathematical terms, the model is represented by the following:
where x(t) denotes the fraction of available synaptic resources; U determines the fraction of the resources utilized at each spike; and τrec is the time constant that underlie the recovery process of the utilized resources back to the available state. Isyn(t) denotes the post-synaptic current that increases, at each spike, in proportion to the amount of utilized resources; and decays with a time constant τsyn. The proportionality factor, A, represents the absolute synaptic efficacy of the connection. δ(t) is in the Dirac notation, and tsp represent the timing of a spike. To avoid ambiguity we note that any dynamic quantity ω(t) multiplying a delta function (here and in the equations below), is evaluated just before the delta function, i.e.

where ε is an arbitrarily small positive number.
Completing the model is the equation for the membrane potential of the post-synaptic neuron:

where τmem is the membrane filter constant. For convenience, Rin, which represents the input resistance, was absorbed in A in the following.
We note that for the type of synaptic connections studied here the model presented is sufficient in capturing the observed short-term plasticity dynamics, with synaptic facilitation effects being negligible (Markram et al., 1998
; Richardson et al., 2005
).
The Stochastic Model for Synaptic Depression
The stochastic model we used follows the quantal model of synaptic release, where a synaptic connection is assumed to be composed of N independent release sites (del Castillo and Katz, 1954
). From each release site a single vesicle, at most, is released with a probability p upon the arrival of an action potential, and contributes a quanta q to the post-synaptic response. Short-term synaptic depression is included by considering that after a vesicle release, the corresponding site remains empty until it is refilled with a new vesicle (Fuhrmann et al., 2002
). The stochastic differential equation that describes these two processes of release and recovery is:

where σi is the stochastic variable that represents whether a vesicle is present (σi = 1 with a probability ρ) or absent (σi = 0 with a probability 1−ρ) from release site i, ri is the stochastic variable that represent whether a vesicle is released (ri = 1 with a probability p) or not (ri = 0 with a probability 1−p) at the time of a spike, t = tsp, and {trec} is a Poisson point process with rate 1/τrec, i.e. the probability of refilling at any time interval dt is dt/τrec. The stochastic post-synaptic current, Isyn(t), is described by:
where  is the overall number of vesicles released at the time of a spike. Completing the model is the equation for the membrane potential of the post-synaptic neuron, which has the same form as Eq. 3.
is the overall number of vesicles released at the time of a spike. Completing the model is the equation for the membrane potential of the post-synaptic neuron, which has the same form as Eq. 3.The above model provides a simple description of the vesicle restock dynamics (the restock rate is constant), that is sufficient for the data studied here. Proposals for more detailed models, that might be relevant at higher stimulation rates, can be found in Matveev and Wang (2000)
.
The Relation Between the Deterministic and Stochastic Models
The relation between the stochastic model (Eqs. 4 and 5) and the deterministic model of synaptic depression (Eq. 1) can be shown from averaging the stochastic equations over the random processes of release and recovery, for a given train of spikes {tsp}. The dynamics of the average of  and the synaptic current, are then given by:
and the synaptic current, are then given by:
where 〈nr〉 = N·p·ρ. This last relation follows from that the release sites are independent, and that the probability of release is a constant, and do not depend on past events.
Comparing Eqs 6 and 7 with Eqs 1 leads to the following equivalency relations between the parameters of the deterministic and stochastic models:

Estimation of the Number of Release Sites with the Jackknife-Monte-Carlo Approach
The first step in the estimation of the number of release sites, N, was to evaluate the synaptic release parameters from the fit of the deterministic model of synaptic depression to the average response of a synaptic connection. τsyn and τmem were estimated by fitting the time course of the recovery-test EPSP to the response of the model to a single pre-synaptic activation (Eqs. 1 and 3):
where α is a scaling factor. Subsequently, the remaining parameters (A, U and τrec) were estimated from comparing the amplitudes of the nine EPSPs (measured from their initial rising point) to an analogous set of amplitudes derived analytically from the model (e.g., Figure 1
A).
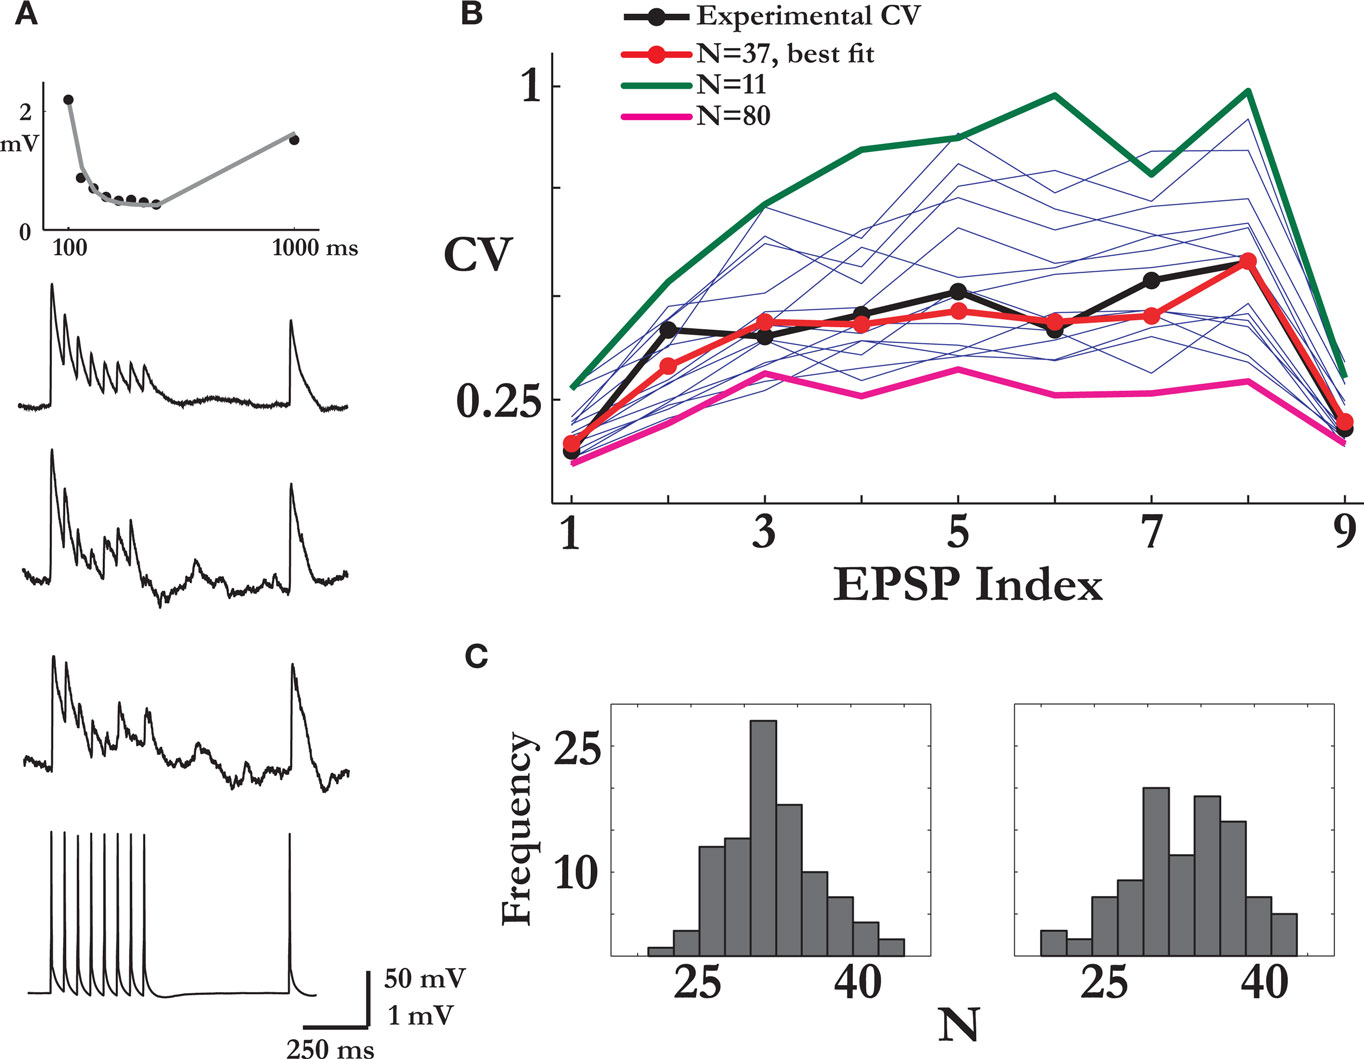
Figure 1. Estimating the number of release sites N. (A) Bottom to top: the pre-synaptic spike train, two examples of noisy post-synaptic single traces and the average response for that synaptic connection. The top panel shows the fit of the deterministic model of short-term synaptic depression (gray line) to the set of average EPSPs amplitudes (in black). (B) Estimation of N: the CVs of the nine EPSPs of the synaptic connection in (A) (black trace) were compared to the CVs calculated from the Monte Carlo simulations, each with a different value of N (thin blue traces). In the simulations, the parameters that govern the release process, the probability of release and the recovery time constant, were those estimated from the connection’s average response. Here, the simulation with N = 37 resulted in the best fit (red trace). The x-axis labelling represents the nine synaptic responses along the spike train (the first eight) and the recovery test [the ninth EPSP; see in (A)]. (C) The histograms of the estimated number of release sites from a 100 repetitions of the procedure presented in (B), for two recordings of the synaptic connection in (A) taken 10 min apart. The mean of the right and left distributions were 32.8 and 33.3.
In the second step of the estimation process the release parameters were integrated in stochastic Monte-Carlo simulations of the synaptic connection, and simulated single traces were produced in response to the same stimulation protocol used in experiments, i.e. same spike train stimulus and number of repetitions. The coefficients of variation (CV) of the simulated and recorded EPSPs were then compared. In both experiment and simulation, the CVs of the nine EPSPs of a synaptic connection were calculated from the Jackknife version of its single traces (Efron and Tibshirani, 1998
), i.e. from a set of averages that each excludes a different single trace. The advantage of this approach is that it allows for an accurate measurement of the EPSPs’ amplitudes from smooth average-like traces, and not from single noisy traces. The appropriate equations for the CVs are:
here J is the number of single traces measured for a connection, and  is the amplitude of the μth EPSP (μ = 1..9), measured from its initial rising point, at the ith Jackknife trace.
is the amplitude of the μth EPSP (μ = 1..9), measured from its initial rising point, at the ith Jackknife trace.In a single comparison iteration, a set of simulations were performed with an increasing value of N over a certain range (usually between 1 and a 100, with the upper limit adjusted for the stronger connections), and the estimated value was the one that resulted in the minimum mean-least-square distance between the CVs of the simulated and recorded EPSPs. Repeating this evaluation process for 100 iterations resulted in a distribution of values of the parameter N, which determined its expectation and confidence intervals (e.g. Figure 1
C).
Verifying the Accuracy of the Estimation Method
To verify the accuracy of our method of analysis in estimating the number of release sites under various types of noise elements, we applied it to two categories of simulations of virtual synaptic connections. The first category focused on examining the effect of the uniformity assumption of the dynamic parameters, i.e. that p = U and τrec are equal at all of the release sites. Virtual synapses were simulated with the stochastic model, assuming a certain number of release sites, N (ranging between 10 and 80), and with the values of pi and τrec,i chosen randomly from some distribution, e.g. pi ∈ Guassian(λP,0.5·λP) and  where i = 1...N. The mean values of the distributions that governed pi and τrec,i, i.e. λP and
  were chosen such that the eventual values of U and τrec, evaluated from the average response, were in the range of values found for the experimental data (Figure 2
). The lower and upper cut offs for the values of the probabilities of release (pi) were 0.05 and 0.95, and the lower cut off for the recovery time constants (τrec,i) was 50 ms. Other distributions than Gaussian were also examined, i.e. uniform, binomial and gamma distributions, resulting in the same observations as for the Gaussian distributions. Finally, qi = 1, τmem = 30 ms and τsyn = 3 ms. One hundred single traces were simulated with the same stimulation protocol used in experiments, and the estimated set of parameters (τsyn, τmem, τrec, A and U) that describes their average response was subsequently calculated as for the experimental average response. This enabled us to compare the expected CVs for the EPSPs of the virtual synapses to that of their ‘uniform synapse’ counterpart (Eqs. 11 and 12, respectively):
were chosen such that the eventual values of U and τrec, evaluated from the average response, were in the range of values found for the experimental data (Figure 2
). The lower and upper cut offs for the values of the probabilities of release (pi) were 0.05 and 0.95, and the lower cut off for the recovery time constants (τrec,i) was 50 ms. Other distributions than Gaussian were also examined, i.e. uniform, binomial and gamma distributions, resulting in the same observations as for the Gaussian distributions. Finally, qi = 1, τmem = 30 ms and τsyn = 3 ms. One hundred single traces were simulated with the same stimulation protocol used in experiments, and the estimated set of parameters (τsyn, τmem, τrec, A and U) that describes their average response was subsequently calculated as for the experimental average response. This enabled us to compare the expected CVs for the EPSPs of the virtual synapses to that of their ‘uniform synapse’ counterpart (Eqs. 11 and 12, respectively):
where i = 1...N. The mean values of the distributions that governed pi and τrec,i, i.e. λP and were chosen such that the eventual values of U and τrec, evaluated from the average response, were in the range of values found for the experimental data (Figure 2
). The lower and upper cut offs for the values of the probabilities of release (pi) were 0.05 and 0.95, and the lower cut off for the recovery time constants (τrec,i) was 50 ms. Other distributions than Gaussian were also examined, i.e. uniform, binomial and gamma distributions, resulting in the same observations as for the Gaussian distributions. Finally, qi = 1, τmem = 30 ms and τsyn = 3 ms. One hundred single traces were simulated with the same stimulation protocol used in experiments, and the estimated set of parameters (τsyn, τmem, τrec, A and U) that describes their average response was subsequently calculated as for the experimental average response. This enabled us to compare the expected CVs for the EPSPs of the virtual synapses to that of their ‘uniform synapse’ counterpart (Eqs. 11 and 12, respectively):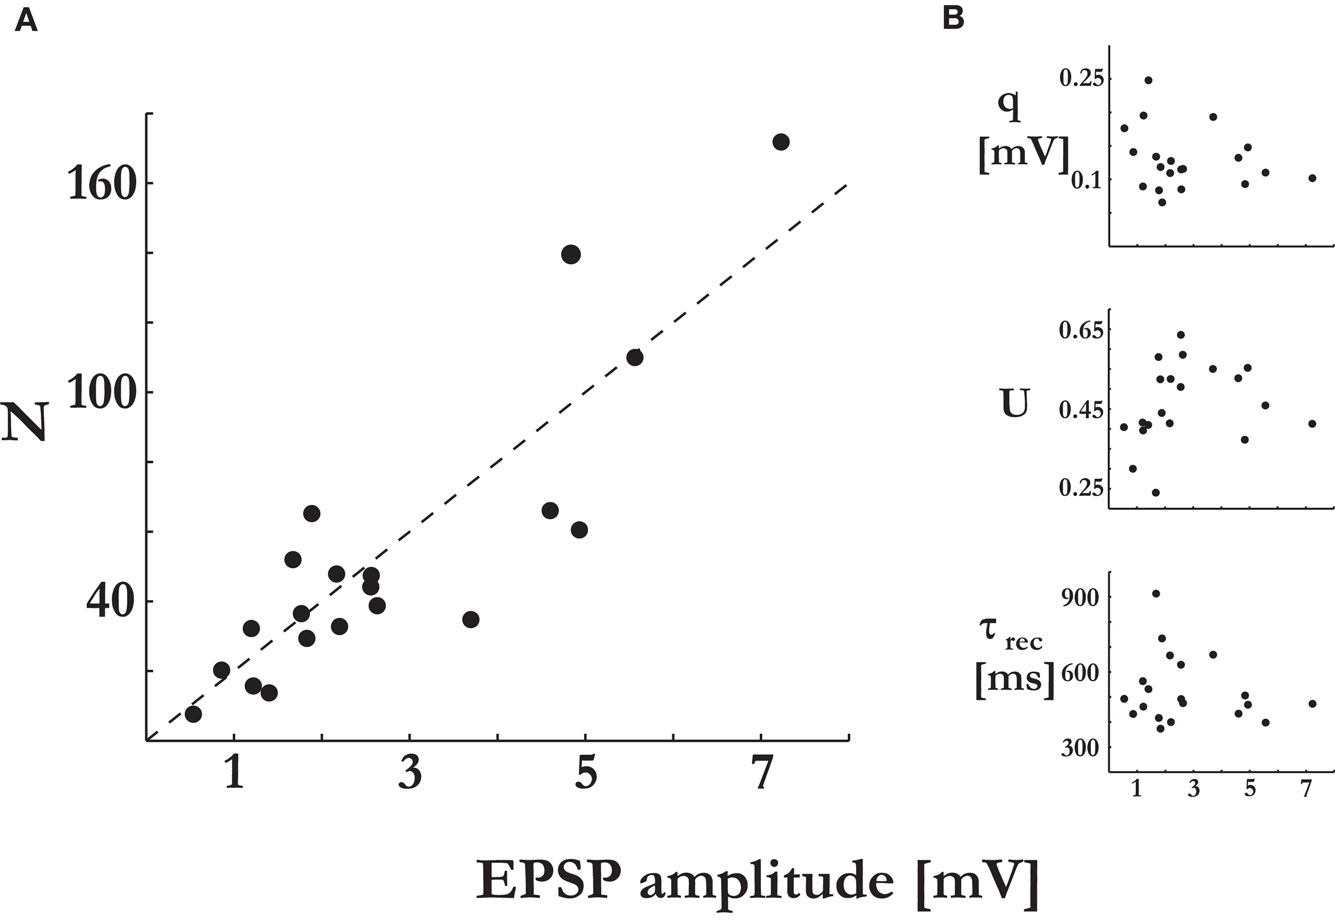
Figure 2. Synaptic efficacy is correlated with the number of release sites, but not with the probability of release or quantal size. The synaptic parameters were plotted vs. the EPSP amplitude of the connections’ response to the first stimulus of the input spike train. (A) The number of release sites, N, was significantly correlated to the EPSP amplitude (t-test, p < 0.00001). (B) The quantal size, q (t-test, p > 0.34), the probability of release, U (t-test, p > 0.38), and the recovery time constant, τrec (t-test, p > 0.4), were not correlated to the EPSP amplitude.
where  and Uμ = U·ρμ. The
  and ρμ represent the expected probability of finding a vesicle at a release site at the time of arrival of the μth pre-synaptic action potential (μ = 1..9), obtained from the solution of the following iterative equations derived from Eqs 6 and 1a, respectively:
and Uμ = U·ρμ. The and ρμ represent the expected probability of finding a vesicle at a release site at the time of arrival of the μth pre-synaptic action potential (μ = 1..9), obtained from the solution of the following iterative equations derived from Eqs 6 and 1a, respectively:
where Δμ = tμ+1−tμ is the time between pulses μ and μ + 1.
The second category of simulations of virtual synapses focused on evaluating the effects of additional sources of variability on the accuracy of the estimation of N. Specifically, in addition to the non-uniformity in pi and τrec,i, different average quantal contributions from each release site were considered, i.e. qi∈Guassian(λq,0.25·λq); the quantum released at each site varied at different instances of pre-synaptic activation, i.e.  the synaptic onset latency varied from spike to spike, i.e. tonset = tsp + Guassian(1,0.2 ms) (tsp being the timing of the pre-synaptic action potential along the stimulus spike train) (Markram et al., 1997
); and spontaneous voltage fluctuations, measured from layer-5 pyramidal cells in several slice experiments, were added to the simulated single traces. The addition of the spontaneous fluctuations, reflecting noise elements that originate from sources outside of the synaptic release process, follows the assumption that the two processes are independent. Importantly, the value of λq, the average quantal contribution of a vesicle, was matched to that found in the analysis of the experimental data. Hence the range of amplitudes of the EPSPs of the virtual synapses were similar to the range of EPSPs found in experiments (for the same values of N), preserving the ratio between the fluctuations that originate from the synaptic transmission process, and those that originate from the background spontaneous activity.
the synaptic onset latency varied from spike to spike, i.e. tonset = tsp + Guassian(1,0.2 ms) (tsp being the timing of the pre-synaptic action potential along the stimulus spike train) (Markram et al., 1997
); and spontaneous voltage fluctuations, measured from layer-5 pyramidal cells in several slice experiments, were added to the simulated single traces. The addition of the spontaneous fluctuations, reflecting noise elements that originate from sources outside of the synaptic release process, follows the assumption that the two processes are independent. Importantly, the value of λq, the average quantal contribution of a vesicle, was matched to that found in the analysis of the experimental data. Hence the range of amplitudes of the EPSPs of the virtual synapses were similar to the range of EPSPs found in experiments (for the same values of N), preserving the ratio between the fluctuations that originate from the synaptic transmission process, and those that originate from the background spontaneous activity.Direct Amplitude Measurement Using Voltage Deconvolution
To complement the Jackknife-Monte-Carlo (JMC) approach presented above, we used a recently developed voltage-deconvolution method that allows EPSP amplitudes to be measured directly from noisy, single-sweep traces (Richardson and Silberberg, 2008
). The method removes the membrane filtering of the intracellular voltage by de-filtering them at a time scale equal to the membrane filter constant, τmem. This is achieved by re-arranging Eq. 3 to yield:

and directly evaluating the right-hand side using the voltage trace, its derivative and τmem. Due to the derivative in Eq. 15 the deconvolved trace is noisier than the voltage, and it is therefore smoothed over a 10-ms window. However, the linearity of the deconvolution procedure and the smoothing means that the de-filtered amplitudes are proportional to those in the voltage trace. They can therefore be renormalized using the ratio of the mean of the first EPSP and its deconvolved analogue as a conversion factor for the entire set of single-sweep traces.
The resulting deconvolved trace resolves the EPSPs into well separated pulses, reminiscent of the current measured in voltage-clamp mode, from which the amplitudes can be measured even in cases of highly variable traces; see Figures 4
A–D. Voltage-clamp recordings would be preferable for electrotonically compact cells as they limit the effects of voltage-activated currents. Layer-5 pyramidal cells, however, are electrotonically extended cells and voltage-clamp recordings have been demonstrated to show significant distortions due to the poor space clamp (Williams and Mitchell, 2008
). These distortions are less severe in voltage-deconvolved current-clamp recordings – see Richardson and Silberberg (2008)
for a detailed comparison. In addition, for the layer-5 pyramidal cells examined here, the membrane response was similar to that of a passive, leaky membrane requiring only an exponential deconvolution, with the EPSP decay providing the deconvolution time constant.
Binomial fitting procedure using the deconvolved amplitudes
The statistics of the directly measured amplitudes can also be treated using the binomial mean-variance analysis. The mean and standard deviation of the amplitude of the μth pulse follows:


where Uμ = U·ρμ is the probability of a vesicle being released on the arrival of the μth pre-synaptic pulse (see Eq. 14). The effects of the background noise χ on the variance can be corrected for by including it in Eq. 17 where χ may be measured in a region away from the stimulated EPSPs. From a fit to the mean and the CV the quantities τrec, U, q and N can be extracted. Both results for the background uncorrected variance (for comparison with the JMC approach) and the background corrected variance are given, where the latter yields a marginally higher value of N.
Failure analysis using the deconvolved amplitudes
Information on the number of release sites may also be gleaned from the number of synaptic transmission failures. The probability of a failure is:

from which an estimate of N can be obtained. For the correct identification of failures, the effects of the background noise and spontaneous arrival of EPSPs must be carefully accounted for. Here we choose a highly conservative method that over-counts failures, and hence underestimates the value N and gives a lower bound Nlb. This lower bound is nevertheless potentially sufficient for demonstrating that the data are incompatible with the single-release hypothesis.
To over count release failures, the threshold below which a measured amplitude is considered a failure is set high. This yields a high false-positive rate (true EPSPs over counted as failures) and low false-negative rate (true failures counted as EPSPs). The background noise, measured in a part of the trace away from the evoked EPSPs, comprises a Gaussian component from intrinsic fluctuations with a positive tail coming from spontaneous EPSPs (see the inset to Figure 4
D). To ensure failures are over counted two thresholds are considered: (i) Any amplitude falling below the first threshold θ1 is considered a release failure. This first threshold is set at the point where the cumulative integral of the unity-normalized Gaussian component of the background noise is equal to 0.999. This results in a high false-positive rate and very low false-negative rate (a one in a thousand chance that a strong intrinsic fluctuation causes a true failure to be misidentified); (ii) A second threshold is also considered that addresses the arrival of the spontaneous EPSPs. A measured voltage amplitude above θ1 at the point of an expected EPSP (within 4 ms) could still be a true failure masked by the chance arrival of a spontaneous EPSP. The probability ps of a spontaneous EPSP of amplitude exceeding θ1 arriving near (±4 ms) of a triggered pulse can be calculated from the portions of the experimental traces separated from the evoked EPSPs. However, the spontaneous EPSPs are of small amplitude (see tail of the distribution in the inset to Figure 5
D) and any amplitude measured at the time of an evoked EPSP above some threshold is highly likely to have been a spontaneous one. This yields a second threshold θ2(>θ1) which is defined as where the cumulative distribution of the full background noise distribution (Gaussian plus tail) reaches 0.999. If an amplitude is measured between θ1 and θ2 then an amount ps is added to the failure count. To summarise, if an amplitude λ is measured then: if λ < θ1 it is considered a failure; if θ1 < λ < θ2 an amount ps is added to the failure count; and if λ > θ2 it is not considered a failure.
We began our analysis with computing the average response of a synaptic connection to a spike train that consists of eight action potentials at a frequency of 20 Hz, followed by a recovery-test action potential 550 ms later (Figure 1
A). Subsequently, we fitted the average response with the deterministic model of synaptic depression (Abbott et al., 1997
; Tsodyks and Markram, 1997
). The model assumes that each synaptic connection is characterized by a finite amount of resources that define the maximum synaptic efficacy (the parameter A). When a pre-synaptic spike arrives, a fraction (U) of the resources is utilized. The utilized resources subsequently recover exponentially with a characteristic time (τrec). From the fit of the model to the average response these parameters (A,U and τrec) can be estimated for each synaptic connection (see Materials and Methods, Figure 1
A). All estimated parameter values were comparable to those reported previously for this type of connection (mean ± std, A = 6.06 ± 4.1 mV, U = 0.46 ± 0.1, τrec = 525 ± 134 ms, n = 20) (Markram et al., 1997
; Tsodyks and Markram, 1997
; Richardson et al., 2005
; Le Be and Markram, 2006
).
In order to estimate the number of release sites for a given synaptic connection, we computed the CV of its nine responses to the repeated presentations of the stimulus train. Here, the CV values were calculated using the Jackknife method (Efron and Tibshirani, 1998
), i.e. from a set of averages that each excludes a different single trace (see Materials and Methods). The advantage of this approach is that it allows for an accurate measurement of the EPSP amplitudes from smooth average-like traces, and not from single noisy traces. A deconvolution method is also applied later on, in which the EPSPs are transformed into well separated pulses (Richardson and Silberberg, 2008
). This will allow for a second, complimentary estimation of the CV, as well as the extraction of the synaptic failure rate. The CV values of the responses to the first action potential in the train, ranging between 0.054 and 0.5, were similar to those reported previously for comparable mean response amplitudes (Markram et al., 1997
).
A connection’s set of nine CVs was compared with a set obtained from Monte-Carlo simulations of the extended quantal model of synaptic release, characterized by N, the number of release sites, p, the probability of release, q, the quantal size of a vesicle, and τrec, the time constant governing the refilling process of an empty release site (see Materials and Methods). The probability of release and recovery time constant were those obtained from the fit of the connection’s average post-synaptic response to the train of inputs, as the average response of the stochastic model can be described by the deterministic model of synaptic depression with p = U (see Materials and Methods). The exact value of the quantal size, when assumed to be equal for all vesicles, has no impact on the following analysis (the validity of this assumption is examined below). Thus, the number of release sites remains the only unknown. A series of simulations were run with a range of values for N, and the estimated value of N for that series was from the simulation with the CV values most similar to the experimental CVs (Figure 1
B). We repeated this estimation step many times (100 repetitions), which resulted in a distribution of values for N (Figure 1
C). The mean of the distribution was the value of N we assigned to the specific synaptic connection, while the spread of the distribution provided the confidence interval. In nine of the synaptic connections two sets of single traces were recorded with a 10-min interval, and the values of N found for both sets were very close, with a ratio of 0.94 ± 0.1 (mean ± std; e.g. Figure 1
C).
The number of release sites we found in 20 recorded connections was 53.3 ± 42 (mean ± std), with a range of 7–170. The number of release sites was linearly related to the EPSP amplitudes, with higher estimated number of release sites for stronger response amplitudes (Figure 2
A). It was similarly correlated with the maximum synaptic efficacies, the parameter A of the deterministic model of synaptic depression. From the relation A = N·q (see Materials and Methods), we could compute the average quantal size of a single vesicle for a synaptic connection. The quantal size was not correlated with the EPSP amplitudes (Figure 2
B). The average quantal size for the recorded connections was 0.13 ± 0.04 mV(mean ± std), which is similar to that found in synaptic connections between layer-4 spiny stellate neurons and layer-2/3 pyramidal neurons in the same brain area (0.15 mV) (Silver et al., 2003
). The release probability and recovery time constant were not significantly correlated with the EPSP amplitudes as well (Figure 2
B). Hence, we conclude that the number of release sites N is the primary factor that accounts for the observed range of synaptic efficacies between layer-5 pyramidal neurons.
Effects of Release-Parameter Non-Uniformity on the Estimation of the Number of Release Sites
In our estimation process, we assume that the probability of release and the recovery time constants are uniform across release sites. However, this assumption is most probably not true for the synaptic connections in the nervous system, and it is therefore important to examine its effect on the estimation of the number of release sites.
To this end, we ran simulations of virtual synaptic connections in which the release parameters were non-uniform, i.e. a connection had a certain number of release sites, N (ranged between 10 and 80), with the values of the pi and τrec,i (i = 1…N) distributed with the corresponding Gaussian distributions (see Materials and Methods). The synaptic connection was then presented with the stimulation protocol we used in the experiments. The average of the simulated single traces was subsequently used as an input to the first step of the estimation process, which yielded the fitted set of parameters, U and τrec. We could then compare the CVs of the responses of the non-uniform connection (Eq. 11), to the CVs of the responses of the corresponding ‘uniform synaptic connection’, where the release parameters for all N release sites were U and τrec (Eq. 12). The CVs were computed analytically from the extended binomial model. As observed in Figure 3
A, the two sets of CVs were very similar for all values of N considered. Indeed, when we compared, for a given virtual connection, Eq. 12 to Eq. 11 using different values of the number of release sites (while keeping the fitted values of U and τrec unchanged), we found that for most synaptic connections, the estimated N that resulted from the best fit was equal to the chosen N (Figure 3
B). This result was repeated for other distributions from which pi and τrec,i were drawn, i.e. uniform (Figure 3
B), binomial and gamma distributions (data not shown). We thus concluded that the uniformity assumption has only a minor effect on our estimation of the number of release sites.
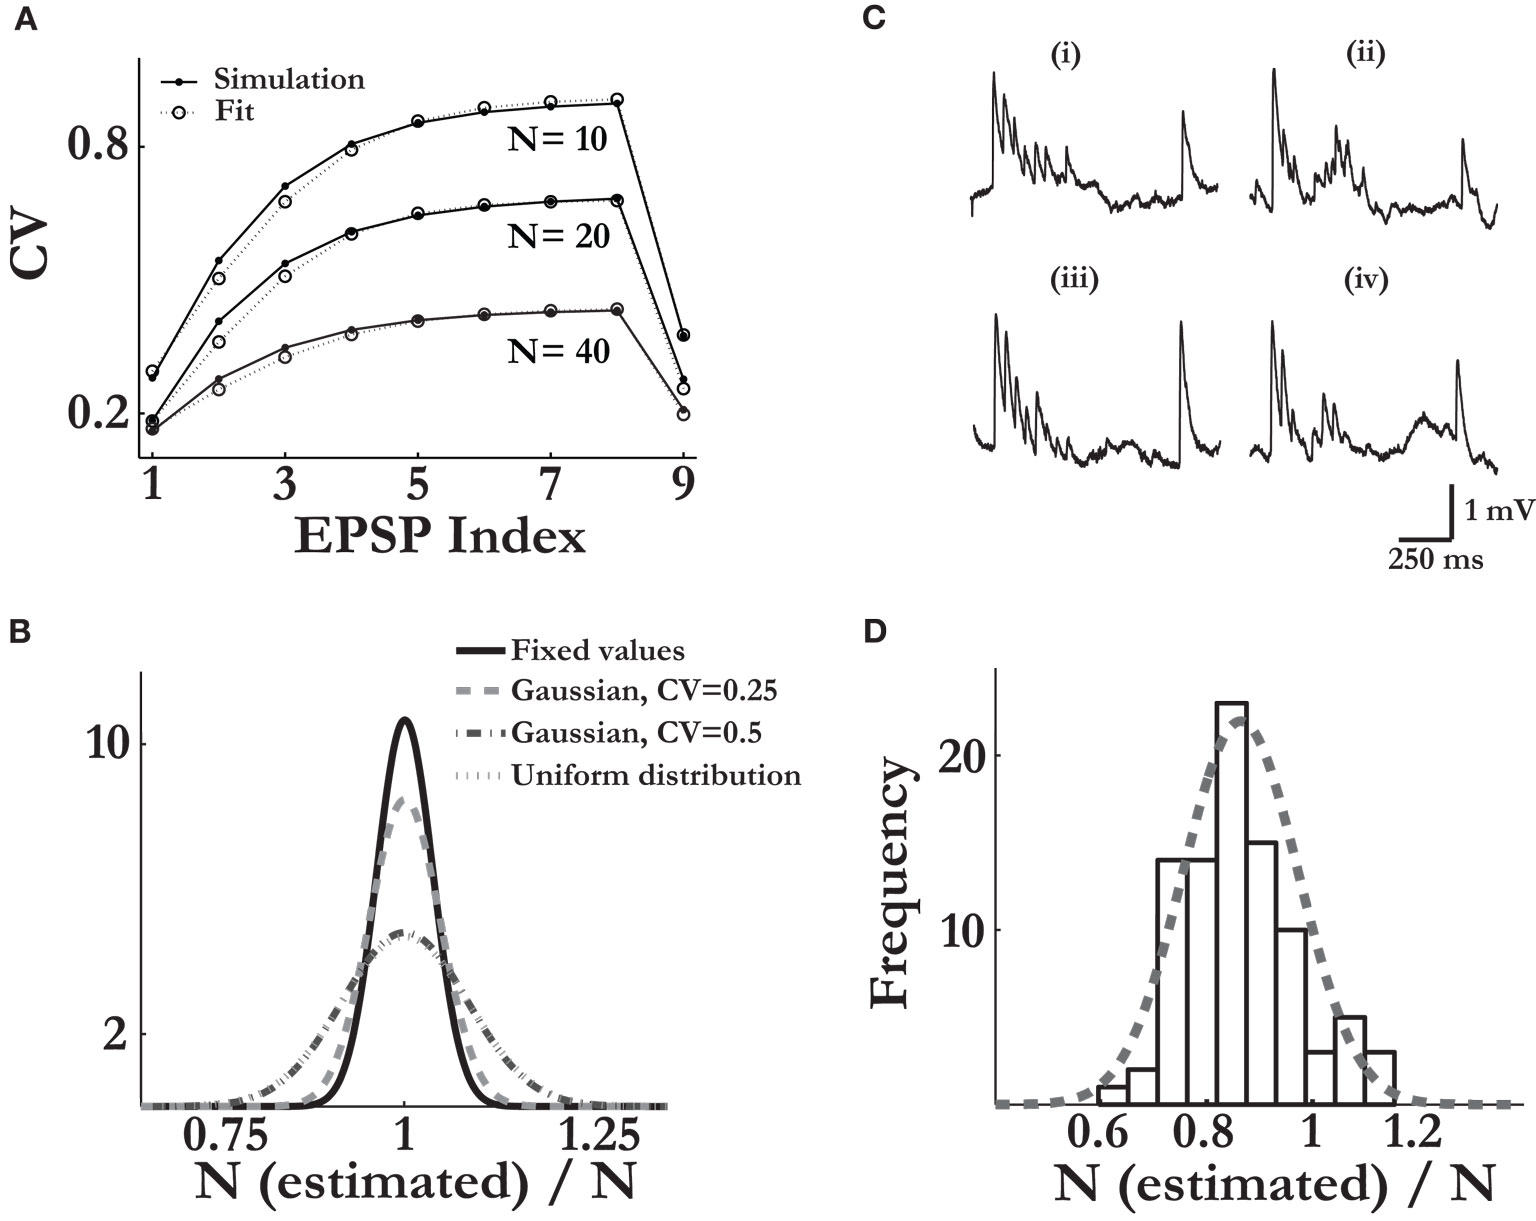
Figure 3. The estimation method is robust for various types of noise elements. Verifying the validity of the release-parameters uniformity assumption: (A) The analytically calculated CV values of the nine responses of three different virtual synapses, each with a different number of release sites (marked in figure) and with non-uniform sets of the release parameters (pi and τrec,i, i = 1…N; solid lines, Eq. 12); and the computed CV values of the corresponding three uniform synapses, in which the release parameters, U and τrec, were equal for all N release sites (dashed lines, Eq. 13). x-axis labelling represents the nine synaptic responses along the spike train. As in Figure 1
B, the CV of the ninth EPSP is similar to that of the first EPSP, reflecting the recovery of the synaptic responses from depression (e.g. Figure 1
A). The pi and τrec,i were drawn from a Gaussian distribution with the standard deviation half the value of the mean. (B) 500 virtual synapses were simulated for each of the distributions of the release parameters considered. With the calculated uniform release parameters for each synapse, U and τrec, Eq. 12 was fitted to Eq. 11 to produce an estimated value of N. The distributions of the ratio of the estimated value and the true value of N are shown for the cases in which pi and τrec,i were fixed for all release sites; were drawn from a narrow Gaussian distribution (standard deviation was 0.25 of the mean); a wide Gaussian distribution (standard deviation was 0.5 of the mean); and from a uniform distribution [with boundaries of (0.05 0.95) for pi, and 50 ms 1200 ms for τrec,i]. Simulations of realistic synaptic connections: (C) Examples of simulated single traces, in which various sources of synaptic variability were considered and background slice activity was added, (iii) and (iv) (see Materials and Methods); compared to single traces recorded in experiment, (i) and (ii). The values of the synaptic parameters in the simulated traces were similar to the values estimated for the measured synaptic connection. (D) Estimating the number of release sites from the simulations of the noisy synaptic connections reveals a slight bias toward lower values than the true number of release sites considered. The broken-line curve represents the best Gaussian fit with 0.88 ± 0.1 (mean ± std). In the simulations, the values of N were either 10, 20, 30, 40 or 80, and the release parameters were drawn from the wide Gaussian distribution (see B, Materials and Methods).
Effects of Noise on the Estimation of the Number of Release Sites
In addition to the non-uniformity of the parameters that determine the release process, there are various other sources of variability that exist in synaptic connections or that originate from the measurement itself, which potentially may affect the observed responses and thus the estimation outcome (Saviane and Silver, 2006
). In order to evaluate the effects of such noise sources on our method of estimation of the number of release sites, we conducted an extensive set of simulations that considered the following (see Materials and Methods): non-uniformity of the parameters of release, different quantal contributions between release sites and within a site at different occasions of pre-synaptic activations, fluctuations in synaptic onset latencies, and experimentally measured background activity from slices, which was added to the simulated traces. The mean quantal size followed our estimations from the experimental data, resulting in simulated EPSP amplitudes similar to those found in experiments for similar values of N. Hence, the signal to noise ratio between the stimulated synaptic responses and the background activity was preserved. The resulting simulated single traces were very similar to single traces measured in experiments, as can be observed in Figure 3
C. We found that under these conditions, the estimated number of release sites is 0.88·N ± 0.1·N, which suggests that the values found for the number of release sites by fitting the experimental data underestimate the actual number by about 10% (Figure 3
D).
Direct Amplitude Measurement Using Voltage Deconvolution: Estimates of the Number of Release Sites and its Lower Bound
The second method we used for measuring the amplitudes of EPSPs implemented a voltage deconvolution procedure (Richardson and Silberberg, 2008
). The deconvolution method de-filters voltage traces to transform EPSPs into well separated pulses from which the amplitude may be readily measured (see Materials and Methods). First, we present the results for the mean-variance analysis using this approach and compare them with the distinct JMC approach presented above. The deconvolution method is then used to provide an analysis of the failure rate, which results in the independent lower bound estimate on the number of release sites N.
Mean-variance analysis from voltage deconvolution
The deconvolution procedure is shown in Figures 4
A,B for the mean voltage trace for one of the connections analysed. Despite the very different approach, the deconvolution method is in close agreement with the JMC approach for the parameters extracted from the mean amplitudes: the results for the release probability U and depression time constant τrec are given in the inset to Figure 4
B for all connections. Individual traces may also be deconvolved and their amplitudes measured (Figures 4
C,D). This allow for the variance of the synaptic response to be calculated yielding the CV and an estimate for N (Figure 4
E; Eqs 16 and 17). The deconvolution procedure was applicable to a majority subset of the connections (18 out of the 20) and yielded a population mean of N = 53.8 which is close to the JMC approach (N = 55.8) for the same set of 18 traces. This very close agreement between the two different methods of amplitude measurement is further illustrated in Figure 4
G. The CV analysis may also be performed with the background noise corrected for (see Materials and Methods) and yields the marginally higher result of N = 62.1 vesicles for the population mean. This is in agreement with the results derived in the previous section on the effects of noise (Figure 3
D), where correctly accounting for background fluctuations increases the estimate of N by about 10%.
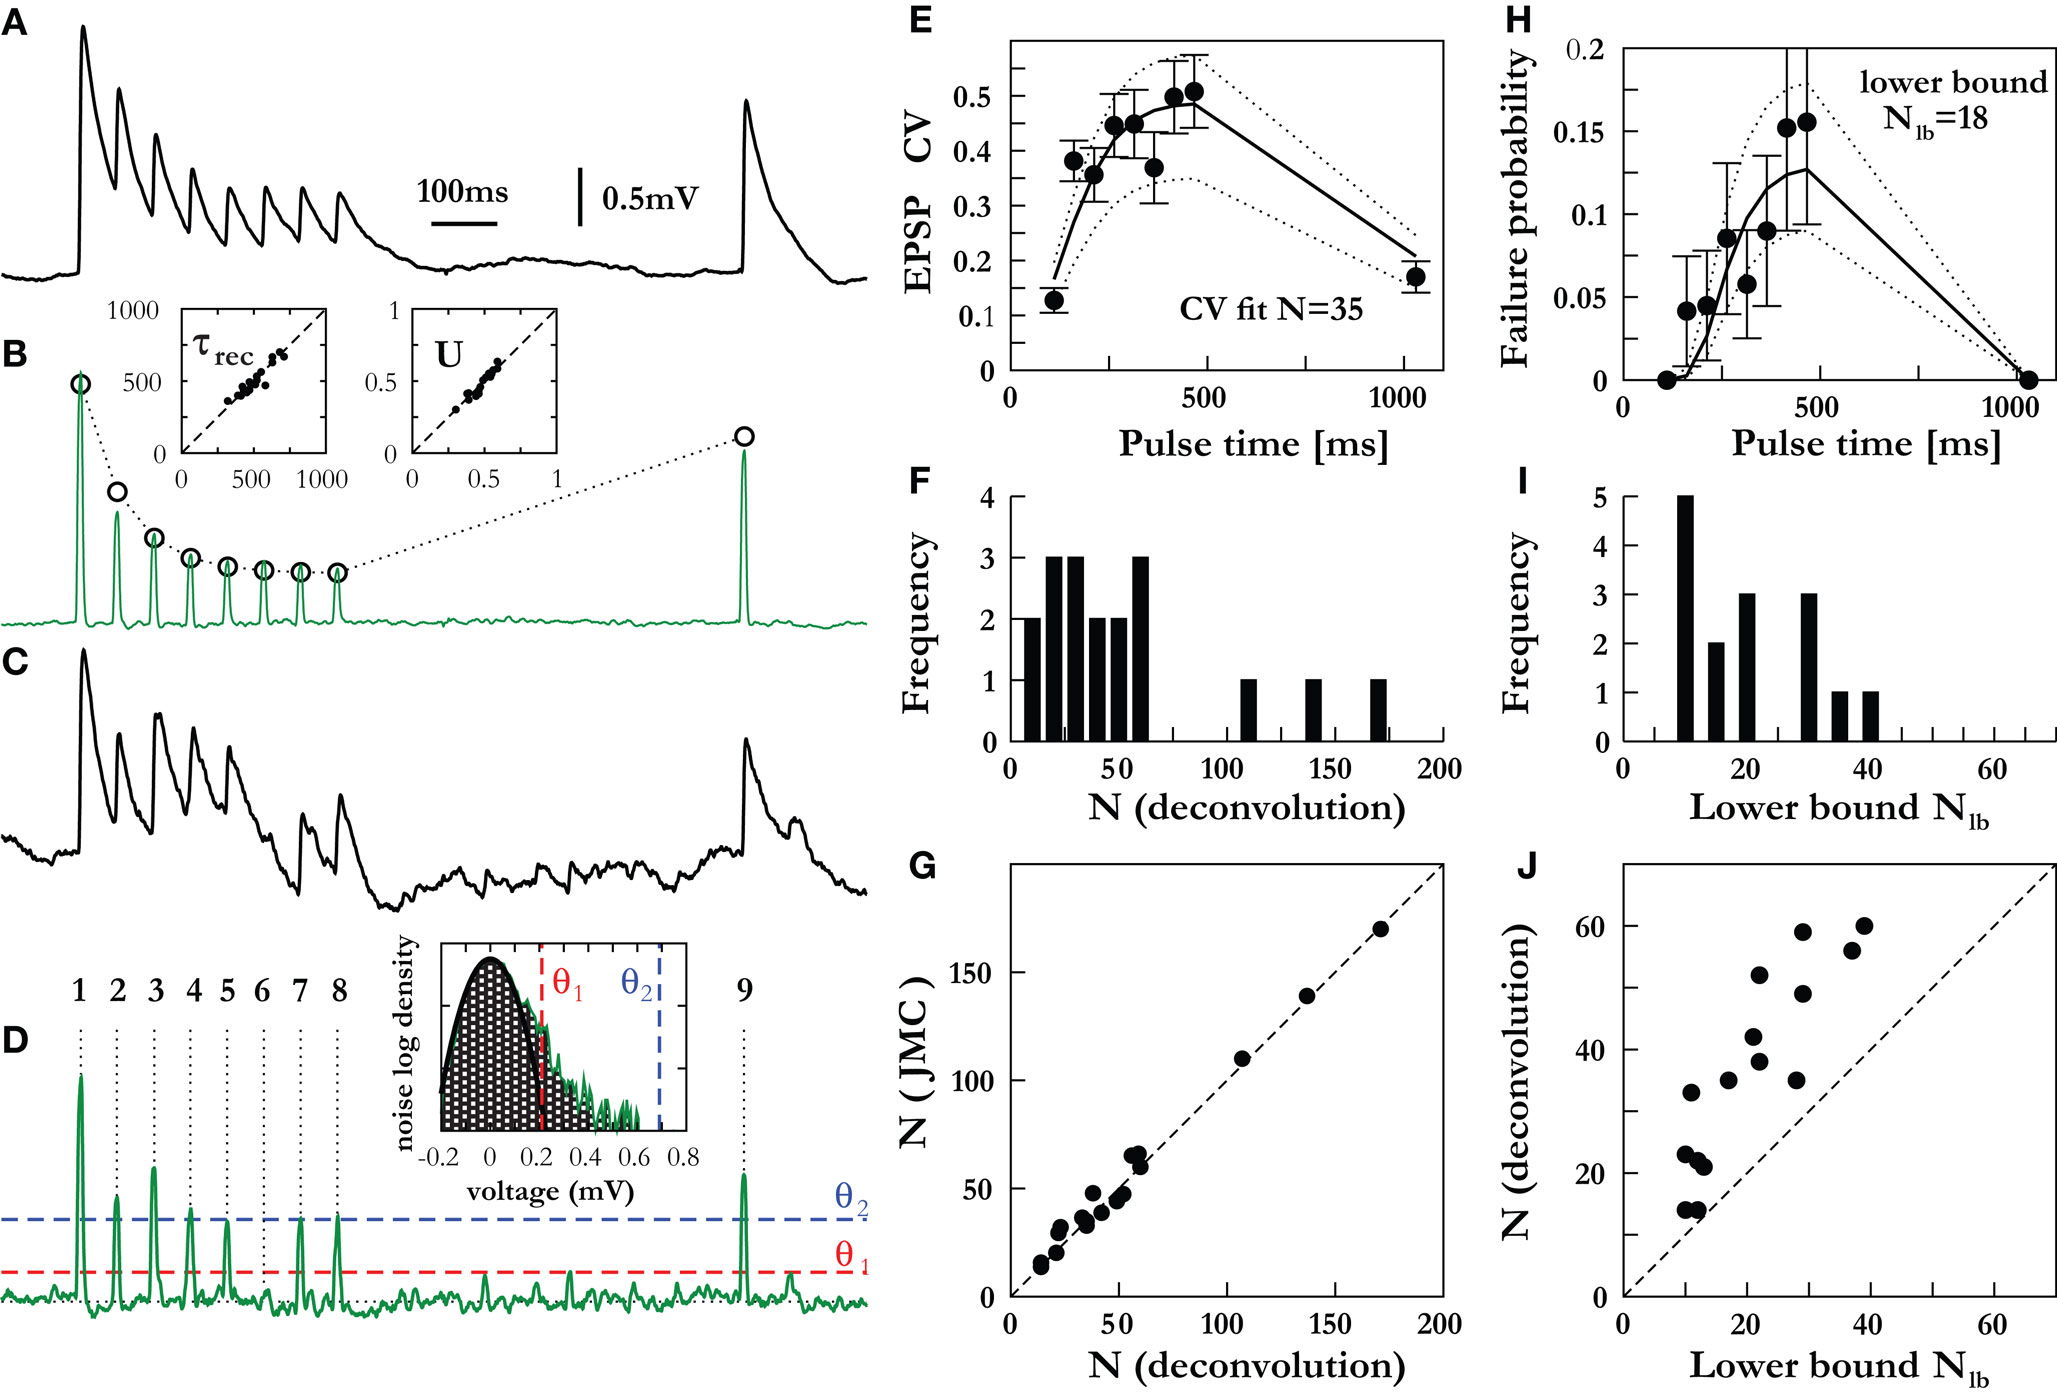
Figure 4. Direct amplitude measurement using voltage deconvolution. Mean-variance estimation for N and its lower bound from failure analysis. (A) The average voltage trace for an example connection, (B) and its corresponding deconvolved trace (membrane filter constant τmem = 42 ms). The fit (dotted line) to the deterministic synaptic depression model (Eq. 18) yields τrec = 390 ms, U = 0.51 and A = q·N = 4.1 mV. Insets compare the fit parameters τrec and U (deconvolution method x-axis, JMC method y-axis) showing excellent agreement between the distinct approaches to amplitude measurement. (C) An example of one of the experimental single traces of the connection in (A), (D) and its deconvolution. The inset shows the distribution of background noise (required for the failure analysis – see Materials and Methods) measured between pulse 8 and 9 during all single traces. The distribution is part Gaussian (fit, black line) with a tail at higher voltages due to spontaneous EPSPs. An amplitude below θ1 = 0.22 mV (red dashed line) is considered a failure, an amplitude between θ1 and θ2 = 0.69 mV (blue dashed line) adds an amount ps to the failure count, and amplitudes above θ2 are not considered a failure (see Materials and Methods for further details). (E) Estimation of N via a fit to the CV (bold lines) for this connection with the CVs for N ± 10 (dotted lines) shown for comparison, (F) and the histogram of N for all connections, with the average equal to 53.8. (G) Comparison with the JMC approach, showing close agreement between the different methods of mean-variance measurement. (H) Fit to the failure probability for the connection in (A–E), giving a conservative lower bound Nlb = 18. The failure probabilities for Nlb ± 3 (dotted lines) are shown for comparison. (I) Distribution of lower bounds for all connections analyzed with the failure analysis, with the average Nlb value of 20.8 (J) and their comparison to estimated number of release sites from the CV analysis.
Failure analysis and a lower bound on N from voltage deconvolution
Finally, we calculated a lower bound on the number of release sites through the analysis of the release failures. This approach requires fewer model-based assumptions, as only the all-or-none occurrence of a response is essential, but not the response amplitude. To provide the lower bound on N, we used a method that results in a high false-positive rate and low false-negative rate for detecting release failures, and so the number of failures is overestimated substantially. This was achieved by carefully setting the thresholds for failures θ1 and masking of failures by spontaneous EPSPs θ2 – see inset to Figure 4
D and Materials and Methods for further details. The overall failure probability is thus computed from the single traces of a given synaptic connection, and it is fitted to the failure probability (Eq. 18) derived from the binomial model (Figure 4
H). This provides a conservative lower bound of the number of release sites with the results for 15 of the 18 connections provided in Figure 4
I and compared to the estimation of N in Figure 4
J. The population mean for the conservative lower-bound over these 15 connections was Nlb = 20.8. We note that three of the connections (those with N > 100 in Figures 4
F,G) were not amenable to failure analysis because not a single failure could be seen across the entire set of >40 sweeps each comprising nine EPSPs (i.e. no failures in ∼400 EPSPs for each of these connections).
We presented the analysis of synaptic transmission between neocortical layer-5 pyramidal neurons. The method we developed for the analysis is based on the extension of the quantal model of synaptic release that accounts for the dynamics of short-term synaptic depression (Thomson and Deuchars, 1994
; Fuhrmann et al., 2002
). Our approach allows for the estimations of the number of release sites, the probability of release and the quantal contribution of a vesicle by utilizing the dynamics of the synaptic response to a series of inputs. The extended model of synaptic release successfully captures the relation between the CV of the synaptic responses and their amplitudes over the whole range of amplitudes we recorded (2 orders of magnitude). In particular, the model captures the CV-Amplitude relation of each of the synaptic responses along the spike train (Figure 5
). This supports the model’s main assumption that the synaptic depression observed at layer-5 synapses results from the decrease in the effective probability of release due to depletion of available vesicles, as suggested by experimental observations (Thomson et al., 1993
; Debanne et al., 1996
; Varela et al., 1997
; Silver et al., 1998
; Zucker and Regehr, 2002
).
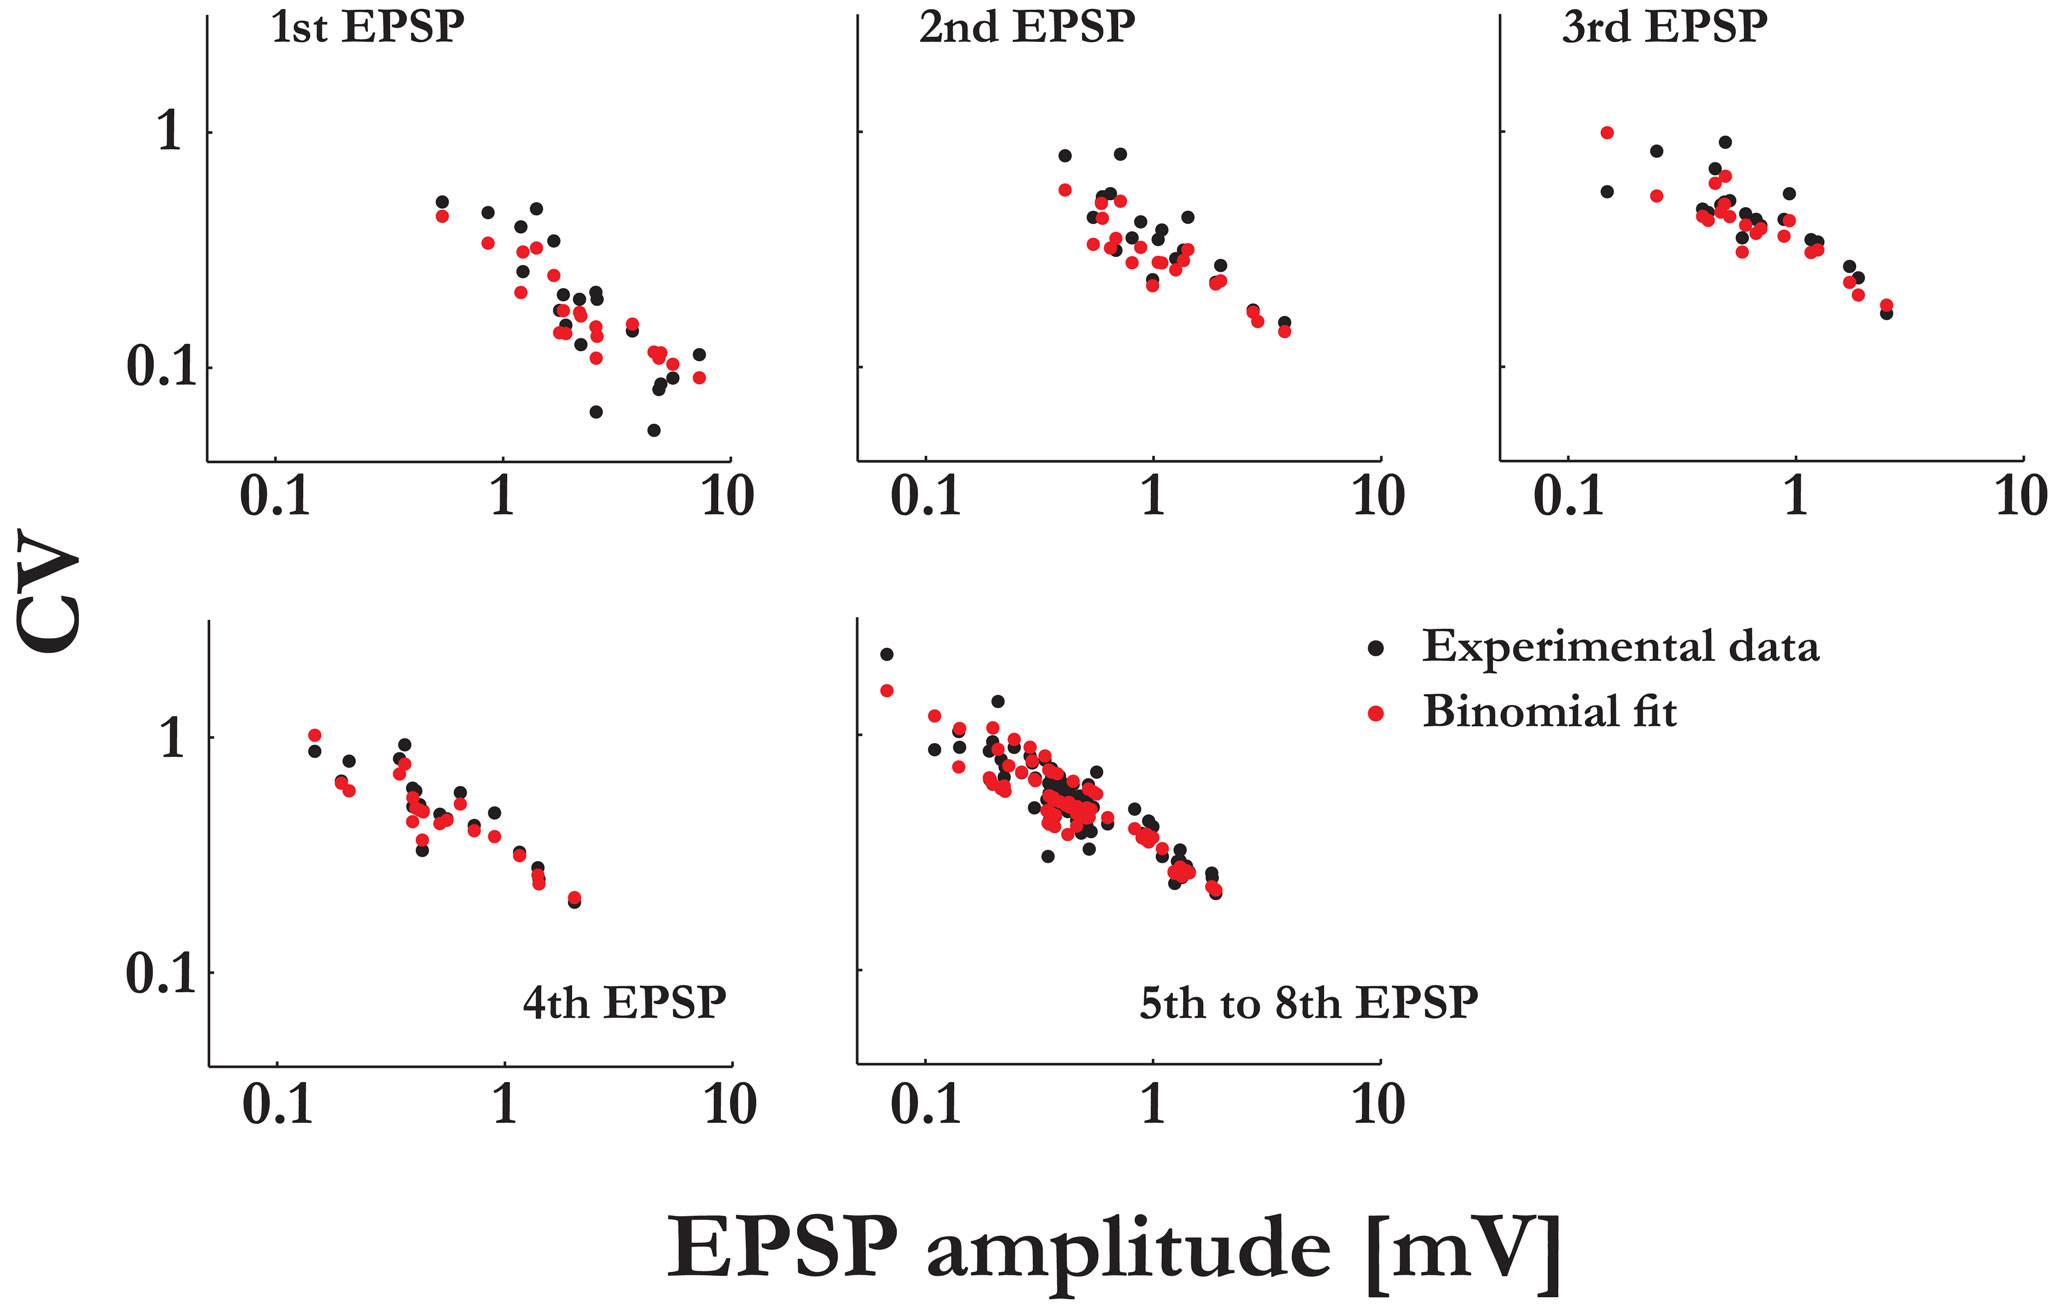
Figure 5. The extended binomial model captures the relation between the CVs and the EPSP amplitudes over the whole range of amplitudinal response. The CVs of the synaptic responses from the 20 connections were plotted vs. their mean EPSP amplitudes (on a log-log scale, black dots), grouped by the stimulus’ index along the pre-synaptic spike train. In red are the corresponding CVs as predicted by the extended binomial model:  where M is the EPSP amplitude as measured in experiments, q is the computed quantal size and Uμ = U·ρμ is the effective probability of release for the μth response (with ρ1 = 1, see Eq. 14).
where M is the EPSP amplitude as measured in experiments, q is the computed quantal size and Uμ = U·ρμ is the effective probability of release for the μth response (with ρ1 = 1, see Eq. 14).Our main finding is that the observed systematic decrease in response variability, as the synaptic efficacy increases (Figure 5
), is best explained by attributing increasing numbers of release sites to the stronger synaptic connections. In particular, we found that the number of release sites can be much larger than the number of synaptic contacts reported for the type of synaptic connections we studied (Markram et al., 1997
; Kalisman et al., 2005
; Le Be and Markram, 2006
). The probability of release and the quantal size varied between synaptic connections, but their values were not correlated with the synaptic efficacy.
Our findings thus suggest that synaptic transmission from a single contact can involve the simultaneous release of several vesicles. Indeed, there could be more than one docked vesicle at active zones of cortical synaptic contacts (Schikorski and Stevens, 1997
, 1999
; Rollenhagen and Lubke, 2006
). In particular, excitatory synaptic contacts found on the basal dendrites of layer-5 pyramidal neurons could have more than one active zone (between 1–5), and the number of docked vesicles at each active zone ranges between 2 and 6. Hence for a given synaptic contact the number of docked vesicles is between 2 and 30 (Rollenhagen and Lubke, 2006
). Although the pre-synaptic origin of these contacts was not identified, a large portion of them is known to originate from neighbouring layer-5 pyramidal neurons (Markram et al., 1997
). Considering that stronger synaptic connections between layer-5 pyramidal neurons have more synaptic contacts than weaker ones (in the range of 4–8; Markram et al., 1997
; Le Be and Markram, 2006
), and that their synaptic contacts could have more than one active zone, our estimated number of release sites (between 7–170) would then match the size of the readily releasable vesicle pool at these synapses. We are thus tempted to speculate that the anatomical correlate of the release sites in our analysis is the identified pre-synaptic docked vesicles, and not, as previously suggested, the synaptic contacts or active zones. In that sense, we return to the original interpretation of the question ‘what constitutes a release site?’ (del Castillo and Katz, 1954
; Stevens, 2003
).
Our findings differ from previous studies at hippocampal synapses, in which multiquantal release was correlated to the release probability (Oertner et al., 2002
; Biró et al., 2006
; Christie and Jahr, 2006
). Our findings also differ from previous studies of excitatory cortical synapses, which show equivalence between the estimated number of release sites and the observed number of synaptic contacts. The difference may be due to the different cortical location (neocortex vs. hippocampus; Gulyas et al., 1993
; Biró et al., 2005
), type of post-synaptic neuron (pyramidal vs. interneuron; Gulyas et al., 1993
; Biró et al., 2005
), different neocortical layer (layer-5 vs. synaptic connections from layer-4 to layer 2/3; Silver et al., 2003
), and strength of the synaptic connections (Gulyas et al., 1993
; Silver et al., 2003
).
The average contribution of a single quantum, as measured in the cell soma, was similar to that found for synaptic connections between layer-4 to layer 2/3 (Silver et al., 2003
). This may indicate that at neocortical synaptic connections between pyramidal neurons, the range of the average quantal size is relatively small. Subsequently, according to the quantal model, differences in synaptic efficacy could originate either from changes in release probability or the number of release sites, or a combination of both. For example, in our study the average estimated number of release sites is higher than at the synapses in layer-2/3 (Silver et al., 2003
), and the average probability of release is lower (∼0.45 vs. ∼0.8). The two potential mechanisms for modulation of synaptic efficacy have different functional implications. Modulating the synaptic efficacy via the release probability has a limited range, as it is constrained by the number of available vesicles. In addition, changes to the release probability affect the dynamics of the synaptic response (Tsodyks and Markram, 1997
). Modulating synaptic efficacy via the number of release sites, on the other hand, has a potentially wider range, and it preserves the temporal response structure (Le Be and Markram, 2006
). A higher number of release sites also increases the reliability of synaptic transmission to all of the components of a stimulus spike train. In Figure 6
we show the synaptic responses for one of the stronger connections we recorded (with an estimated N of a 110), and compare it with the synaptic responses for a much weaker connection (N = 15). It can be seen that individual PSP’s of the stronger connection are strikingly similar, as opposed to the highly variable response of the weaker connection. The observed decrease in synaptic response variability, as the synaptic efficacy increases, is not unique to layer-5 and is observed at cortical synaptic connections across layers (Feldmeyer et al., 1999
, 2002
, 2006
; Lefort et al., 2009
). Hence, we suggest that multiquantalrelease might be a general mechanism for underlying the distributions of synaptic efficacies in the cortex. It is the challenge for future experimental and theoretical studies to try and understand the functional implications of such differences in synaptic transmission reliability on the neural code. That we found strong correlation between the synaptic efficacy and the estimated number of release sites, but not between the synaptic efficacy and the release probability, suggests that the two alternatives for modifying synaptic efficacy are generated by different learning rules.
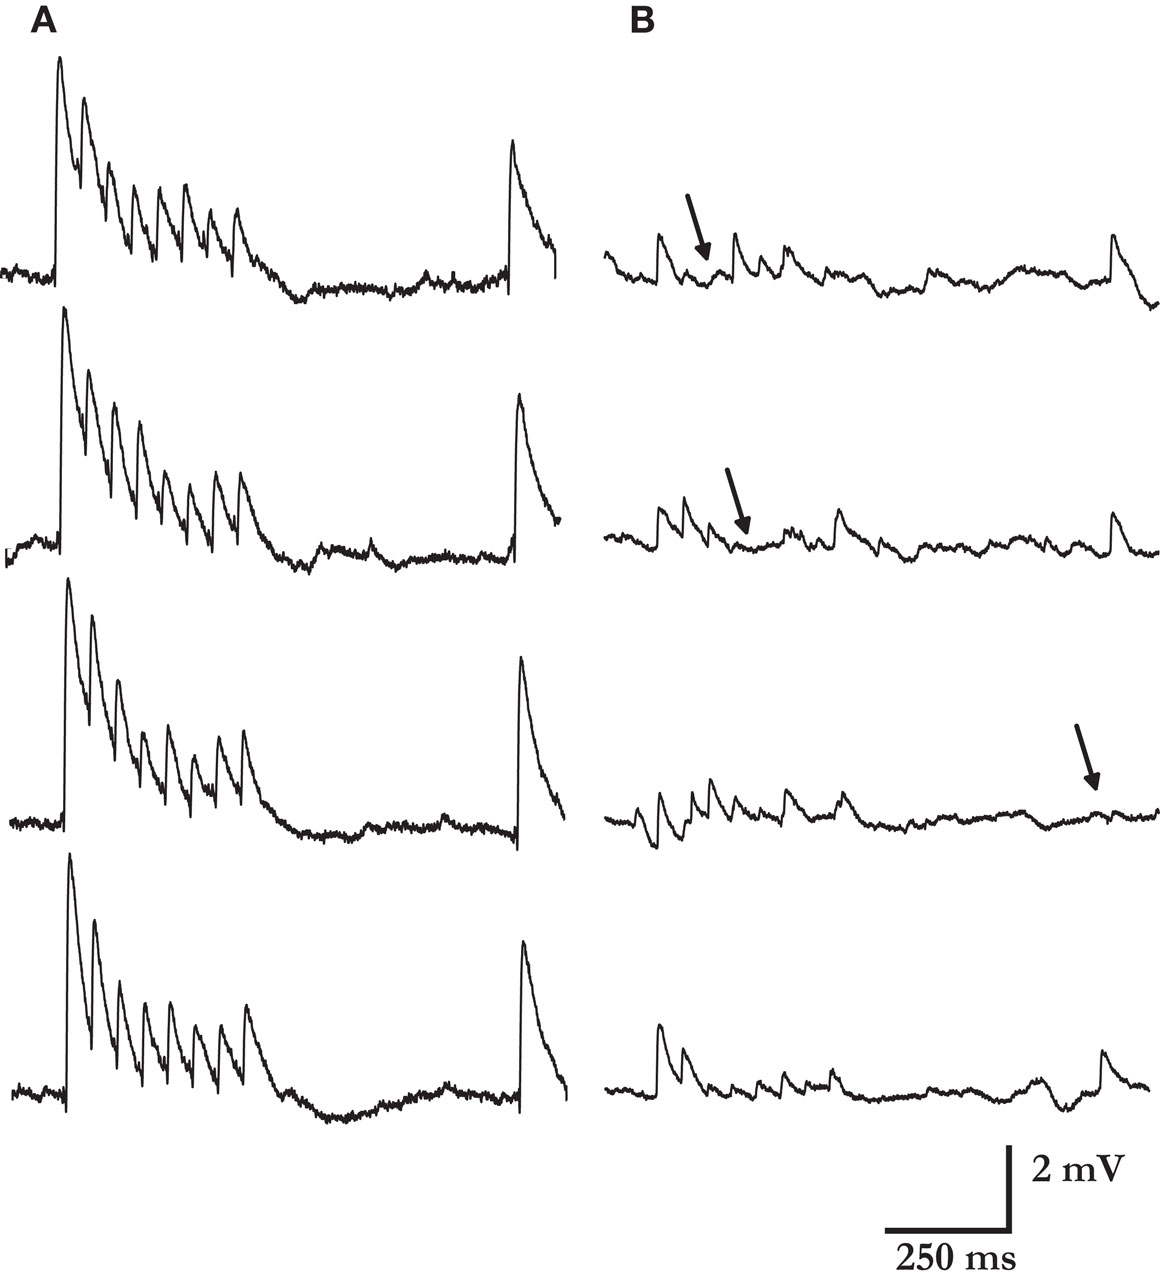
Figure 6. Reliability of synaptic connections increases with their response amplitude. Four typical single traces from one of the strongest and highly reliable synaptic connection measured (A), and one of the weakest and noisiest connection recorded (B). The estimated numbers of release sites were 110 and 15, respectively. Arrows mark few of the response failures for the weaker connection. No failures were observed in any of the single traces recorded for the connection in A (>400 PSP’s). Other synaptic parameters were similar: release probability 0.46 vs. 0.39; recovery time constant 398 ms vs. 461 ms; and quantal size 0.12 mV vs. 0.19 mV.
Our findings may suggest that increasing the efficacy of a synaptic connection involves the addition of release sites at already existing synaptic contacts, without necessarily adding new contacts. This rationale follows from the simple observation that the range of the number of synaptic contacts (4–8) is much lower than the range of EPSP amplitudes (0.1–10 mV) and estimated number of release sites (7–170). Such a mechanism may also be advantageous from an energetic point of view, as it does not require the formation of new synaptic contacts but can rely upon the infrastructure of the existing synapses. Indeed, cortical synaptic connections exhibit a wide range of active zones and post-synaptic density sizes, which are highly correlated, i.e. larger active zones face larger post-synaptic densities; and the larger the active zone, the more docked vesicles it has (Schikorski and Stevens, 1997
, 1999
). Hence when several vesicles are released simultaneously from a given pre-synaptic terminal, they have a larger pool of postsynaptic receptors ready to accept them, thus preventing receptor saturation. This could be the justification for the linear summation of multiquantal release that we assume in the model, and would explain the similarity in the quantal size that we found across the wide range of synaptic efficacies. The mechanism of modulating synaptic efficacy by the addition/subtraction of release sites at existing synaptic contacts enables the preservation of the exact dendritic location of synapses, which has a strong effect on the computation performed by the dendrites (Segev and London, 2000
; Gulledge et al., 2005
; London and Hausser, 2005
).
We are planning to expend the method presented here so it will include the effects of short-term synaptic facilitation as well. This will allow us to estimate the quantal parameters for more types of synaptic connections, e.g. between pyramidal to inhibitory neurons at the somato-sensory area (Markram et al., 1998
), and between pairs of pyramidal neurons located at the pre-frontal cortex (Wang et al., 2006
). We could then compare the underlying bio-physical attributes of different types of synaptic connections at the same brain region, and of synaptic connections between anatomically similar neurons at different cortical locations.
The authors declare that the research was conducted in the absence of any commercial or financial relationships that could be construed as a potential conflict of interest.
The authors wish to thank Barak Blumenfeld, Son Preminger, Omri Barak and Leor Gruendlinger for fruitful discussions and careful reading of the manuscript. Gilad Silberberg is supported by a long-term fellowship by the Human Frontiers Science Program Organization. Magnus J. E. Richardson holds a Research Councils United Kingdom Academic Fellowship. Misha Tsodyks is partially supported by Abe & Kathryn Selsky Foundation.