 Juan G. Diaz Ochoa1* Joachim Bucher1 Alexandre R. R. Péry2 José M. Zaldivar Comenges1,3† Jens Niklas1 Klaus Mauch1
- 1Insilico Biotechnology AG, Stuttgart, Germany
- 2Unité Modèles pour l’Écotoxicologie et la Toxicologie, INERIS, Verneuil-en-Halatte, France
- 3ECVAM, Institute for Health and Consumer Protection, European Commission Joint Research Centre, Ispra, Italy
In this study, we focus on a novel multi-scale modeling approach for spatiotemporal prediction of the distribution of substances and resulting hepatotoxicity by combining cellular models, a 2D liver model, and whole body model. As a case study, we focused on predicting human hepatotoxicity upon treatment with acetaminophen based on in vitro toxicity data and potential inter-individual variability in gene expression and enzyme activities. By aggregating mechanistic, genome-based in silico cells to a novel 2D liver model and eventually to a whole body model, we predicted pharmacokinetic properties, metabolism, and the onset of hepatotoxicity in an in silico patient. Depending on the concentration of acetaminophen in the liver and the accumulation of toxic metabolites, cell integrity in the liver as a function of space and time as well as changes in the elimination rate of substances were estimated. We show that the variations in elimination rates also influence the distribution of acetaminophen and its metabolites in the whole body. Our results are in agreement with experimental results. What is more, the integrated model also predicted variations in drug toxicity depending on alterations of metabolic enzyme activities. Variations in enzyme activity, in turn, reflect genetic characteristics or diseases of individuals. In conclusion, this framework presents an important basis for efficiently integrating inter-individual variability data into models, paving the way for personalized or stratified predictions of drug toxicity and efficacy.
Introduction
The need to develop a virtual physiological human for clinical and pharmacological applications has stimulated the development of several physiological models that capture the interplay between different structures in tissues, organs, and the whole body (Fenner et al., 2008). The liver is an important organ in this workflow because it is required for many metabolic functions. This fact has boosted the development of virtual liver models within the framework of large-scale research programs. Prominent examples are the virtual liver project (Wambaugh and Shah, 2010) and the virtual liver network (Holzhütter et al., 2012). In a number of liver modeling efforts, relatively simple cells were coupled to models of liver tissue to perform qualitative predictions of substance distributions and cell responses, particularly toxicity. In some pharmacokinetic models, data obtained from in vitro experiments are translated into different transporter and enzyme activities, which are thereafter distributed in the liver (Pang et al., 2007). Other approaches defined complete in silico livers where the organ is coupled with a simple model of cell metabolism. For instance, Hunt and Ropella (2008) and Wambaugh and Shah (2010) not only made a comprehensive model for simple cells with a simple metabolism but also developed a model that allows an estimation of the substance distribution in the lobule assuming that its structure resembles a network where each hepatocyte is located in each node of the network. Based on this description, the spatial distribution of the substance can be reproduced from the portal to the central vein. The advantage of such approaches is the possibility of predicting substance extraction and distribution also depending on the heterogeneity of the liver micro structures (Ropella and Hunt, 2010). In several organ models, relatively simple individual cells are coupled to a complex description of the liver (Kuepfer et al., 2012). For the prediction of function and structure of the liver, such coarse grained approaches provide essential information on the physics (behavior of a granular media), the way the liver responds to damages, and on the detoxification and drug elimination of this organ (Chelminiak et al., 2006). Examples are models where cell populations are described as multi-agent systems ordered in complex networks of the parenchymal tissue (Chelminiak et al., 2006; Hoehme et al., 2010). However, a detailed description of the metabolic and regulatory networks is necessary for understanding the liver function, in particular for the prediction of the effects of drugs (and other substances) in pharmaceutical research (Kuepfer et al., 2012). In this field, only a few models have recently taken steps toward the integration of detailed cell mechanisms (Ohno et al., 2008). For instance, there are changes in the distribution of oxygen and metabolites inside the liver introducing a zonation that affects the function (Allen et al., 2005) as well as cell death in response to toxic doses (Malhi et al., 2010). An additional advantage of the incorporation of detailed dynamic cellular models is the possibility to include inter-subject variability in predictions of drug effects (Bucher et al., 2011; Niklas et al., 2012).
In this work, we further developed multidimensional models for the liver which were coupled to in silico cells performing a metabolic function. The primary goals of this study were (i) to set-up and verify a whole body model coupled with an in silico liver, (ii), to predict the distribution of substances for an in silico patient treated with acetaminophen, and (iii) to extrapolate critical doses from in vitro data. One of the main goals of this approach is to simulate cell mortality when acute toxicity takes place. To this end, we reconstructed a network for acetaminophen metabolism, integrated this into an in silico liver model, simulated uptake and distribution of drug and metabolites in the liver and the whole body of an in silico patient, and performed simulations upon administration of different single doses.
Materials and Methods
Modeling of Acetaminophen Metabolism and Toxicity
The metabolic network model for metabolism and toxicity of Acetaminophen (APAP) was set-up based on literature data. In brief, acetaminophen is metabolized by cytochrome P450 monooxygenases (CYPs; Patten et al., 1993; Thummel et al., 1993; Chen et al., 1998), UDP-glucuronosyltransferases (UGTs; Court et al., 2001; Mutlib et al., 2006; Riches et al., 2009), and sulfotransferases (SULTs; Sweeny and Reinke, 1988; Adjei et al., 2008; Riches et al., 2009). Glutathione (GSH)-transferases (GSTs; Coles et al., 1988) contribute additionally to Phase II conjugation. APAP is degraded mainly to the corresponding glucuronide (APAPG) and sulfate (APAPS) metabolites and by CYP-mediated oxidation to N-acetyl-p-benzoquinone imine (NAPQI; Chen et al., 2008). Amongst CYPs, several isoenzymes contribute to NAPQI formation in liver, with probable major contributions by CYP3A4, CYP2E1, CYP2A6, and CYP1A2 (Patten et al., 1993; Thummel et al., 1993; Chen et al., 1998) and minor contribution by CYP2D6 (Dong et al., 2000). The toxic metabolite NAPQI is detoxified through conjugation with GSH by GSTs to APAPGS (Coles et al., 1988). Additionally, NAPQI can be reduced back to APAP by NADPH quinonereductase (NQO1; Moffit et al., 2007). Furthermore, intracellular unspecific binding of APAP and metabolites to proteins and lipids was considered, particularly for APAPS and NAPQI due to their comparably low fraction unbound. Binding constants were calculated using logP-correlations (Zaldivar Comenges et al., 2011).
APAP is taken up into the cell via active transport and by passive diffusion (McPhail et al., 1993). Since NAPQI is similar to APAP and comparably lipophilic with respect to the logP (PubChem), passive diffusion is also assumed for NAPQI. Permeability coefficients were estimated using logP-correlations (Zaldivar Comenges et al., 2011). APAP-Glucuronide and APAP-Sulfate are excreted through the transporter multidrug resistance related protein (MRP)2 and translocated at the basolateral side via MRP3/4 (Xiong et al., 2000, 2002; Chen et al., 2003; Zamek-Gliszczynski et al., 2006). APAPGS is also exported via MRP2 and MRP3/4 (Chen et al., 2003; Zamek-Gliszczynski et al., 2006).
At low APAP dose, intracellular NAPQI concentration is very low since it is immediately conjugated with GSH. GSH is replenished by glutathione synthase (GSS; Reed et al., 2008) and degraded via gamma-glutamyltransferase (GGT; Shaw and Newman, 1979). At over dose conditions, NAPQI accumulates and initiates severe hepatoxicity (Rumack and Matthew, 1975). The cellular toxicity pathway of APAP includes increased NAPQI-binding to mitochondrial membrane proteins (James et al., 2003) triggering perturbation of the respiration machinery and inducing increased formation of reactive oxygen (ROS) and nitrogen (RNS) species (Jaeschke et al., 2003).
ROS are detoxified in mitochondria by superoxide dismutase and glutathione peroxidase (GPX; Murphy, 2009). Therefore, the cellular GSH level is further reduced through increased H2O2 synthesis resulting in increased formation of oxidized glutathione disulfide (GSSG). GSSG is reduced back to GSH by glutathione reductase (GSR). ROS and RNS cause lipid peroxidation and protein nitration (Jaeschke et al., 2003; James et al., 2003), respectively. Both mechanisms finally destroy mitochondrial integrity.
Accordingly, a cellular kinetic metabolic model of APAP-metabolism, GSH turnover, ROS synthesis, and cell death was set-up (Figure 1). The mathematical model is described in a supplementary material.
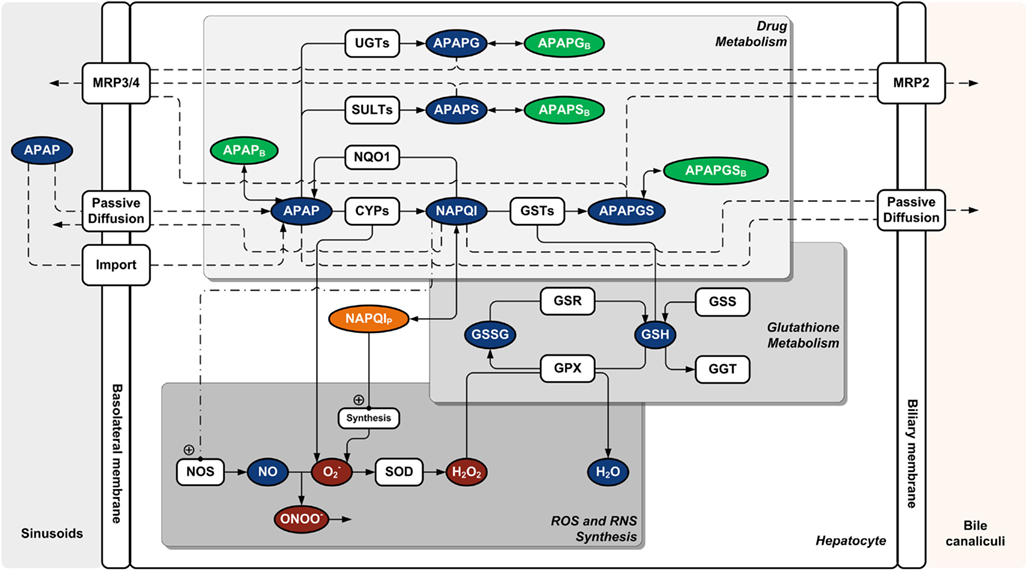
Figure 1. Cellular metabolic network model for acetaminophen metabolism and toxicity. Abbreviations: APAP, acetaminophen; APAPG, acetaminophen glucoronide; APAPGS, acetaminophen-glutathione-conjugate; APAPS, acetaminophen sulfate; CYP, cytochrome P450 monooxygenase; GGT, γ-glutamyltransferase; GPX, glutathione peroxidase; GSH, glutathione; GSR, glutathione reductase; GSS, glutathione synthase; GSSG, glutathione disulfide; GST, glutathione S-transferase; MRP (2/3/4), multidrug resistance related protein; NAPQI, N-acetyl-p-benzoquinone imine; NOS, nitric oxide synthase; NQO1, NADPH quinonereductase; SOD, superoxide dismutase; SULT, sulfotransferase; UGT, UDP-glucuronosyltransferase. Index “B,” non-specifically bound (protein/lipid); index “P,” non-specifically bound to protein.
The probability of cell death (necrosis) is defined to be a function of the concentration of substances in the cell triggering the deterioration of the hepatocyte, which is similar to the approach suggested by Wambaugh and Shah (2010). The production of H2O2 after ROS synthesis and the consumption of GSH are both used as criteria for cell death in our liver model. If the H2O2 concentration surpasses a critical value and GSH is consumed, the probability of necrosis for the hepatocytes increases. Furthermore, since the cells in the centrilobular region have a low oxygen intake (Allen et al., 2005), we assume that the cells in the respective region are more sensitive to toxic effects compared with cells near the portal veins. This means that the probability of cell death via necrosis is inversely proportional to the distance to the central vein (Gujral, 2002).
Liver and Multi-Scale Model: Structure of Sinusoids and Lobules
The liver is a complex organ with several interconnected structures across several scales (Figure 2). A central part of our modeling approach is integration of (i) metabolism of single hepatocytes, (ii) transport of substances across the lobules, and (iii) the whole body. After the blood enters the liver, it is distributed by portal veins into functional subunits, called lobules, which carry out diverse functions including the detoxification of xenobiotics at cell level (Figure 1). An adult liver contains around one million lobules, distributed more or less homogeneously across the liver (Arias et al., 2009). In the periphery of each lobule, several blood vessels deliver the blood flow into the lobule through additional substructures called sinusoids. We simplify this structure by assuming a parallel tube model. With this assumption, the lobule is represented as a hexagonal structure with six portal triads, each connected to a simple tube draining the blood from portal to central vein (Pang and Rowland, 1977; Figure 3).
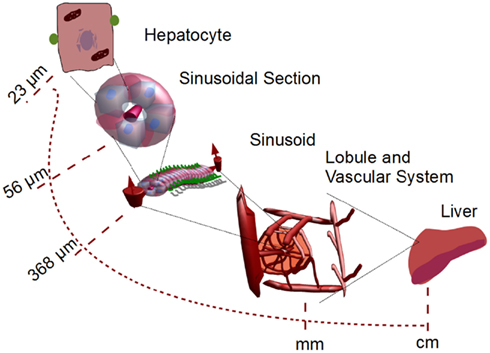
Figure 2. Multi-scale system from single hepatocytes to organ level. Single hepatocytes are coupled to liver capillaries (sinusoids) which are coupled to micro-organelles called lobules. These lobules are considered to be the smallest functional micro-structure in the liver. The corresponding parameters for the lobule module are shown in Table 1.
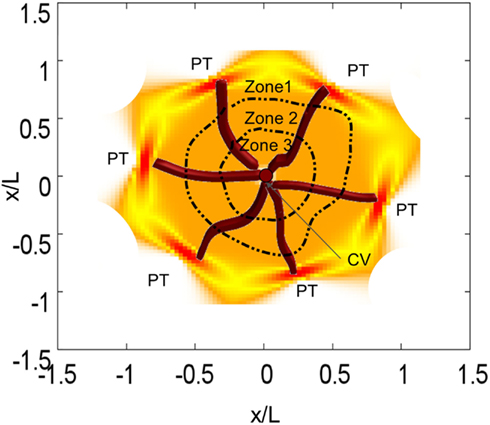
Figure 3. Representation of one lobule with six sinusoids. Each sinusoid transports blood form a portal triad (PT) to the central vein (CV). We also included lobule zonation.
The sinusoid is essentially modeled as a collection of hepatocytes aligned along a blood vessel with geometry similar to a cylindrical tube (Ohno et al., 2008). Since the central goal of this study was to model drug metabolism in the liver taking place in the hepatocytes, we define the sinusoids as simple capillary structures with a wall composed only by hepatocytes. We assume that four hepatocytes are arranged in each section of the tube. For each section, there is a concentration of compounds cm(t, x) where m is an index for the corresponding compound, x is the position of the cell on the sinusoid (L is the total length of the sinusoid), and t is the time. Substance concentrations as a function of time t and hepatocyte position along the sinosoid x is obtained by solving the corresponding coupled differential equation.
where c(x, t) is a m dimensional vector of intracellular and extracellular concentrations [i.e., c(x, t) = c1 (x, t), c2(x, t),…, cm(x, t)], N is the m × r stochiometric matrix, v is the r dimensional vector of reaction rates that depends on the substrate concentrations c and a set of parameters p.
We approximate the geometry of the sinusoid to a tube with an average radius of 5 μm where the substance is dispersed on the x axis. Further assuming that the blood is a good solvent, the distribution of the substance can be described as an advection-diffusion process, which is described by the following equation.
Here, Ux is the velocity of the suspension along the tube and D the diffusion coefficient. We assume that the average blood velocity in the sinusoid is about 0.1 mm/s (Vollmar and Menger, 2009). Additionally, we take the Fahraeus effect into account, i.e., the tendency of red cells to migrate away from the tube wall so that the mean velocity of the cells is larger than the mean velocity of the suspension near the cell wall. Sugihara-Seki and Fu (2005) found that the mean velocity of the suspension Ux is about 0.05 mm/s. Additionally, we assume that the blood in the sinusoid is a liquid with a low Reynolds number (<0.0001)so that the Einstein (1905) relation can be employed, i.e.,
where D is the diffusion constant, KB is the Boltzman constant, T is the temperature and f is a number characterizing the boundary conditions of the particle. In this case, it is valid to assume sticky boundary conditions, i.e., that the fluid has a zero velocity relative to the surface of the molecule, assuming that this molecule can be approached by a sphere such that f = 6 (Cappelezzo et al., 2007). Additionally, η is the viscosity of the blood (which is about 3 × 10⁻³Pa × s, see, e.g., Késmárky et al., 2008, and Rg is the radius of gyration. Using the radius of gyration for acetaminophen (2.99 Å), the diffusion coefficient is about 2.22 × 10⁻¹⁰ m2/s (Falk, et al,. 2004).
The solution of Eq. 2 is
with Q being the quantity of the substance (i.e., Q = c × V, V, is the volume), and r the radius of the sinusoid. The initial condition in this propagation is the concentration entering from the portal vein multiplied by the fraction unbound, fu (in this case fu = 0.75; Péry et al., 2012). We also assume that the liquid, distributed according to csinus(t, x), propagates in discrete steps of time (similar to Wambaugh and Shah, 2010). With such an approach, the complex dynamics of the dispersion of the substance is significantly reduced without losing information on the hepatic elimination/metabolism of the substance. Simultaneously, each hepatocyte can transport, eliminate, and transform the substance in the bulk so that each chemical species has its own spatial distribution. The constants used for the modeling of the lobule are resumed in Table 1. The corresponding constants for individual cells as well as for the transport cell/bulk are assigned in the model for cell metabolism described above (see also the Supplementary material).
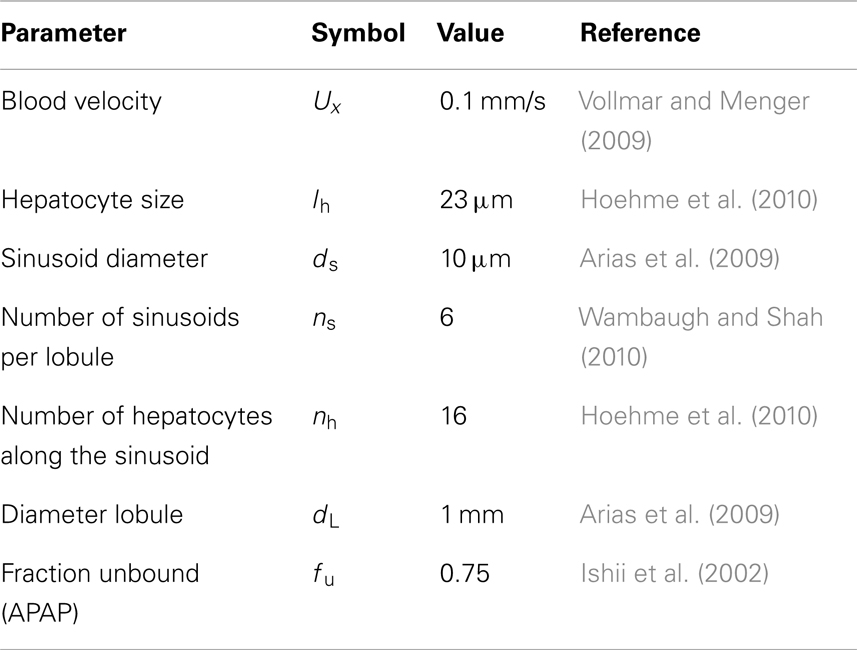
Table 1. Physical parameters of lobule and sinusoids.
The oxygen gradient along the sinusoid (see Modeling of Acetaminophen Metabolism and Toxicity) introduces a zonation in the liver, which, in turn, induces a heterogeneous distribution of CYP expression factors radially aligned to the lobule (Allen et al., 2005; Figure 3). This zonation is not only relevant in the physiology of the liver but also in the construction of in silico livers (Ropella and Hunt, 2010). Based on different evidence from the literature (Bhatia et al., 1999; Allen et al., 2004, 2005) we assume three regions with different CYP activity. Zone 2 is close to the periportal region whereas zone 3 is close to the pericentral region. We assume that the CYP3A4 activity is similar in zones 1 and 2; in zone 3 this value is about 1.3 times larger than in zone 1 (Oinonen and Lindros, 1998).
Whole Body Model
The estimation of a realistic microdosimetry requires the computation of the substance distribution in the whole body. For such a mathematical representation of the whole body, individual organs not reconstructed by an internal structure are represented as compartments neglecting concentration gradients of substances within the organ (Figure 4). The modular structure of the set-up allows for replacing the compartments by detailed structured organs, as required. In our model, we assume that metabolism of APAP is primarily performed by the liver. Consequently, there is no detailed representation for lung, kidney, or other organs. In this study, the whole body model consists of well-perfused tissues (WPT), poorly perfused tissues (PPT), adipose tissue, blood, and a structured 2D liver model. Finally, following the anatomical structure of the body, these compartments are interconnected through the blood circulation.
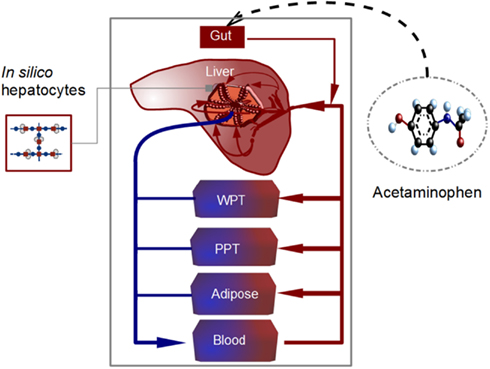
Figure 4. Scheme of the whole body model. The model is divided into liver, adipose tissue, blood, other well-perfused tissues (WPT), and other poorly perfused tissues (PPT). Blood transporting acetaminophen flows through the in silico liver, consisting of lobules coupled to in silico hepatocytes (containing the metabolic network represented in Figure 1). Acetaminophen is orally administrated and transported from gut to liver. The degradation and metabolization of the substance takes place in the hepatocytes adjacent to and alongside the sinusoids.
Our model is calibrated for an adult weighing 73 kg (Table 2). The tissue volumes were scaled from body weight and the blood flows scaled from cardiac output with the values used by Mielke and Gundert-Remy (2009). WPT as well as PPT can be represented as a perfusion rate-limited, one compartment model as follows [in the following, Ci(t) are concentrations in the whole body, and cm(t) concentrations at the cell level].
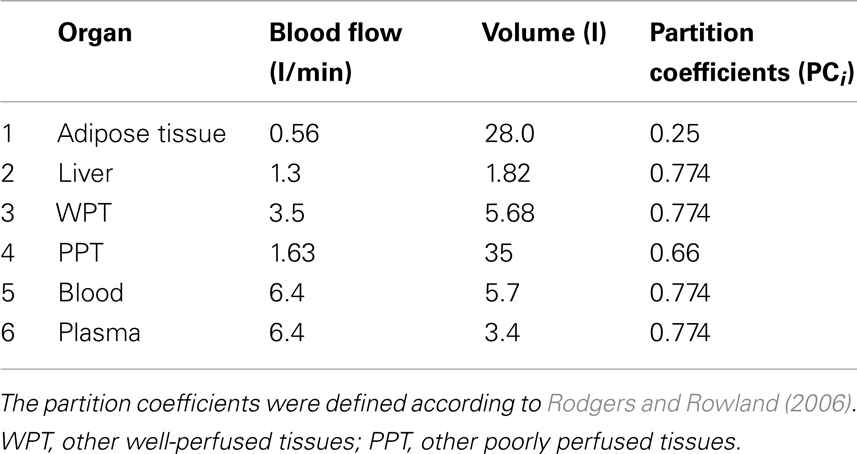
Table 2. Parameters in the PBPK model depicted in Figure 4 according to Price et al. (2003).
Where i is an index enumerating the organs (1 to 6 according to Table 2) with volume Vi. Fi is the blood flow in the corresponding organ, Ci(t) is the concentration of the substances (APAP) in the organ, Cb(t) = C5(t) is the concentration of the substance in blood and PCi is the corresponding partition coefficient of the organ. We assume that the substance distributes into major tissue constituents (water, bound to proteins, neutral lipids, phospholipids) and that there is a total unbound concentration in plasma of 0.75.
In our model, the absorption rate of APAP from stomach to gut is given by the following equation.
In this equation, Qadm(t) = Weight·Dose (t; weight given in kg, dose in mg/kg) is the amount of substance that is administrated and Qgut(t) = CgutVgut is the amount of acetaminophen in the gut. The fraction of ingested APAP entering the liver, Fring, is fixed to 0.9 (Brown et al., 1979) and kgut, the rate of adsorption from gut to stomach, is fixed to 0.025 min−1(Péry et al., 2012).
We constructed organelles in the liver, coupled these to the cell metabolism, and made an estimation of the liver clearance, which is the capacity of the liver to eliminate and transform compounds from the blood. We simulate the sinusoid coupled to the hepatocyte dynamics and estimate the amount of APAP that the sinusoid/liver is able to eliminate, i.e., where Ek(t) is the acetaminophen eliminated by the sinusoid k (k between 1 to ns, the total number of sinusoids), cAPAP − cyt is the concentration of acetaminophen in the cell, cAPAP − B is the concentration of acetaminophen in the sinusoidal bulk, and L is the length of the sinusoid [see a similar definition of clearance by Wambaugh and Shah (2010)]. The liver clearance is therefore given by The equation for the liver coupled to the whole body model (which is equivalent to the construction of a sub-compartment for the liver) is
where ξ is a constant that couples the estimated clearance with the liver compartment, which is related to the parenchymal volume. Given that the parenchymal tissue is smaller than the total liver volume (about 80%; Arias et al., 2009), we set ξ = 0.75 in order to adjust the clearance of the lobule to the total volume of the liver; PC2 corresponds to the partition coefficient of the liver (see Table 2). Note that the rate of assimilation is an average value obtained from the integration in the lobule and that our liver is equivalent to a mean lobule.
Finally, the urinary excretion rate of acetaminophen was based on the estimate for rats through biometric scaling and was fixed to 0.016 l/min (Péry et al., 2012).
Model Verification
Before starting simulations, we verified the whole body model using experimental results for the concentration of acetaminophen in blood plasma after a single dose. We compared our predictions with results from literature for three different doses. For doses of 1000 mg (Rawlins et al., 1977), 2000 mg (Rawlins et al., 1977; Brunner et al., 2002), and 5475 mg (Douglas et al., 1996; Ly et al., 2004), the χ2 values were 0.71, 0.91, and 0.2, respectively, which indicates a relatively good fit of our model with experimental data. We also compared the result obtained with our whole body coupled to the in silico liver with a PBPK model coupled to a well-stirred liver for the uptake of acetaminophen in humans (Péry et al., 2012). A good agreement between the time courses (χ2 = 4.22) was observed (Figure 5). The deviations between our model and literature may originate from differences between the parameterization of the model (physiological parameters, enzyme activities) and the physiology of the individuals.
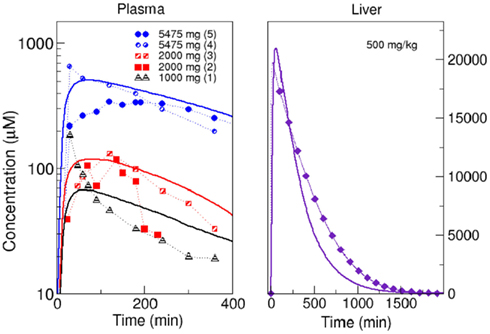
Figure 5. Comparison of model simulations with experimental data. Left panel: simulated acetaminophen concentration in plasma (solid lines) compared within vivo pharmacokinetics: (1) single dose of 1000 mg (Rawlins et al., 1977), (2) single dose of 2000 mg (Rawlins et al., 1977), (3) single dose of 2000 mg (Brunner et al., 2002), (4) single dose of 5475 mg (Douglas et al., 1996), and (5) single dose of 5475 mg (Ly et al., 2004). Right panel: comparison of model simulation (solid line) with estimated concentration of acetaminophen in the liver using a PBPK model (Péry et al., 2012) after administration of a single dose of 500 mg/kg.
Modeling and Simulation Platform
The metabolic network was generated by the software Insilico Discovery™ (Insilico Biotechnology AG, Stuttgart, Germany) and represented in FORTRAN. Once the individual cells are coupled to the sinusoid, the six sinusoids are simulated in parallel together with the whole body model. Numerical integration was performed using the LIMEX integrator for differential-algebraic equations (Nowak et al., 1996).
Specific enzyme activities were calculated from activities measured on recombinant enzymes (which are given in nmolDrug/nmolEnzyme/min) applying the following physiological parameters: Microsomal CYP content (Shimada et al., 1994), total cell protein (30 g/Lcell, Lcell = 1 l of cells; Bucher et al., 2011), and ratio of microsomal to total cell protein (0.22; Bucher et al., 2011). Because we use cellular systems for kinetic modeling, we have to calculate concentrations (μmol/Lcell) and activities (μmol/Lcell/min) per cell volume.
Results
Spatiotemporal Prediction of Drug and Metabolite Concentrations
One advantage of our approach is the possibility to follow distributions of substances along liver lobules, which allows a detailed analysis of the accumulation of toxic substances in the organ. According to our model, APAP is distributed from the portal to the central vein showing a rapid transport of acetaminophen in the periportal region. Accordingly, toxic substances should accumulate in the pericentral region. This case can be verified by analyzing the accumulation of NAPQI (Figure 6), which can be used as a marker for APAP toxicity. We observed that NAPQI concentration (Figures 6B,C) were highest in the pericentral region indicating that the cells in this region should be more prone to APAP toxicity.
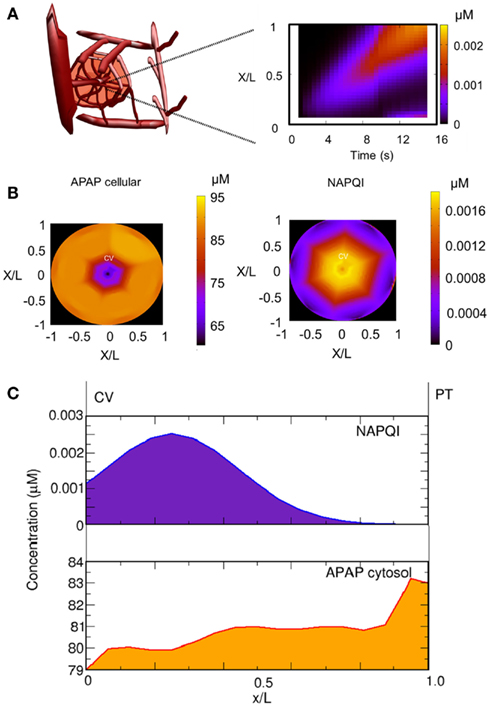
Figure 6. Spatial distribution of acetaminophen (APAP) and NAPQI. (A) Spatial distribution of APAP in the sinusoid after 10 min for a single dose of 393 mg/kg. The distribution of NAPQI is schematically given as a function of the distance (sinusoidal length normalized as x/L) and time. (B) Distribution of cellular APAP and NAPQI in the lobule at 4 h after a single APAP dose (393 mg/kg). (C) Mean distribution of NAPQI and cellular APAP in the lobule as a function of the sinusoidal length.
Prediction of in vivo Toxicity by Combining in vitro Data and the Multi-Scale Model
A central aim of this study is to estimate cell viability and not just concentrations in the organ. To this end, we used experimental results of cell viability obtained from in vitro experiments (Zaldivar Comenges et al., 2011; Péry et al., 2012). In these experiments, a LC50(concentration at which 50% of the cell population are viable) of ∼4000 μM was observed. We performed simulations for in silico cells and defined that the critical concentration of H2O2 inducing cell death is the one obtained at the LC50 of APAP in the in vitro setting. We observed that intracellular H2O2 concentrations above 4000 μM can be used as an indicator for cell toxicity and assume that this threshold value is the criterion triggering cell death, i.e., if the concentration of H2O2 in the cell is higher than this critical value, necrosis takes place, meaning that intracellular functions stop or, in other words, that dc(x, t)/dt = 0. In some studies, it was shown that the necrosis process upon exposure to high H2O2 concentrations is relatively fast (McKeague et al., 2003). For this reason, we adopted a stochastic time delay between 0 and 1 min for the beginning of necrosis in the sinusoid so that the necrosis process is non-deterministic.
This definition of necrosis together with our definition of clearance implies a continuous feedback between local cell behavior, clearance of the organ, and distribution of substances in the whole body. In order to find a region of critical APAP concentrations of interest, we performed several runs for different doses. We found that critical behavior is observed for doses above ∼300 mg/kg. In this region, we performed detailed simulations while assuming that the viability of the cells in the lobule remains constant below this dose. First, we performed simulations using an individual with a CYP3A4 activity of0.95 μmol/Lcell/min and CYP2E1 activity of 1.0 μmol/Lcell/min and increased the dose from 310 to 470 mg/kg (Figure 7). For 310 mg/kg, no cell mortality was predicted. The selection of both CYP3A4 activities is in order to represent differences in the metabolism between women and men. The organ was able to perform detoxification and the toxic substance was completely eliminated after about 800 min. However, if the concentration is higher, cell mortality continues implying a gradual diminution of the capacity of the organ to eliminate APAP. Simultaneously, this leads to an increase in the APAP concentration in the liver (Figure 7). The slow elimination contributes to an increase in the intracellular level of H2O2 and to decreased cell viability in the organ. This is also relevant for repeated dose toxicity. In this example, a new dose larger than ∼300 mg/kg before ∼8 h after the initial dose could be lethal for this patient.
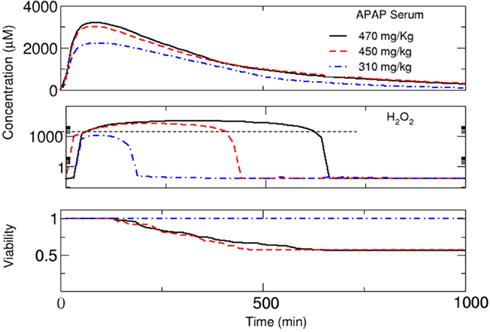
Figure 7. Substance concentrations and mean viability in the lobule (see Figure 8) estimated using the multi-scale model. Time courses are shown for the concentration of APAP in plasma, concentration of H2O2 in the cell (measured at the central vein, according to Figure 3), and total cell viability in the lobule for a dose of 310, 450, and 470 mg/kg, respectively. For viability estimation, it was assumed that an increase in H2O2 concentration above a critical threshold results in necrotic death of the respective cell.
An advantage of kinetic models representing the dynamics at a cellular scale is the possibility to include inter-individual differences in gene expression or enzyme activities into the estimation of drug effects and toxicological risk. In the following, we will evaluate this exemplarily by considering selected variations in CYP enzyme activities (CYP3A4 activities of 0.95 and 1.9 μM/min and CYP2E1 activities of 1.0 and 5.0 μM/min (Bolt et al., 2003); the selection of the CYP2E1 is made in order to represent alcoholism and non-alcoholism) and by analyzing the distribution of substances as well as cell viability in the organ. The spatiotemporal estimation of cell viability in the liver lobule depending on the activity of CYP3A4 can be found in Figure 8. Given that the definition of the necrosis process is essentially non-deterministic, the degradation of the cells in the lobule is non-symmetric. We also observe that an increase in CYP3A4 activity strongly increases the risk of APAP-induced hepatotoxicity.
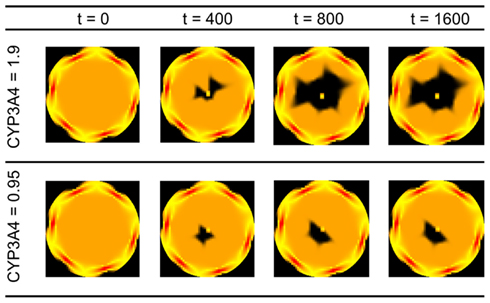
Figure 8. Cell viability in the lobule at different time points for two different CYP3A4 activities after a single oral APAP dose of 393 mg/kg. Viable cells are schematically illustrated n orange, dead cells in black. The spatial distribution corresponds to the detailed scheme and coordinates given in Figure 3. CYP activities in μM/min, time in min.
Based on this analysis, it is also possible to estimate critical doses for in silico patients from viability curves. Dose response curves at 2000 min after APAP exposure are given in Figure 9. Again, we observed a dose dependent and CYP3A4 expression dependent decrease in cell viability. Critical doses leading to a decrease in cell viability are in the range of values reported in literature (Schiødt et al., 1997; Larson et al., 2005). Acetaminophen induced hepatotoxicity has a large inter-individual variability and critical daily doses for individuals range between 10 and 1000 mg/kg [Larson et al., 2005; according to Dart et al., 2006 the acute grade of toxicity (or grade D) for patients of 6 years or older lies around 200 mg/Kg for acetaminophen].
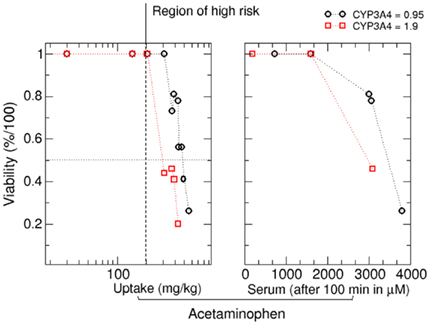
Figure 9. Viability as a function of the oral APAP dose (left) and as a function of the APAP concentration in blood plasma at 33 h after APAP dose (right). Range of possible toxic daily APAP concentrations as reported in literature is given by the black dotted lines (see, e.g., the guideline suggested by Dart et al., 2006).
Finally, we analyzed the time-dependent response upon APAP treatment influenced by variations in the activities of CYP2E1 and CYP3A4 (Figure 10). For both enzymes, a significant increase in APAP concentration in serum and H2O2 concentration in the liver was observed with increased enzyme activity leading to lower cell viability.
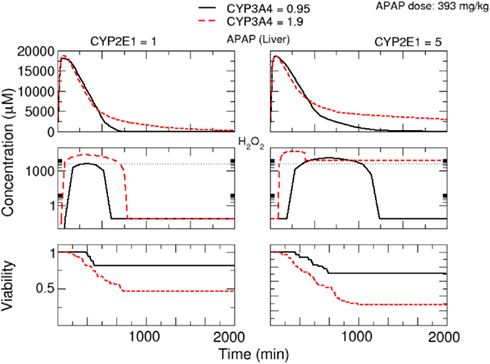
Figure 10. Response upon oral APAP dose of 393 mg/kg depending on variations in the activity of CYP3A4 and CYP2E1. Simulated concentrations of APAP in serum and of H2O2in cells at the central vein in the lobule are shown. The viability is the mean value of the whole lobule. The left group of panels corresponds to a CYP2E1 activity of 1 μmol/Lcell/min, the right group of panels to a CYP2E1 activity of 5 μmol/Lcell/min. Additionally, a comparison between two CYP3A4 activities, 0.95 and 1.9 μmol/Lcell/min, is given in each figure.
Discussion
Russell and Burch (1959) recognized in their book “The principles of human experimental technique” the need to replace animal tests with other kinds of tests. Nowadays, numerous research initiatives are focusing on developing and improving methods and approaches suitable for reducing, refining, or even replacing tests on animals. Amongst different strategies, combinations of targeted in vitro experiments and in silico tools represent promising strategies for improved toxicity testing in the future (Basketter et al., 2012). In this study, we address this issue by focusing on a multi-scale modeling framework which integrates data derived from in silico as well as in vitro experiments. It is obvious that the strategy presented here has to be validated in other substances but it does bring research a further step forward toward predicting toxic effects in vivo. The development of novel computational technologies and their application to the modeling of human and animal physiology signify that in silico tests can, in fact, reduce and, in specific cases, even replace experimental tests on animals (Goldberg and Hartung, 2006).
A basic assumption underlying this study is that the primary toxic effect is mainly induced by cellular mechanisms. For this reason, we set-up and applied a model alternative with a reduced complexity of the liver, suitable for coupling hepatocytes and whole body. The integration of detailed cellular models into organs and a whole body model are basic differences compared with similar models (Wambaugh and Shah, 2010). Consequently, our model allows the analysis of local and systemic effects of parameters at different levels (cells, organ, and whole body).
As regards definition of the liver model, we were confronted with several alternatives and grades of complexity ranging, e.g., from detailed, structured liver sub-organelles (Wambaugh and Shah, 2010) over parallel tube (Ito and Houston, 2004) to well-stirred models (Kuepfer et al., 2012). Parallel tube models, which are a relatively simple approach, are best suited for intrinsic in vitro clearance, but not appropriate for in vivo analysis (Ito and Houston, 2004). In reality, there is a heterogeneous population of hepatocytes in the liver that has strong influence on the distribution and toxic effect of the compound on the cells, showing that a well-stirred model is clearly not appropriate for deriving robust in vivo predictions (Ito and Houston, 2004). In effect, we developed a model that combines a parallel tube model with dispersion, making it well-suited for the coupling of detailed cell mechanisms enabling (i) the implementation of individualized or stratified data on, e.g., gene expression and enzyme activities as well as (ii) the consideration of zonation. We believe that this approach is necessary for a better extrapolation of toxic effects from in vitro to in vivo. The possibility to define spatial distributions of substances and effects is a clear advantage over well-stirred or parallel tube representations (Kuepfer et al., 2012).
In this case study, we were able to predict the distribution of APAP and its metabolites in a whole body model and correlated concentrations of toxic metabolites with the onset of toxicity. Parameterization of the whole body model was performed using literature values and QSAR methods. Since we integrated a mechanistic, kinetic cellular model, we were able to analyze how individual properties – such as specific gene expression – affect pharmacokinetics and toxic outcomes. This is a clear difference compared with common PBPK approaches (Bois et al., 2010).
Concerning physiological parameters, such as body weight or associated volumes of specific internal organs, which are commonly considered in pharmacokinetic modeling (Price et al., 2003; Kuepfer et al., 2012), no variability was included in this study. Differences in these physiological parameters can be additionally introduced strongly increasing the complexity. Since our central aim was to show the effect of intracellular properties on drug metabolism, distribution of substances, and, eventually, organ-specific toxicity, we did not consider this aspect.
IVIVE-PBPK approaches were proposed for the extrapolation of toxic effects observed under in vitro–in vivo conditions (Rostami-Hodjegan, 2012). This approach can be useful not only for environmental risk assessment but also in drug development. Other new extrapolation techniques are based on a “middle out” approach which starts at the organ level and goes down to the cellular level in order to analyze, e.g., drug-induced liver injury (Howell et al., 2012).
The main difference between these methods and our multi-scale approach is that the method presented in this study allows the inclusion of physical parameters (such as blood flow, lobule size, diffusion, and dependence on temperature etc.) and important physiological properties, e.g., zonation of metabolic functions of organs and tissues. This means that the effects of organ structure and physiology on cellular function can be taken into account, aspects which can hardly be analyzed with a fore mentioned techniques.
An additional advantage is the possibility to analyze inter-individual variations in the toxicity of a compound, which is a major issue in pharmaceutical industry (Schiødt et al., 1997; Larson et al., 2005). Kinetic models of the mechanism of action of compounds are ideal for facing this issue as they can be used to predict inter-subject variability by including data, e.g., from well-characterized liver banks (Bucher et al., 2011; Riedmaier et al., 2011; Klein et al., 2012).
The modeling approach presented is based on a fairly complex network model of the mechanism of action for the compound of interest. This means that significant resources are required for reconstructing the network of each substance. Hence, this approach is suitable for a detailed characterization of substances. In this work, we performed a case study for one compound. Future work should focus on developing generic networks which can easily be transferred to new substances.
The presented liver model is essentially an average lobule assuming that the organ is of uniform tissue with a uniform blood flow and a rapid distribution of substances. In reality, the distribution of substances is non-homogeneous and time-dependent (Weiss et al., 2012), a fact that is exacerbated by drug toxicity or diseases such as cancer and cirrhosis. This aspect shows that a 3D representation of the organ would be a further step toward improving the predictivity of the liver model. In addition, the fact that drug metabolism is not only carried out in the liver requires the extension of this kind of mechanistic modeling to other organs.
In summary, we present a first multi-scale modeling approach integrating cellular and organ models in a whole body environment suitable for predicting spatiotemporal variations in drug response and toxicity. The presented work is an important basis for efficiently analyzing inter-individual differences upon drug treatment in silico and hence a significant step forward on the road to the development of in silico patients.
Conflict of Interest Statement
The authors declare that the research was conducted in the absence of any commercial or financial relationships that could be construed as a potential conflict of interest.
Acknowledgments
We are very grateful to Irina Surovtsova for feedback and valuable support. The research leading to these results received funding from Cosmetics Europe and the European Community’s Seventh Framework Program (FP7/2007-2013) under grant agreement N° 266835 and partly by grant agreement N° 267038 as well as through the German BMBF virtual liver funding initiative (grant agreement N° 0315762). In the final preparation of this manuscript our colleague and friend Jose Manuel Zaldivar unexpectedly died. We are deeply indebted with him due to his courage and energy in the development of central ideas contained in this manuscript.
Supplementary Material
The Supplementary Material for this article can be found online at http://www.frontiersin.org/Drug_Metabolism_and_Transport/10.3389/fphar.2012.00204/abstract
References
Adjei, A. A., Gaedigk, A., Simon, S. D., Weinshilboum, R. M., and Leeder, J. S. (2008). Interindividual variability in acetaminophen sulfation by human fetal liver: implications for pharmacogenetic investigations of drug-induced birth defects. Birth Defects Res. Part A Clin. Mol. Teratol. 82, 155–165.
Allen, J. W., Khetani, S. R., and Bhatia, S. N. (2004). In vitro zonation and toxicity in a hepatocyte bioreactor. Toxicol. Sci. 84, 110–119.
Allen, J. W., Khetani, S. R., and Bhatia, S. N. (2005). in vitro zonation and toxicity in a hepatocyte bioreactor. Toxicol. Sci. 84, 110–119.
Arias, I. M., Alter, H. J., Boyer, J. L., Cohen, D. E., Fausto, N., Shaftitz, D. A., et al. (2009). The Liver: Biology and Pathobiology. Australia: John Wiley and Sons.
Basketter, D. A., Clewell, H., Kimber, I., Rossi, A., Blaauboer, B., Burrier, R., et al. (2012). A roadmap for the development of alternative (non-animal) methods for systemic toxicity testing – t4 report*. ALTEX 29, 3–91.
Bhatia, S. N., Balis, U. J., Yarmush, M. L., and Toner, M. (1999). Effect of cell–cell interactions in preservation of cellular phenotype: cocultivation of hepatocytes and nonparenchymal cells. FASEB J. 13, 1883–1900.
Bois, F. Y., Jamei, M., and Clewell, H. J. (2010). PBPK modelling of inter-individual variability in the pharmacokinetics of environmental chemicals. Toxicology 278, 256–267.
Bolt, H. M., Roos, P. H., and Thier, R. (2003). The cytochrome P-450 isoenzyme CYP2E1 in the biological processing of industrial chemicals: consequences for occupational and environmental medicine. Int. Arch. Occup. Environ. Health 76, 174–185.
Brown, R. C., Kelleher, J., Walker, B. E., and Losowsky, M. S. (1979). The effect of wheat bran and pectin on paracetamol absorption in the rat. Br. J. Nutr. 41, 455–464.
Brunner, M., Schmiedberger, A., Schmid, R., Jäger, D., Piegler, E., Eichler, H. G., et al. (2002). Direct assessment of peripheral pharmacokinetics in humans: comparison between cantharides blister fluid sampling, in vivo microdialysis and saliva sampling. Br. J. Clin. Pharmacol. 46, 425–431.
Bucher, J., Riedmaier, S., Schnabel, A., Marcus, K., Vacun, G., Weiss, T. S., et al. (2011). A systems biology approach to dynamic modeling and inter-subject variability of statin pharmacokinetics in human hepatocytes. BMC Syst. Biol. 5:66. doi:10.1186/1752-0509-5-66
Cappelezzo, M., Capellari, C. A., Pezzin, S. H., and Coelho, L. A. F. (2007). Stokes-Einstein relation for pure simple fluids. J. Chem. Phys. 126, 224516–224516-5.
Chelminiak, P., Dixon, J. M., Tuszynski, J. A., and Marsh, R. E. (2006). Application of a random network with a variable geometry of links to the kinetics of drug elimination in healthy and diseased livers. Phys. Rev. E. Stat. Nonlin. Soft Matter Phys. 73, 051912.
Chen, C., Hennig, G. E., and Manautou, J. E. (2003). Hepatobiliary excretion of acetaminophen glutathione conjugate and its derivatives in transport-deficient (TR-) hyperbilirubinemic rats. Drug Metab. Dispos. 31, 798–804.
Chen, C., Krausz, K. W., Idle, J. R., and Gonzalez, F. J. (2008). Identification of novel toxicity-associated metabolites by metabolomics and mass isotopomer analysis of acetaminophen metabolism in wild-type and Cyp2e1-null mice. J. Biol. Chem. 283, 4543–4559.
Chen, W., Koenigs, L. L., Thompson, S. J., Peter, R. M., Rettie, A. E., Trager, W. F., et al. (1998). Oxidation of acetaminophen to its toxic quinone imine and nontoxic catechol metabolites by baculovirus-expressed and purified human cytochromes P450 2E1 and 2A6. Chem. Res. Toxicol. 11, 295–301.
Coles, B., Wilson, I., Wardman, P., Hinson, J. A., Nelson, S. D., and Ketterer, B. (1988). The spontaneous and enzymatic reaction of N-acetyl-p-benzoquinonimine with glutathione: a stopped-flow kinetic study. Arch. Biochem. Biophys. 264, 253–260.
Court, M. H., Duan, S. X., Moltke, L. L., von Greenblatt, D. J., Patten, C. J., Miners, J. O., et al. (2001). Interindividual variability in acetaminophen glucuronidation by human liver microsomes: identification of relevant acetaminophen UDP-glucuronosyltransferase isoforms. J. Pharmacol. Exp. Ther. 299, 998–1006.
Dart, R. C., Erdman, A. R., Olson, K. R., Christianson, G., Manoguerra, A. S., Chyka, P. A., et al. (2006). Acetaminophen poisoning: an evidence-based consensus guideline for out-of-hospital management. Clin. Toxicol. (Phila.) 44, 1–18.
Dong, H., Haining, R. L., Thummel, K. E., Rettie, A. E., and Nelson, S. D. (2000). Involvement of human cytochrome P450 2D6 in the bioactivation of acetaminophen. Drug Metab. Dispos. 28, 1397–1400.
Douglas, D. R., Sholar, J. B., and Smilkstein, M. J. (1996). A pharmacokinnetic comparison of acetaminophen products (Tylenol Extended Relief vs. Regular Tylenol). Acad. Emerg. Med. 3, 740–744.
Einstein, A. (1905). Über die von der molecularkinetischen theorie der wärme geforderte bewegung von in ruhenden flüssigkeiten suspendierten teilchen. Ann. Phys. 322, 549–560.
Falk, B., Garramone, S., and Shivkumar, S. (2004). Diffusion coefficient of paracetamol in a chitosan hydrogel. Mater. Lett. 58, 3261–3265.
Fenner, J., Brook, B., Clapworthy, G., Coveney, P., Feipel, V., Gregersen, H., et al. (2008). The EuroPhysiome, STEP and a roadmap for the virtual physiological human. Philos. Trans. R. Soc. Lond. A 366, 2979–2999.
Gujral, J. S. (2002). Mode of cell death after acetaminophen overdose in mice: apoptosis or oncotic necrosis? Toxicol. Sci. 67, 322–328.
Hoehme, S., Brulport, M., Bauer, A., Bedawy, E., Schormann, W., Hermes, M., et al. (2010). Prediction and validation of cell alignment along microvessels as order principle to restore tissue architecture in liver regeneration. Proc. Natl. Acad. Sci. U.S.A. 107, 10371–10376.
Holzhütter, H.-G., Drasdo, D., Preusser, T., Lippert, J., and Henney, A. M. (2012). The virtual liver: a multidisciplinary, multilevel challenge for systems biology. Wiley Interdiscip. Rev. Syst. Biol. Med. 4, 221–235.
Howell, B. A., Yang, Y., Kumar, R., Woodhead, J. L., Harrill, A. H., Clewell, H. J. III, et al. (2012). In vitro to in vivo extrapolation and species response comparisons for drug-induced liver injury (DILI) using DILIsymTM: a mechanistic, mathematical model of DILI. J. Pharmacokinet. Pharmacodyn. 39, 527–541.
Hunt, C. A., and Ropella, G. E. P. (2008). “Using an In silico Liver to evaluate a hepatic enzyme induction mechanism,” in Proceedings of the 30th Annual International Conference of the IEEE Engineering in Medicine and Biology Society, 2008 (Vancouver: EMBS), 2415–2418.
Ishii, M., Kanayama, M., Esumi, H., Ogawara, K.-I., Kimura, T., and Higaki, K. (2002). Pharmacokinetic analysis of factors determining elimination pathways for sulfate and glucuronide metabolites of drugs. I: studies by in vivo constant infusion. Xenobiotica 32, 441–450.
Ito, K., and Houston, J. B. (2004). Comparison of the use of liver models for predicting drug clearance using in vitro kinetic data from hepatic microsomes and isolated hepatocytes. Pharm. Res. 21, 785–792.
Jaeschke, H., Knight, T. R., and Bajt, M. L. (2003). The role of oxidant stress and reactive nitrogen species in acetaminophen hepatotoxicity. Toxicol. Lett. 144, 279–288.
James, L. P., Mayeux, P. R., and Hinson, J. A. (2003). Acetaminophen-induced hepatotoxicity. Drug Metab. Dispos. 31, 1499–1506.
Késmárky, G., Kenyeres, P., Rábai, M., and Tóth, K. (2008). Plasma viscosity: a forgotten variable. Clin. Hemorheol. Microcirc. 39, 243–246.
Klein, K., Thomas, M., Winter, S., Nussler, A. K., Niemi, M., Schwab, M., et al. (2012). PPARA: a novel genetic determinant of CYP3A4 in vitro and in vivo. Clin. Pharmacol. Ther. 91, 1044–1052.
Kuepfer, L., Lippert, J., and Eissing, T. (2012). Multiscale mechanistic modeling in pharmaceutical research and development. Adv. Exp. Med. Biol. 736, 543–561.
Larson, A. M., Polson, J., Fontana, R. J., Davern, T. J., Lalani, E., Hynan, L. S., et al. (2005). Acetaminophen-induced acute liver failure: results of a United States multicenter, prospective study. Hepatology 42, 1364–1372.
Ly, B. T., Schneir, A. B., and Clark, R. F. (2004). Effect of whole bowel irrigation on the pharmacokinetics of an acetaminophen formulation and progression of radiopaque markers through the gastrointestinal tract. Ann. Emerg. Med. 43, 189–195.
Malhi, H., Guicciardi, M. E., and Gores, G. J. (2010). Hepatocyte death: a clear and present danger. Physiol. Rev. 90, 1165–1194.
McKeague, A. L., Wilson, D. J., and Nelson, J. (2003). Staurosporine-induced apoptosis and hydrogen peroxide-induced necrosis in two human breast cell lines. Br. J. Cancer 88, 125–131.
McPhail, M. E., Knowles, R. G., Salter, M., Dawson, J., Burchell, B., and Pogson, C. I. (1993). Uptake of acetaminophen (paracetamol) by isolated rat liver cells. Biochem. Pharmacol. 45, 1599–1604.
Mielke, H., and Gundert-Remy, U. (2009). Bisphenol a levels in blood depend on age and exposure. Toxicol. Lett. 190, 32–40.
Moffit, J., Kozataylor, P., Holland, R., Thibodeau, M., Beger, R., Lawton, M., et al. (2007). Differential gene expression in mouse liver associated with the hepatoprotective effect of clofibrate. Toxicol. Appl. Pharmacol. 222, 169–179.
Mutlib, A. E., Goosen, T. C., Bauman, J. N., Williams, J. A., Kulkarni, S., and Kostrubsky, S. (2006). Kinetics of Acetaminophen Glucuronidation by UDP-Glucuronosyltransferases 1A1, 1A6, 1A9 and 2B15. potential implications in acetaminophen-induced hepatotoxicity. Chem. Res. Toxicol. 19, 701–709.
Niklas, J., Diaz Ochoa, J. G., Bucher, J., and Mauch, K. (2012). Quantitative evaluation and prediction of drug effects and toxicological risk using mechanistic multiscale models. Mol. Inf. doi: 10.1002/minf.201200043
Nowak, U., Frauhammer, J., and Nieken, U. (1996). A fully adaptive algorithm for parabolic partial differential equations in one space dimension. Comput. Chem. Eng. 20, 547–561.
Ohno, H., Naito, Y., Nakajima, H., and Tomita, M. (2008). Construction of a biological tissue model based on a single-cell model: a computer simulation of metabolic heterogeneity in the liver lobule. Artif. Life 14, 3–28.
Oinonen, T., and Lindros, K. O. (1998). Zonation of hepatic cytochrome P-450 expression and regulation. Biochem. J. 329, 17–35.
Pang, K. S., and Rowland, M. (1977). Hepatic clearance of drugs. I. Theoretical considerations of a? well-stirred? model and a? parallel tube? model. Influence of hepatic blood flow, plasma and blood cell binding, and the hepatocellular enzymatic activity on hepatic drug clearance. J. Pharmacokinet. Biopharm. 5, 625–653.
Pang, K. S., Weiss, M., and MacHeras, P. (2007). Advanced pharmacokinetic models based on organ clearance, circulatory, and fractal concepts. AAPS J. 9, E268–E283.
Patten, C. J., Thomas, P. E., Guy, R. L., Lee, M., Gonzalez, F. J., Guengerich, F. P., et al. (1993). Cytochrome P450 enzymes involved in acetaminophen activation by rat and human liver microsomes and their kinetics. Chem. Res. Toxicol. 6, 511–518.
Péry, A., Brochot, C., Zeman, F., Fioravazo, E., Pavan, M., and Zaldivar, J. (2012). “Calibration of PBPK models based on data from alternative methods,” in Proceedings of the 15th International Workshop on Quantitative Structure-Activity Relationships (QSAR2012), Tallinn.
Price, P. S., Conolly, R. B., Chaisson, C. F., Gross, E. A., Young, J. S., Mathis, E. T., et al. (2003). Individual variation in physiological factors used in PBPK models of humans. Crit. Rev. Toxicol. 33, 469–503.
Rawlins, M. D., Henderson, D. B., and Hijab, A. R. (1977). Pharmacokinetics of paracetamol (acetaminophen) after intravenous and oral administration. Eur. J. Clin. Pharmacol. 11, 283–286.
Reed, M. C., Thomas, R. L., Pavisic, J., James, S. J., Ulrich, C. M., and Nijhout, H. F. (2008). A mathematical model of glutathione metabolism. Theor. Biol. Med. Model. 5, 8.
Riches, Z., Bloomer, J., Patel, A., Nolan, A., and Coughtrie, M. (2009). Assessment of cryopreserved human hepatocytes as a model system to investigate sulfation and glucuronidation and to evaluate inhibitors of drug conjugation. Xenobiotica 39, 374–381.
Riedmaier, S., Klein, K., Winter, S., Hofmann, U., Schwab, M., and Zanger, U. M. (2011). Paraoxonase (PON1 and PON3) polymorphisms: impact on liver expression and atorvastatin-lactone hydrolysis. Front. Pharmacol. 2:41. doi:10.3389/fphar.2011.00041
Rodgers, T., and Rowland, M. (2006). Physiologically based pharmacokinetic modelling 2: predicting the tissue distribution of acids, very weak bases, neutrals and zwitterions. J. Pharm. Sci. 95, 1238–1257.
Ropella, G. E., and Hunt, C. A. (2010). Cloud computing and validation of expandable in silico livers. BMC Syst. Biol. 4:168. doi:10.1186/1752-0509-4-168
Rostami-Hodjegan, A. (2012). Physiologically based pharmacokinetics joined with in vitro–in vivo extrapolation of ADME: a marriage under the arch of systems pharmacology. Clin. Pharmacol. Ther. 92, 50–61.
Rumack, B. H., and Matthew, H. (1975). Acetaminophen poisoning and toxicity. Pediatrics 55, 871–876.
Russell, W. M. S., and Burch, R. L. (1959). The Principles of Humane Experimental Technique. London: Methuen & Co. Special edition published by Universities Federation for Animal Welfare (UFAW), 1992.
Schiødt, F. V., Rochling, F. A., Casey, D. L., and Lee, W. M. (1997). Acetaminophen toxicity in an urban county hospital. N. Engl. J. Med. 337, 1112–1117.
Shaw, L. M., and Newman, D. A. (1979). Hydrolysis of glutathione by human liver gamma-glutamyltransferase. Clin. Chem. 25, 75–79.
Shimada, T., Yamazaki, H., Mimura, M., Inui, Y., and Guengerich, F. P. (1994). Interindividual variations in human liver cytochrome P-450 enzymes involved in the oxidation of drugs, carcinogens and toxic chemicals: studies with liver microsomes of 30 Japanese and 30 Caucasians. J. Pharmacol. Exp. Ther. 270, 414–423.
Sugihara-Seki, M., and Fu, B. M. (2005). Blood flow and permeability in microvessels. Fluid Dyn. Res. 37, 82–132.
Sweeny, D. J., and Reinke, L. A. (1988). Sulfation of acetaminophen in isolated rat hepatocytes. Relationship to sulfate ion concentrations and intracellular levels of 3′-phosphoadenosine-5′-phosphosulfate. Drug Metab. Dispos. 16, 712–715.
Thummel, K. E., Lee, C. A., Kunze, K. L., Nelson, S. D., and Slattery, J. T. (1993). Oxidation of acetaminophen to N-acetyl-p-aminobenzoquinone imine by human CYP3A4. Biochem. Pharmacol. 45, 1563–1569.
Vollmar, B., and Menger, M. D. (2009). The hepatic microcirculation: mechanistic contributions and therapeutic targets in liver injury and repair. Physiol. Rev. 89, 1269–1339.
Wambaugh, J., and Shah, I. (2010). Simulating microdosimetry in a virtual hepatic lobule. PLoS Comput. Biol. 6:e1000756. doi:10.1371/journal.pcbi.1000756
Weiss, M., Li, P., and Roberts, M. S. (2012). Estimation of sinusoidal flow heterogeneity in normal and diseased rat livers from tracer dilution data using a fractal model. Microcirculation 19, 723–728.
Xiong, H., Suzuki, H., Sugiyama, Y., Meier, P. J., Pollack, G. M., and Brouwer, K. L. R. (2002). Mechanisms of impaired biliary excretion of acetaminophen glucuronide after acute phenobarbital treatment or phenobarbital pretreatment. Drug Metab. Dispos. 30, 962–969.
Xiong, H., Turner, K. C., Ward, E. S., Jansen, P. L., and Brouwer, K. L. (2000). Altered hepatobiliary disposition of acetaminophen glucuronide in isolated perfused livers from multidrug resistance-associated protein 2-deficient TR(-) rats. J. Pharmacol. Exp. Ther. 295, 512–518.
Zaldivar Comenges, J. M., Menecozzi, M., Macko, P., Rodriguez, R., Bouhifd, M., and Baraibar Fentanes, J. (2011). A Biology-Based Dynamic Approach for the Modelling of Toxicity in Cell Assays: Part II: Models for Cell Population Growth and Toxicity, JRC Scientific and Technical Reports, Ispra.
Zamek-Gliszczynski, M. J., Nezasa, K., Tian, X., Bridges, A. S., Lee, K., Belinsky, M. G., et al. (2006). Evaluation of the role of multidrug resistance-associated protein (Mrp) 3 and Mrp4 in hepatic basolateral excretion of sulfate and glucuronide metabolites of acetaminophen, 4-methylumbelliferone, and harmol in Abcc3−/− and Abcc4−/− mice. J. Pharmacol. Exp. Ther. 319, 1485–1491.
Keywords: acetaminophen, toxicity testing, pharmacokinetics, drug metabolism, hepatotoxicity
Citation: Diaz Ochoa JG, Bucher J, Péry ARR, Zaldivar Comenges JM, Niklas J and Mauch K (2013) A multi-scale modeling framework for individualized, spatiotemporal prediction of drug effects and toxicological risk. Front. Pharmacol. 3:204. doi: 10.3389/fphar.2012.00204
Received: 25 October 2012; Accepted: 17 December 2012;
Published online: 22 January 2013.
Edited by:
Olavi R. Pelkonen, University of Oulu, FinlandReviewed by:
Franz Worek, Bundeswehr Institute of Pharmacology and Toxicology, GermanyHannu Raunio, University of Kuopio, Finland
Copyright: © 2013 Diaz Ochoa, Bucher, Péry, Zaldivar Comenges, Niklas and Mauch. This is an open-access article distributed under the terms of the Creative Commons Attribution License, which permits use, distribution and reproduction in other forums, provided the original authors and source are credited and subject to any copyright notices concerning any third-party graphics etc.
*Correspondence: Juan G. Diaz Ochoa, Insilico Biotechnology AG, Meitnerstr. 8, D-70563 Stuttgart, Germany. e-mail: juan.diaz@insilico-biotechnology.com
†This article is dedicated to José Manuel Zaldivar Comenges.