Callosal connections of primary visual cortex predict the spatial spreading of binocular rivalry across the visual hemifields
- 1 Department of Neurophysiology, Max Planck Institute for Brain Research, Frankfurt am Main, Germany
- 2 Brain Imaging Center Frankfurt, Frankfurt am Main, Germany
- 3 Department of Psychology, Vanderbilt Vision Research Center, Vanderbilt University, Nashville, TN, USA
- 4 Department of Brain and Cognitive Sciences, Seoul National University, Seoul, South Korea
- 5 Frankfurt Institute for Advanced Studies, Goethe University, Frankfurt am Main, Germany
- 6 Ernst Strüngmann Institute in Cooperation with Max Planck Society, Frankfurt am Main, Germany
- 7 Department of Psychiatric Neurophysiology, University Hospital of Psychiatry, University of Bern, Bern, Switzerland
In binocular rivalry, presentation of different images to the separate eyes leads to conscious perception alternating between the two possible interpretations every few seconds. During perceptual transitions, a stimulus emerging into dominance can spread in a wave-like manner across the visual field. These traveling waves of rivalry dominance have been successfully related to the cortical magnification properties and functional activity of early visual areas, including the primary visual cortex (V1). Curiously however, these traveling waves undergo a delay when passing from one hemifield to another. In the current study, we used diffusion tensor imaging (DTI) to investigate whether the strength of interhemispheric connections between the left and right visual cortex might be related to the delay of traveling waves across hemifields. We measured the delay in traveling wave times (ΔTWT) in 19 participants and repeated this test 6 weeks later to evaluate the reliability of our behavioral measures. We found large interindividual variability but also good test–retest reliability for individual measures of ΔTWT. Using DTI in connection with fiber tractography, we identified parts of the corpus callosum connecting functionally defined visual areas V1–V3. We found that individual differences in ΔTWT was reliably predicted by the diffusion properties of transcallosal fibers connecting left and right V1, but observed no such effect for neighboring transcallosal visual fibers connecting V2 and V3. Our results demonstrate that the anatomical characteristics of topographically specific transcallosal connections predict the individual delay of interhemispheric traveling waves, providing further evidence that V1 is an important site for neural processes underlying binocular rivalry.
Introduction
The phenomenon of binocular rivalry has been studied for almost 200 years now (Wheatstone, 1838) and has recently inspired the search for the neural correlates of conscious perception (Logothetis, 1998; Tong, 2003). During rivalry, visual stimuli presented separately to the two eyes compete for dominance in subjective awareness, such that the interpretation of the visual display alternates between the two monocular images. In transition periods, perceptual change often starts at one location and spreads to the other parts of the scene, a phenomenon termed “traveling waves” (Wilson et al., 2001). Using psychophysical estimates of wave speed for differently sized rival stimuli, Wilson et al. (2001) found that these traveling waves of changing perceptual dominance spread over space with a characteristic speed well predicted by the cortical magnification factor for primary visual cortex (V1). In a series of follow-up studies, Lee et al. (2005, 2007) used functional magnetic resonance imaging (fMRI) to demonstrate a neural correlate of traveling waves in early visual cortex (V1–V3). Specifically, they found that peak activity along the cortical representation of the rival stimulus was systematically shifted in time, thus implying that traveling wave generation may indeed arise within V1 as suggested by earlier psychophysical results.
Interestingly, the original paper (Wilson et al., 2001) also found that observers reported a longer travel time for waves that crossed the visual midline (mean difference of about 170 ms). They surmised that this could arise from the interhemispheric transfer of visual information that is necessary for stimuli crossing between the left and right hemispheres of the visual cortex. Long-range connections between hemispheres through the corpus callosum (CC) or subcortical structures might introduce a slow-down in neural transmission. The aim of our study was twofold. First, we tested whether individuals show reliable differences in their delay of traveling wave times (ΔTWT) for rivalry propagating across the visual hemifields, by evaluating test–retest reliability across experimental sessions separated by several weeks. Second, using fMRI and diffusion tensor imaging (DTI), we investigated whether specific anatomical characteristics of the CC that linked the left and right portions of the early visual areas would be able to predict the individual ΔTWT values.
Materials and Methods
Participants
Nineteen participants whose ages ranged from 21 to 34 (mean age, 24; 10 males; 7 with a left eye dominance) took part in the study. All participants were right-handed as measured by the Edinburgh Handedness Inventory (Oldfield, 1971) and none had any history of psychiatric or neurological disorders. Ocular dominance was determined using the Miles test (Chaurasia and Mathur, 1976). All participants had normal or corrected-to-normal vision and were either paid for participation or received course credit. Written informed consent was obtained from all participants. Only individuals who reliably perceived traveling waves in the practice runs were used in the main experiment; this group comprised about 70% (19 out of 28) of those initially screened. Psychophysical tests took place in two sessions, with an interval of about 6 weeks between test and retest. We acquired DTI data and standard fMRI retinotopic mapping scans from all participants.
Stimuli
We used two monocular, annularly shaped gratings similar to those described by Wilson et al. (2001) and Lee et al. (2005). The rivalry display consisted of a high-contrast spiral pattern of 50% Michelson contrast shown to one eye (see Figure 1A), and a low-contrast radial pattern display shown at 12% contrast to the other eye (see Figure 1B). The high-contrast spiral pattern had a pitch angle of 45° and a spatial frequency of 3.64 cycles/degree, with a faint greenish hue added to enhance the perceptual salience of the traveling wave (luminance: 7.7 cd/m2; luminance of the dark phase: 2.54 cd/m2). The spatial frequency of the grayish radial grating was 2.55 cycles/degree (luminance of the dark phase: 31.5 cd/m2; of the bright phase: 39.27 cd/m2). The diameters of the outer edge of the two monocular annuli were 10 cm, corresponding to a visual angle of 7.85°. The annuli were 2 cm wide (1.6°). The inner edge had a diameter of 6 cm or 4.7° in visual angle. In the center of the annuli was a bull’s eye-like fixation point. The spatial configuration of these narrow, annularly shaped rival targets effectively constrains the path of perceptual traveling waves, making it straightforward to induce the waves and measure their speed.
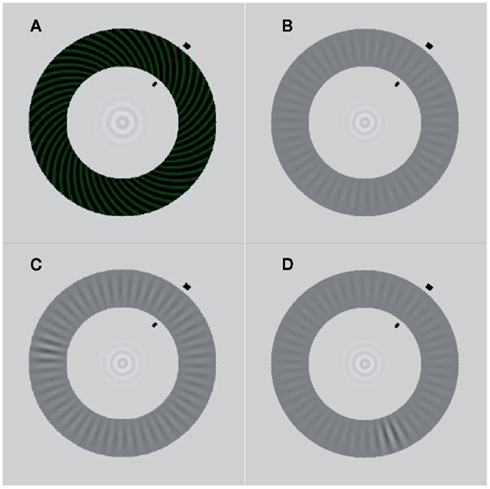
Figure 1. Stimuli. (A) High-contrast spiral pattern (dominant stimulus). (B) Low-contrast radial pattern (target stimulus). (C) Contrast increment in the upper left quadrant of the target stimulus. The induced wave that propagates along the shorter section between trigger and arrival point (black lines) travels along the interhemispheric path. (D) Contrast increment in the lower right quadrant of the target stimulus. The induced wave that propagates along the shorter section between trigger and arrival point travels along the intrahemispheric path.
Stimuli and experimental procedure were generated in MATLAB 7.3.0 (R2006b) using Psychtoolbox 3.0.8 (Brainard, 1997; Pelli, 1997). Stimuli were presented on a 19″ CRT monitor (1,024 × 768 resolution, 120 Hz refresh rate). For the monocular projection of different images to the two eyes, participants wore Stereo Graphics Shutter Glasses that were synchronized with the monitor’s refresh rate by a Crystal Eyes Workstation (RealD, Beverly Hills, CA, USA)1.
Experimental Procedure
During the experiment, participants’ head position was stabilized using a chin rest at a distance of 73 cm to the screen. Participants were asked to maintain strict fixation on the bull’s eye at the center of the annuli. We used the interocular flash-suppression technique introduced by Wolfe (1984). On each trial, the low-contrast radial pattern (the “target”) was presented to one eye and, then 1.25 s later, the high-contrast spiral pattern was presented to the corresponding retinal location of the other eye. This sequence typically resulted in perceptual suppression of the target stimulus. After 0.83 s, an abrupt, local increment in the contrast of the radial target stimulus appeared for 0.375 s. The size of the increment was three spatial cycles (1.18°) of the radial grating and it increased the contrast of the low-contrast grating locally from 12 to 27% (luminance of the dark phase: 23.03 cd/m2, of the bright phase: 40.1 cd/m2). As expected (Wilson et al., 2001), the abrupt onset of this increment triggered a change in perceptual dominance, causing the previously suppressed target pattern to become perceptually dominant immediately at the location of the trigger, which, in turn, tended to induce a wave of spreading dominance of the target that traveled around the annulus. Participants were instructed to press a button as soon as the wave reached an arrival point that was clearly designated by two short, black lines at the inner and outer boundaries of the annuli. Participants were asked to respond only to the wave that traveled along the shorter section between trigger and arrival point (see Figure 2). The background remained light gray (luminance: 91.8 cd/m2). The arrival point position varied between blocks of trials, and arrival point markers were presented at one of four positions (50°, 130°, 230°, 310° in relation to the 3 o’clock position in the annuli). These positions were chosen to cover all quadrants and to ensure that waves induced by the triggers traveled either along an intra- or interhemispheric path. Per arrival point, there were two possible trigger points, located at a distance of 120° to both sides of the arrival point (see Figures 1C,D).
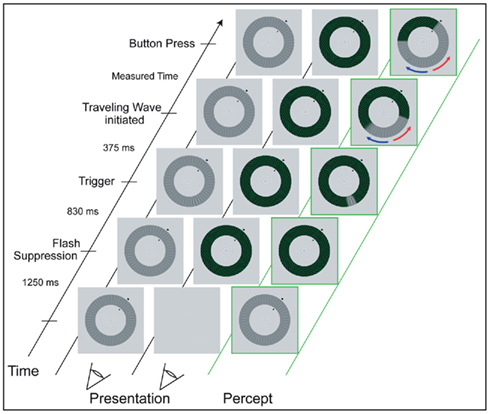
Figure 2. Experimental procedure of the psychometric measurements (see text for a detailed description). While maintaining fixation on the small, central bull’s eye figure, participants monitored the perceptual wave that traveled along the shorter section between trigger location and arrival point (red arrow). The two columns to the left show the dissimilar images that are presented monocularly, while the green right column illustrates the resulting percept.
The time the wave needed to travel the distance of 7.38° in visual angle along the shorter path was measured based on the time elapsed from the appearance of the trigger to the participant’s button press indicating that the wave had reached the arrival point. After each trial, participants verified whether they had actually seen the trigger-induced wave traveling toward the arrival point and whether they had reacted in time by pressing a “yes” or “no” key. Runs consisted of at least 12 positive trials per trigger point, with negative trials (i.e., trials when waves were unsuccessfully triggered or when triggered waves dissipated before reaching the arrival point) discarded from further analysis. Participants had to complete eight runs in total, two runs per arrival point position. To control for participants’ ocular dominance, the number of runs in which the target stimulus was presented to the right eye was equal to the number of runs in which it was presented to the left eye. In total, participants had to complete at least 192 trials in one session. Participants were familiarized with the instructions and the stimuli in eight test trials, which preceded the actual experiment. The same procedure was repeated after 6 weeks.
Analysis of Behavioral Data
Correlation and regression analyses were performed using R, version 2.10.12 and the car package3. For all analyses, linear parametric methods were used, i.e., Pearson coefficients for correlation and the general linear model for multiple regression. Statistical tests were performed using two-tailed tests with an α-level of 0.05. Data from the psychophysical measurements were corrected for outliers by removing trials with speed estimates outside the range of 2 SD from the mean for each individual.
Means were computed for interhemispheric traveling wave times (interTWT; wave start and end points in different visual hemifields) and intrahemispheric traveling wave times (intraTWT; wave start and end points in the same visual hemifield). To estimate the amount of time required for interhemispheric transfer of the traveling wave, we calculated the difference between these two measures (ΔTWT = interTWT − intraTWT). The intraTWT, interTWT, and ΔTWT estimates from the two test periods (separated by 6 weeks) were correlated to determine test–retest reliability. Since we controlled for participants’ ocular dominance, we were able to estimate intraTWT, interTWT, and ΔTWT separately for both eyes. This allowed us to determine a version of parallel-test or split-half reliability for the different measures. We estimated an average intraTWT across the two time points for each eye and then correlated the intraTWT of the left eye with the intraTWT of the right eye. The same procedure was performed for interTWT and ΔTWT. For regression analyses of the relationship between ΔTWT and measures of microstructural integrity, the average ΔTWT of the two time points was entered as dependent variable and the different measures derived from the diffusion data were entered as independent variables, either individually or in multiple-regression analyses.
Acquisition of Imaging Data
All data were acquired at the Brain Imaging Center Frankfurt am Main, Germany using a Siemens 3-T Trio scanner (Siemens, Erlangen, Germany) with a eight-channel head coil and maximum gradient strength of 40 mT/m.
Anatomical imaging
For coregistration and anatomical localization of functional and diffusion tensor data, a T1-weighted anatomical image of 1 mm × 1 mm × 1 mm was acquired in each of the two sessions (MP-RAGE, TR = 2250 ms, TE = 2.6 ms, flip angle: 9°, FoV: 256 mm).
Diffusion tensor imaging
The diffusion-weighted data were acquired using single-shot spin-echo echo-planar-imaging (EPI; TR = 8200 ms, TE = 99 ms, slice thickness = 2 mm, FoV = 192 mm, voxel size = 2.0 mm × 2.0 mm × 2.0 mm, matrix size = 96 × 96). Diffusion weighting was isotropically distributed along 60 directions using a b-value of 1000 s/mm2. Additionally, 10 data sets with no diffusion weighting were acquired initially as anatomical reference for motion correction and for computation of diffusion coefficients during the diffusion sequence. To increase signal-to-noise, we acquired three consecutive scans that were subsequently averaged. Total acquisition time for diffusion imaging was 30 min.
Retinotopic mapping
Participants were presented with both eccentricity and polar-angle stimuli. However, only the data of the polar-angle mapping experiment were used for further analysis. Stimuli were generated with a custom-made program based on the Microsoft DirectX library (Muckli et al., 2005) and presented using a MR-compatible goggle system with two organic light-emitting-diode displays (MR Vision 2000; Resonance Technology, Northridge, CA, USA). In the polar-angle mapping experiment, a wedge-shaped checkerboard pattern subtending up to 30° visual angle was presented. The wedge started at the right horizontal meridian and slowly rotated clockwise around the fixation point for a full circle of 360°. The mapping experiment consisted of 12 repetitions of rotation, each cycle lasting for 64 s. Participants had no further task but to fixate on the central fixation point. For the polar-angle mapping experiment, a gradient-recalled EPI sequence with the following parameters was applied: 33 slices, TR = 2000 ms, TE = 30 ms, flip angle = 90°, FoV = 192 mm, slice thickness = 3 mm, gap thickness = 0.3 mm, voxel size = 3.0 mm × 3.0 mm × 3.0 mm. The acquisition time for the retinotopic mapping was 22 min.
Analysis of Functional Data
Functional data to localize the retinotopic neural representation of visual space were analyzed using BrainVoyager QX 2.0.8 software (Brain Innovation, Maastricht, the Netherlands)4. Pre-processing steps included motion correction, linear trend removal, and temporal high-pass filtering. The analysis of the polar-angle mapping experiment was conducted by the use of a cross-correlation analysis (Muckli et al., 2005). The boundaries of retinotopic cortical areas V1, V2, and V3 were estimated manually on the inflated cortical surface generated from each participant’s anatomical data set. After the selection of the cortical areas V1, V2, and V3 on the inflated cortical surface, the area was projected back into the three-dimensional participant-specific native space by selecting voxels with a maximum distance of 2 mm from the gray/white matter boundary. The V1, V2, and V3 three-dimensional masks were generated for each hemisphere for a total of 38 hemispheres. These masks were exported out of Brain Voyager QX using a NIfTI converter developed by Brain Innovation (Maastricht, the Netherlands) to continue the analysis in FSL5. Using FLIRT, part of the FSL toolbox, these masks were transformed into diffusion space for tractography analysis. Data from each participant were visually inspected to confirm that the transformation procedure was successful. The sizes of the V1, V2, and V3 masks averaged 1000 voxels (8000 mm3) in diffusion space for each hemisphere.
Analysis of Diffusion Data
Diffusion tensor modeling and probabilistic tractography were performed using FDT (FMRIB’s Diffusion Toolbox) implemented in FSL. Pre-processing steps included (i) correction for eddy current and head motion, (ii) correction of the gradient direction for each volume using the rotation parameters from the head motion. For the evaluation of white-matter microstructure, three maps of quantitative diffusion parameters were calculated with the resulting three eigenvalues (λ1, λ2, and λ3) in each voxel, namely the fractional anisotropy (FA), axial diffusivity (AD), and radial diffusivity (RD). FA maps were obtained using the equation provided by Basser and Pierpaoli (1996). AD maps were computed as the first eigenvalue (λ1), which represents the main diffusion direction, corresponding to the main fiber axis (left–right) in the CC. RD maps were obtained using the mean of the eigenvalues λ2 and λ3 with high values indicating high diffusion in the direction perpendicular to the main fiber direction.
Masks for V1, V2, and V3 in both hemispheres were defined in diffusion space to serve as target regions for fiber tracking. To define the seed region, a mask covering the whole CC was created separately for each participant. This was done by drawing manually onto the CC in diffusion space, starting from the midsagittal plane and then expanding the mask by two voxels to the left and to the right, respectively, in total covering five voxels of the CC along the x-axis. Estimation of tracts was performed using probabilistic tractography using published methods in the FSL environment; the details of the procedure have been described elsewhere (Behrens et al., 2003). We used a dual-fibers model as implemented in the latest version of bedpostX. The model allows for the representation of two fiber orientations per voxel when more than one orientation is supported by the data. This allows modeling of crossing fibers, and produces more reliable results compared to single-fiber models (Behrens et al., 2007). The result is a brain image where all voxels have a value that represents the connectivity between that voxel and the voxels in the seed region. Fiber tracking was done probabilistically in each participant’s diffusion space, using 25000 tract-following samples at each voxel; the step length was set to 0.5 mm and curvature threshold of 0.2 was chosen. Tracts were generated from each seed voxel within the CC mask, and only tracts entering the target masks were retained. Target masks were also set as waypoint and termination masks to prevent the tract from projecting into other areas. For each participant, six different tracts were calculated (see Figures 3A,B), each connecting a pair of masks consisting of: (1) the CC mask and the left V1, (2) the CC mask and the right V1, (3) the CC mask and the left V2 mask, (4) the CC mask and the right V2 mask, (5) the CC mask and the left V3, (6) the CC mask and the right V3. To remove spurious connections, the raw V1, V2, and V3 tracts of individual participants were thresholded to include only voxels that had at least 12500 samples passing through them (probability threshold of 0.5). The reason for applying such high thresholds in the generation of the V1, V2, and V3 tracts was to differentiate callosal segments most likely connecting V1, V2, and V3.
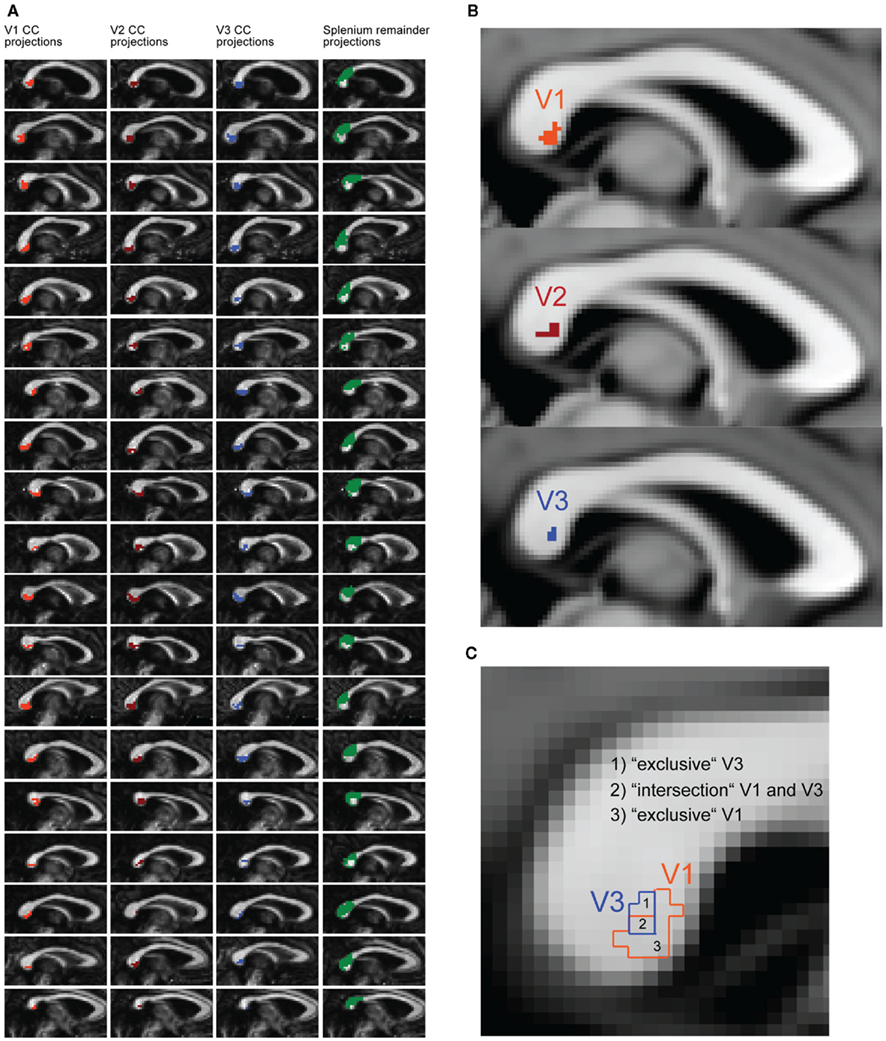
Figure 3. Tractography results and schematic description of the parcellation logic for the transcallosal fibers. (A) Midsagittal tracking results of every participant overlaid on each individual’s corpus callosum (CC). Transcallosal fiber connections are plotted for regions that project to functionally localized regions of V1 (orange), V2 (dark red), and V3 (blue). The green area represents the splenium, anatomically defined, excluding the projections from V1, V2, and V3 (splenium remainder). (B) Display of the group-analysis results for V1 (orange), V2 (dark red), and V3 (blue) CC segments. Individual CC segments were non-linearly transformed into MNI space. Only voxels are displayed that were part of V1, V2, V3 CC segments in at least 14 out of 19 participants. (C) Schematic description of subregions in the CC. The subregions for V1 (orange) and V3 (blue) were defined according to the fiber tracking results. Because the V1 and V3 subregions overlapped in most participants, an additional regression was performed with the “intersection” and “exclusive” segments of V1 and V3.
To determine the microstructural integrity of the specific CC segment that interconnects left and right V1, a combined tracking approach was used (Westerhausen et al., 2009). After calculating the sum of the thresholded tracts connecting the CC with the left and right V1, only those voxels in the CC containing fiber projections of V1 of both hemispheres were selected. From the identified V1 CC segment, quantitative diffusion parameters (FA, RD, AD) were extracted and averaged for the subsequent correlation analysis. The same tracking procedure was also applied for V2 and V3.
Additional analysis of V1 fiber tract
Position and size of the V1 CC segment were determined by the applied probability threshold for the tracts between the CC and the target area V1. Here, lower threshold values will increase and higher values will decrease the size of the CC segments. Thus, in order to rule out potential influences of the thresholding procedure on the extracted microstructural properties of the V1 CC segment and the resulting estimates of the correlation between structural variables and behavior, a different probability threshold value of 0.25 was applied for the V1 tracts (i.e., at least 6250 samples passing through a voxel) to extract an alternative (and larger) V1 CC segment for each participant. The resulting segment was significantly larger than the previous one, t(18) = −14,30, p < 0.001 (size “0.5 probability threshold” in voxels, M = 37, SD = 13; size “0.25 probability threshold” in voxels, M = 55, SD = 15). All analyses were also performed for this second V1 segment.
Sub-parcellation procedure for the visual corpus callosum segments
It was found that the V1 CC segment was partially overlapping with the V3 CC segment. To create CC segments that exclusively represented a given cortical projection, the identified CC segments were separated into an “exclusive” and an “intersection” sub-segment (see Figure 3C). Two “exclusive” segments (V1 without V3; V3 without V1) and one “intersection” segment (V1 and V3 overlapping) were created. Again, the revealed sub-segments were transferred to the maps of the quantitative diffusion parameters to extract the microstructural properties for correlation analysis.
Geometry-based tract segmentation
To compare the tractography-based tract segmentation with the traditional approaches for the quantification of callosal variability, we also performed a standardized geometrical parcellation of the CC. For this purpose, the midsagittal length of the maximal anterior–posterior extent of the CC mask of each participant in diffusion space was measured and a splenium mask was created manually according to the Witelson (1989) scheme. As defined by the scheme, the splenium is the posterior fifth of the CC in relation to its length along the y-axis. We performed the same correlation analysis on the splenium mask to determine whether the quantitative diffusion parameters in this structure might account for interhemispheric delays in the spatial spreading of rivalry dominance. Additional control analyses were performed using a splenium sub-segment, in which the V1, V2, and V3 CC segments were excluded from the splenium (splenium remainder).
Results
Behavioral Data
We computed traveling-wave times for the intrahemispheric (intraTWT) and interhemispheric (interTWT) spread of dominance. Traveling times for interTWT (M = 1907 ms, SD = 865 ms) were longer than for intraTWT (M = 1854 ms, SD = 840 ms), although the mean difference between interTWT and intraTWT of 53 ms (SD = 148 ms) was not significant in our sample [t(18) = 1.56, p = 0.07, one-tailed, 95% CI: −18.6 to 124.6]. Analyses indicated large interindividual variability of both indices, but high test–retest reliability for individual participants over 6 weeks for the intraTWT [r(17) = 0.79, p < 0.001] and interTWT [r(17) = 0.77, p < 0.001; Figure 4A]. Since eye of presentation for the rival patterns was varied between runs, we were also able to calculate parallel-test reliabilities between eye configurations (averaged across the two time points). For both measures, reliabilities were at ceiling level [intraTWT, r(17) = 0.98, p < 0.001; interTWT, r(17) = 0.98, p < 0.001, Figure 4B]. No significant sex differences were found for the average intraTWT [t(18) = 1.56, p = 0.07, two-tailed] or interTWT [t(18) = −0.09, p = 0.73, two-tailed].
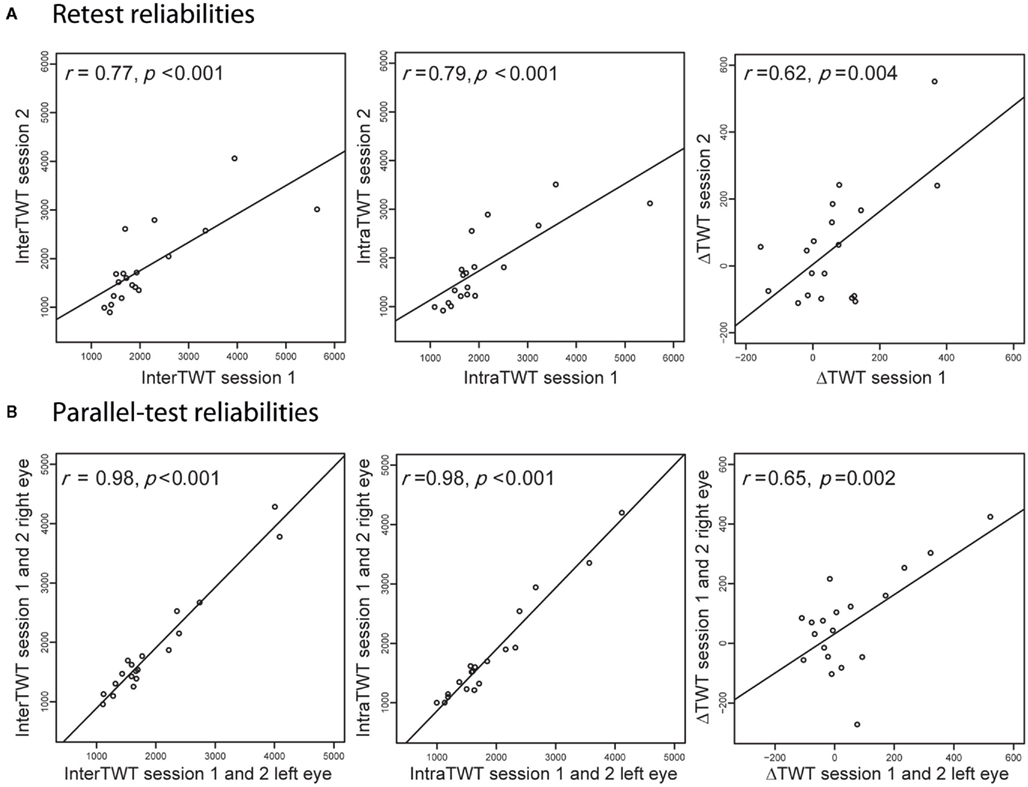
Figure 4. Reliability of the behavioral measures. (A) Analyses show high retest reliabilities for interhemispheric traveling wave time, intrahemispheric traveling wave time and the difference of the two indices (ΔTWT). (B) Analyses also show high parallel-test reliabilities for the same psychometric indices, indicating that these psychophysical measures are stable features in humans.
For the difference between interTWT and intraTWT (ΔTWT), we also found large interindividual variability, which was not significantly correlated with interTWT [r(17) = 0.26, p = 0.29] or intraTWT [r(17) = 0.09, p = 0.72]. Given that ΔTWT is a difference measure, we evaluated test–retest [r(17) = 0.62, p = 0.004] and parallel-test reliabilities [r(17) = 0.65, p = 0.002, Figures 4A,B] and found that these were high. Again, no sex differences were found for the average ΔTWT [t(17) = 1.03, p = 0.38] over the two time points. The behavioral results showed that the speed of traveling waves of dominance and the delay for transfer between hemispheres are stable traits of individual visual processing in participants.
fMRI and DTI Data
The most commonly used measure of microstructural integrity for DTI measures of white matter is FA. It represents the directional distribution of water diffusion in the respective part of the brain. FA reaches a high value when diffusion is predominantly in one direction and reaches the lowest possible value for equal diffusion in all directions. We found significant correlations between ΔTWT and the FA of those CC segments that interconnect left and right V1 [r(17) = 0.74, p < 0.001]. We also looked at the component measures from which FA is computed (see also Materials and Methods). In tissue as highly organized as the CC, the second and third eigenvalues can be averaged to characterize diffusion perpendicular to the main fiber direction (RD). Diffusion in the main fiber direction (left–right in the CC) corresponds to the first eigenvalue (AD). In accordance with a previous paper (Dougherty et al., 2007), we found that AD did not contribute significantly to ΔTWT prediction [r(17) = −0.35, p = 0.14], but there was a strong correlation with RD [r(17) = −0.72 and p < 0.001; Figure 5]. In hierarchical regression analyses, we confirmed that neither adding AD nor FA as predictors in a regression of ΔTWT on RD provided a significant increase in explained variance for the regression model [adding AD: F(1,16) = 0.54, p = 0.47; adding FA: F(1,16) = 2.55, p = 0.13]. Therefore, further analyses focused on RD as a measure of callosal microstructure.
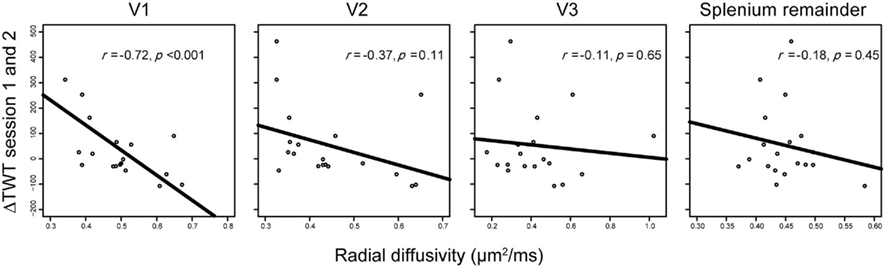
Figure 5. Correlations between interhemispheric delays and fiber properties of different callosal projections. Only radial diffusivity (RD) of V1 callosal projections predicted behavioral variance in ΔTWT; no reliable relationships were found between ΔTWT and RD in callosal projections of V2, V3, or the splenium remainder.
To examine the extent to which these structure–function relations are topographically specific within the CC, we compared correlations between ΔTWT and anatomical measures not only for the callosal segment linking V1 but also for the segments linking V2, V3, and parts of the posterior CC not covered by the V1–V3 segments (splenium remainder, see Materials and Methods). In a combined multiple-regression analysis with segment RDs as independent variables and ΔTWT as dependent variable, RD of the V1 and V3 CC segments were the only variables providing unique contributions to ΔTWT prediction [V1 segment, β = −1.08, t(14) = −5.927, p < 0.001; V3 segment, β = 0.663, t(14) = 3.569, p = 0.003; other predictors, p > 0.53]. However, separate bivariate analyses for the CC segments showed that only RD of the V1 CC segment correlated significantly with ΔTWT [V1 segment, r(17) = −0.72, p < 0.001]. No significant correlation was found between ΔTWT and RD of the other CC segments [V2, r(17) = −0.37, p = 0.11; V3, r(17) = −0.11, p = 0.65; splenium remainder, r(17) = −0.21, p = 0.38; see Figure 5]. A situation in which an independent variable shows no bivariate correlation with the dependent variable, but makes a significant contribution in the context of a multiple-regression analysis with other variables, is called “suppression” in statistics. The variable suppresses noise variance in other independent variables and thereby enhances predictive power of the variable set as a whole. In our data set, V3 RD seems to act as a suppressor variable, since it is only weakly related to ΔTWT on its own. Therefore, only RD of the V1 segment is directly associated with ΔTWT.
Correlation coefficients can be strongly influenced by a few exceptional cases. Therefore, we eliminated the most prominent outliers (Cook’s D > 0.10) from the analysis, both as a group and individually. For the V1 CC segment, we calculated correlation coefficients with various outliers removed, and repeatedly observed a strong relationship with r values ranging from −0.50 to −0.77, which were all significant at an alpha level of 0.05 (Table 1). Results for the control CC segments were non-significant in all cases [p(V2) > 0.10; p(V3) > 0.36; p(Spl) > 0.23].
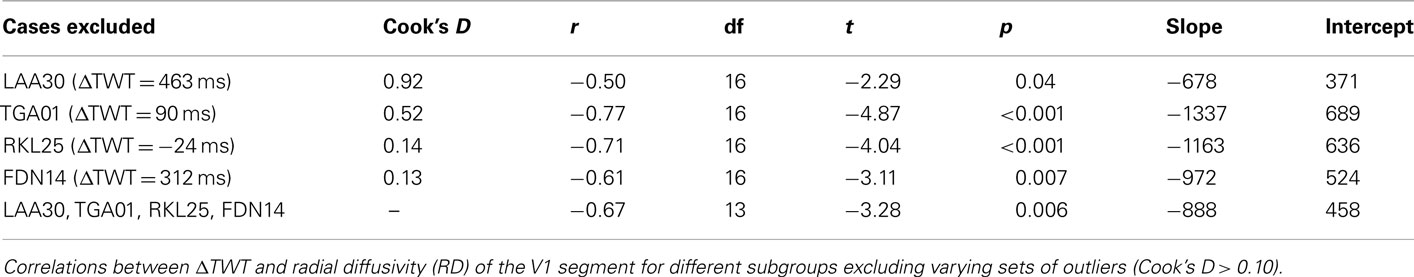
Table 1. Robustness of results with elimination of outliers.
We also considered the fact that our measures of ΔTWT revealed considerable variability in interhemispheric delay times across participants. Although the mean ΔTWT was 53 ms, a large number of participants had negative values in our data (see Figure 5). Looking more closely at the measurements for the first and second sessions (Figure 4, right panel), it can be seen that only four participants had negative ΔTWT values across both sessions, eight showed positive values in both sessions, and seven showed mixed results. Therefore, the overall trend in our data is in the same direction as the original study by Wilson et al. (2001), which reported a mean ΔTWT of 173 ms based on detailed psychophysical measurements of two experienced visual observers. A more extensive study would be needed to estimate the actual distribution of ΔTWT in the broader population. Nevertheless, in the present study one could ask whether the observed relationship between V1 callosal anatomy and behavioral estimates of interhemispheric delay might depend on a subset of participants exhibiting positive or negative ΔTWT values. After separating participants into the two subgroups, those with positive or negative ΔTWTs, we found that the correlation with V1 RD was strong and statistically significant in both subgroups, despite the splitting of the sample size [ΔTWT > 0: r(7) = −0.67, p = 0.049; ΔTWT < 0: r(8) = −0.80, p = 0.005].
To control for the effects of age and sex on the regression analyses, we performed a combined multiple-regression analysis with RD in the V1 CC segment, age and sex as independent variables and ΔTWT as dependent variable. The strong and unique relationship between V1 RD and ΔTWT remained stable [β = −0.61, t(15) = −3.09, p = 0.005; other predictors, p > 0.19].
Since our results are based on correlations between variables, we cannot exclude the existence of additional factors that might affect or drive the association between behavior and callosal microstructure. In a multiple-regression analysis, we included a number of control variables that are plausible candidates for alternative explanations. We considered the size of V1, the (logarithm of the) size ratio between left and right V1, the size of the callosal segments connecting V1, and the average probability values in the callosal V1 segments from the probabilistic tracking. The strong and unique relationship between V1 RD and ΔTWT remained stable even when these other predictor variables were partialed out [β = −0.76, t(13) = −3.66, p = 0.003]. Only the size of the callosal V1 segments made a marginal contribution to ΔTWT (p = 0.07, other predictors: p > 0.28).
Since the V1 and V3 CC segments showed some degree of overlap and both made significant contributions in the multiple-regression analysis, we created two CC segments of V1 and V3, respectively, that excluded the intersection of the two segments, and performed correlation analyses for these two newly defined segments as well as their intersection (see Figure 3C and Materials and Methods). Only RD in the “exclusive” V1 CC segment showed a significant correlation with ΔTWT [r(17) = −0.61, p = 0.005]. There was neither a significant effect in the intersection CC segment [r(17) = −0.33. p = 0.17] nor in the “exclusive” V3 CC segment [r(17) = 0.07, p = 0.74].
Defining the V1 CC segment by a more liberal tract threshold (value = 0.25) also did not affect the outcome (see Materials and Methods). A separate correlation analysis with the RD of the “liberal” V1 CC segments and ΔTWT showed that the relationship between microstructure and behavior remained statistically significant [r(17) = −0.60, p = 0.007]. One reason for the weakening of correlations could be the expanded size of the V1 CC segments (size “0.5 threshold” in voxels, M = 37, SD = 13; size “0.25 threshold” in voxels, M = 55, SD = 15), which might reduce the accuracy of isolating V1-specific projections in the CC.
We focused our analyses on RD because, in accordance with a previous study (Dougherty et al., 2007), we found that the first eigenvalue did not contribute to the correlation between microstructure and ΔTWT, which also affects correlations with FA. Nevertheless, since FA is widely used as a main marker of microstructural integrity, we performed the main analyses with FA values. With regard to the anatomical specificity of results, we performed multiple-regression of ΔTWT on FA values of the V1, V2, V3, and splenium remainder CC segments. FA of the V1 and V3 CC segments were the only variables providing a unique contribution to ΔTWT prediction [V1 segment, β = 0.97, t(14) = 4.85, p < 0.001; V3 segment, β = −0.52, t(14) = −2.31, p = 0.03; other predictors, p > 0.56]. But again, separate correlation analyses for the segments showed that only FA of the V1 CC segment contributed to ΔTWT prediction [V1 segment, r(17) = 0.74, p < 0.001]. No correlation was found between FA of the V3 CC segment and ΔTWT [V3 segment, r(17) = 0.17, p = 0.48]. Also, separate correlation analyses between the two additional control segments and ΔTWT did not reveal significant effects [V2 segment, r(17) = 0.41, p = 0.07; splenium remainder, r(17) = 0.22, p = 0.36].
Discussion
Our results demonstrate that the propagation times of traveling waves during binocular rivalry within and across hemispheres are stable characteristics of visual processing. In addition, we found that the individual delay introduced by interhemispheric transit (ΔTWT) also has a high reliability, although lower than the absolute travel times. We investigated the relationship between ΔTWT and microstructural values of specific CC segments connecting early visual areas in healthy humans, which revealed a very specific association of ΔTWT with the CC segments connecting V1 of the two hemispheres. No significant correlations were found for neighboring CC segments (V2, V3, and splenium remainder) in the posterior part of the CC.
The observed stability of the propagation time of traveling waves in our study is in accordance with findings of other studies focusing on the alternation rate during binocular rivalry (Pettigrew and Miller, 1998; Miller et al., 2010; Shannon et al., 2011). The alternation rate for a given observer is the average rate of switches (in Hz) between the two possible percepts for prolonged stimulation. Previous studies have found that the alternation rate is highly reliable (≥0.80) over time when tested weeks or even months later. Interestingly, there is also evidence for a substantial genetic contribution to individual variation in alternation rate (Miller et al., 2010; Shannon et al., 2011) and, moreover, the alternation rate for binocular rivalry is correlated with alternation rates of other bistable phenomena (Shannon et al., 2011). Considered together, these patterns of results suggest the existence of a global genetic factor governing visual bistability.
In general terms, perceptual alternation during binocular rivalry is thought to result from inhibitory interactions between neural representations of the different percepts (Lehky, 1988). Early models mainly focused on competition between eye-specific channels (Blake, 1989), but recent evidence suggests that rivalry can occur on multiple levels of the visual hierarchy (Blake and Logothetis, 2002; Wilson, 2003; Tong et al., 2006). Apart from random fluctuations, changes in perceptual dominance over time are caused by increasing adaptation of the dominant representation with concurrent release from inhibition for the suppressed stimulus (Alais et al., 2010). Traveling wave propagation, too, can be modeled with mutually inhibitory, adaptable neural ensembles (Wilson et al., 2001). In this model, wave propagation is introduced through laterally spreading inhibition between ocular dominance columns. To account for the influence of collinear facilitation on wave speed, long-range excitatory connections are required as an additional element. It is interesting to note that individuals who tend to experience fast traveling waves also tend to exhibit faster rates of rivalry alternations, suggesting that traveling waves and alternation rate may have common neural bases (Kang et al., 2009).
In binocular rivalry research, there is long-standing debate on where within the cortical hierarchy neural competition between rivaling interpretations is initiated and where it is resolved (Blake, 1989; Logothetis, 1998; Leopold and Logothetis, 1999; Blake and Logothetis, 2002). Resolution of that debate may in turn have implications for identifying the neural correlates of conscious perception (Rees et al., 2002; Tong, 2003; Knapen et al., 2011). Due to the separated inputs to the two eyes, early models assumed that rivalry is determined by eye-specific channels especially in V1 (Blake, 1989) and imaging studies found activation patterns in V1 (Polonsky et al., 2000; Tong and Engel, 2001; Lee and Blake, 2002) and even the lateral geniculate nucleus (Haynes et al., 2005; Wunderlich et al., 2005) corresponding to the conscious perception of observers. But electrophysiological studies in macaque monkeys (Logothetis and Schall, 1989; Leopold and Logothetis, 1996; Sheinberg and Logothetis, 1997) and psychophysical studies in humans (Kovács et al., 1996; Logothetis et al., 1996; Ngo et al., 2000) suggested that, at least for specific stimuli, interactions at higher levels of visual processing are relevant for the resolution of perceptual conflict. For the traveling wave, activation patterns in early visual areas V1–V3 have been found to correlate with the perceived wave propagation time (Lee et al., 2005). In V1 this correspondence is preserved even when attention is drawn away from the stimulus and conscious awareness of the wave propagation is presumably absent (Lee et al., 2007), pointing to V1 as a lynchpin locus of the neural circuitry associated with traveling waves. Psychophysical evidence also points to V1 as the main correlate even for waves in complex images (Arnold et al., 2009), although there are certain wave features that cannot be exhaustively explained by characteristics of early visual cortex (Naber et al., 2009). Our data support the view that V1 is integrally involved in traveling waves, showing a very specific effect for V1 connections between hemispheres.
In our analysis, we correlated different DTI parameters with our behavioral measure. For any given DTI voxel, diffusion can be represented by the three orthogonal main diffusion directions of the diffusion ellipsoid called “eigenvalues.” AD corresponds to the first eigenvalue (λ1) and represents the dominant diffusion direction. RD is the average of the two remaining eigenvalues (λ2 and λ3) representing diffusion in the plane orthogonal to the main diffusion direction. Especially in the CC, combining λ2 and λ3 is justified by the fact that the two values are highly correlated (r > 0.9; Dougherty et al., 2007; Genç et al., 2011). We found that only RD and FA were significant predictors of ΔTWT, but not AD. Also, neither FA nor AD explained variance in addition to RD in a hierarchical regression model. Since FA is a non-linear combination of the three eigenvalues (Basser and Pierpaoli, 1996) and therefore of AD and RD, it inherits the predictive weakness of AD and apparently does not gain predictive power by the non-linear combination of the components. Other studies have also found correlations with behavioral variables specific to RD in the CC (Dougherty et al., 2007), as well as the arcuate fasciculus (Yeatman et al., 2011). It is unknown why AD was not reliably correlated with the behavioral measures in these studies. Danielian et al. (2010) investigated the reliability of DTI parameters in repeated measurements separated by up to one year. They found very high reproducibility for FA and RD, but not for AD. Interestingly, along the same lines, another study found a high heritability for FA and RD in a large sample of participants, and a low heritability for AD (Kochunov et al., 2010). This suggests that the AD measure is either unreliable and/or does not correspond to a behaviorally relevant feature of white-matter connections.
There are a number of physiological factors that potentially influence diffusion measures of white-matter microstructure including axon diameter, fiber density, myelination, and fiber-orientation distribution (Beaulieu, 2002; Le Bihan, 2003). The relationship between ΔTWT and RD in our data revealed a strong negative correlation. A plausible interpretation of our results is that greater RD values are produced by larger axon diameters in the V1 callosal segment (Takahashi et al., 2002; Barazany et al., 2009) and therefore afford a faster nerve-conduction velocity in those connections (Caminiti et al., 2009). Faster nerve-conduction velocity, in turn, would lead to a reduced delay in the interhemispheric transfer of the traveling wave. A number of previous studies found correlation signs that are in agreement with our physiological interpretation (Westerhausen et al., 2006; Dougherty et al., 2007; Imfeld et al., 2009; Jäncke et al., 2009; Hänggi et al., 2010; Elmer et al., 2011; Genç et al., 2011), but there are also many other studies with correlation signs that are better explained by differences in myelination and fiber density (Bengtsson et al., 2005; Boorman et al., 2007; Johansen-Berg et al., 2007; Wahl et al., 2007; Rudebeck et al., 2009; Scholz et al., 2009; Fleming et al., 2010; Kanai et al., 2010; Tomassini et al., 2010), and a few studies show both correlation directions for different relevant structures (Schmithorst and Wilke, 2002; Tuch et al., 2005; Roberts et al., 2010; Voineskos et al., 2010). In the visual domain, Westerhausen et al. (2006) found that higher mean diffusivity in the posterior CC is correlated with faster interhemispheric transfer, in line with our results, but other studies with a similar design could not support their finding (Schulte et al., 2005; Whitford et al., 2011). For the future, a promising DTI measure that might arbitrate between the possible physiological interpretations is the recently described “bound pool fraction” (Stikov et al., 2011), which is a more direct measure of myelin content and would help to disambiguate between the possible interpretations.
Our tracking results for CC connections of early visual cortex are in good agreement with previous work (Dougherty et al., 2005; Putnam et al., 2010; Saenz and Fine, 2010). Tracer studies in humans and other animals showed that interhemispheric connections between left and right V1 are confined to the border region between V1 and V2, where the vertical meridian of the visual field is represented (Choudhury et al., 1965; Clarke and Miklossy, 1990). It is therefore difficult to strictly separate V1 and V2 interhemispheric connections with DTI methodology, whereas the separation is clearer for V3 (Clarke and Miklossy, 1990). This might explain why values for V2 showed a trend toward significance for the correlations with interhemispheric delay. V3 made a significant contribution in the multiple-regression analysis, but the bivariate correlation with ΔTWT was very weak, suggesting that the V3 contribution is only due to suppression of noise variance in other predictors. The suppression effect can most likely be explained by the overlap between the CC segments of V1 and V3. Despite the caveats, the degree of anatomical specificity in our results is quite striking and provides strong evidence for a highly selective V1 effect in our DTI measures of the early visual cortex.
In conclusion, we found that the properties of V1 interhemispheric connections are a good predictor of the individual delay in traveling waves crossing the midline of the visual field. This supports the claim that V1 is a vital hub for the neural mechanisms underlying binocular rivalry and propagation of traveling waves and shows that an important part of the interhemispheric transmission in early visual areas is accomplished through the CC in healthy individuals. In addition, we established that propagation speed and interhemispheric delay of the traveling wave are stable measures of subjective experience in observers.
Conflict of Interest Statement
The authors declare that the research was conducted in the absence of any commercial or financial relationships that could be construed as a potential conflict of interest.
Acknowledgments
This work was supported by the Max Planck Society, the Federal Ministry of Education and Research in Germany (BMBF 01 GO 0508) and by the World Class University program through the Korea Science and Engineering Foundation funded by the Ministry of Education, Science and Technology (R31-10089). The authors thank Arjen Alink, Kerstin Schmidt, Caspar Schwiedrzik, Sarah Weigelt, Michael Wibral, and Ulf Ziemann for helpful discussions on design and interpretation of the experiments as well as Ralf Deichmann, Sandra Anti, Steffen Volz, Ulrike Nöth, and Thomas Sattler for support with the MRI measurements. The authors declare no competing financial interests.
Footnotes
References
Alais, D., Cass, J., O’Shea, R. P., and Blake, R. (2010). Visual sensitivity underlying changes in visual consciousness. Curr. Biol. 20, 1362–1367.
Arnold, D. H., James, B., and Roseboom, W. (2009). Binocular rivalry: spreading dominance through complex images. J. Vis. 9, 13(4).
Barazany, D., Basser, P. J., and Assaf, Y. (2009). In vivo measurement of axon diameter distribution in the corpus callosum of rat brain. Brain 132, 1210–1220.
Basser, P. J., and Pierpaoli, C. (1996). Microstructural and physiological features of tissues elucidated by quantitative-diffusion-tensor MRI. J. Magn. Reson. B 111, 209–219.
Beaulieu, C. (2002). The basis of anisotropic water diffusion in the nervous system – a technical review. NMR Biomed. 15, 435–455.
Behrens, T. E., Berg, H. J., Jbabdi, S., Rushworth, M. F., and Woolrich, M. W. (2007). Probabilistic diffusion tractography with multiple fibre orientations: What can we gain? Neuroimage 34, 144–155.
Behrens, T. E., Woolrich, M. W., Jenkinson, M., Johansen-Berg, H., Nunes, R. G., Clare, S., Matthews, P. M., Brady, J. M., and Smith, S. M. (2003). Characterization and propagation of uncertainty in diffusion-weighted MR imaging. Magn. Reson. Med. 50, 1077–1088.
Bengtsson, S. L., Nagy, Z., Skare, S., Forsman, L., Forssberg, H., and Ullén, F. (2005). Extensive piano practicing has regionally specific effects on white matter development. Nat. Neurosci. 8, 1148–1150.
Boorman, E. D., O’Shea, J., Sebastian, C., Rushworth, M. F., and Johansen-Berg, H. (2007). Individual differences in white-matter microstructure reflect variation in functional connectivity during choice. Curr. Biol. 17, 1426–1431.
Caminiti, R., Ghaziri, H., Galuske, R., Hof, P. R., and Innocenti, G. M. (2009). Evolution amplified processing with temporally dispersed slow neuronal connectivity in primates. Proc. Natl. Acad. Sci. U.S.A. 106, 19551–19556.
Choudhury, B. P., Whitteridge, D., and Wilson, M. E. (1965). The function of the callosal connections of the visual cortex. Q. J. Exp. Physiol. Cogn. Med. Sci. 50, 214–219.
Clarke, S., and Miklossy, J. (1990). Occipital cortex in man: organization of callosal connections, related myelo- and cytoarchitecture, and putative boundaries of functional visual areas. J. Comp. Neurol. 298, 188–214.
Danielian, L. E., Iwata, N. K., Thomasson, D. M., and Floeter, M. K. (2010). Reliability of fiber tracking measurements in diffusion tensor imaging for longitudinal study. Neuroimage 49, 1572–1580.
Dougherty, R. F., Ben-Shachar, M., Bammer, R., Brewer, A. A., and Wandell, B. A. (2005). Functional organization of human occipital-callosal fiber tracts. Proc. Natl. Acad. Sci. U.S.A. 102, 7350–7355.
Dougherty, R. F., Ben-Shachar, M., Deutsch, G. K., Hernandez, A., Fox, G. R., and Wandell, B. A. (2007). Temporal-callosal pathway diffusivity predicts phonological skills in children. Proc. Natl. Acad. Sci. U.S.A. 104, 8556–8561.
Elmer, S., Hänggi, J., Meyer, M., and Jäncke, L. (2011). Differential language expertise related to white matter architecture in regions subserving sensory-motor coupling, articulation, and interhemispheric transfer. Hum. Brain Mapp. 32, 2064–2074.
Fleming, S. M., Weil, R. S., Nagy, Z., Dolan, R. J., and Rees, G. (2010). Relating introspective accuracy to individual differences in brain structure. Science 329, 1541–1543.
Genç, E., Bergmann, J., Singer, W., and Kohler, A. (2011). Interhemispheric connections shape subjective experience of bistable motion. Curr. Biol. 21, 1494–1499.
Hänggi, J., Koeneke, S., Bezzola, L., and Jäncke, L. (2010). Structural neuroplasticity in the sensorimotor network of professional female ballet dancers. Hum. Brain Mapp. 31, 1196–1206.
Haynes, J. D., Deichmann, R., and Rees, G. (2005). Eye-specific effects of binocular rivalry in the human lateral geniculate nucleus. Nature 438, 496–499.
Imfeld, A., Oechslin, M. S., Meyer, M., Loenneker, T., and Jäncke, L. (2009). White matter plasticity in the corticospinal tract of musicians: a diffusion tensor imaging study. Neuroimage 46, 600–607.
Jäncke, L., Koeneke, S., Hoppe, A., Rominger, C., and Hänggi, J. (2009). The architecture of the golfer’s brain. PLoS ONE 4, e4785. doi: 10.1371/journal.pone.0004785
Johansen-Berg, H., Della-Maggiore, V., Behrens, T. E., Smith, S. M., and Paus, T. (2007). Integrity of white matter in the corpus callosum correlates with bimanual co-ordination skills. Neuroimage 36(Suppl. 2), T16–T21.
Kanai, R., Bahrami, B., and Rees, G. (2010). Human parietal cortex structure predicts individual differences in perceptual rivalry. Curr. Biol. 20, 1626–1630.
Kang, M. S., Heeger, D., and Blake, R. (2009). Periodic perturbations producing phase-locked fluctuations in visual perception. J. Vis. 9, 2(8).
Knapen, T., Brascamp, J., Pearson, J., Van Ee, R., and Blake, R. (2011). The role of frontal and parietal brain areas in bistable perception. J. Neurosci. 31, 10293–10301.
Kochunov, P., Glahn, D. C., Lancaster, J. L., Winkler, A. M., Smith, S., Thompson, P. M., Almasy, L., Duggirala, R., Fox, P. T., and Blangero, J. (2010). Genetics of microstructure of cerebral white matter using diffusion tensor imaging. Neuroimage 53, 1109–1116.
Kovács, I., Papathomas, T. V., Yang, M., and Fehér, A. (1996). When the brain changes its mind: interocular grouping during binocular rivalry. Proc. Natl. Acad. Sci. U.S.A. 93, 15508–15511.
Le Bihan, D. (2003). Looking into the functional architecture of the brain with diffusion MRI. Nat. Rev. Neurosci. 4, 469–480.
Lee, S. H., Blake, R., and Heeger, D. J. (2005). Traveling waves of activity in primary visual cortex during binocular rivalry. Nat. Neurosci. 8, 22–23.
Lee, S. H., Blake, R., and Heeger, D. J. (2007). Hierarchy of cortical responses underlying binocular rivalry. Nat. Neurosci. 10, 1048–1054.
Leopold, D. A., and Logothetis, N. K. (1996). Activity changes in early visual cortex reflect monkeys’ percepts during binocular rivalry. Nature 379, 549–553.
Leopold, D. A., and Logothetis, N. K. (1999). Multistable phenomena: changing views in perception. Trends Cogn. Sci. 3, 254–264.
Logothetis, N. K. (1998). Single units and conscious vision. Philos. Trans. R. Soc. Lond. B Biol. Sci. 353, 1801–1818.
Logothetis, N. K., Leopold, D. A., and Sheinberg, D. L. (1996). What is rivalling during binocular rivalry? Nature 380, 621–624.
Logothetis, N. K., and Schall, J. D. (1989). Neuronal correlates of subjective visual perception. Science 245, 761–763.
Miller, S. M., Hansell, N. K., Ngo, T. T., Liu, G. B., Pettigrew, J. D., Martin, N. G., and Wright, M. J. (2010). Genetic contribution to individual variation in binocular rivalry rate. Proc. Natl. Acad. Sci. U.S.A. 107, 2664–2668.
Muckli, L., Kohler, A., Kriegeskorte, N., and Singer, W. (2005). Primary visual cortex activity along the apparent-motion trace reflects illusory perception. PLoS Biol. 3, e265. doi: 10.1371/journal.pbio.0030265
Naber, M., Carter, O., and Verstraten, F. A. (2009). Suppression wave dynamics: visual field anisotropies and inducer strength. Vision Res. 49, 1805–1813.
Ngo, T. T., Miller, S. M., Liu, G. B., and Pettigrew, J. D. (2000). Binocular rivalry and perceptual coherence. Curr. Biol. 10, R134–R136.
Oldfield, R. C. (1971). The assessment and analysis of handedness: the Edinburgh inventory. Neuropsychologia 9, 97–113.
Pelli, D. G. (1997). The VideoToolbox software for visual psychophysics: transforming numbers into movies. Spat. Vis. 10, 437–442.
Pettigrew, J. D., and Miller, S. M. (1998). A “sticky” interhemispheric switch in bipolar disorder? Proc. Biol. Sci. 265, 2141–2148.
Polonsky, A., Blake, R., Braun, J., and Heeger, D. J. (2000). Neuronal activity in human primary visual cortex correlates with perception during binocular rivalry. Nat. Neurosci. 3, 1153–1159.
Putnam, M. C., Steven, M. S., Doron, K. W., Riggall, A. C., and Gazzaniga, M. S. (2010). Cortical projection topography of the human splenium: hemispheric asymmetry and individual differences. J. Cogn. Neurosci. 22, 1662–1669.
Rees, G., Kreiman, G., and Koch, C. (2002). Neural correlates of consciousness in humans. Nat. Rev. Neurosci. 3, 261–270.
Roberts, R. E., Anderson, E. J., and Husain, M. (2010). Expert cognitive control and individual differences associated with frontal and parietal white matter microstructure. J. Neurosci. 30, 17063–17067.
Rudebeck, S. R., Scholz, J., Millington, R., Rohenkohl, G., Johansen-Berg, H., and Lee, A. C. (2009). Fornix microstructure correlates with recollection but not familiarity memory. J. Neurosci. 29, 14987–14992.
Saenz, M., and Fine, I. (2010). Topographic organization of V1 projections through the corpus callosum in humans. Neuroimage 52, 1224–1229.
Schmithorst, V. J., and Wilke, M. (2002). Differences in white matter architecture between musicians and non-musicians: a diffusion tensor imaging study. Neurosci. Lett. 321, 57–60.
Scholz, J., Klein, M. C., Behrens, T. E., and Johansen-Berg, H. (2009). Training induces changes in white-matter architecture. Nat. Neurosci. 12, 1370–1371.
Schulte, T., Sullivan, E. V., Müller-Oehring, E. M., Adalsteinsson, E., and Pfefferbaum, A. (2005). Corpus callosal microstructural integrity influences interhemispheric processing: a diffusion tensor imaging study. Cereb. Cortex 15, 1384–1392.
Shannon, R. W., Patrick, C. J., Jiang, Y., Bernat, E., and He, S. (2011). Genes contribute to the switching dynamics of bistable perception. J. Vis. 11, 3(8).
Sheinberg, D. L., and Logothetis, N. K. (1997). The role of temporal cortical areas in perceptual organization. Proc. Natl. Acad. Sci. U.S.A. 94, 3408–3413.
Stikov, N., Perry, L. M., Mezer, A., Rykhlevskaia, E., Wandell, B. A., Pauly, J. M., and Dougherty, R. F. (2011). Bound pool fractions complement diffusion measures to describe white matter micro and macrostructure. Neuroimage 54, 1112–1121.
Takahashi, M., Hackney, D. B., Zhang, G., Wehrli, S. L., Wright, A. C., O’Brien, W. T., Uematsu, H., Wehrli, F. W., and Selzer, M. E. (2002). Magnetic resonance microimaging of intraaxonal water diffusion in live excised lamprey spinal cord. Proc. Natl. Acad. Sci. U.S.A. 99, 16192–16196.
Tomassini, V., Jbabdi, S., Kincses, Z. T., Bosnell, R., Douaud, G., Pozzilli, C., Matthews, P. M., and Johansen-Berg, H. (2010). Structural and functional bases for individual differences in motor learning. Hum. Brain Mapp. 32, 494–508.
Tong, F., and Engel, S. A. (2001). Interocular rivalry revealed in the human cortical blind-spot representation. Nature 411, 195–199.
Tong, F., Meng, M., and Blake, R. (2006). Neural bases of binocular rivalry. Trends Cogn. Sci. 10, 502–511.
Tuch, D. S., Salat, D. H., Wisco, J. J., Zaleta, A. K., Hevelone, N. D., and Rosas, H. D. (2005). Choice reaction time performance correlates with diffusion anisotropy in white matter pathways supporting visuospatial attention. Proc. Natl. Acad. Sci. U.S.A. 102, 12212–12217.
Voineskos, A. N., Farzan, F., Barr, M. S., Lobaugh, N. J., Mulsant, B. H., Chen, R., Fitzgerald, P. B., and Daskalakis, Z. J. (2010). The role of the corpus callosum in transcranial magnetic stimulation induced interhemispheric signal propagation. Biol. Psychiatry 68, 825–831.
Wahl, M., Lauterbach-Soon, B., Hattingen, E., Jung, P., Singer, O., Volz, S., Klein, J. C., Steinmetz, H., and Ziemann, U. (2007). Human motor corpus callosum: topography, somatotopy, and link between microstructure and function. J. Neurosci. 27, 12132–12138.
Westerhausen, R., Grüner, R., Specht, K., and Hugdahl, K. (2009). Functional relevance of interindividual differences in temporal lobe callosal pathways: a DTI tractography study. Cereb. Cortex 19, 1322–1329.
Westerhausen, R., Kreuder, F., Woerner, W., Huster, R. J., Smit, C. M., Schweiger, E., and Wittling, W. (2006). Interhemispheric transfer time and structural properties of the corpus callosum. Neurosci. Lett. 409, 140–145.
Wheatstone, C. (1838). Contributions to the physiology of vision. Part the first. On some remarkable, and hitherto unobserved, phenomena of binocular vision. Philos. Trans. R. Soc. Lond. B Biol. Sci. 128, 371–394.
Whitford, T. J., Kubicki, M., Ghorashi, S., Schneiderman, J. S., Hawley, K. J., McCarley, R. W., Shenton, M. E., and Spencer, K. M. (2011). Predicting inter-hemispheric transfer time from the diffusion properties of the corpus callosum in healthy individuals and schizophrenia patients: a combined ERP and DTI study. Neuroimage 54, 2318–2329.
Wilson, H. R. (2003). Computational evidence for a rivalry hierarchy in vision. Proc. Natl. Acad. Sci. U.S.A. 100, 14499–14503.
Wilson, H. R., Blake, R., and Lee, S. H. (2001). Dynamics of travelling waves in visual perception. Nature 412, 907–910.
Witelson, S. F. (1989). Hand and sex differences in the isthmus and genu of the human corpus callosum. A postmortem morphological study. Brain 112, 799–835.
Wolfe, J. M. (1984). Reversing ocular dominance and suppression in a single flash. Vision Res. 24, 471–478.
Wunderlich, K., Schneider, K. A., and Kastner, S. (2005). Neural correlates of binocular rivalry in the human lateral geniculate nucleus. Nat. Neurosci. 8, 1595–1602.
Keywords: traveling waves, interhemispheric integration, binocular rivalry, diffusion tensor imaging, corpus callosum, primary visual cortex, radial diffusivity
Citation: Genç E, Bergmann J, Tong F, Blake R, Singer W and Kohler A (2011) Callosal connections of primary visual cortex predict the spatial spreading of binocular rivalry across the visual hemifields. Front. Hum. Neurosci. 5:161. doi: 10.3389/fnhum.2011.00161
Received: 09 August 2011; Accepted: 21 November 2011;
Published online: 07 December 2011.
Edited by:
Theofanis Panagiotaropoulos, Max Planck Institute for Biological Cybernetics, GermanyReviewed by:
Shozo Tobimatsu, Kyushu University, JapanJohan Eriksson, Umeå University, Sweden
Ryota Kanai, University College London, UK
Copyright: © 2011 Genç, Bergmann, Tong, Blake, Singer and Kohler. This is an open-access article distributed under the terms of the Creative Commons Attribution Non Commercial License, which permits non-commercial use, distribution, and reproduction in other forums, provided the original authors and source are credited.
*Correspondence: Axel Kohler, Institute of Psychology, University of Münster, Fliednerstr. 21, D-48161 Münster, Germany. e-mail: axel.kohler@uni-muenster.de