Individual differences in distraction by motion predicted by neural activity in MT/V5
- Department of Psychology, University of New Hampshire, Durham, NH, USA
Individuals differ substantially in their susceptibility to distraction by irrelevant visual information. Previous research has uncovered how individual variability in the goal-driven component of attentional control influences distraction, yet it remains unknown whether other sources of variability between individuals also predict distraction. In this fMRI study, we showed that an individual's inherent sensitivity to passively viewed visual motion predicts his/her susceptibility to distraction by motion. Bilateral MT/V5 was localized in participants during passive viewing of moving stimuli, affording a baseline measure of motion sensitivity. Next, participants performed a visual search task with an irrelevant motion singleton distractor, and both behavioral and neural indices of distraction were recorded. Results revealed that both of these indices were predicted by the independent index of motion sensitivity. An additional analysis of moment-to-moment fluctuations in distraction within individuals revealed that distraction could be predicted by pretrial fMRI activity in several brain regions, including MT+, which likely reflected the observer's momentary propensity to process motion. Together, these results shed light on how variability in factors other than goal-driven processing, both within and between individuals, affects attentional control and one's perception of the visual world.
Introduction
In order to efficiently process our visual environment, we must prioritize it according to our momentary behavioral goals. Attention helps us to succeed at this task by preferentially processing relevant stimuli while discarding irrelevant stimuli. Due to its fundamental importance in daily life, researchers have made great efforts to uncover the underlying mechanisms controlling attention. To this end, studies of attentional distraction have proliferated, both shedding light and stirring controversy. Some researchers advocate that stimulus-driven (i.e., bottom-up) processing determines priority, such that observers' attention is always drawn to the most salient item in the visual field (Yantis and Jonides, 1984; Theeuwes, 1992, 2004, 2010; Hickey et al., 2006; Talsma et al., 2010). Conversely, other researchers have found that individuals are able to exert goal-driven (i.e., top-down) control strategies to avoid salience-based distraction (Folk et al., 1992; Bacon and Egeth, 1994; Serences et al., 2005; Leblanc et al., 2008; Lien et al., 2008).
In seeking to better understand how goal-driven and stimulus-driven factors supply our visual experience, researchers have begun to scrutinize the considerable variability in individuals' abilities to resist attentional distraction (Kane et al., 2001; Fukuda and Vogel, 2009, 2011; Kanai et al., 2011; Kawahara and Kihara, 2011). Primarily, these studies have focused on variability in the goal-driven component of attentional control. For instance, Fukuda and Vogel (2011) showed that individuals with high working memory capacity were able to recover from attentional capture more rapidly than those with low capacity, suggesting greater abilities of high-capacity individuals to marshal goal-driven control. In another recent study, Kanai et al. (2011) reported a strong link between gray matter density in the superior parietal lobule (SPL) and individuals' abilities to resist distraction. Given that SPL has been described by others as a key source for voluntary shifts of attention (Corbetta and Shulman, 2002; Yantis et al., 2002; Yantis, 2008), the involvement of this region also supports that individual variability exists in the goal-driven component of attentional control.
What remains relatively unexplored is whether sources of variability outside of goal-driven control also predict individuals' sensitivity to distraction. Goal-driven control is typically encouraged in attention capture paradigms, as observers are instructed to ignore salient, irrelevant stimuli. However, other tasks, such as passive viewing, do not carry an inherent goal-driven requirement. Does an individual's baseline sensitivity to a passively viewed stimulus feature (e.g., motion) predict how distracting that stimulus feature will be when the individual is instructed to ignore it in a separate task? In the present study, we used fMRI measures of neural activity during a passive viewing task as an assay of baseline stimulus-driven sensitivity to visual motion. We questioned whether this measure was linked to susceptibility to distraction by motion. We focused on motion in this study because brain regions associated with processing this feature—specifically middle temporal area (MT), also referred to as V5—can be localized efficiently with fMRI (Tootell et al., 1995; O'Craven et al., 1997). Also, various types of visual motion have previously been reported to produce robust attention capture across several different stimulus paradigms (Hillstrom and Yantis, 1994; Abrams and Christ, 2003, 2006; Franconeri and Simons, 2003; von Mühlenen and Lleras, 2007).
The main goals of this study were to reliably create attentional distraction by an irrelevant motion singleton, to link evoked activity of MT/V5 with distractor processing, and to examine the degree to which motion-evoked activity influences behavioral responses on an individual subject level. One straightforward prediction was that the degree of evoked fMRI activity by the motion singleton distractor during the visual search task would be tied to the magnitude of behavioral distraction to that motion singleton. That is, the degree to which irrelevant, to-be-ignored motion is processed neurally should be linked to a behavioral index of distraction during that same task. More critically, we predicted that individual behavioral and neural distraction indices would also be linked to the neural response to passively viewed motion stimuli, measured in an independent task. To test this prediction, we compared the behavioral and neural distraction measures collected during the search task with fMRI activity measured during an unrelated MT localizer, in which task demands did not require that participants attempt to ignore the moving stimuli.
In addition, we examined whether intra-individual fluctuations in baseline pretrial activity were predictive of momentary behavioral distraction. Leber (2010) recently showed that fluctuations in pretrial activity in the middle frontal gyrus (MFG) predicted the magnitude of attention capture by an irrelevant color singleton on upcoming trials. We questioned whether the same region (MFG) and/or any additional regions would predict the momentary degree of attentional capture by an irrelevant motion singleton.
Materials and Methods
Participants
Twenty-four healthy participants (mean age = 21.4; 13 women), with normal or corrected-to-normal visual acuity and normal color vision, participated in exchange for monetary compensation. Participation included a brief (<10 min) behavioral practice session, followed by ∼90 min of anatomical and functional scans. Procedures were approved by the Human Investigation Committee of the Yale School of Medicine and the Institutional Review Board of the University of New Hampshire.
Stimulus Presentation and Behavioral Measurement
Stimuli were generated via an Apple MacBook computer, using MATLAB software (Mathworks, Natick, MA) with Psychophysics Toolbox extensions (Brainard, 1997; Pelli, 1997). During fMRI scanning, stimuli were displayed via a liquid crystal display projector onto a screen mounted in the rear of the scanner bore, which participants viewed via an angled mirror attached to the head coil.
Behavioral Tasks and Stimuli
Visual search
Participants completed six runs, each 8.5 min in length. A fixation dot was present for the duration of the run, and participants were instructed to maintain gaze on it. Each run began with a 10 s fixation presentation to allow for fMRI signal stabilization, after which trial presentation began. 1000 ms before each trial, the fixation dot enlarged by 67% for a duration of 200 ms to indicate an impending trial. Initial stimulus presentation involved a placeholder display presented for 100 ms, which consisted of an outline circle superimposed with an outline square at each of 10 locations (see Figure 1). On distractor-present trials (50%) a random, non-target placeholder began oscillating at 39°/s for 200 ms, first moving 1.95° toward fixation, then away from fixation until it was 1.95° more eccentric than its starting position, and finally back to the starting position. 50 ms after the motion began, the search objects were revealed (nine non-target circles and one target square), and the search objects remained for 200 ms, at which point all stimuli except for fixation were removed. Each of these search objects contained a small gap in the top or bottom. Participants were instructed to report the location of the target gap using the index and middle finger of their right hand (for top and bottom gaps, respectively). Responses were registered via a fiber optic button box. The 10 objects were green and were arranged symmetrically about the vertical and horizontal axes, with half of the items appearing to the left of fixation and half appearing to the right of fixation. Circles and squares were centered 5.85° from fixation and were drawn with a stroke of 0.20°. Squares were 2.34° per side and the circle's diameter was 2.69°. Gaps were 0.49° in length.
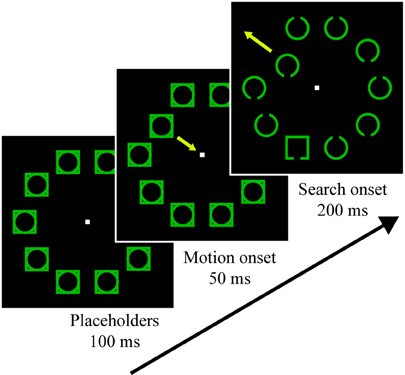
Figure 1. Visual search task trial stimuli. Participants searched for the square and reported whether it had a gap in the top or bottom. Half of the trials contained an irrelevant motion singleton distractor that could never be the target, which began oscillating during the placeholder presentation 50 ms before the search stimuli appeared. For additional details, see Materials and Methods.
Minimum trial-to-trial onset was set at 4000 ms, and trial spacing was temporally jittered such that half the trials were preceded by a 2000 ms blank period, whereas the remaining trials were not. Thus, each trial onset followed the previous trial onset by either 4000 ms or 6000 ms. Distractor presence (two levels) and trial spacing (two levels) were factorially crossed to create four minimum conditions. Each of these conditions was repeated 24 times to yield 96 trials per run, presented in randomized order.
Independent MT/V5 localizer
Functional localization of MT/V5 has been carried out by comparing dot motion in the contralateral vs. ipsilateral hemifields (Tootell et al., 1995; Kourtzi and Kanwisher, 2000; Huk et al., 2002), and we used a variant of these tasks. Participants were asked to passively view stimuli containing both stationary and moving dots while maintaining gaze on a fixation point, which was presented in the center of the screen for the entirety of the localizer. Stimuli consisted of 200 dots that were positioned within the range of 2.71°–8.83° eccentricity. Within this range, each dot's initial eccentricity and polar angle from fixation were selected randomly. In the left-moving condition, all of the dots left of fixation alternated every 1.5 s between radially inward and radially outward motion for a duration of 9 s, while all of the dots to the right of fixation remained stationary. In the right-moving condition, the dots presented to the right of fixation moved while the dots left of fixation were stationary. Moving dots traveled 10.15°/s. The session started with 10 s of fixation only, to allow for fMRI signal stabilization, followed by 32 stimulus trials (16 of each condition), which were presented in pseudorandom order and each separated by 3 s of fixation-only interstimulus-intervals. Thus, 12 s elapsed from one trial onset to the next. Total duration of the localizer was 6.7 min.
fMRI Acquisition
MRI scanning was performed with a 3.0 Tesla Siemens Trio scanner, located at the Magnetic Resonance Research Center at the Yale School of Medicine in New Haven, CT. A twelve-channel receiver array headcoil was used. For each participant, after an initial anatomical localizer, a high-resolution T1-weighted anatomical image was acquired with a 3D magnetization-prepared rapid acquisition gradient echo sequence. Next, 36 axial slices were defined (3.5 mm thickness, no gap), parallel to the anterior commissure-posterior commissure line, covering the whole brain, and a second anatomical image was acquired using a T1-weighted fast, low-angle shot sequence. Finally, seven T2*-weighted functional runs—one for the MT/V5 localizer and six for the main task—were acquired (TR = 2000 ms, TE = 25, flip angle = 90°, 64 × 64 matrix with 3.5 mm × 3.5 mm in-plane resolution).
fMRI Data Preprocessing
BrainVoyager QX Software was used to preprocess the fMRI data (Brain Innovation, Maastricht, The Netherlands). The data were slice-time corrected, motion corrected, spatially smoothed with a 4 mm full-width half-maximum isotropic Gaussian kernel, and subjected to temporal linear detrending. Data from each participant were then transformed into Talairach space (Talairach and Tournoux, 1988) and resampled at a 3 × 3 × 3 mm voxel size. The first five volumes of each functional run were excluded (accounting for 10 s of fMRI signal stabilization).
Defining MT/V5 Rois
For the MT/V5 independent functional localizer, we operated with two main objectives. The first was to identify MT/V5 bilaterally in each participant. Using Brain VoyagerQX, we performed a whole brain contrast of left-moving vs. right-moving stimulus conditions, in which trials of each of these conditions were modeled with a two-gamma hemodynamic response function. We then identified areas in cortex that preferentially responded to contralateral vs. ipsilateral motion in the visual display. For each participant, using an uncorrected alpha of 0.001, a left MT/V5 region of interest (ROI) was designated if the right moving > left moving contrast produced a spatial cluster of at least 135 mm3 within 2 cm of reference Talairach coordinates near the ascending limb of the inferior temporal sulcus (ITS) × = −45, y = −76, z = 3 (Tootell et al., 1995). Similarly, a right MT/V5 ROI was designated if the left moving > right moving contrast produced a cluster of contiguous voxels in the vicinity of the ITS. For each designated ROI, we selected the coordinates of the voxel that possessed the peak statistical result and created a sphere with a spatial extent of 227 mm3 around that coordinate to define the subject ROIs for use in further analyses.
The second objective of the functional localizer was to quantify the robustness of motion sensitivity within each participant. In order to examine the magnitude of the evoked MT/V5 response during the localizer task, we averaged the signal across the spherical ROIs and recomputed β coefficients for the left-moving and right-moving conditions for each participant. We could then determine if these measures correlated with behavioral and neural measures collected during the visual search task.
Evoked MT/V5 Activity During Visual Search
For each participant, blood oxygenation level-dependent (BOLD) activity during visual search for both left and right MT/V5 ROIs were subjected to multiple regression in which six main trial types were modeled: (1) target ipsilateral to ROI hemisphere and distractor ipsilateral (2) target contralateral and distractor contralateral (3) target ipsilateral and distractor contralateral (4) target contralateral and distractor ipsilateral (5) target ipsilateral and distractor absent (6) target contralateral and distractor absent. Error trials were also modeled but not considered for further analysis. The regression model was designed to independently fit each timepoint of the hemodynamic response without making any assumptions about the shape of the response function (Dale, 1999). To this end, 9 “candlestick” predictors were used, each corresponding to a timepoint after trial onset, separately for each of the above trial types. Given a 2 s TR, 18 s in total were thus modeled. We then obtained β coefficients for each of the nine timepoints, for each of the six main trial types.
fMRI Whole Brain Pretrial Analysis
We also attempted to predict moment-to-moment fluctuations in behavior within individuals as a function of pretrial signal (Leber et al., 2008; Leber, 2010). Pretrial signal was initially defined as BOLD activity collected from the single volume acquisition prior to each trial onset (i.e., 2000 ms). The goal was to identify brain regions whose baseline fluctuations in BOLD activity could predict attentional control during the trial.
To prepare the data for the pretrial signal analysis, we attempted to remove the variance due to any incidental factors of the stimulus presentation (i.e., trial timing, trial spacing, trial type) leaving BOLD residual time courses that were then subjected to multiple linear regression (Leber et al., 2008; Leber, 2010). Nine candlestick predictors were established for distractor-present and distractor-absent conditions independently, as well as for error trials, with each candlestick corresponding to one timepoint after trial onset. Beyond the predictors described above, this regression model also included eight predictors of other potential sources of nuisance variability: six motion correction parameters, BOLD signal measured from a region in deep left and deep right white matter, and mean BOLD signal, averaged from all voxels in the entire brain data set.
We then obtained residual BOLD time courses from the first step of the analysis described above and used them to find brain regions that predict attentional distraction. After selecting and pooling pretrial signal values from the residual BOLD time course, across all runs, pretrial signal was used as a predictor for participants' behavioral reaction time (RT) in two multiple regressions, which were run separately for distractor-present and distractor-absent trials. Each regression yielded a slope coefficient, which represents the degree to which RT changed as a function of pretrial signal. The slope coefficients for the two distractor conditions were then entered into within-subjects t-tests, separately for each voxel. Thus, a single whole brain statistical parametric map of t-scores represented the degree to which the activity of each voxel predicted attention capture on the upcoming trial (Leber, 2010). This map was then transformed, via interpolation, to 1 × 1 × 1 mm isotropic voxel resolution. To determine significant clusters of voxels, a single-voxel threshold was set at t(14) = 3.326, p = 0.005; then, by applying a spatial cluster threshold of 216 mm3 (equivalent to 5.0 voxels in scanned resolution), the false probability rate of identifying significant clusters was p = 0.0175, as estimated via 2000 Monte Carlo simulations, using BrainVoyager QX (Goebel et al., 2006).
fMRI Whole Brain Distractor-Present Compared to Distractor-Absent Analysis
The goal of this analysis was to identify brain regions with differing responses to an irrelevant motion singleton distractor when present or absent during the visual search task. Using BrainVoyager QX, the two trial types (present and absent) were modeled with a two-gamma hemodynamic response function; multiple regression was then used to obtain parameter estimates for the two conditions within each participant, within each voxel. These estimates were compared within each voxel using t-tests. Thus, a single whole brain statistical parametric map of t-scores represented the degree to which the activity of each voxel differed between distractor-present and -absent trials. This map was then transformed, via interpolation, to 1 × 1 × 1 mm isotropic voxel resolution. Using a single-voxel threshold of t(14) = 3.326, p = 0.005, we set a spatial cluster threshold of 216 mm3 (equivalent to 5.0 voxels in scanned resolution). At this threshold, the false probability rate of identifying significant clusters was p = 0.0175, as estimated via 2000 Monte Carlo simulations using BrainVoyager QX (Goebel et al., 2006).
Results and Discussion
Several participants (n = 6) were excluded from analysis due to unusually severe motion artifacts, and one additional participant was excluded for low behavioral accuracy (84.5%), which was more than 2.5 SD below the mean of the remaining 17 participants (97.1%).
Behavior During Visual Search
Response time (RT) data from the visual search task were examined for evidence of behavioral distraction. Error trials were excluded from this analysis, as were trials in which RTs exceeded 3 SD above participants' means for distractor present and distractor-absent conditions (comprising 1.2% and 0.9% of trials, respectively). Results showed a significant slowing on distractor-present trials (694 ms) compared with distractor-absent trials (668 ms), t(15) = 5.10, p < 0.05, confirming reliable attention capture by irrelevant motion (e.g., Abrams and Christ, 2003; Franconeri and Simons, 2003). Error rates overall were minimal, though significantly greater with distractor singletons (3.4%) than without them (2.5%), t(15) = 2.51, p < 0.05.
MT/V5 Functional Localizer
We successfully localized left MT/V5 in 16 participants and localized right MT/V5 in 13 participants (one participant displayed neither left nor right MT/V5). In these participants, the mean Talairach coordinates for MT/V5 in the left hemisphere [−45, −71, 7] (SD = 5.5, 3.6, 4.5, respectively) and in the right hemisphere [39, −70, 9] (SD = 4.2, 2.5, 5.1, respectively) were in good agreement with those of motion-specific MT/V5 described in earlier fMRI studies [±45, −76, 3] (SD = 3.6, 7.5, 2.5, respectively) (Tootell et al., 1995).
Evoked MT/V5 Response During Visual Search
For this analysis we compared the mean evoked response in these ROIs during the main visual search task, for conditions in which the distractor was contralateral, ipsilateral, or absent, when collapsing across target location (see Figure 2). Only subjects with successfully localized MT/V5 ROIs were included, and comparisons were restricted to the timepoints containing the peak evoked response, which were defined via t-test as those exhibiting statistically significantly greater activity than the first timepoint. For left MT/V5, two timepoints constituted the peak, representing 4–8 s after stimulus onset, and these two points were averaged for further analysis. Results in this region showed greater responses in the distractor-contralateral than the distractor-ipsilateral condition, t(15) = 9.748, p < 0.0001; the distractor-ipsilateral condition was greater than the distractor-absent condition, t(15) = 7.944, p < 0.0001; and the distractor-contralateral condition was greater than the distractor-absent condition, t(15) = 7.256, p < 0.0001. For right MT/V5, one significant peak timepoint of MT/V5 evoked activity, representing 4–6 s after stimulus onset, was identified. Similar to the results from left MT/V5, results in right MT/V5 showed that contralateral-distractor activity was greater than ipsilateral-distractor activity, t(12) = 9.961, p < 0.0001; ipsilateral-distractor activity was greater than distractor-absent activity, t(12) = 7.974 p < 0.0001; and contralateral-distractor activity was greater than distractor-absent activity, t(12) = 6.884, p < 0.0001.
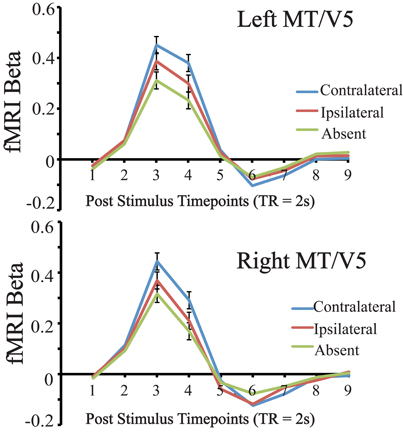
Figure 2. Results of Left and Right MT/V5 evoked activity during the visual search task for distractor contralateral, ipsilateral, and absent conditions, collapsed across target location. Error bars indicate 95% within subject confidence intervals (Loftus and Masson, 1994).
To summarize both left and right MT/V5 ROIs were sensitive to lateralized visual motion during the search task, as contralateral distractors evoked a greater response than ipsilateral ones. Also, because the ipsilateral-distractor condition evoked a greater response than the distractor-absent condition, our localized MT/V5 was to some extent globally sensitive to the moving distractors. Importantly, we were able to proceed in examining how this lateralized motion processing varied across individuals.
Individual Differences in Behavior and Evoked MT/V5 Activity
Including only the 13 participants with bilaterally defined MT/V5 ROIs, we examined the relationships between the behavioral RT distraction data, the activity in MT/V5 evoked by distractors during the main visual search task (what we will call the neural distraction index), and evoked activity in MT/V5 during the passively viewed hemifield motion localizer (what we will call the neural motion sensitivity index).
Behavioral and neural indices of distraction
Does an individual's motion-evoked activity during the visual search task correspond to that individual's degree of behavioral distraction by the motion singleton? Figure 3A plots each individual's behavioral capture scores (RT for distractor-present trials–RT for distractor-absent trials; excluding error trials) against his/her neural distraction index (distractor contralateral–distractor ipsilateral, collapsing across left and right MT/V5). Initially, the correlation was marginally significant, r = 0.52, p = 0.067. Examining the data, two clear outliers were identified along the behavioral capture measure whose scores of −22.6 ms and 54.9 ms were −6.46 and 5.35 SD away from the mean of the remaining participants, which was 19.8 ms (see Figure 3A). Further inspection of the data revealed that the two outliers had the slowest overall RTs (953 ms, and 1040 ms), which were considerably greater than the mean of the remaining participants (652 ms). When excluding these participants, the correlation was significant, r = 0.68, p = 0.010. These results thus link behavioral and neural indices of distraction by motion.
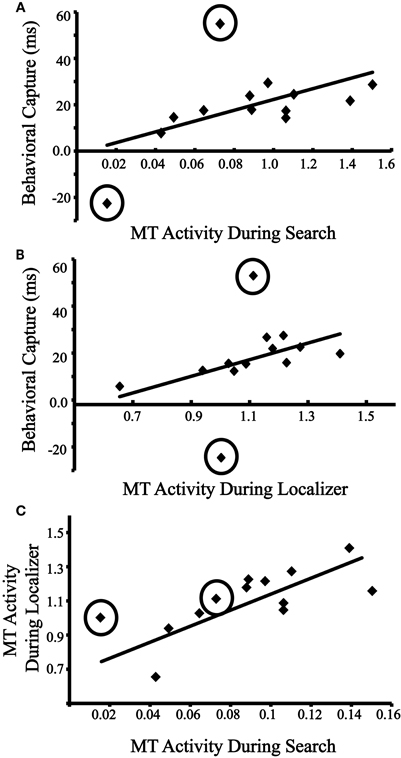
Figure 3. (A) Behavioral capture vs. evoked activity in MT/V5 (contralateral–ipsilateral beta coefficients) during the visual search. Outliers are circled. Regression line is computed without outliers. (B) Behavioral capture with evoked activity in MT/V5 (contralateral–ipsilateral beta coefficients) during the independent localizer. Outliers are circled. Regression line is computed without outliers. (C) Evoked activity in MT/V5 during the visual search with evoked activity in MT/V5 during the independent localizer. Outliers are circled. Regression line is computed without outliers.
Behavioral capture and the neural motion sensitivity index
In the previous analysis, both measurements of capture and evoked response were collected during the same task. Does the relationship between motion processing and capture also exist when the motion processing is measured from the passive viewing task? Figure 3B plots individuals' behavioral capture scores against their neural motion sensitivity index (contralateral motion trials–ipsilateral motion trials from the independent localizer, collapsed across left and right MT/V5). When including the outliers identified in the previous analysis, the correlation was not significant, r = 0.38, p = 0.200. However, when excluding the outliers, the correlation was significant, r = 0.75, p = 0.002. These results provide support for the prediction that baseline sensitivity to motion, as indexed by the neural response to passively viewed visual stimuli, predicts susceptibility to distraction by motion.
Neural indices of distraction and motion sensitivity
We next sought to determine whether the neural index of distraction by motion could be predicted by the neural motion sensitivity index. Figure 3C plots individuals' lateralized evoked MT/V5 activity from the visual search task against their lateralized MT/V5 activity from the independent localizer, and, when including the two outliers identified above, a significant correlation was found, r = 0.69, p = 0.009. When excluding these outlier, the correlation remained significant, r = 0.75, p = 0.002. These results provide further support that an individual's susceptibility to distraction by irrelevant motion is predicted by his/her baseline sensitivity to this visual feature during passive viewing. We return to the individual difference findings in the general discussion. Note that the two outliers identified in this section are excluded from all subsequent analyses.
Moment-to-Moment Fluctuations in Distraction Predicted by Pretrial fMRI Signal
In addition to examining inter-individual differences in motion processing, we conducted an exploratory analysis to examine intra-individual fluctuations in activity and question whether the same region previously demonstrated to predict distraction by color, left MFG, also predicted distraction by motion. Specifically, Leber (2010) found that fluctuations in attentional distraction by a unique, irrelevant, color singleton could be predicted in advance, such that higher pretrial signal in left MFG was linked to reduce distraction on the upcoming trial. On the one hand, if pretrial MFG activity were to also predict distraction by motion, such a result would suggest that the resistance to distraction from both static and dynamic stimuli is subserved by a common neural substrate. On the other hand, if different regions predict capture by motion, then distinct neural substrates may be responsible for resisting unwanted processing of these two classes of stimuli.
As discussed in Materials and Methods, we attempted to predict distractor-present and absent RT from pretrial activity sampled from the −1 timepoint (i.e., one volume acquisition before the trial onset), following the procedure from Leber (2010). This analysis yielded one significant cluster of voxels in the left superior parietal lobule (L SPL). Specifically, as pretrial signal in this region increased, behavioral distraction on the upcoming trial decreased, following the same pattern as MFG in Leber's 2010 study (see Table 1). Given that others have described SPL as a key source for voluntary shifts of attention (Corbetta and Shulman, 2002; Yantis, 2008; Kanai et al., 2011), the involvement of this region supports that individual variability exists in the goal-driven component of attentional control.
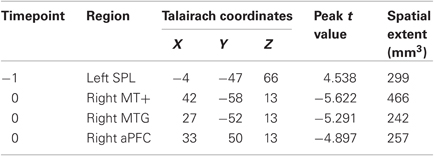
Table 1. Regions whose pretrial activity predicted behavioral distraction.
It was notable that the current whole brain analysis did not reveal prediction of distraction by MFG, which Leber (2010) found to predict distraction by color. Even when we increased the uncorrected single-voxel threshold to p = 0.10, no voxels within a 10 mm radius of the coordinates from the previous Leber study [−39 17 19] demonstrated the same pattern of prediction. Re-evaluating how this study differed from Leber's previous study, we considered that we now introduced placeholders and included a temporal gap between the motion and target onsets, and perhaps regressing from the −1 timepoint might have been too far in advance to allow sufficient power to predict fluctuations in capture. We thus reran the regression analysis from the 0 timepoint (i.e., the first timepoint of the trial), assuming that this timepoint was still early enough to remain free of any potential biases in the fMRI signal resulting from incidental aspects of the current trial stimuli (e.g., target-distractor locations, trial type).
Results showed that moment-to-moment fluctuations in behavioral distraction could be predicted from the 0 timepoint in three regions, R middle temporal area (MT+), a neighboring region in R middle temporal gyrus (MTG), and R anterior prefrontal cortex (aPFC), (see Table 1). Note that the R MT+ and MTG regions were observed to be contiguous when the uncorrected threshold was increased to p = 0.02. All three regions shared the same general relationship between pretrial activity and behavior—one that we have not observed before; specifically, as pretrial signal increased, the magnitude of attentional distraction also increased. Clearly, these regions do not exert greater goal-driven control with increased activity. Rather, we believe these regions each predict distraction in one of two ways. First, pretrial activity could represent the momentary capacity of the motion processing system, such that greater activity leads to enhanced potency of the motion singleton. This interpretation seems sensible for MT+ and neighboring MTG, as they are likely to be motion-sensitive regions. Second, the regions could be characteristic of those in the “default mode network,” a set of brain regions that deactivate during cognitive task performance (Gusnard and Raichle, 2001; Buckner et al., 2008). Comparatively weaker task-related deactivations have been interpreted to signal poorer engagement of attentional control and have been linked to lapses in performance (Weissman et al., 2006), and such a phenomenon could be extended to explain the present results: relatively lower pretrial signal could confer greater susceptibility to distraction. We will return to this possibility in the next section, where we further scrutinize the task-related activations of these regions.
One additional observation about the 0 timepoint analysis is that we once again do not find a region within a 10 mm radius of the MFG reported by Leber (2010) to predict capture, even when increasing the single-voxel threshold to 0.10. It thus remains possible that we did not find MFG to predict attentional distraction because of the difference in distractor features used in the present vs. previous study. Some have argued that motion stimuli receive a special degree of stimulus-driven priority that cannot be modulated in a goal-driven fashion (Franconeri and Simons, 2003). A special status for motion could be rooted in the distinction between dynamic (e.g., motion) and static (e.g., color) stimulus processing in the magnocellular vs. parvocellular pathways (Livingstone and Hubel, 1988); this rationale has motivated several accounts of attentional distraction (Girelli and Luck, 1997; Lamme, 2000; von Mühlenen et al., 2005; Laycock et al., 2008). By these accounts, MFG, a source of goal-driven control, might be expected to have the capacity to minimize capture by color but not by motion. Nevertheless, we are cautious to make such a strong claim. Because of the sluggish nature of the BOLD response, our sampling of pretrial activity largely reflects neural activity several seconds before the trial begins, and this method may overlook more subtle influence of goal-driven control at faster time scales. Lastly, we note that the interference produced by the motion distractor was reliable but relatively modest, potentially reducing our ability to track co-variations between behavior and control signals in MFG.
One final observation about the 0 timepoint analysis is that it did not yield the region in L SPL that predicted capture at the –1 timepoint, even when we increased the single-voxel threshold to 0.10. This result was surprising, as no simple model of attentional control would stipulate that baseline activity cease predicting performance as the trial approaches. More likely, echoing a point we raised with respect to MFG, this analysis may have been statistically underpowered.
Task-Evoked Response in Four Regions that Predict Attention Capture
Next we attempted to learn more about the four regions predicting behavioral capture identified above (from both the –1 and 0 timepoints). Our objective was to gain additional clues about how these regions may have predicted greater distraction with increased pretrial activity. For instance, these regions could be sensitive to visual motion such that greater baseline activity leads to greater processing of moving stimuli (i.e., a greater evoked response to distractor-present vs. absent stimuli). Alternatively, the regions could exhibit a general insensitivity to transient motion-related stimuli, suggesting an indirect, rather than direct link to visual motion processing. To evaluate these possibilities, we analyzed the task-evoked responses in the four ROIs during distractor-present and distractor-absent trials (see Figure 4). For each subject, for each of the four ROIs, three conditions were modeled with a two-gamma hemodynamic response function: distractor contralateral, distractor ipsilateral, and distractor-absent. β coefficients representing the amplitude of these response functions were obtained for each ROI for the three conditions and compared with t-tests.
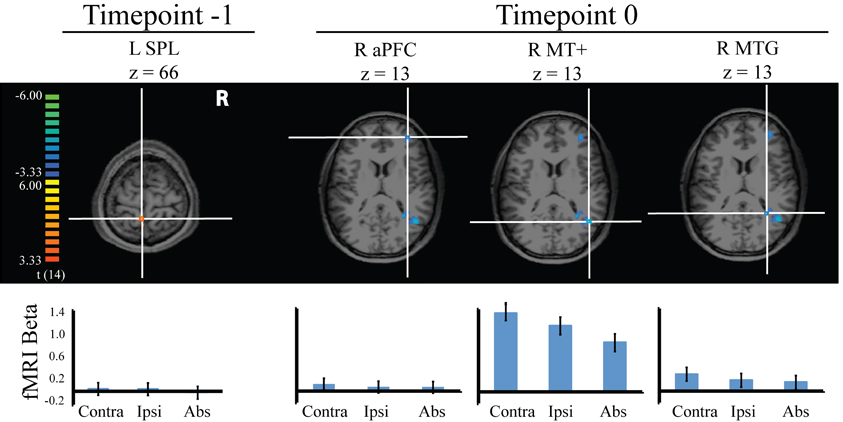
Figure 4. Stimulus-evoked fMRI responses during visual search in the four regions identified to predict behavioral distraction from pretrial signal. Error bars indicate 95% within subject confidence intervals.
Two of the regions, L SPL and R aPFC, showed no significant differences among the three distractor conditions. However, R MT+ did show significant differences between distractor conditions, such that this region was more active when the motion singleton was contralateral than ipsilateral, t(14) = 2.96, p = 0.01; ipsilateral distractor activity was greater than when the distractor was absent, t(14) = 3.77, p = 0.002; and contralateral distractor activity was greater than when the distractor was absent, t(14) = 6.41, p = 0.000. This result confirms our labeling of this region as MT+, as it demonstrated sensitivity to visual motion. For R MTG, this region was more active when the distractor was contralateral than absent, t(14) = 2.78, p = 0.015. There were no significant differences between the other distractor conditions. This region thus demonstrates sensitivity to visual motion and confirms our initial grouping of it with MT+. The remaining regions, however, demonstrated a lack of transient sensitivity to the motion stimuli. Leber (2010) drew an analogy between brain regions lacking such transient sensitivity in the evoked response and a sports coach, who contributes resources but does not participate in the game play. We feel the analogy applies here, although given that greater pretrial signal conferred greater distraction, we would have to extend the analogy to include factors that antagonize performance rather than enhance it (e.g., heckling fans). Earlier, we speculated that aPFC may have belonged to the default mode network, based on its anatomical location and because it predicted increased distraction with increased pretrial signal. However, this region did not show a consistent task-related deactivation in the current evoked-response analysis. Rather, it appeared to be relatively flat. Thus, this region cannot readily be classified as a member of the default network.
fMRI Whole Brain Distractor-Present vs. Distractor-Absent Analysis
We next searched the whole brain for regions responding more on distractor-present than absent trials. de Fockert et al. (2004) previously conducted a similar analysis on a task with a salient color singleton, and they found significant activations in SPL and precentral gyrus. We took the opportunity to determine whether the same results would obtain with a salient motion singleton. We found three regions that responded more strongly to distractor-present than distractor-absent trials (see Table 2). The two regions with the largest spatial extent were bilateral MT+, reflecting greater responses to displays with visual motion than without. Note that the coordinates of this MT+ region were similar to the MT+ region obtained in the whole brain pretrial analysis but more anterior than the MT/V5 regions obtained in the functional localizer. While receptive fields in MT/V5 are known to be hemifield-specific (Tootell et al., 1995), the current whole brain analysis collapsed across distractor side and thus was more sensitive to regions lacking hemifield specificity, such as MST, which, in humans, is anterior to MT/V5 (Dukelow et al., 2001; Huk et al., 2002).
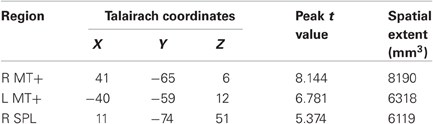
Table 2. Regions related to presence (vs. absence) of a motion singleton distractor.
The other region, SPL, was in close vicinity to the SPL coordinates reported by de Fockert et al. (2004), which were [26 −68 50]. Note that de Fockert et al. reported bilateral SPL activation, while the current whole brain analysis did not yield a significant cluster in L SPL. However, we did find a cluster in L SPL upon increasing the single voxel threshold to p = 0.01. The peak voxel in this cluster was located at [−25 −71 48] with a peak t-value of 3.834; this was in close proximity to the L SPL found by de Fockert et al. with coordinates at [−24 −66 50]. In addition, de Fockert et al. reported a cluster in L precentral gyrus, at coordinates [−46 4 36]. On further scrutinizing our results, we discovered a nearby region at coordinates [−43 −5 33], peak t = 5.568, with a spatial extent of 178 mm3, which did not survive the cluster threshold cutoff. Thus, the present results suggest that the roles of SPL and L precentral gyrus in visual distraction appear to be generalizable across multiple stimulus classes, including color and motion.
General Discussion
Debate over how goal-driven and stimulus-driven processes form our perception of our visual environment fuels much of the literature on attentional distraction. Previous research has taken advantage of individual variability in distraction, shedding much light on the mechanisms underlying attentional control (Fukuda and Vogel, 2009, 2011; Kanai et al., 2011; Kane et al., 2001; Kawahara and Kihara, 2011). These studies generally focused on how variability in the goal-driven component of control influences distraction, leaving an open question about how other sources of inter-individual variability influence distraction. Here, we focused on variability in individuals' intrinsic sensitivity to visual stimulation, without any required component of top-down control, to question whether we could predict visual distraction. We reliably created attentional distraction by an irrelevant motion singleton and examined the degree to which evoked activity in MT/V5, measured during an independent passive-viewing task (i.e., the MT/V5 localizer), would predict behavioral and neural indices of distraction. The key result showed that participants with higher neural indices of motion sensitivity (i.e., those who showed greater evoked responses in MT/V5 to motion during the passive viewing task) also experienced greater behavioral capture from irrelevant motion singletons during the visual search task. Further, participants with higher neural indices of motion sensitivity also showed higher neural distraction indices (i.e., greater evoked responses to motion singletons in MT/V5 during the search task). These results provide novel support that baseline sensitivity to visual information determines one's ability to resist distraction by that information.
This study's pretrial activity findings extend previous work (Leber, 2010). We found some evidence that SPL could predict distraction from the –1 timepoint, namely, increased pretrial signal predicted greater resistance to distraction, confirming its importance as a goal-driven source of attentional control (Corbetta and Shulman, 2002; Yantis, 2008; Kanai et al., 2011), although the strength of this finding was limited by SPL's lack of prediction from the 0 timepoint. We also uncovered three additional regions that predicted distraction from the 0 timepoint. All of these regions showed a common pattern, in which increased pretrial signal predicted greater susceptibility to distraction. Two regions, MT+ and MTG, were likely to reflect the momentary activation of the motion processing system, leading to increased prioritization of moving distractors during periods of high pretrial signal. This interpretation was supported by a comparison of the trial-evoked response in this region, which was greater for contralateral than ipsilateral distractors (and both of these conditions were greater than the distractor-absent condition). Also, this interpretation is further supported by a recent study in macaque MT showing motion detection to covary with neural activity preceding stimulus onset (Smith et al., 2011). That is, given that baseline MT activity predicts sensitivity to visual motion, it follows from our current results that moments of greater sensitivity to motion lead to greater distractibility by irrelevant motion.
We noted that MFG, a region associated with goal-driven control that was previously shown to predict distraction by color (Leber, 2010), did not predict distraction by motion in the current study. We considered that capture by motion may be special and thus immune to attenuation by goal-driven control mechanisms (Girelli and Luck, 1997; Franconeri and Simons, 2003; Abrams and Christ, 2006). However, given the modest overall distraction effect in this study, it is possible that we did not have the statistical power to demonstrate prediction from MFG.
Taken together, these results provide a picture of feature-based attentional distraction that is multi-faceted, exhibiting many sources of variability, both across and within individuals. In addition to previous demonstrations of inter-individual variability in goal-driven components of control (Fukuda and Vogel, 2009, 2011; Kane et al., 2001; Kanai et al., 2011), we show here that inherent sensitivity to visual information is also linked to susceptibility to distraction. An important future direction will be to compare these two sources of variability in a single paradigm to determine whether they are in fact independent. With respect to intra-individual variability, previous work had shown moment-by-moment variation in goal-driven control to predict susceptibility to distraction (Leber, 2010). Here we showed that moment-to-moment variation in stimulus processing (MT+) can also reliably predict distraction.
It is clear that studies of both inter- and intra-individual differences provide rich sources of variability that researchers should continue to exploit to substantially advance our understanding of the complex and remarkable mechanisms of attentional control.
Conflict of Interest Statement
The authors declare that the research was conducted in the absence of any commercial or financial relationships that could be construed as a potential conflict of interest.
Acknowledgments
We thank T. Hickey and C. McMurray for scanning assistance, J. McGaughy, E. O'Brien, and E. Wells for helpful discussions and comments.
Funding
NSF BCS-1027054 and US-Israel BSF 2009424 to Andrew B. Leber.
References
Abrams, R. A., and Christ, S. E. (2003). Motion onset captures attention. Psychol. Sci. 14, 427–432.
Abrams, R. A., and Christ, S. E. (2006). Motion onset captures attention: a rejoinder to Franconeri and Simons (2005). Percept. Psychophys. 68, 114–117.
Bacon, W. F., and Egeth, H. E. (1994). Overriding stimulus-driven attentional capture. Percept. Psychophys. 55, 485–496.
Buckner, R. L., Andrews-Hanna, J. R., and Schacter, D. L. (2008). The brain's default network: anatomy, function and relevance to disease. Ann. N.Y. Acad. Sci. 1124, 1–38.
Corbetta, M., and Shulman, G. L. (2002). Control of goal-directed and stimulus-driven attentional control in the brain. Nat. Rev. Neurosci. 3, 201–215.
Dale, A. M. (1999). Optimal experimental design for event-related fMRI. Hum. Brain Mapp. 8, 109–114.
de Fockert, J., Rees, G., Frith, C., and Lavie, N. (2004). Neural correlates of attentional capture in visual search. J. Cogn. Neurosci. 16, 751–759.
Dukelow, S. P., DeSouza, J. F. X., Culham, J. C., van den Berg, A. V., Menon, R. S., and Vilus, T. (2001). Distinguishing subregions of the human MT+ complex using visual fields and pursuit eye movements. J. Neurophysiol. 86, 1991–2000.
Folk, C. L., Remington, R. W., and Johnston, J. C. (1992). Involuntary covert orienting is contingent on attentional control settings. J. Exp. Psychol. Hum. Percept. Perform. 18, 1030–1044.
Franconeri, S. L., and Simons, D. J. (2003). Moving and looming stimuli capture attention. Percept. Psychophys. 65, 999–1010.
Fukuda, K., and Vogel, E. K. (2009). Human variation in overriding attentional capture. J. Neurosci. 29, 8726–8733.
Fukuda, K., and Vogel, E. K. (2011). Individual differences in recovery time from attention capture. Psychol. Sci. 22, 361–368.
Girelli, M., and Luck, S. J. (1997). Are the same attentional mechanisms used to detect visual search targets as defined by color, orientation and motion? J. Cogn. Neurosci. 9, 238–253.
Goebel, R., Esposito, F., and Formisano, E. (2006). Analysis of functional image analysis contest (FIAC) data with Brainvoyager QX: from single-subject to cortically aligned group general linear model analysis and self organizing group independent component analysis. Hum. Brain Mapp. 27, 392–401.
Gusnard, D. A., and Raichle, M. E. (2001). Searching for a baseline: functional imaging and the resting human brain. Nat. Rev. Neurosci. 2, 685–694.
Hickey, C., McDonald, J. J., and Theeuwes, J. (2006). Electrophysiological evidence of the capture of visual attention. J. Cogn. Neurosci. 18, 604–613.
Hillstrom, A. P., and Yantis, S. (1994). Visual motion and attentional capture. Percept. Psychophys. 55, 399–411.
Huk, A. C., Dougherty, R. F., and Heeger, D. J. (2002). Retinotopy and functional subdivision of human areas MT and MST. J. Neurosci. 22, 7195–7205.
Kanai, R., Dong, M. Y., Bahrami, B., and Rees, G. (2011). Distractibility in daily life is reflected in the structure and function of human parietal cortex. J. Neurosci. 31, 6620–6626.
Kane, M. J., Bleckley, M. K., Conway, A. R. A., and Engle, R. W. (2001). A controlled-attention view of working memory capacity. J. Exp. Psychol. Gen. 130, 169–183.
Kawahara, J. I., and Kihara, K. (2011). No commonality between attentional capture and attentional blink. Q. J. Exp. Psychol. 64, 991–1008.
Kourtzi, Z., and Kanwisher, N. (2000). Activation in Human MT/MST by static images with implied motion. J. Cogn. Neurosci. 12, 48–55.
Lamme, V. A. F. (2000). Neural mechanisms of visual awareness: a linking proposition. Brain and Mind 1, 385–406.
Laycock, R., Crewther, D. P., and Crewther, S. G. (2008). The advantage in being magnocellular: a few more remarks on attention and the magnocellular system. Neurosci. Biobehav. Rev. 32, 1409–1415.
Leber, A. B. (2010). Neural predictors of within-subject fluctuations in attentional control. J. Neurosci. 30, 11458–11465.
Leber, A. B., Turk-Browne, N. B., and Chun, M. M. (2008). Neural predictors of moment-to-moment fluctuations in cognitive flexibility. PNAS 105, 13592–13597.
Leblanc, E., Prime, D. J., and Jolicoeur, P. (2008). Tracking the location of visuospatial attention in a contingent capture paradigm. J. Cogn. Neurosci. 20, 657–671.
Lien, M. C., Ruthruff, E., Goodin, Z., and Remington, R. W. (2008). Contingent attentional capture by top-down control settings: converging evidence from event-related potentials. J. Exp. Psychol. Hum. Percept. Perform. 34, 509–530.
Livingstone, M., and Hubel, D. (1988). Segregation of form, color, movement, and depth: anatomy, physiology and perception. Science 240, 740–749.
Loftus, G. R., and Masson, M. E. J. (1994). Using confidence intervals in within-subject designs. Psychon. Bull. Rev. 1, 476–490.
O'Craven, K. M., Rosen, B. R., Kwong, K. K., Treisman, A., and Savoy, R. L. (1997). Voluntary attention modulates fMRI activity in human MT-MST. Neuron 18, 591–598.
Pelli, D. G. (1997). The VideoToolbox software for visual psychophysics: transforming numbers into movies. Spat. Vis. 10, 437–442.
Serences, J. T., Shomstein, S., Leber, A. B., Golay, X., Egeth, H. E., and Yantis, S. (2005). Coordination of voluntary and stimulus-driven attentional control in human cortex. Psychol. Sci. 16, 114–122.
Smith, J. E. T., Zhan, C. A., and Cook, E. P. (2011). The functional link between area MT neural fluctuations and detection of a brief motion stimulus. J. Neurosci. 31, 13458–13468.
Talairach, J., and Tournoux, P. (1988). Co-planar Stereotactic Atlas of the Human Brain. Stuttgart, Germany: Thieme.
Talsma, D., Coe, B., Munoz, D. P., and Theeuwes, J. (2010). Brain structures involved in visual search in the presence and absence of color singletons. J. Cogn. Neurosci. 22, 761–774.
Theeuwes, J. (2004). Top-down search strategies cannot override attentional capture. Psychon. Bull. Rev. 11, 65–70.
Theeuwes, J. (2010). Top-down and bottom-up control of visual selection. Acta Psychol. 135, 177–199.
Tootell, R. B. H., Reppas, J. B., Kwong, K. K., Malach, R., Born, R. T., Brady, T. J., Rosen, B. R., and Belliveau, J. W. (1995). Functional analysis of human MT and related visual cortical areas using magnetic resonance imaging. J. Neurosci. 15, 3215–3230.
Weissman, D. H., Roberts, K. C., Visscher, K. M., and Woldorff, M. G. (2006). The neural bases of momentary lapses in attention. Nat. Neurosci. 9, 971–978.
Yantis, S., and Jonides, J. (1984). Abrupt visual onsets and selective attention: evidence from visual search. J. Exp. Psychol. Hum. Percept. Perform. 10, 601–621.
Yantis, S., Schwarzbach, J., Serences, J. T., Carlson, R. L., Steinmetz, M. A., Pekar, J. J., and Courtney, S. M. (2002). Transient neural activity in human parietal cortex during spatial attention shifts. Nat. Neurosci. 5, 995–1002.
von Mühlenen, A., and Lleras, A. (2007). No-onset looming motion guides spatial attention. J. Exp. Psychol. Hum. Percept. Perform. 33, 1297–1310.
Keywords: attention capture, fMRI, motion, MT, individual differences
Citation: Lechak JR and Leber AB (2012) Individual differences in distraction by motion predicted by neural activity in MT/V5. Front. Hum. Neurosci. 6:12. doi: 10.3389/fnhum.2012.00012
Received: 14 August 2011; Paper pending published: 21 November 2011;
Accepted: 23 January 2012; Published online: 15 February 2012.
Edited by:
Marty G. Woldorff, Duke University, USAReviewed by:
Carsten N. Boehler, Duke University, USAChristopher Summerfield, Oxford University, UK
Copyright: © 2012 Lechak and Leber. This is an open-access article distributed under the terms of the Creative Commons Attribution Non Commercial License, which permits non-commercial use, distribution, and reproduction in other forums, provided the original authors and source are credited.
*Correspondence: Jennifer R. Lechak and Andrew B. Leber, Department of Psychology, University of New Hampshire, 10 Library Way, Durham, NH 03824, USA. e-mail: jwi39@wildcats.unh.edu; andrew.leber@unh.edu