Task control signals in pediatric Tourette syndrome show evidence of immature and anomalous functional activity
1
Department of Neurology, Washington University School of Medicine, St. Louis, MO, USA
2
Department of Radiology, Washington University School of Medicine, St. Louis, MO, USA
3
Department of Anatomy and Neurobiology, Washington University School of Medicine, St. Louis, MO, USA
4
Department of Psychology, Washington University in St. Louis, St. Louis, MO, USA
5
Department of Pediatrics, Washington University School of Medicine, St. Louis, MO, USA
Tourette Syndrome (TS) is a pediatric movement disorder that may affect control signaling in the brain. Previous work has proposed a dual-networks architecture of control processing involving a task-maintenance network and an adaptive control network (Dosenbach et al., 2008
). A prior resting-state functional connectivity MRI (rs-fcMRI) analysis in TS has revealed functional immaturity in both putative control networks, with “anomalous” correlations (i.e., correlations outside the typical developmental range) limited to the adaptive control network (Church et al., 2009
). The present study used functional MRI (fMRI) to study brain activity related to adaptive control (by studying start-cues signals), and to task-maintenance (by studying signals sustained across a task set). Two hypotheses from the previous rs-fcMRI results were tested. First, adaptive control (i.e., start-cue) activity will be altered in TS, including activity inconsistent with typical development (“anomalous”). Second, group differences found in task-maintenance (i.e., sustained) activity will be consistent with functional immaturity in TS. We examined regions found through a direct comparison of adolescents with and without TS, as well as regions derived from a previous investigation that showed differences between unaffected children and adults. The TS group showed decreased start-cue signal magnitude in regions where start-cue activity is unchanged over typical development, consistent with anomalous adaptive control. The TS group also had higher magnitude sustained signals in frontal cortex regions that overlapped with regions showing differences over typical development, consistent with immature task-maintenance in TS. The results demonstrate task-related fMRI signal differences anticipated by the atypical functional connectivity found previously in adolescents with TS, strengthening the evidence for functional immaturity and anomalous signaling in control networks in adolescents with TS.
Task Control Signals
Control over one’s behaviors, both overt and covert, is needed on different timescales to best achieve one’s goals. In particular, the focus here will be on two sets of control processes: the short-term choosing and initiation of desired information processing operations for task performance, and the longer-term maintenance of those operations. Over typical human development, capacity increases for control at both of these timescales (Crone et al., 2004
; Luna and Sweeney, 2004
; Davidson et al., 2006
).
In a meta-analysis of healthy young adults, we have described signals putatively related to these sets of control processes (Dosenbach et al., 2006
). The activity that was analyzed included signals related to task onset (start-cue), and signals related to task-maintenance (sustained). For start-cue activity, a consistent set of regions was found including regions in frontal cortex, parietal cortex, mid-cingulate, precuneus, anterior cingulate, and bilateral anterior insula regions. The regions consistently active for positive sustained activity included anterior cingulate, bilateral anterior insula, and anterior prefrontal cortex. Studies of resting-state functional connectivity MRI (rs-fcMRI), confirmed the segregation of the regions into two networks (Fair et al., 2007
; Dosenbach et al., 2008
).
The combined results from the functional MRI (fMRI) meta-analysis and the subsequent rs-fcMRI analyses (Fair et al., 2007
, 2009
; Dosenbach et al., 2008
; Church et al., 2009
) suggest that there are brain regions consistently involved in separable aspects of top-down control over a variety of tasks. One network of regions has positive sustained activity across the duration of a task, suggesting its involvement as a “task-maintenance” network. The other network contains regions showing primarily task initiation signal, suggesting that it may act as a faster, adaptive control network. In principle, should abnormal processing occur at either of these timescales, the result could be unintentional and/or undesired behaviors.
Tourette Syndrome
Tourette Syndrome (TS) is a developmental disorder characterized by unwanted, irresistible behaviors, which are manifested as movements and vocalizations called tics (American Psychiatric Association, 2000
). Though the precise etiology of the disorder is unknown, it may in part stem from abnormal processing in the two control networks. Tics often first become apparent around ages 6–7 years, or school age. The symptoms of vocal and motor tics often increase in severity to peak intensity around the ages 10–12 years (Leckman et al., 1998
). Once thought to be rare, the prevalence of tics in the pediatric population is now estimated to be around 6–12%, with TS affecting 1–10 in 1,000 children (Kurlan et al., 2001
; CDC, 2009
). TS is not typically associated with general cognitive impairment, except when present with co-morbid disorders (Como, 2001
). Attention-deficit hyperactivity disorder (ADHD) and obsessive-compulsive disorder (OCD) are strongly co-morbid with TS (50–62% with TS also have ADHD, while 20–60% have OCD) (Freeman et al., 2000
; CDC, 2009
). Generalized anxiety (i.e., other than OCD) and affective disorders also have increased prevalence in TS (Singer, 2005
). Indeed, TS in isolation, without any co-morbid diagnosis, is relatively uncommon, constituting only 10–15% of TS patients (Freeman et al. 2000
).
TS is thought to affect frontal cortex and/or its interaction with subcortical structures including the thalamus and basal ganglia (Singer, 2005
; Albin and Mink, 2006
). Many anatomical studies of TS have suggested alterations of frontal and/or parietal cortex (e.g., Peterson et al., 2001
; Fredericksen et al., 2002
). Additionally, a recent study of children with TS has suggested that there is significant cortical thinning in bilateral ventral frontal and bilateral parieto-occipital cortex (Sowell et al., 2008
). There is evidence for altered neuronal distribution within subcortical structures, indicative of an abnormality in cortico-subcortical circuitry (e.g., Kalanithi et al., 2005
). Recent fMRI studies of TS in children have found regions of left prefrontal cortex that are significantly more active in affected than in unaffected children during a Stroop interference task (Marsh et al., 2007
; Baym et al., 2008
). While each study identified different regions, the overall findings are suggestive of compensatory prefrontal activity for difficulties in top-down control.
While the interest in the neural underpinnings of TS is growing, research in co-morbid disorders in pediatric groups is also increasing [e.g. ADHD: (Durston et al., 2007
; Vance et al., 2007
; Rubia et al., 2009b
), and OCD: (Lazaro et al., 2008
; Gilbert et al., 2009
; Rubia et al., 2009a
)]. As these disorders are hypothesized to have related neural substrates, research on any of them can be mutually informative to all of them. Results may help to identify any consistent differences between TS and its co-morbidities, which could allow for the creation of biomarkers for TS, thus assisting diagnosis in the future.
A previous report from our group, investigating putative control networks using rs-fcMRI signals in a group of adolescents with TS, found two intriguing results (Church et al., 2009
). First, the TS group’s functional connections showed significant and widespread functional immaturity (correlation strengths more similar to younger children) compared to age-matched controls involving both putative control networks. Second, for a number of connections, the TS average correlation coefficient was not similar to the correlation strengths observed at any age between 7 and 31 years. These functional connections were termed “functionally anomalous”, and predominantly involved regions in the fronto-parietal, adaptive control network (Dosenbach et al., 2008
). The combined results suggest that both task initiation and sustained, maintenance control signals may be affected in TS, but that regions related to the two signal types would be impacted differently. These suggestions can be captured in two related hypotheses.
First, because the most significant functional connectivity deviations in the TS group were in regions thought to be involved in adaptive control, the TS group should show anomalous start-cue signals in frontal and parietal regions associated with the adaptive control network. Further, because the adaptive control network anomalous connections did not fall along a measurable developmental trajectory, the group differences in start-cue signals should not conform to developmental differences found in typical control subjects.
Second, outside of the adaptive control network, the TS group should exhibit “immature” start-cue or sustained control signals. This immaturity would manifest itself as differences between TS and control adolescent signals more like those found in younger children than adolescent or adult subjects. The presence of child and adult data on similar tasks allowed for assessment of this possibility.
Subjects
All subjects were recruited to participate in two separate visits to the Washington University Neuroimaging Laboratories. The first visit, which lasted about 1.5 h, included the consenting process, an introduction to the scanning environment via a mock scanner, and a battery of neuropsychological tests (see below). The second visit, which lasted about 2 h, was an fMRI scanning session during which anatomical and functional scans were obtained. The Institutional Review Board at Washington University School of Medicine approved all aspects of the study.
Subjects: direct comparison
Forty-five adolescent subjects (ages 9–15 years) with TS were recruited for this study through the Washington University School of Medicine Movement Disorder Center (via database search for pediatric patients with TS, who were interested in research) and the local chapter of the Tourette Syndrome Association (TSA) (presentations at meetings and mailed advertisement). All subjects had a clinical diagnosis of TS from a licensed clinician in the community, with many diagnosed by an author of this study (BLS, who is a pediatric neurologist). Forty-one subjects completed the study, but because of excessive movement or behavioral non-compliance, only 27 had sufficient data (at least five out of eight total runs, median = eight runs) for analysis. Twenty-five of the 27 subjects overlapped with the 33 TS subjects used by Church et al. (2009)
. Two 9-year olds were not used in the previous study due to age matching of those groups.
Forty-six unaffected adolescent subjects (ages 10–15 years) were recruited in an attempt to create a set of subjects matched to the TS group by age, sex, IQ, and behavioral measures for the two tasks
1
. Subjects were recruited from our database of past subjects, flyers in the local community, and through word of mouth by previous subjects. From this dataset, a group of 27 unaffected subjects was matched to the TS group (Table 1
). Twenty-six of the 27 overlapped with the 42 control subjects reported in Church et al. (2009)
. Fewer subjects overall were used in the current study in order to control for task performance between the control and TS groups.
Subjects: region application
Because our hypotheses depend on the ability to assess whether certain regional activity in the TS group is “younger” than expected, we also utilized a “developmental” dataset of typically-developing younger children and unaffected adults. A healthy group of 47 7- to 9-year old children (22 female, mean 8.7 years) was compared to a healthy group of 35 21- to 29- year-old adults (19 female, mean 24.3 years) (Table 2
). These data were used in two different ways. First, regions resulting from the comparison of children and adults were applied to the adolescent groups. Second, regions showing significantly different activity between the adolescents with and without TS were applied to the children and adults to see if the regions showed activity changes over typical development.
Neuropsychological Measures
Each adolescent participant underwent a battery of neuropsychological tests and rating scales during the first visit to assess individual characteristics of interest. All tests were administered by author JAC. The Yale Global Tic Severity Scale (YGTSS) (Leckman et al., 1989
), children’s Yale-Brown Obsessive-Compulsive Scale (CY-BOCS) (Scahill et al., 1997
), and DSM-IV based ADHD rating scale were administered. An estimated IQ from the vocabulary and matrix reasoning sections of the WISC-IV (Wechsler, 2003
) was obtained, as well as measures of working memory (digit span forwards and backwards from WISC-IV), verbal fluency [controlled oral word association COWA-FAS (Benton and Hamsher, 1989
)], and other aspects of executive control [Stroop color-word interference (Golden and Golden, 2002
), and Trails A and B (Reitan, 1971
)]. An estimated IQ from the vocabulary and matrix reasoning sections of the WAIS-III (for adults) and WISC-IV (for children) was also obtained for the unaffected adult and child groups.
Task
A semantic judgment task presented in either a visual or auditory modality was employed.
For the visual modality version of the task, participants saw single black-on-white, line-drawn pictures on the projection screen and pressed one button for “living” items, and the other button for “non-living” items. In between stimulus presentations, a black fixation cross was projected onto the screen. The 152 picture stimuli were chosen from the Snodgrass and Vanderwart standardized set (Snodgrass and Vanderwart, 1980
; Berman et al., 1989
). Eight picture lists of 19 stimuli each were balanced for living/non-living status, and for Battig and Montague category (e.g., four-footed animal, insect, tool, furniture), as described by Snodgrass and Vanderwart (1980)
. As viewed by the participants, stimuli subtended between 1.6 and 5.7 visual degrees horizontally and between 1.1 and 5.2 visual degrees vertically. Relative size is balanced within category in the Snodgrass and Vanderwart set (e.g., a cat is smaller than an elephant; a cherry is smaller than a peach).
For the auditory modality version of the task, participants heard single syllable words (spoken by an adult female native English speaker) through their headphones, and pressed one button for “living” words, and the other button for “non-living” words. Throughout the auditory runs, a black fixation cross was projected onto the screen, and participants were instructed to watch the fixation cross. The 152 auditory stimuli used were derived from the English Lexicon database (Balota et al., 2007
), and early reading word lists. The referents partially overlapped with the picture stimuli (22% of words were names of presented picture objects). Each of eight word lists had 19 stimuli, and was balanced for both living/non-living status and for Battig and Montague category similar to the pictures.
Button assignments were counterbalanced for living/non-living status across subjects.
fMRI Paradigm
A method for extracting and separating start-cue, sustained, and trial-related signals from fMRI blood oxygenation level-dependent (BOLD) data has been demonstrated in multiple papers studying adults (Chawla et al., 1999
; Donaldson et al., 2001
; Visscher et al., 2003
; Wenger et al., 2004
), and children (Wenger et al., 2004
; Burgund et al., 2006
). These studies used the “mixed blocked/event-related design” (henceforth “mixed design”) that allows the separation of signals tied to (1) the start of a specific task, and (2) activity sustained at a constant level across a task period, and (3) individual trials of a task, including error-related activity.
In brief, the mixed design uses aspects of both blocked designs and event-related designs for fMRI. Trials are jittered within a given task block, and task blocks are interspersed with blocks of fixation. Cues indicate the start and end of task blocks. Visscher et al. (2003)
demonstrated that the mixed design could successfully separate sustained activity from transient activity and noise. For this study, the mixed design was used to study the cue-related and sustained signals in a group of TS adolescents and typical controls.
Each participant performed four experimental runs of the living/non-living visual modality of the task, and four runs of the auditory modality of the task. Each run consisted of 124 2.5 second frames of fMRI BOLD data (about 5 min 10 s duration). The modalities were not intermingled within a run. Each run consisted of three fixation-only periods and two task blocks. The black fixation cross changed to red for 1250 ms at the start and end of each task block to cue the participant to start or stop the task. The task blocks were 39 frames long (including start-cues), and within each task block, 19 picture or auditory stimuli were presented in a pseudorandomly jittered manner (the 19 trials within a single task block were jittered with a flat distribution of 0, 1, or 2 frames between stimulus onsets). Stimulus duration was 1300 ms for the pictures, and the average duration of the spoken words for the auditory modality was 696 ms (range 512–996 ms). Run type and list position (i.e., which lists appear together in a run) were varied pseudorandomly across subjects, approximating a counterbalanced design. Button-press responses were recorded, and accuracy and either button press or button release reaction times were noted.
Movement
Participant motion was corrected and quantified using an analysis of head position based on rigid body translation and rotation. The data derived from adjustments needed to realign head movement on a frame-by-frame basis were calculated as root mean square (rms) variance values using in-house software. Movement was assessed in six directions for each frame of every run in each individual: amount in millimeters of x, y, and z translation, and degrees of rotation around x, y, and z axes. Runs with movement greater than 2.0 mm rms variance were excluded from analysis.
Scanning Procedures
Participants were encouraged to minimize movements throughout the scan, but TS participants were instructed not to inhibit their tics. In order to enhance participants’ abilities to maintain head position, a thermoplastic mask that molds to an individual’s face and attaches to the head coil was applied. Headphones dampened scanner noise and enabled communication with participants. A Power Macintosh computer (Apple, Cupertino, CA, USA) and PsyScope software (Cohen et al., 1993
) were used for display of visual stimuli. An LCD projector (Sharp model PG-C20XU) was used to project stimuli onto a MRI-compatible rear-projection screen (CinePlex) at the head of the bore, which the participants viewed through a mirror attached to the coil.
MRI data acquisition
MRI data were acquired on a Siemens 1.5-T Vision system (Erlangen, Germany). Structural images were acquired using a sagittal MP-RAGE three-dimensional T1-weighted sequence (repetition time = 9.7 ms, echo time = 4 ms, flip angle = 12° , inversion time = 300 ms, voxel size = 1.25 mm × 1 mm × 1 mm). Functional images were acquired using an asymmetric spin-echo echo-planar sequence sensitive to BOLD contrast during visual stimulation (Kwong et al., 1992
; Ogawa et al., 1992
) (repetition time = 2.5 s, T2* evolution time = 50 ms, flip angle = 90° , voxel size = 3.75 mm × 3.75 mm in-plane resolution) (Conturo et al., 1996
). One volume, or one MR frame, was acquired every 2.5 s. During each functional run, 124 frames of 16 contiguous interleaved 8 mm thick axial slices were acquired parallel to the plane transecting the anterior and posterior commissures (i.e., the AC-PC plane). This plane was defined with an automated program utilizing a low-resolution MP-RAGE image. The first 4 frames in each run were discarded to allow stabilization of longitudinal magnetization.
fMRI processing and data analysis
Functional images were preprocessed to remove artifacts, including intensity correction, motion correction, and temporal realignment using sinc interpolation (Lancaster et al., 1995
; Snyder, 1996
).
BOLD activity related to the cues, trials, and task period were modeled using the general linear model (GLM) as previously described for the mixed blocked/event-related design (Donaldson et al., 2001
; Visscher et al., 2003
; Wenger et al., 2004
). Sustained maintenance-related activity during task performance was modeled with a square-wave, starting seven MR frames after the beginning of each task block and terminating at the end of each task block. In addition, four types of event-related activity (activity related to start-cues, stop-cues, correct trials, and error trials) were modeled without assuming a shape for seven frames. This approach is equivalent to estimating the finite impulse response evoked by each event and avoids assumptions about the shape of the hemodynamic response function (Worsley et al., 1995
; Josephs et al., 1997
; Zarahn et al., 1997
; Miezin et al., 2000
; Ollinger et al., 2001
). Additionally, baseline and trend effect terms for each BOLD run were included in the GLM. Individual subject data were transformed into a standardized stereotactic atlas space (Talairach and Tournoux, 1988
; Lancaster et al., 1995
; Snyder, 1996
) and interpolated to isotropic voxels 2 mm on a side. The atlas-representative target image was produced by mutual co-registration of independent groups of 12 healthy adults and 12 healthy children. This target image strategy minimizes systematic age differences in the atlas location of cortical structures (see Burgund et al., 2002
). The atlas-transformed image for each participant was checked against a reference average to ensure appropriate fit.
Methods for assessing start-cue signals in the TS and unaffected groups
A voxel-by-voxel analysis of the start-cue signal was conducted through a 2 × 2 × 7 ANOVA which modeled a within factor of modality (auditory vs. visual; two levels) and a between factor level of group (TS vs. unaffected; two levels) in addition to the effect of time (seven levels). Regions of interest (ROIs) for the start-cue analysis of group differences were derived from the resulting ANOVA images including: the main effect of time (“time”), which showed regions where there was a significant timecourse across groups; the interaction of time by group, (“time-by-group”), which identified regions where timecourses differed by group membership; and any interactions of time by modality by group, (“time-by-modality-by-group”). Regions were created from those images using in-house peak-finding software (developed by Dr. Abraham Snyder), using a hard sphere preblur of 4 mm, and were limited to those regions with a main effect of time surpassing a monte-carlo corrected z-score of 3.5 (p < 0.0002) and a minimum size of 24 voxels. The ROIs were then interrogated for their expected effects (e.g. a time by group effect from a region derived from the time by group image from the ANOVA), as well as for any additional effects (e.g. evaluating that same region for time by modality-by-group interaction effects). Regions that showed a significant effect of time by group (p < 0.006, sphericity-corrected) are reported and discussed here. The resulting region set for the start-cue analysis was displayed on an averaged brain anatomical image created from the 54 subjects. Regions centered in white matter or located off of the brain were removed from the analysis. In cases of region overlap (e.g. a region in the main effect of time image and a region in the time-by-modality image closer than 10 mm in coordinate space), the larger of the two regions was preserved.
Methods for assessing sustained signals in the TS and unaffected groups
The analysis of the sustained signal was largely similar to that described for examination of start-cues, though because it was modeled as a boxcar, the sustained signal did not include time as a factor. A voxel-by-voxel analysis of the sustained signal was conducted with a t-test combining signals across the two groups (TS and unaffected adolescents) and two modalities (auditory and visual), creating one image of the sustained signals across these factors. Regions were created using the same in-house peak-finding software, and were limited to those with a main effect surpassing a monte-carlo corrected z-score of positive or negative 2.5 (p < 0.006) and a minimum size of 42 voxels. A lower threshold was used than for the start-cue signal due to the weaker sustained effects. These regions were interrogated for group effects. Regions that showed a significant effect of group (p < 0.05, sphericity-corrected) are reported and discussed here. Regions centered in white matter or located off of the brain were removed from the analysis.
Overall Analysis Approach: Two Analysis Streams
Regions resulting from an analysis of each signal type (start-cue or sustained, as described above) were examined separately, but using an identical approach. Two different analysis streams were used to examine each of the signal types.
First, ROIs resulting from the direct comparison of the adolescents with and without TS were examined for group differences. The regions showing group differences were subsequently interrogated for developmental effects (i.e., did the regions show differences between typical children and adults?) by applying them to unaffected child and adult groups.
The second analysis stream started with identification of regions of difference between the typical children and adults. For each of these regions, the TS and typical adolescent groups were assessed for difference. All results greater than a sphericity-corrected p-value of 0.05 were considered significant (Box, 1954
; McAvoy et al., 2001
). Given this rather liberal threshold, no single region is emphasized in this report.
Three potential conclusions were possible from this approach. First, the TS group activity was considered “functionally appropriate” for an ROI from a given signal analysis if it was not significantly different from the unaffected adolescent group activity. Second, the TS group activity was considered “functionally anomalous” if there was either a mismatch between the direction of activity change over typical development compared to the TS group activity, or if there was a significant difference between the affected and unaffected adolescents, but no difference was observed over typical development. Finally, an ROI was interpreted to be “functionally immature” in the TS group if there was a significant group difference between the TS and unaffected groups in the same direction as a developmental difference (e.g. 7- to 9-year-old children having smaller start-cue activity in a region than adults, and the TS group having smaller start-cue activity than the unaffected group).
Demographics and Behavior
Tic severity in the TS group ranged from mild to moderate, and 12 participants (44%) had diagnosed co-morbidities (primarily ADHD and/or OCD). Nineteen participants (70%) in the TS group were on one or more medications for tic or co-morbid symptoms. These medications were centrally acting adrenergic agents (11 subjects), SSRI anti-depressants (6 subjects), stimulants (5 subjects), atypical neuroleptics (5 subjects), benzodiazepines (2 subjects), or other (3 subjects). Ten subjects were taking more than one medication.
Performance in the adolescent groups on the two modalities of the task was not significantly different for accuracy, or for reaction times (Table 1
). For both groups, accuracy was greater than 96% on the picture version, and 88% on the auditory version. Both groups performed the auditory task significantly slower and less accurately than the picture task (p < 0.001 for each group by t-test). There were no significant group differences on any of the neuropsychological measures (IQ, COWA-FAS, Stroop Interference, Trails B, Digit Span; p > 0.1 for each measure by t-test). As expected, the TS group had a significantly higher tic rating (YGTSS), obsessive-compulsive rating (CY-BOCS), and attention-deficit rating (DSM-IV ADHD rating) than the unaffected group (p < 0.001 for each measure by t-test).
The unaffected child and adult groups used in our analysis stream are summarized in Table 2
.
Start-Cue Activity
The region set showing a significant main effect of time for start-cue activity in the TS and unaffected adolescents largely replicates what was seen in a start-cue meta-analysis of adults (Dosenbach et al., 2006
). The set includes bilateral frontal, parietal, occipital, thalamus, anterior cingulate, and insula regions (Figure 1
A). This finding suggests a level of similarity between the TS and unaffected adolescents.
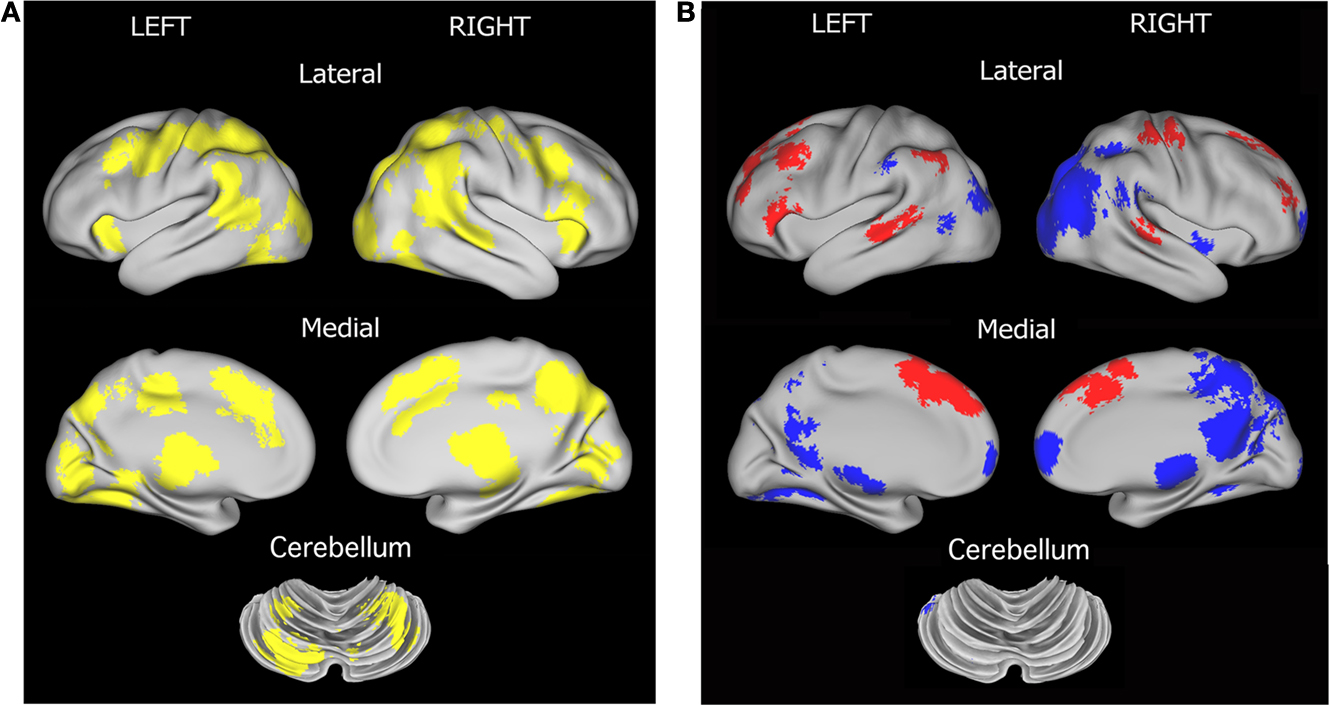
Figure 1. Region sets for each signal type in the direct comparison of adolescent groups. (A) Regions with significant start-cue activity are shown in yellow (main effect of time z-score > 3.5); (B) Regions with significant sustained activity (z-score > 3); Regions with positive sustained signal activity are shown in red, and Regions with negative sustained signal activity are shown in blue. The lateral surfaces of the brain are presented in the top of each set of four, with the medial images on the bottom of each set. The left hemispheres are presented on the left side of each set. A dorsal view of the cerebellum is shown. All brain surfaces in this and subsequent figures were created using PALS and CARET software (Van Essen et al., 2001
; Van Essen, 2002
, 2005
).
However, in a quantitative direct comparison, a significant effect of group was found for 19 regions. In all cases, the TS subjects showed decreased activity relative to their unaffected controls (Table 3
, Figure 2
). Of these ROIs, 13 overlap with adult-derived start-cue ROIs (Dosenbach et al., 2006
). The other 6 regions include right thalamus, right putamen, right precentral gyrus, a left occipital ROI, and bilateral temporal ROIs.
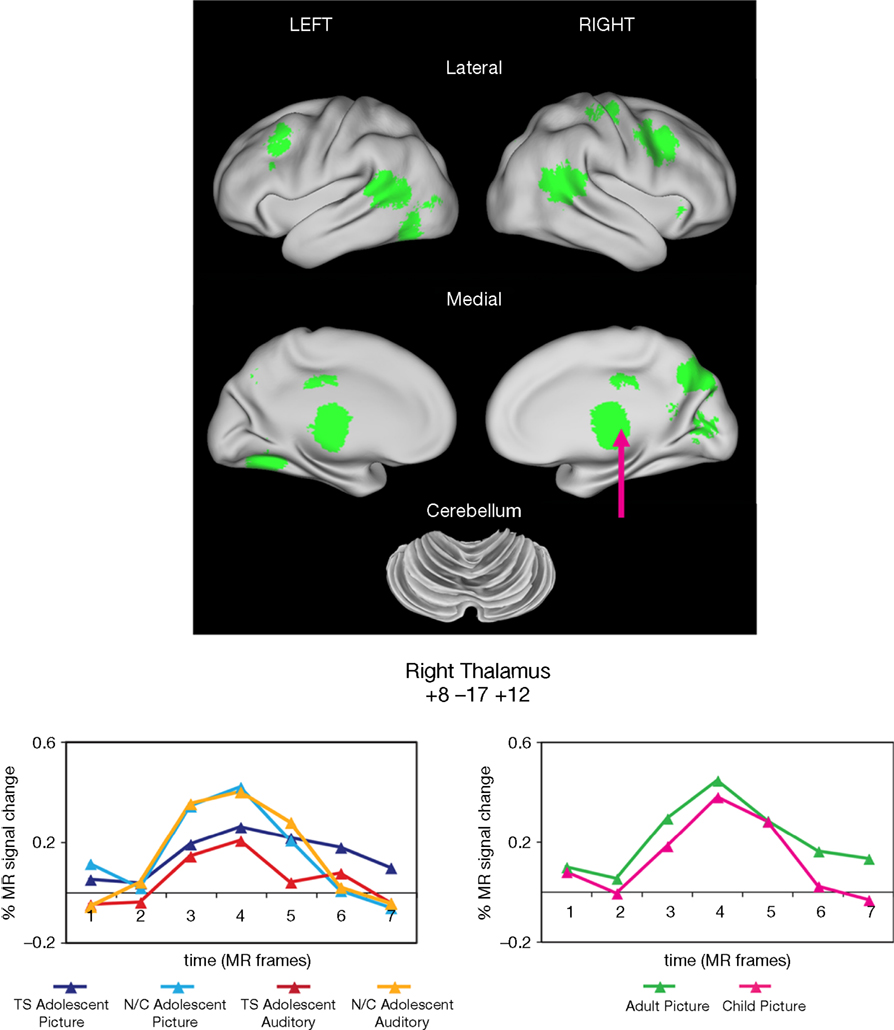
Figure 2. Start-cue group effects. Time by Group effects between the adolescents with and without TS are displayed in green. In all cases, cue activity was greater for the unaffected adolescents (N/C) than those in the TS group. Example timecourses are shown for a region in medial thalamus (arrow). The timecourses for the adolescent groups for both task modalities are shown (left timecourses). There was no significant difference between unaffected child and adult groups for that region during the visual modality task (right timecourses).
These group differences occurred in several regions previously shown to have anomalous resting-state functional connectivity in adolescents with TS (Church et al., 2009
). The group differences in start-cue activity were found in four adaptive control network regions including bilateral frontal, mid-cingulate, and precuneus ROIs. Significantly less start-cue activity in the TS group was also found in bilateral temporo-parietal junction and medial occipital ROIs.
When all 19 of these regions were applied to the typical adult and child groups to determine whether these regions also showed developmental differences, only 2 ROIs, the midcingulate and left fusiform, had a significant group effect between children and adults, and thus 17 regions could be deemed functionally anomalous by our criteria.
Only 5 ROIs showed start-cue differences when typical adults and children were compared. When these five regions were applied to the TS and unaffected adolescent groups, three regions, all in occipital cortex, showed differences between those groups (see Table 4
, Figure S1 in Supplementary Material). The TS group activity appeared more child-like in all three cases. These regions would be deemed “functionally immature” by our criteria. A dorsal medial frontal region and precuneus region were not significantly different between the TS and unaffected adolescents.
The majority of regions showing start-cue group differences in the TS group were regions that have start-cue activity functioning at mature levels in healthy children by the age of seven. The significantly smaller start-cue activity in the TS group for many regions, particularly those in the putative adaptive control network, then, is supportive of a “functionally anomalous” designation for TS adolescents. The decreased start-cue activity in the TS group for these regions cannot be explained by the presence of co-morbidities and/or medication use (see Figure S2 in Supplementary Material).
Sustained Activity
As stated earlier, immature but not anomalous functional connections were characteristic of the task-maintenance cingulo-opercular network in our previous work. We hypothesized, then, that investigation of sustained signaling, a hallmark of the task-maintenance control network, would reveal immature, but not anomalous activity in the TS group.
Regions resulting from the t-test of the sustained signal across groups and modalities in the current study largely replicate what has been seen previously in mixed design studies [i.e., (Dosenbach et al., 2006
) and see Figure S1 in Supplementary Material] (Figure 1
B). Significant negative sustained signal across groups was found in bilateral precuneus, occipital, and ventral frontal regions, while positive sustained signal was evident in bilateral temporal, anterior cingulate, parietal and frontal regions.
Significant group differences, however, were found between the unaffected and TS groups for the sustained signal in 7 ROIs located in bilateral frontal cortex (Table 5
, Figure 3
). In all 7 ROIs, the TS group showed significant positive sustained signal across modalities, while the unaffected group did not.
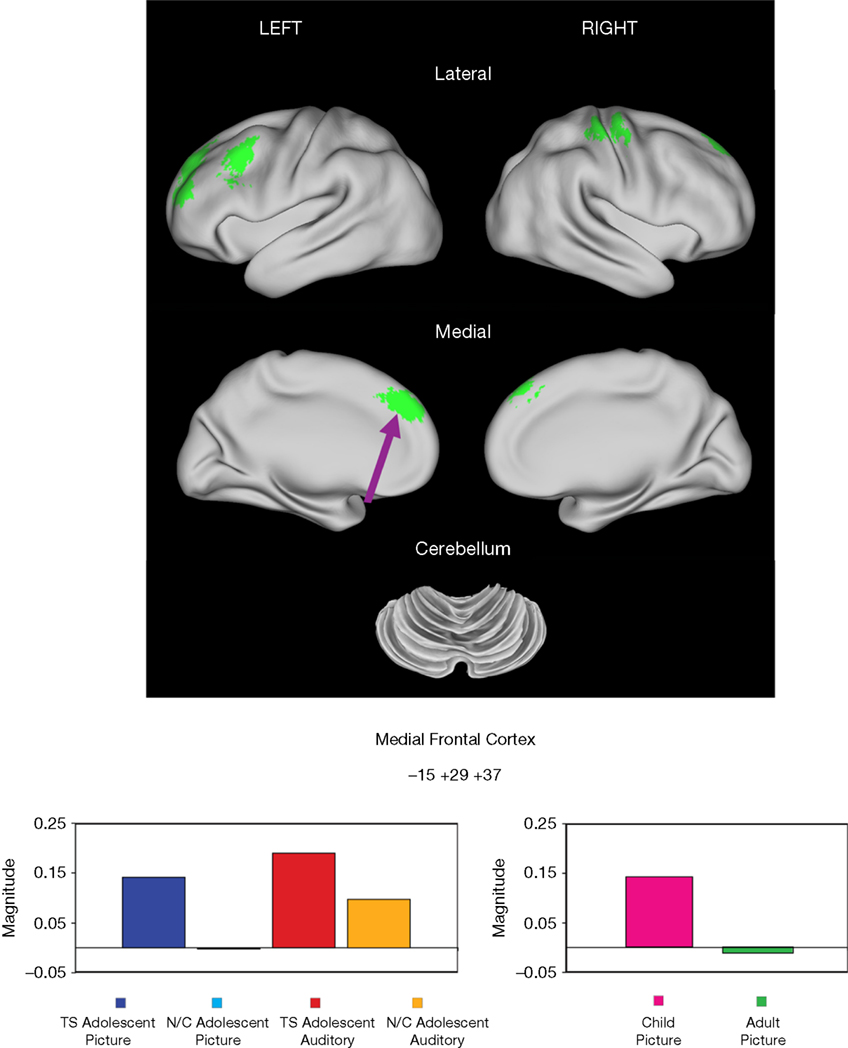
Figure 3. Sustained activity group effects. Regions showing significant differences in sustained activity between TS and unaffected adolescents (N/C) are displayed in green. All significant differences were in frontal cortex. An example of the sustained magnitudes for each adolescent group for each task modality is shown for a medial frontal region (arrow) (left magnitude set). This same region also showed a significant developmental effect between healthy children and adults for the picture version of the task. Note the similarity between the TS group and the younger healthy children for the visual modality of the task, while activity for the age-matched unaffected adolescents is more similar to that observed in adults for the region for that task.
When these regions were applied to the unaffected adult and child datasets, two regions showed a significant developmental difference in activity between healthy adults and children. An additional two regions were significantly positive in children but not in adults, but without a clear and significant group difference. In all four regions, the TS group was more similar to the child group, while the unaffected adolescents were more similar to the adult group.
Twenty-one regions were found to be significantly different between the typical child and adult groups for the sustained signal, and were located in frontal, fusiform, and temporal cortex, and the cerebellum (Table 6
, Figure S1 in Supplementary Material). Four of these regions, all located in frontal cortex, were significantly different between the TS and unaffected adolescents. All four regions were significantly positive in the unaffected child and TS groups, and not significantly active in the unaffected adolescent and adult groups. The findings for the TS group, as in the start-cue analysis above, cannot be explained by the presence of co-morbidities and/or medication use (Figure S3 in Supplementary Material).
Overall, analysis of sustained signal indicates that, when different, the activation in adolescents with TS appears more similar to younger children than their age-matched control group, with this “functionally immature” sustained signaling being confined to frontal regions.
In the Introduction, we proposed two hypotheses concerning fMRI analysis of task control-related signaling in adolescents with TS. First, we hypothesized that the TS group will show anomalous start-cue activity in the adaptive control network. Second, we hypothesized that the TS group, when different from adolescent controls, will have “immature” start-cue and sustained activity in putative control regions outside of the adaptive control network.
TS Group has Anomalous Adaptive Control Activity
The differences in start-cue signaling between the TS and unaffected adolescent groups were not similar to those observed over typical development. The results for start-cues in particular were suggestive of an abnormality that is not explained by functional immaturity in TS, at least within the typically-developing age range we collected (7–29 years).
Start-cue group differences were evident in regions that belong to the adaptive control fronto-parietal network, and in additional regions that consistently have start-cue activity at mature levels from the age of 7 years (i.e., no difference between typical children and adults). The transient nature of the start-cue activity makes it part of an adaptive as opposed to task-set maintenance control network (Dosenbach et al., 2006
, 2008
). Thus, anomalous start-cue activity in the TS group supports the previous rs-fcMRI finding of anomalous adaptive control (Church et al., 2009
). However, in the present study, the extent of anomalous activity did not appear to be limited to the frontal and parietal regions found in the rs-fcMRI study. Rather, the anomalous activity seemed extensive throughout typical start-cue-related regions. A possible reconciliation between these results is that the additional start-cue-related regions demonstrating anomalous activity are mildly affected in TS, rendering them as evidently different in a particular task, but not in the rs-fcMRI correlations.
It is also possible that the observed differences in start-cue activity are related to extreme immaturity, such that the TS start-cue activity is most similar to an age group younger than that which we have scanned (younger than age 7 years). While the majority of start-cue-related regions appear to have adult-like levels of signaling by age seven, start-cue signals may be smaller (and thus more similar to the TS group) in younger children. Future work will need to include acquisition of data from younger subjects.
Anomalous activity in start-cue signaling suggests that TS might affect the ability to transition between task states, and that the signals related to initiation of desired task control might be competing with unwanted moment-to-moment activity (i.e., tics) that characterizes the disorder. Alternatively, some researchers have demonstrated that young individuals with TS actually show smaller task switching costs than age-matched unaffected individuals on an occulomotor switching task (Mueller et al., 2006
; Jackson et al., 2007
). They suggest this decreased switch cost is due to an enhanced control system resulting from years of tic suppression. Thus, the anomalous (decreased) adaptive control signaling that we observe in TS start-cue activity, and the increased sustained signals observed in frontal cortex, could be a reflection of a control system that has become more efficient for certain task demands. This possibility and the alternative (that patients with TS have an impaired adaptive control network) can be explored further in the future by attempting to tax the adaptive control system by manipulating task rules, frequency of switching, or task difficulty (e.g. Baym et al., 2008
).
Previous research has pointed to abnormal cortical-striatal-thalamic-cortical signaling in TS (e.g., Singer, 2005
; Albin and Mink, 2006
). The significant under-activity observed in the thalamus for start-cue signals, and the increased activity in frontal regions for sustained signaling could be related to this type of signaling pathway. However, the lack of a common signal being significantly different in TS for these regions makes the explanation less straightforward. There could be sustained over-activity in frontal cortex that is related to transient under-activity in the subcortical structures. However, we also see this transient under-activity in other motor-related regions including motor cortex and cerebellum, as well as left insula (trial-related activity; data not shown), suggesting that subcortical structures are not uniquely showing this activity pattern in TS.
TS Group Appears Functionally Immature Compared to Age-Matched Controls in Sustained Signaling
The sustained signal differences between the TS and unaffected adolescent groups overlapped substantially with the differences found between unaffected children and adults in frontal cortex (compare Figure 3 and Figure S1 in Supplementary Material). The observation that the TS group has positive sustained activity in medial and left dorsolateral frontal regions while the unaffected group does not, and that typical children have positive sustained activity in similar or overlapping frontal regions, while typical adults do not, suggests that sustained control is functionally more immature in the TS group than in the unaffected peers.
A key finding described in our previous rs-fcMRI research is that over development the adaptive control network and task-maintenance control network become more segregated, while in 7- to 9-year-old children they have a number of interconnections, particularly between frontal regions (Fair et al., 2007
). Similarly, we report here that the sustained signal is elevated in typically-developing children in parts of the brain beyond the task-maintenance control network (Figure S1 in Supplementary Material). We find, however, that sustained signals are apparently adult-like by typical adolescence. The presence of elevated sustained signal in frontal regions in adolescents with TS (similar to that observed in unaffected younger children) could be a reflection of a delay in segregation of the two control networks in TS.
A left dorsolateral region (Talairach coordinates −48, 13, 39) that has greater positive sustained signal in TS adolescents compared to age-matched unaffected adolescents is similar in location to the left frontal regions of difference found between children and adolescents with and without TS in Baym et al. (2008)
(−48, 23, 24; 18 mm vector distance away) and Marsh et al. (2007)
(−42, 14, 32; 9.3 mm vector distance away) where the TS group had greater activity than the unaffected group. Both of these studies have suggested that the greater frontal activity they observed in children with TS is related to engagement of compensatory processes to make up for impaired control signaling in other regions, including the striatum. These regions are also close to a region (Talairach coordinates −40, 26, 33; vector distance 16.4 mm away from TS region; see Table 6
), which shows a difference between unaffected children and adults (and both adolescent groups). The similarity to a region of developmental change suggests that the hypothesized compensatory processes could instead be delayed maturity of this general region in TS, or an interaction of these concepts.
Typical Development is an Important Tool for Understanding Atypical Development
These results, particularly in combination with the data from (Church et al., 2009
), emphasize the importance of having an understanding of typical development in order to place results from atypical populations in context (see also Johnson et al., 2002
). The set of regional differences we observe for each signal type (e.g. start-cue signals) between adolescents with and without TS is much enhanced by our understanding of whether those regions also change over development during the same semantic judgment task. An understanding of the developmental trajectories of regional activity during a given task is critical for interpreting results in the transitional environment of adolescence. In addition, it is important to note that we observe both elevated activity in the TS group (sustained signals) and decreased activity in the TS group (start-cue signals), suggesting that there may not be a simple shift in signaling level in the TS group. Thus, the developmental trajectories of these signals are all the more critical to providing a plausible interpretation of these results.
It is interesting to note that these functional activation differences were observed in the TS group despite a lack of behavioral and neuropsychological differences. These results suggest that despite a lack of performance differences on this relatively easy task, the brain activity in TS is functionally different, demonstrating the added value of neuroimaging tools to behavioral and clinical measures.
Investigating developmental trajectories across patients with TS is an important consideration for future study. The TS group size in the present study is not sufficiently large to address age-related changes across the span of 9–15 years, the age of the subjects from whom data has been acquired at this point. However, future studies could examine whether there are different signal results between younger and older TS participants, or could test whether TS participants experiencing a relief of symptoms with age also show a recovered maturity of functional signaling.
Is Functional Immaturity Specific to TS?
While functional immaturity is not a feature that has been well characterized in TS, immaturity using neuroimaging measures has previously been reported in studies of other developmental disorders including autism (Courchesne and Pierce, 2005
; Just et al., 2007
; Turner et al., 2006
; Langen et al., 2009
) and ADHD (Tian et al., 2006
; Durston et al., 2007
; Kelly et al., 2007
; Shaw et al., 2007
; Sonuga-Barke and Castellanos, 2007
; Vance et al., 2007
; Rubia et al., 2009a
). At present it remains unclear whether these functional immaturities are common across different developmental disorders and whether or not they involve the same or similar brain regions.
Furthermore, it is possible that there are confounding factors in the TS group that are contributing/accounting for the functional immaturity and/or anomalous signaling results. For example, ADHD is a common co-morbidity with TS, and thus it is also present in a subset of our TS participants. Similarly, medication could be playing a role in the observed sustained or start-cue activity differences observed in the TS group. While our study is underpowered to do a full analysis of the effects of co-morbidities and medications, when we examined subgroups on and off medication, or with and without co-morbidities, within our whole TS group, there was no consistent indication that the results reported here could be explained by medication use and/or co-morbidities (Figures S2 and S3 in Supplementary Material). The use of medication and frequent diagnosis of co-morbidities in TS are challenging but important issues that need to be more fully addressed in future studies. Finally, movement during scanning, while strictly limited for all subjects in this analysis, and not correlated with any signal type (data not shown), could possibly account for some of our group differences.
The authors declare that the research was conducted in the absence of any commercial or financial relationships that could be construed as a potential conflict of interest.
We sincerely thank the participants for their time and commitment to this project. We are grateful to Ansley Grimes and Rebecca Coalson for their help with data acquisition. We thank Mark McAvoy for his assistance. We thank Jonathan Power for helpful suggestions. Supported by the John Merck Scholars Fund, Burroughs-Wellcome Fund, Dana Foundation, Tourette Syndrome Association, and NIH K02NS053425 (BLS). Jessica A. Church received funding from the Mr. and Mrs. Spencer T. Olin Fellowship Program at Washington University. Portions of this work were presented at the 38th annual meeting of the Society for Neuroscience.
The supplementary material for this article can be found online at http://www.frontiersin.org/humanneuroscience/paper/10.3389/neuro.09/038.2009/
- ^ “Button press” reaction times were recorded for 17 of the TS subjects. Reaction time matching for the two tasks is based on comparing reaction times for these TS participants with the unaffected group. Accuracy measures include all 27 TS participants.
Durston, S., Davidson, M. C., Mulder, M. J., Spicer, J. A., Galvan, A., Tottenham, N., Scheres, A., Castellanos, F. X., van Engeland, H., and Casey, B. J. (2007). Neural and behavioral correlates of expectancy violations in attention-deficit hyperactivity disorder. J. Child. Psychol. Psychiatry 48, 881–889.
Gilbert, A. R., Akkai, D., Almeida, J. R. C., Mataix-Cols, D., Kalas, C., Devlin, B., Birmaher, B., and Phillips, M. L. (2009). Neural correlates of symptom dimensions in pediatric Obsessive-Compulsive Disorder: A functional magnetic resonance imaging study. J. Am. Acad. Child Adolesc. Psychiatry 48, 936–944.
Kwong, K. K., Belliveau, J. W., Chesler, D. A., Goldberg, I. E., Weisskoff, R. M., Poncelet, B. P., Kennedy, D. N., Hoppel, B. E., Cohen, M. S., Turner, R., Cheng, H.-M., Brady, T. J., and Rosen, B. R. (1992). Dynamic magnetic resonance imaging of human brain activity during primary sensory stimulation. Proc. Nat. Acad. Sci. U.S.A. 89, 5675–5679.
Rubia, K., Cubillo, A., Smith, A. B., Woolley, J., Heyman, I., and Brammer, M. J. (2009a). Disorder-specific dysfunction in right inferior prefrontal cortex during two inhibition tasks in boys with attention-deficit hyperactivity disorder compared to boys with obsessive-compulsive disorder. Hum. Brain Mapp. [Epub].
Rubia, K., Smith, A. B., Halari, R., Matsukura, F., Mohammad, M., Taylor, E., and Brammer, M. J. (2009b). Disorder-specific dissociation of orbitofrontal dysfunction in boys with pure conduct disorder during reward and ventrolateral prefrontal dysfunction in boys with pure ADHD during sustained attention. Am. J. Psychiatry 166, 83–94.
Van Essen, D. C. (2002). Windows on the brain: the emerging role of atlases and databases in neuroscience. Curr. Opin. Neurobiol. 12, 574–579. Available at: http://pulvinar.wustl.edu:8081/sums/search.do?filename=ATLAS&filetype=tar.gz/
Van Essen, D. C., Dickson, J., Harwell, J., Hanlon, D., Anderson, C. H., and Drury HA (2001). An integrated software suite for surface-based analyses of cerebral cortex. J. Am. Med. Inform. Assoc. 41, 1359–1378. Avilable at: http://brainmap.wustl.edu/caret/