Low and high gamma oscillations in rat ventral striatum have distinct relationships to behavior, reward, and spiking activity on a learned spatial decision task
Department of Neuroscience, University of Minnesota, Minneapolis, MN, USA
Local field potential (LFP) oscillations in the brain reflect organization thought to be important for perception, attention, movement, and memory. In the basal ganglia, including dorsal striatum, dysfunctional LFP states are associated with Parkinson’s disease, while in healthy subjects, dorsal striatal LFPs have been linked to decision-making processes. However, LFPs in ventral striatum have been less studied. We report that in rats running a spatial decision task, prominent gamma-50 (45–55 Hz) and gamma-80 (70–85 Hz) oscillations in ventral striatum had distinct relationships to behavior, task events, and spiking activity. Gamma-50 power increased sharply following reward delivery and before movement initiation, while in contrast, gamma-80 power ramped up gradually to reward locations. Gamma-50 power was low and contained little structure during early learning, but rapidly developed a stable pattern, while gamma-80 power was initially high before returning to a stable level within a similar timeframe. Putative fast-spiking interneurons (FSIs) showed phase, firing rate, and coherence relationships with gamma-50 and gamma-80, indicating that the observed LFP patterns are locally relevant. Furthermore, in a number of FSIs such relationships were specific to gamma-50 or gamma-80, suggesting that partially distinct FSI populations mediate the effects of gamma-50 and gamma-80.
Local field potential (LFP) oscillations are thought to reflect organization underlying a wide range of processes across different brain areas, including attention, perception, movement planning and initiation, and memory (Buzsáki, 2006
; Fries et al., 2007
; Lisman, 2005
). In the basal ganglia specifically, abnormal LFP patterns are a key biomarker for Parkinson’s disease, as indicated by correlations between LFP properties and the severity of movement-related impairments (Brown, 2007
; Hammond et al., 2007
). Treatment by deep brain stimulation (DBS) or levodopa reduces pathological LFP patterns while alleviating symptoms (Brown, 2003
; Perlmutter and Mink, 2006
). While the majority of such work has focused on the subthalamic nucleus (STN) and globus pallidus (GP), there is also evidence linking altered LFPs in dorsal striatum to the Parkinsonian state (Courtemanche et al., 2003
; Goldberg et al., 2004
; Levy et al., 2002
; Raz et al., 2001
). In healthy subjects (rats), dorsal striatal LFPs have been linked to learning and performance of a procedural maze task (DeCoteau et al., 2007
; Tort et al., 2008
). Such findings suggest that dorsal striatal LFPs are associated with functionally relevant processing in movement-related as well as more cognitive settings.
In contrast, LFP oscillations in ventral striatum have been less studied. Ventral striatum, and the nucleus accumbens in particular, is a central site in the processing of reward information, and has a complex role in a wide range of goal-directed, motivated behaviors (Berridge, 2007
; Cardinal et al., 2002
; Day and Carelli, 2007
; Ikemoto and Panksepp, 1999
; Kelley, 2004
; Nicola, 2007
). Anatomically, it is well placed to integrate inputs from frontal cortex, amygdala, and hippocampus with dopaminergic input from the ventral tegmental area to influence motor actions (Goto and Grace, 2008
; Mogenson et al., 1980
; Voorn et al., 2004
). Accordingly, ventral striatum is a key site for mechanisms involved in addiction (Hyman et al., 2006
; Kalivas and Volkow, 2005
; Wise, 2008
), and is increasingly studied in the context of other reward- and motivation-related pathologies such as depression (Nestler et al., 2002
; Salamone et al., 2005
; Vassoler et al., 2008
; Yadid and Friedman, 2008
) and obsessive-compulsive disorder (OCD; Münte et al., 2008
; Sturm et al., 2003
; Wise and Rapoport, 1989
). Ventral striatum is starting to be explored as a DBS target to treat psychiatric disorders (Aouizerate et al., 2009
; Kuhn et al., 2007
; Okun et al., 2007
; Schlaepfer et al., 2008
; Tass et al., 2003
); recordings from human ventral striatum obtained in such settings have revealed reward-related oscillations (in the gamma range, Cohen et al., 2009
). Both frontal cortical areas and the hippocampus exhibit prominent oscillatory activity that could impact ventral striatal processing (Bragin et al., 1995
; Magill et al., 2005
; Varela et al., 2001
); however, it is not known if ventral striatum exhibits oscillatory structure that could support such afferent interactions. Thus, the study of LFPs in ventral striatum is a potentially valuable tool not just in elucidating the organization of its neural mechanisms and its relationship with functionally related structures, but also in the diagnosis and treatment of the wide range of reward- and motivation-related pathologies associated with ventral striatal dysfunction.
Relatively little is known about the behavioral correlates of ventral striatal LFPs in healthy subjects. Whereas ventral striatal LFP oscillations in vivo (in rats) have been reported previously, these have generally not been related to task, behavioral, and reward parameters (Berke et al., 2004
; Hunt et al., 2006
; Kasanetz et al., 2002
; Leung and Yim, 1993
; but see Gruber et al., 2009
for a recent exception). Recording from a range of sites in striatum, Berke et al. (2004)
reported a gradient in gamma power along the dorsolateral-ventromedial axis, with increasing power in the ventromedial aspect. Masimore et al. (2005)
found transient 50 Hz events preceding movement, and noted a similar gradient to that reported by Berke et al. (Masimore, 2008
). This suggests that 50 Hz gamma oscillations may be particularly important in ventral striatum. Interestingly, Kalenscher et al. (2008)
found reward-related gamma oscillations in ventral striatum, but in contrast to Masimore et al. (2005)
, only a weak relationship to movement parameters. While these results do not imply that gamma oscillations in ventral striatum are locally generated, preliminary reports have found phase relationships between individual ventral striatal units and the gamma rhythm (Berke, 2005
; Kalenscher et al., 2008
), suggesting that at least, ventral striatal LFPs are related to spiking activity, but these relationships have not been examined on a population level. Thus, while there are preliminary suggestions, the relationship between ventral striatal LFPs to task-relevant variables and spiking activity is currently poorly understood.
To address this, we recorded LFPs and putative fast-spiking interneurons (FSIs) from ventral striatum as rats learned a spatial decision task (Multiple-T) to earn food rewards. The structure of this task allowed us to examine the distribution of LFP patterns relative to decision points, movement initiation, and reward. In a parallel study (van der Meer and Redish, 2009
), we examined the activity of putative medium spiny neurons; here we analyzed LFPs and their relationship to FSIs from the same data set.
Subjects
Four male Brown Norway-Fisher 344 hybrid rats (Harlan, IA, USA), aged 10–12 months at the start of behavioral training, were trained to run the Multiple-T task, as described previously (van der Meer and Redish, 2009
). Rats were food deprived to no less than 85% of their free-feeding body weight during behavioral training; water was available ad libitum in the home cage at all times. Animals were housed individually and maintained on a 12-h light/dark cycle, with the lights on during the day, when training and recording sessions took place. All procedures were conducted in accordance with National Institutes of Health guidelines for animal care and approved by the Institutional Animal Care and Use Committee (IACUC) at the University of Minnesota. Care was taken to minimize the number of animals used in these experiments and to minimize suffering. The four animals included in this study were the same as those used in van der Meer and Redish (2009)
, except that one animal from that earlier study (R129) was excluded (before the start of analyses) owing to uncertain histological localization of recording sites; this can be more problematic for LFP recordings than for unit recording.
Surgery
Surgical and histological procedures were as described previously (Johnson and Redish, 2007
; Schmitzer-Torbert and Redish, 2004a
; van der Meer and Redish, 2009
). Briefly, rats were chronically implanted with a movable electrode array consisting of 12 tetrodes and 2 reference electrodes (Kopf, Tujunga, CA, USA) targeting ventral striatum (coordinates: AP +1.2, ML ±2.3–2.5 mm relative to bregma). Tetrodes were constructed from 0.0127-mm diameter wire insulated with polyamide (Kanthal Precision Wire, Palm Coast, FL, USA) and gold-plated to impedances in the 250–300 kΩ range (measured at 1 kHz, BAK Electronics IMP-1). Reference electrodes consisted of tetrodes with all four channels connected at the interface board level (before the headstage pre-amps), gold-plated to 200–250 kΩ impedance. After the completion of experiments, the location of each tetrode was marked by passing a small amount of current through each tetrode (10 μA for 5–10 s) for subsequent histological localization.
Multiple-T Task and Training
Briefly, the Multiple-T task is a modified continuous T-maze consisting of a sequence of T-choices, with the final choice between two return arms (Schmitzer-Torbert and Redish, 2004a
; Figure 2
A). In any given 40-min session, only one return arm contained food reward, but the rewarded side, as well as the sequence of T’s, was varied from session to session. If the correct return arm was chosen, two 45-mg food pellets were delivered electronically at each of two reward sites once the control software detected the rat crossing the “trigger line” for that site (solid lines in Figure 2
A). Because the pellet dispensers were located some distance away from the track, pellets took about 1.5–2 s from the trigger time to arrive. Except for rare misses, rats were able to catch the pellets with their mouth as they appeared. As described before (Johnson and Redish, 2007
; Schmitzer-Torbert and Redish, 2004a
; van der Meer and Redish, 2009
), rats were pre-trained to run laps on the task before surgery, and were physically prevented from running in the wrong direction by the experimenter. After being allowed to recover rats were returned to training, and once they were running proficiently with recording equipment, a 21-day recording protocol began. For the first 7 days, maze configurations (the sequence of turns and the rewarded side) were changed, followed by seven repetitions of the seventh configuration, followed again by seven changing configurations. Configurations were not repeated except for the seven repetitions; data from all sessions was pooled for the present analysis. For details, see van der Meer and Redish (2009)
.
Data Collection
Neural activity was recorded using a 64-channel Cheetah recording system (Neuralynx, Bozeman, MT, USA) as described previously (Johnson et al., 2007
). This system’s “plug board” allowed the simultaneous recording of unit and LFP activity, passed through different amplifiers. LFPs were continuously sampled at 1990.4 Hz, amplified 500 or 1000 times, band-pass filtered between 1 and 475 Hz (hardware filters, Cheetah recording system, Neuralynx) and recorded to disk, with at least one LFP recorded from each tetrode. When multiple LFPs were recorded from the same tetrode, only one was included for analysis. All LFP recordings were referenced against a reference electrode positioned in or near the corpus callosum overlying ventral striatal recording sites. Spiking activity was recorded and isolated using standard procedures, as described previously (van der Meer and Redish, 2009
).
Data Analysis
Local field potential pre-processing
Before analysis, DC offsets and slowly changing components were removed from all LFP recordings by applying the locdetrend function in the Chronux
1
2.00 toolbox (Mitra and Bokil, 2008
), which subtracts the linear regression line fit within a 1-s moving window.
Average power spectral density estimation
Average power spectral densities (PSDs) were constructed for each 40-min recording session by first filtering the raw LFP trace using a 300-Hz low-pass filter (fourth order Butterworth; filter and filtfilt routines, MATLAB R2007b signal processing toolbox) and downsampling to 663.5-Hz sampling frequency. A Welch spectral estimator (Percival and Walden, 1993
, Sect. 6.17) was then applied to obtain the PSD (MATLAB Signal Processing Toolbox, spectrum.welch; this effectively implements Eq. 2, below, using a single Hamming window taper and 50% overlapping 200-ms time windows).
Gamma power estimation
To estimate changes in gamma power on behavioral time scales, a spectrogram was constructed for each LFP trace using the multitaper method (Mitra and Bokil, 2008
; Percival and Walden, 1993
). As described previously for neural data (DeCoteau et al., 2007
; Pesaran et al., 2002
) this method estimates the spectral power S(f) in a finite, sliding time window by averaging over Fourier transforms (discrete Fourier transforms evaluated using the Fast Fourier Transform algorithm on zero-padded data) obtained from each of a set of K orthogonal tapers applied to the data:

with

where T is the number of points in the time window in which the spectrum is estimated, wt(k) are the tapers, and xt is the signal. The tapers are the first K functions that optimize spectral concentration (the tradeoff between broadband and narrowband bias inherent in spectral estimation), known as Slepians (Mitra and Bokil, 2008
; Percival and Walden, 1993
). We used the Chronux mtspecgramc function for MATLAB, with the following parameters: window size, 0.5 s; time step, 50 ms; five tapers; bandwidth 6 Hz. From the resulting spectrogram, power in the 45–55 Hz frequency range was averaged to obtain a “gamma-50” time series which could then be analyzed as a function of time and spatial location. Average power in the 70–85 Hz range was used for “gamma-80”.
Spike phase estimation
To obtain the mean phase angle of putative FSI spiking relative to ongoing gamma oscillations, LFPs were first band-pass filtered (fourth order Chebyshev, r = 0.5, MATLAB filter and filtfilt routines; 45–55 Hz for gamma-50, 70–85 Hz for gamma-80) before a Hilbert transform was applied to obtain the instantaneous phase angle. A histogram of spike counts in each of 10° phase bins was constructed, and Rayleigh’s r test used to determine the significance of deviations from the uniform distribution (Fisher, 1993
).
Spike-field coherency estimation
In order to estimate the relationship between spike timing and the ongoing LFP at different frequencies and over time, spike-field coherograms were computed for each spike train. The spike-field coherogram estimates the coherency C between the spike spectrum and the LFP spectrum for each frequency f:

with

where xk and yk are the LFP spectrum (Equation 2) and the spike spectrum (the Fourier transform of the spike train’s autocorrelation function; Jarvis and Mitra, 2001
) respectively. Coherency is a complex quantity with magnitude and phase information; the magnitude is known as the coherence, and varies between 0 and 1, where 0 indicates independence and 1 perfect phase locking (Fries et al., 2001
). We used the Chronux cohgramcpt function, with the following parameters: window size, 0.5 s; time step, 100 ms; nine tapers; 10 Hz bandwidth, using spike and LFP data taken from the same tetrode. Coherograms were averaged over all time steps to obtain the overall coherence for each spike train.
Because spike-field coherence depends weakly on mean firing rate even for Poisson spike trains (Curtis et al., 2009
), as well as on LFP amplitude, we determined coherence significance levels using a bootstrap. For each spike train, the order of interspike intervals (ISIs) was randomized 500 times to generate a set of shuffled spike trains which preserved both the cell’s mean firing rate and its ISI distribution. Spike-field coherence was computed for all shuffled spike trains to yield a distribution of coherence values expected if there were no relationship between spike times and the LFP. Significance of the observed coherence for the (unshuffled, observed) spike train was then computed from the z-score against this distribution. We used freely available, cross-platform distributed computing software (Condor
2
) with MATLAB to speed up this computationally intensive task.
Spike train classification
The striatum contains a number of different cell types which can be distinguished on the basis of morphological, cytological, and electrophysiological characteristics (Bennett and Wilson, 2000
; Gerfen, 1988
; Kawaguchi, 1993
). Standard extracellular recording techniques are limited to using waveform shape or spike train statistics for cell type classification. While necessarily indirect, such approaches have been reported to match well with independently identified cell types (Mallet et al., 2005
). We took a conservative approach in identifying putative parvalbumin-positive (PV+), aspiny FSIs by including only those cells which met both waveform shape criteria (Berke et al., 2004
; Mallet et al., 2005
; Sharott et al., 2009
) and spike train criteria (Barnes et al., 2005
; Schmitzer-Torbert and Redish, 2004b
, 2008
). Thus, only neurons that had less than 40% of total recording time in ISIs smaller than 2 s, and a post-spike suppression period of less than 0.1 ms (Schmitzer-Torbert and Redish, 2008
), as well as a waveform peak width smaller than 0.15 ms, waveform valley width smaller than 0.35 ms, and a firing rate above 2 Hz (adapted from Berke et al., 2004
) were considered (Figure 1
). Additionally, only cells with L-ratio (a measure of isolation quality, Schmitzer-Torbert et al., 2005
) ≤0.1 and average peak amplitude ≥80 μV were included for analysis. We did not make attempts to distinguish neurons that were recorded for multiple recording sessions, so inferences about the frequency or distribution of certain properties over this population should be made with this potentially uneven sampling in mind.
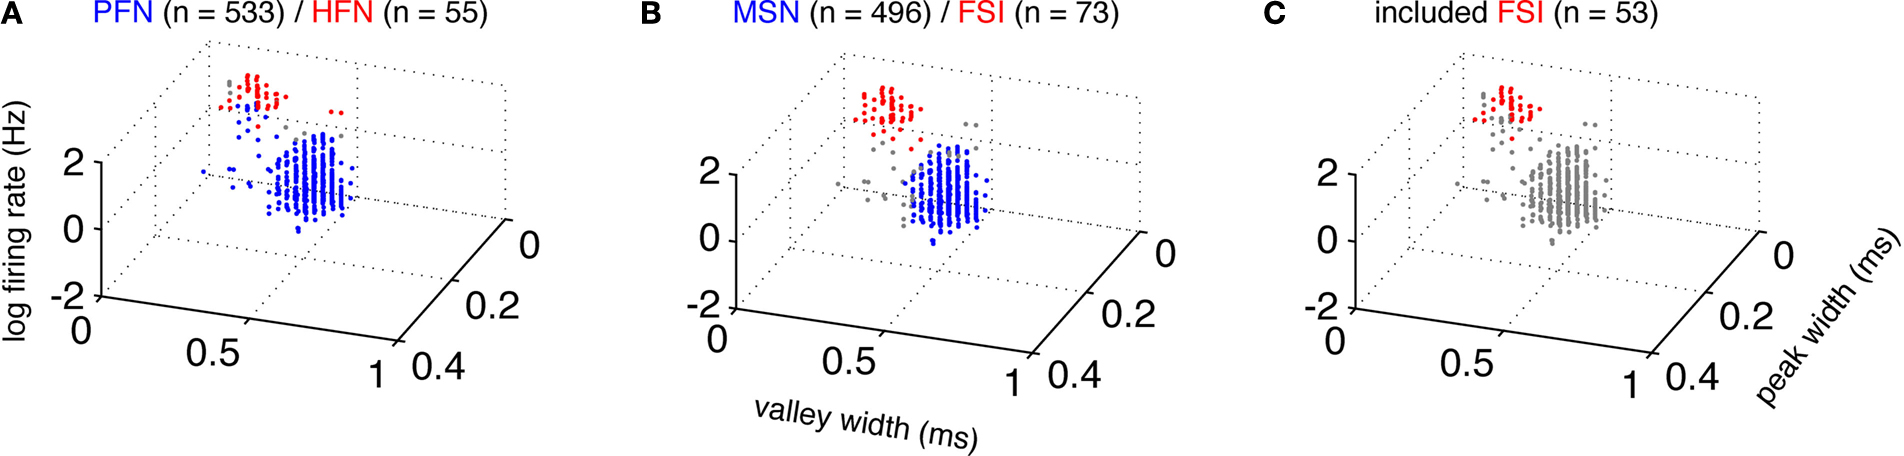
Figure 1. Cell classification. Average extracellular waveforms were plotted by peak width, valley width, and firing rate (note log scale). Consistent with previous reports (Berke et al., 2004
; Sharott et al., 2009
) waveforms separated into a large and a small cluster, thought to contain mostly medium spiny neuron (MSN) and fast-spiking interneuron (FSI) waveforms respectively. Classification based on spike train statistics only (A) identified 55 high-firing neurons (HFNs; Barnes et al. 2005
; Schmitzer-Torbert and Redish, 2004b
, 2008
; PFNs are “phasically firing neurons”). Classification based on waveform shape and firing rate (waveform peak width smaller than 0.15 ms, waveform valley width smaller than 0.35 ms, and a firing rate above 2 Hz) identified 73 putative FSIs (B). The 53 neurons that satisfied both the spike train and waveform-based classification criteria for putative FSIs (C) were included for analysis. Because FSIs are thought to be rare in ventral striatum (Berke et al., 2004
; Cowan et al., 1990
; Kita et al., 1990
), the relatively high (10–15%) percentage of FSIs we observed may stem from the fact that our recording sites were somewhat more dorsal (but clearly in ventral striatum overall, see Figure 3
).
Data set details
Four out of 84 recording sessions were excluded before analysis for technical reasons, leaving a total of 80 sessions (R117: 19, R119: 21, R131: 19, R132: 21) with 921 LFPs (R117: 229, R119: 212, R131: 228, R132: 252, representing a total of 614 h of LFP data) and 53 putative FSIs (R117: 23, R119: 14, R131: 2, R132: 14).
Behavioral analyses
In order to allow comparison across different maze configurations, position data were linearized and warped to two experimenter-drawn idealized paths (Schmitzer-Torbert and Redish, 2004a
), one path for correct (rewarded) laps and one for incorrect (unrewarded) laps. All data where the rat deviated more than 10 cm from the relevant path were excluded from analysis. Turnaround points, where the rat reversed direction, and reward site departure times were identified as in van der Meer and Redish (2009)
.
We recorded LFPs and spiking activity from ventral striatum in rats (n = 4) running laps for food reward on a spatial decision task (Multiple-T, Figure 2
A). As described previously (Johnson and Redish, 2007
; Schmitzer-Torbert and Redish, 2004a
; van der Meer and Redish, 2009
), this task contained several decision points (turns T1–T4); at the final choice point T4, choosing one return rail, but not the other, triggered delivery of food reward. As shown before for these subjects (van der Meer and Redish, 2009
), rats learned to choose the correct return rail within the first 10 laps of a session, but continued to exhibit more gradual reductions in lap time within sessions. For comparison with later results, a pseudocolor heat map of average running speed over the linearized track as a function of lap is shown in Figure 2
B. The feeder sites F1 and F2 are clearly highlighted by low average speed (as the rats pause to eat), while similar speeds are reached on the T4-F1 and F2-S (start) segments. Rats ran an average of 75.4 ± 10.2 laps per session, of which 1.43 ± 0.51 were unrewarded errors (SEM over rats).
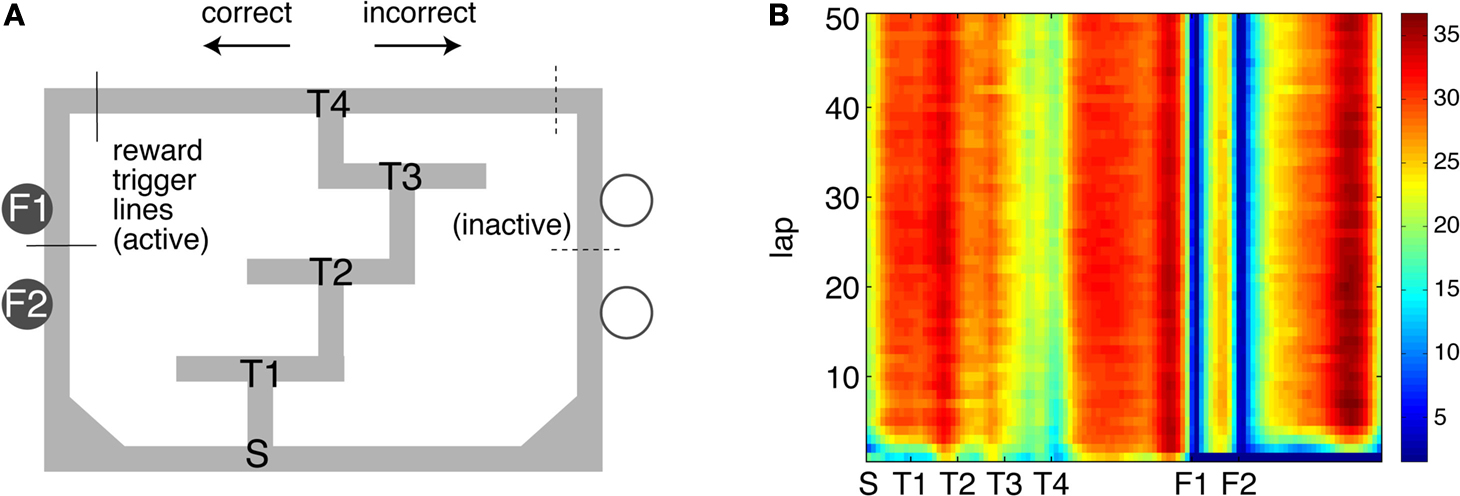
Figure 2. Behavior on the Multiple-T maze. (A) Diagram of a single Multiple-T configuration (“RRLL”), with the left side rewarded. T1-T4 indicate turns, with T4 the final choice point. Food reward is delivered at the feeder sites (F1, F2) when the rat crosses the active feeder trigger lines. (B) Pseudocolor heat map of average speed over laps on the linearized track. Note low average speed at the feeder sites, where rats pause to eat, and similar speeds on the T4-F1 and F2-S (start) segments. Units are cm/s.
In total, 921 40-min LFP traces from 80 recording sessions were included for analysis. Recording locations were localized histologically to ventral striatum (nucleus accumbens core and ventral caudate-putamen, Figure 3
). Consistent with previous reports in rats (Berke, 2005
; Berke et al., 2004
; Kalenscher et al., 2008
) and humans (Cohen et al., 2009
) oscillations in the gamma range were prominently apparent. Inspection of individual traces and spectrograms (see Figure 4
A for an example), as well as the average PSD (Figure 4
B) revealed the presence of distinct power bands in the “low gamma” range (gamma-50, a relatively narrow peak around 50 Hz) and the “high gamma” range (gamma-80, a broader increase in power between 60 and 100 Hz). There was a tendency for power in these two frequency bands to alternate, rather than co-occur, as suggested by the structure of the spectrogram in Figure 4
A. To obtain an overall quantification of this effect, we calculated the average cross-frequency self-coherence (Masimore et al., 2004
). This method computes the correlation of power over time (taken from multitaper spectrograms computed with the Chronux toolbox, Mitra and Bokil, 2008
) between pairs of frequencies within a session. The resulting plot indicated a small overall anticorrelation between the gamma-50 and gamma-80 frequency bands (Figure 4
C, white arrow; in line with similar observations obtained from anesthetized rats, Sharott et al., 2009
). Because multitaper spectral density estimation methods tradeoff narrowband and broadband bias, potentially underestimating the true correlation (Masimore et al., 2004
), we repeated this analysis using the short-time Fourier transform method (MATLAB spectrogram function, 1-s Hamming window with 0.5 s overlap). Similar results were obtained by this method; the multitaper-derived plot is shown here for consistency. Because recordings were referenced against an electrode positioned in or near the overlying corpus callosum, it is theoretically possible that these LFP patterns resulted from this electrode. However, when we repeated the above analysis for the data from the reference electrode itself, we observed none of the above structure, implying that these patterns do not originate in the corpus callosum.
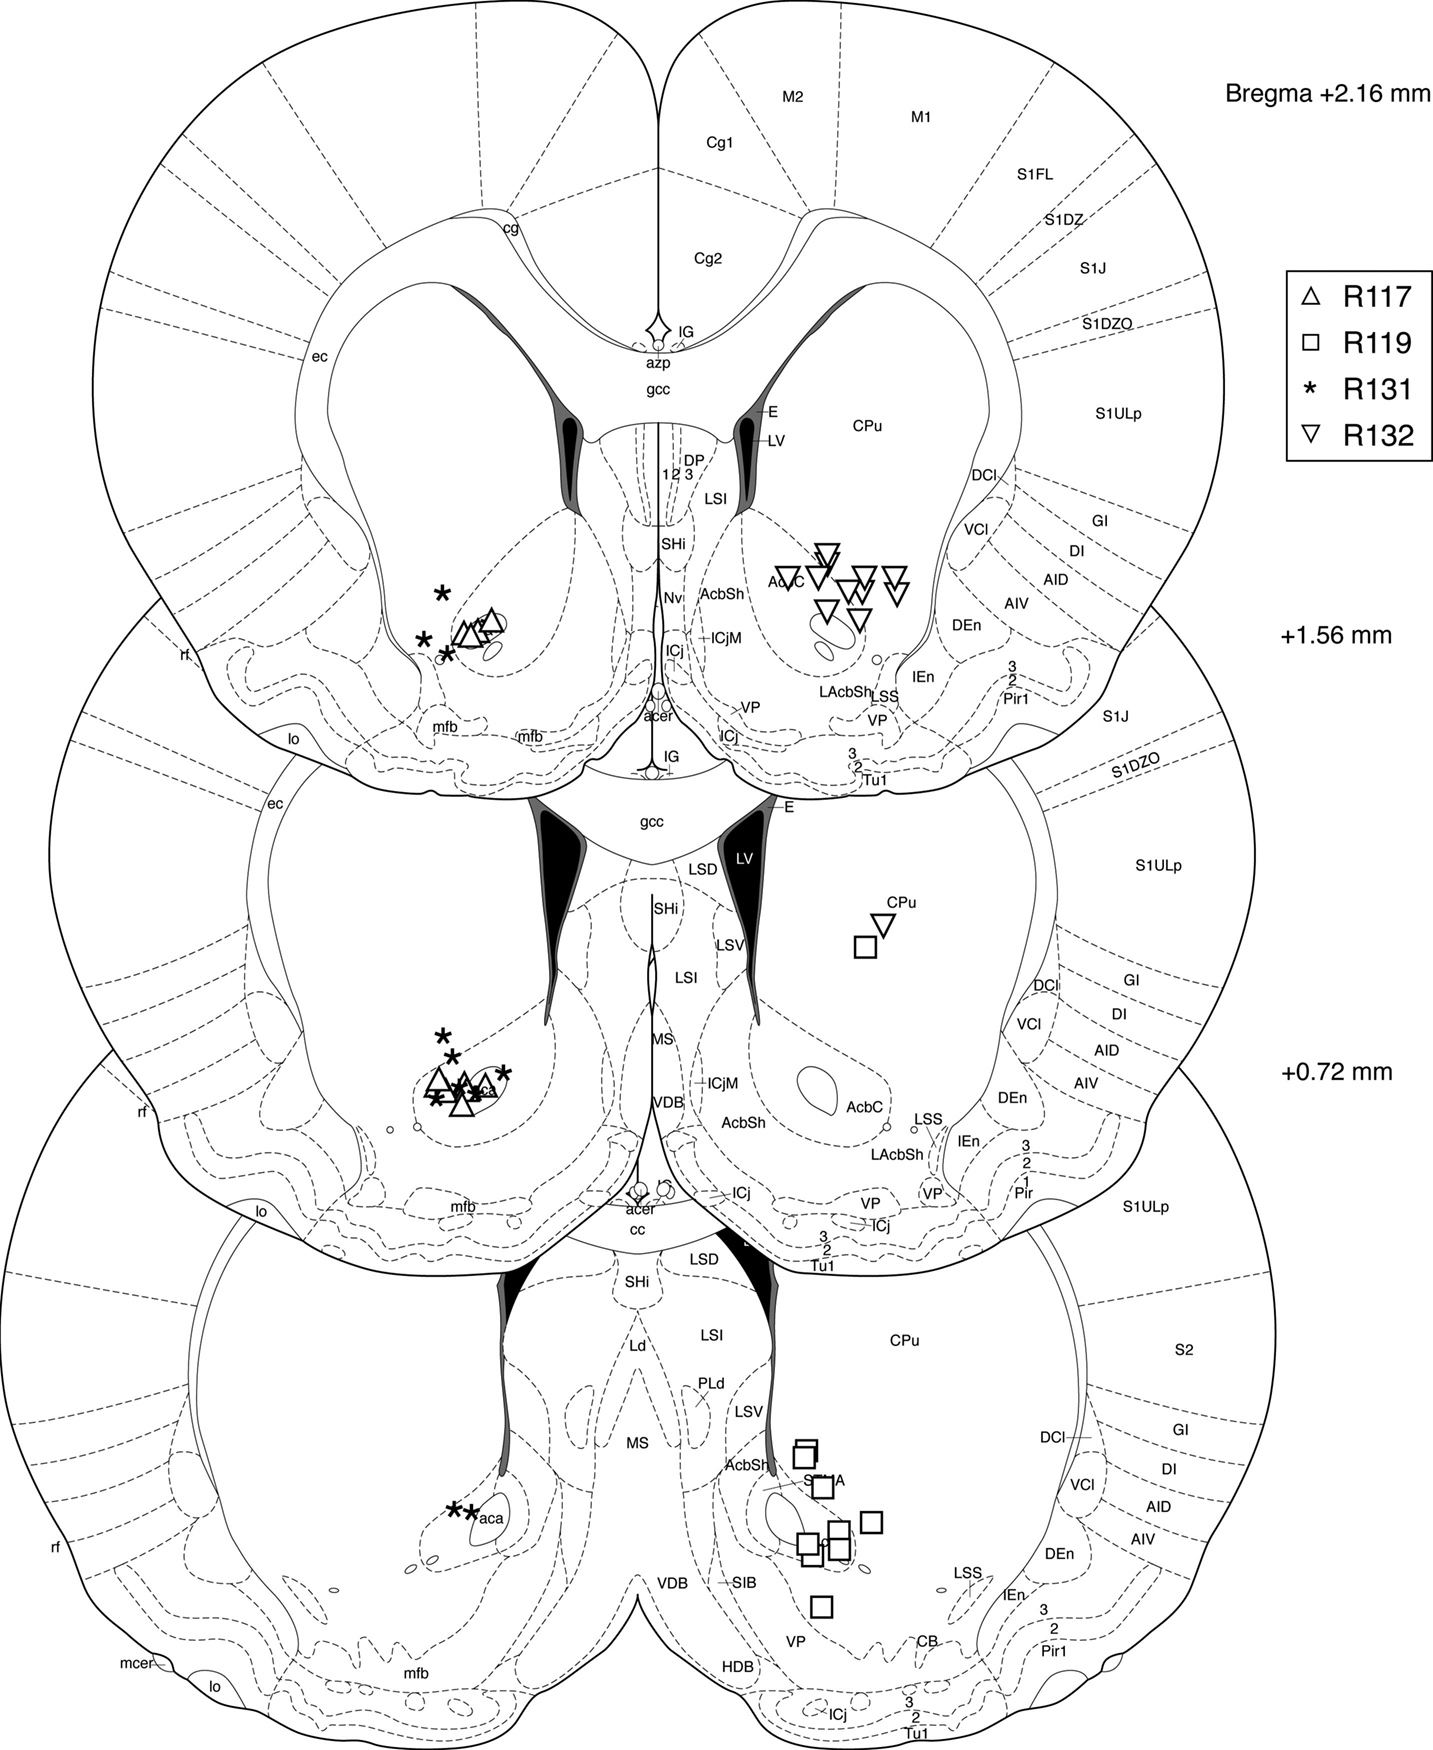
Figure 3. Histology. Over 90% of recording sites were localized to ventral striatum, with the majority in the core of the nucleus accumbens and in ventral caudate-putamen. Symbols indicate final electrode positions; however, over all days that data were taken, electrodes were only lowered by small amounts (mean maximum deviation across all tetrodes, 125 μm, median, 90 μm) such that the locations indicated are representative. While we could not exclude the possibility that two recording sites from the more dorsal striatum were included in analyses (we were unable to conclusively assign these electrode tracks to particular electrodes, although their location in comparison with turning records suggests these were likely either unused references or broken electrodes) these constitute a small fraction of the total data set. As our results were consistent across subjects, it is unlikely this possibility affected our results or conclusions.
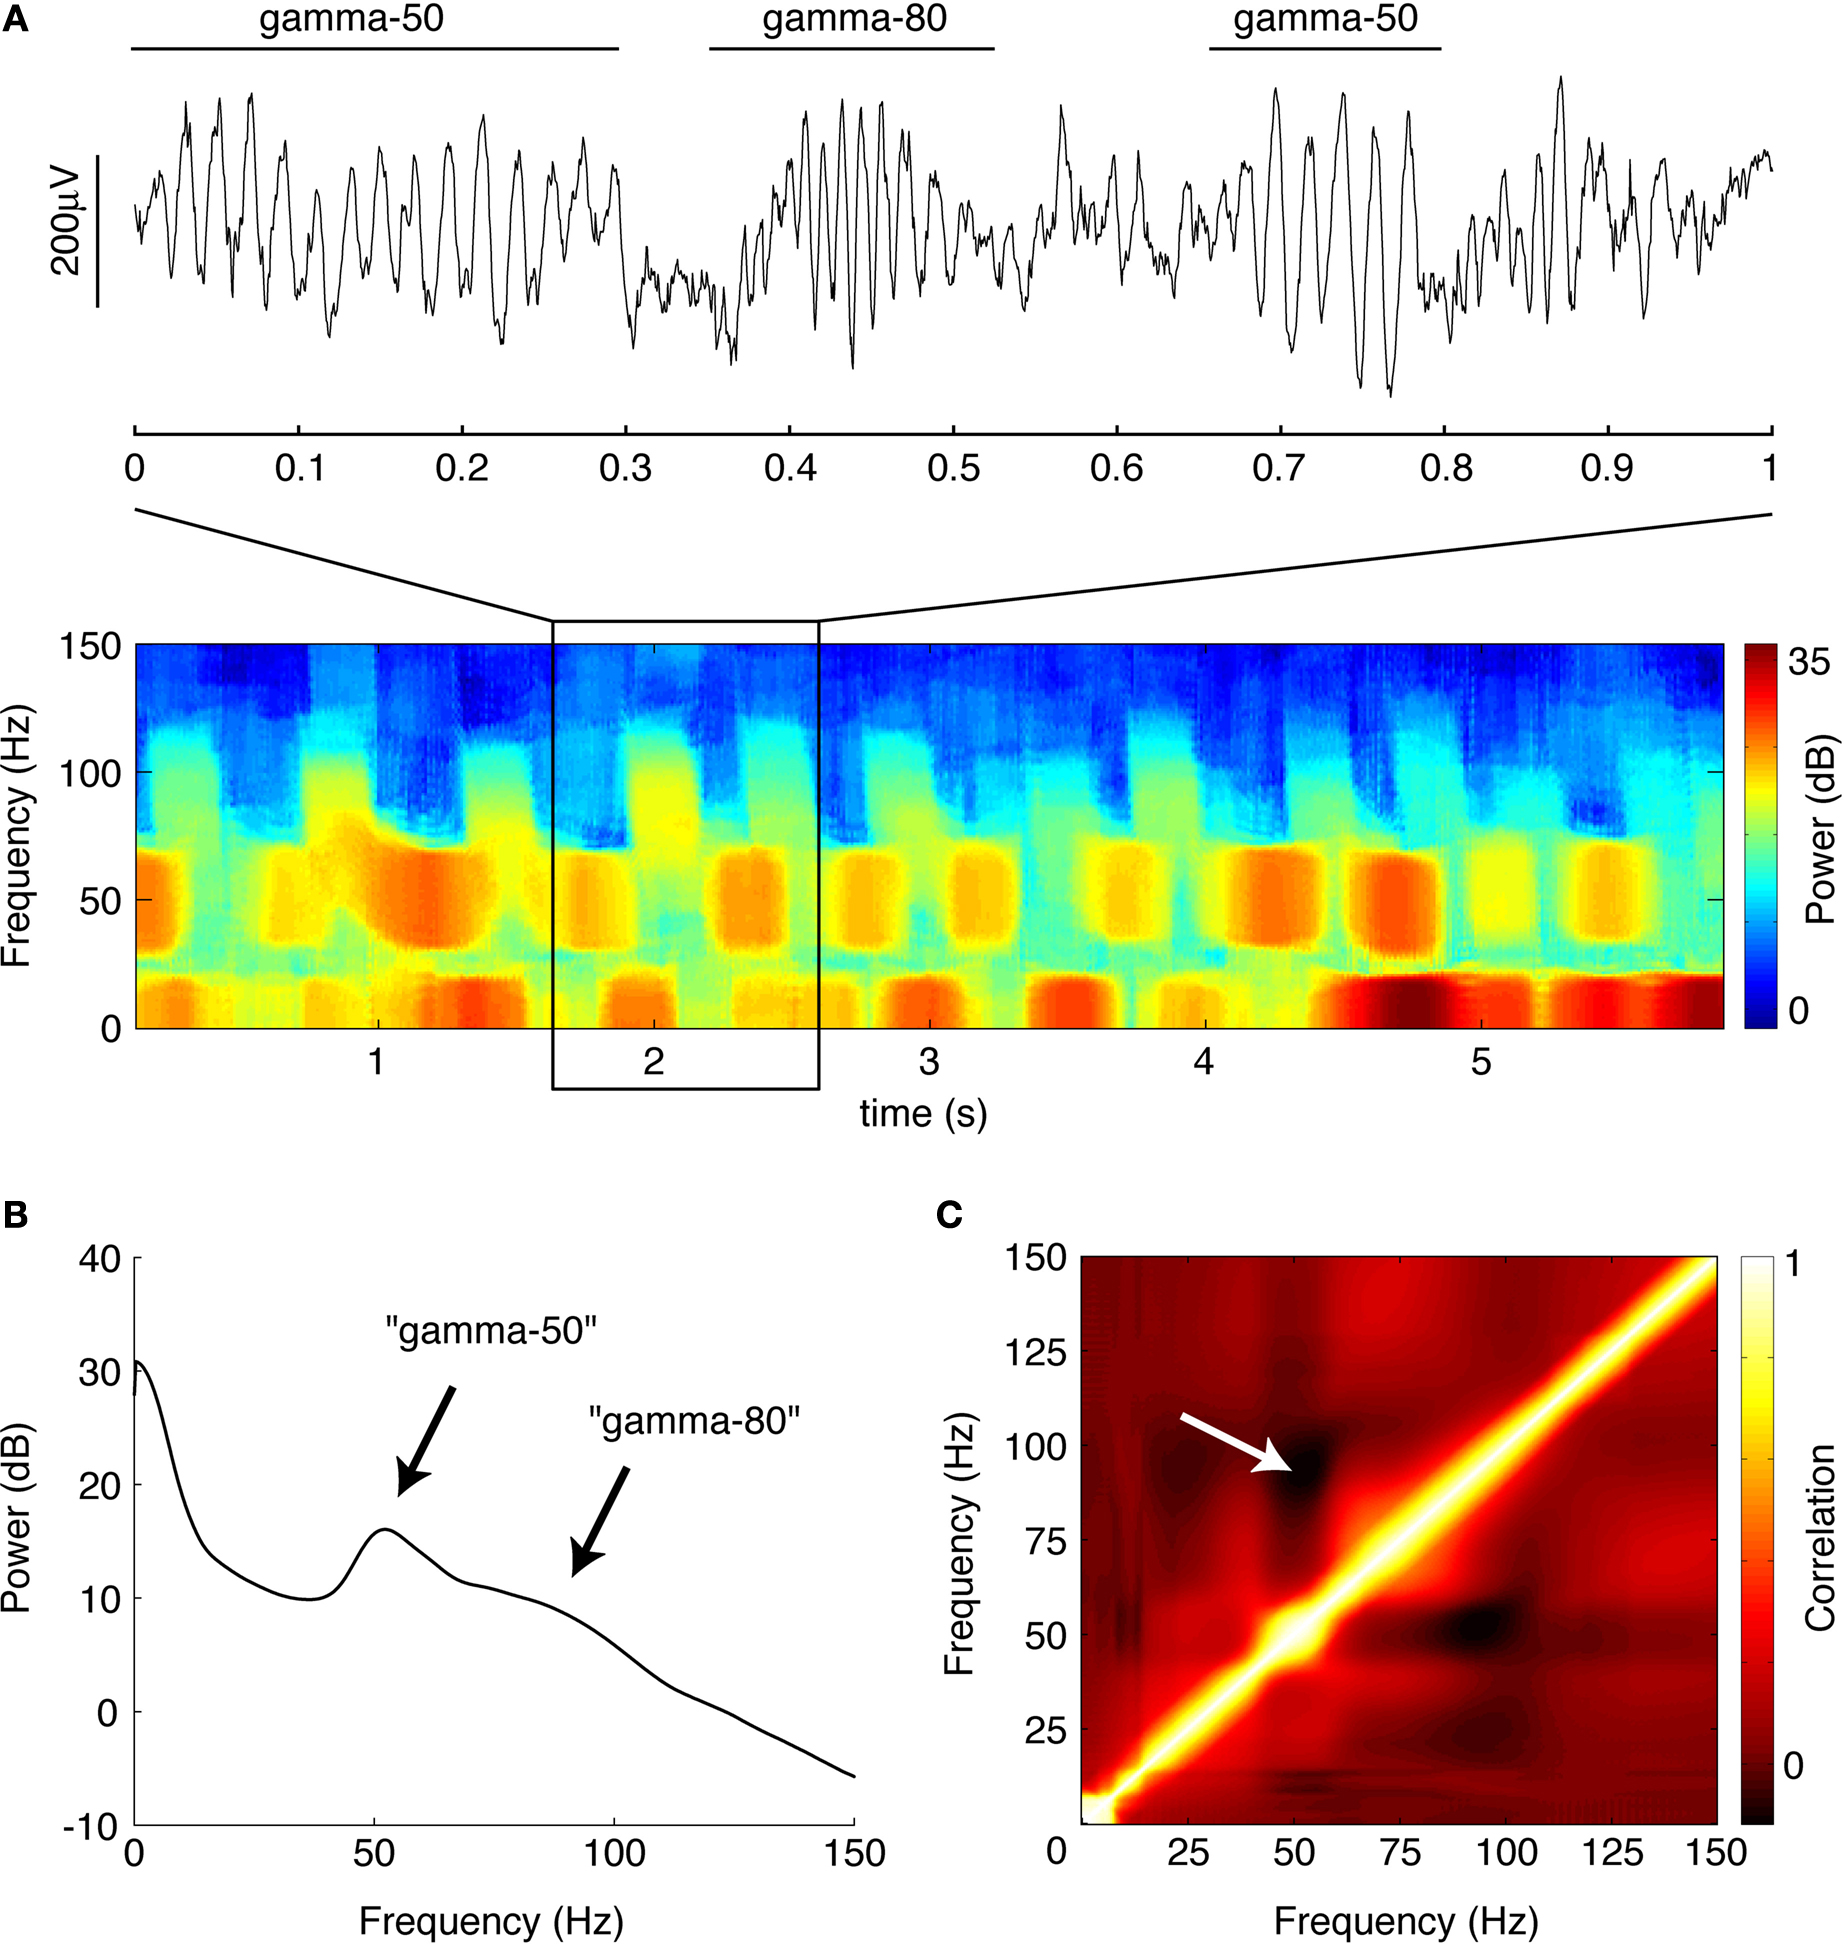
Figure 4. Ventral striatal local field potentials contain low and high gamma frequencies. (A) Example unfiltered local field potential trace containing alternating gamma-50 and gamma-80 power (top) and associated spectrogram (bottom) with characteristic structure. For display only, the spectrogram was obtained using a 250-ms time window at 10-ms time step resolution. Units on the spectrogram are in dB, a log-transform of power (10 × log10 (μV2)/Hz). Taken from session R117-2007-06-01, tetrode 7. (B) Average power spectral density (PSD) over all sessions. Note the peak at 50 Hz and a wider “hump” defined by inflection points at 60 and 100 Hz. Error bars (SEM over sessions) were too small to be visible. (C) Average cross-frequency autocorrelation (over all sessions) for different frequencies within each spectrogram. Note the distinct, slightly anticorrelated (white arrow) zones at 45–55 Hz (gamma-50) and 70–85 Hz (gamma-80) frequencies. See main text for details.
Different Task-Related Properties of Gamma-50 and Gamma-80
In rats, gamma-50 oscillations in striatum have been previously linked to movement initiation (Masimore et al., 2005
) and reward processing (Kalenscher et al., 2008
), while gamma-80 oscillations have been linked to reward delivery (Berke and Kunec, 2004
). We thus compared the distributions of gamma-50 and gamma-80 power over spatial location on the track, as well as over laps. An example distribution from a single recording session is shown in Figures 5
A,B; gamma-50 was increased at the reward sites, extending beyond departure before returning to baseline. Over laps, there was a tendency for power to increase overall (Figure 5
A). In contrast, gamma-80 power appeared to “ramp up” to the reward sites (Figure 5
B). To examine this impression over all sessions, positions were first converted to a standard, linearized metric, so that different maze configurations could be compared (Schmitzer-Torbert and Redish, 2004a
). Average power (for correct, rewarded laps only) was then plotted as a function of both position on the linearized track, and lap number (Figures 5
C,D). Averages over laps and position are shown to the top and to the right respectively. The spatial averages confirm that gamma-50 power rises sharply upon reaching the reward sites (F1 and F2, grey vertical lines), and persists after departure from F2 before returning to baseline. In contrast, the spatial distribution of gamma-80 power exhibited a very different pattern: it ramped up slowly to the reward sites, returning to baseline comparatively rapidly. Note how gamma-50 power peaks after the reward site locations, while gamma-80 power peaks before. A potential concern in this analysis is the width of the time window used in computing the spectrograms (0.5 s) which could smooth localized transients. To address this, we repeated the above analysis with 250 ms and 1 s windows, which yielded essentially the same pattern, including ramping up of gamma-80 and persistence of gamma-50 following reward site departure, indicating that these phenomena were unlikely to result from artifactual smoothing.
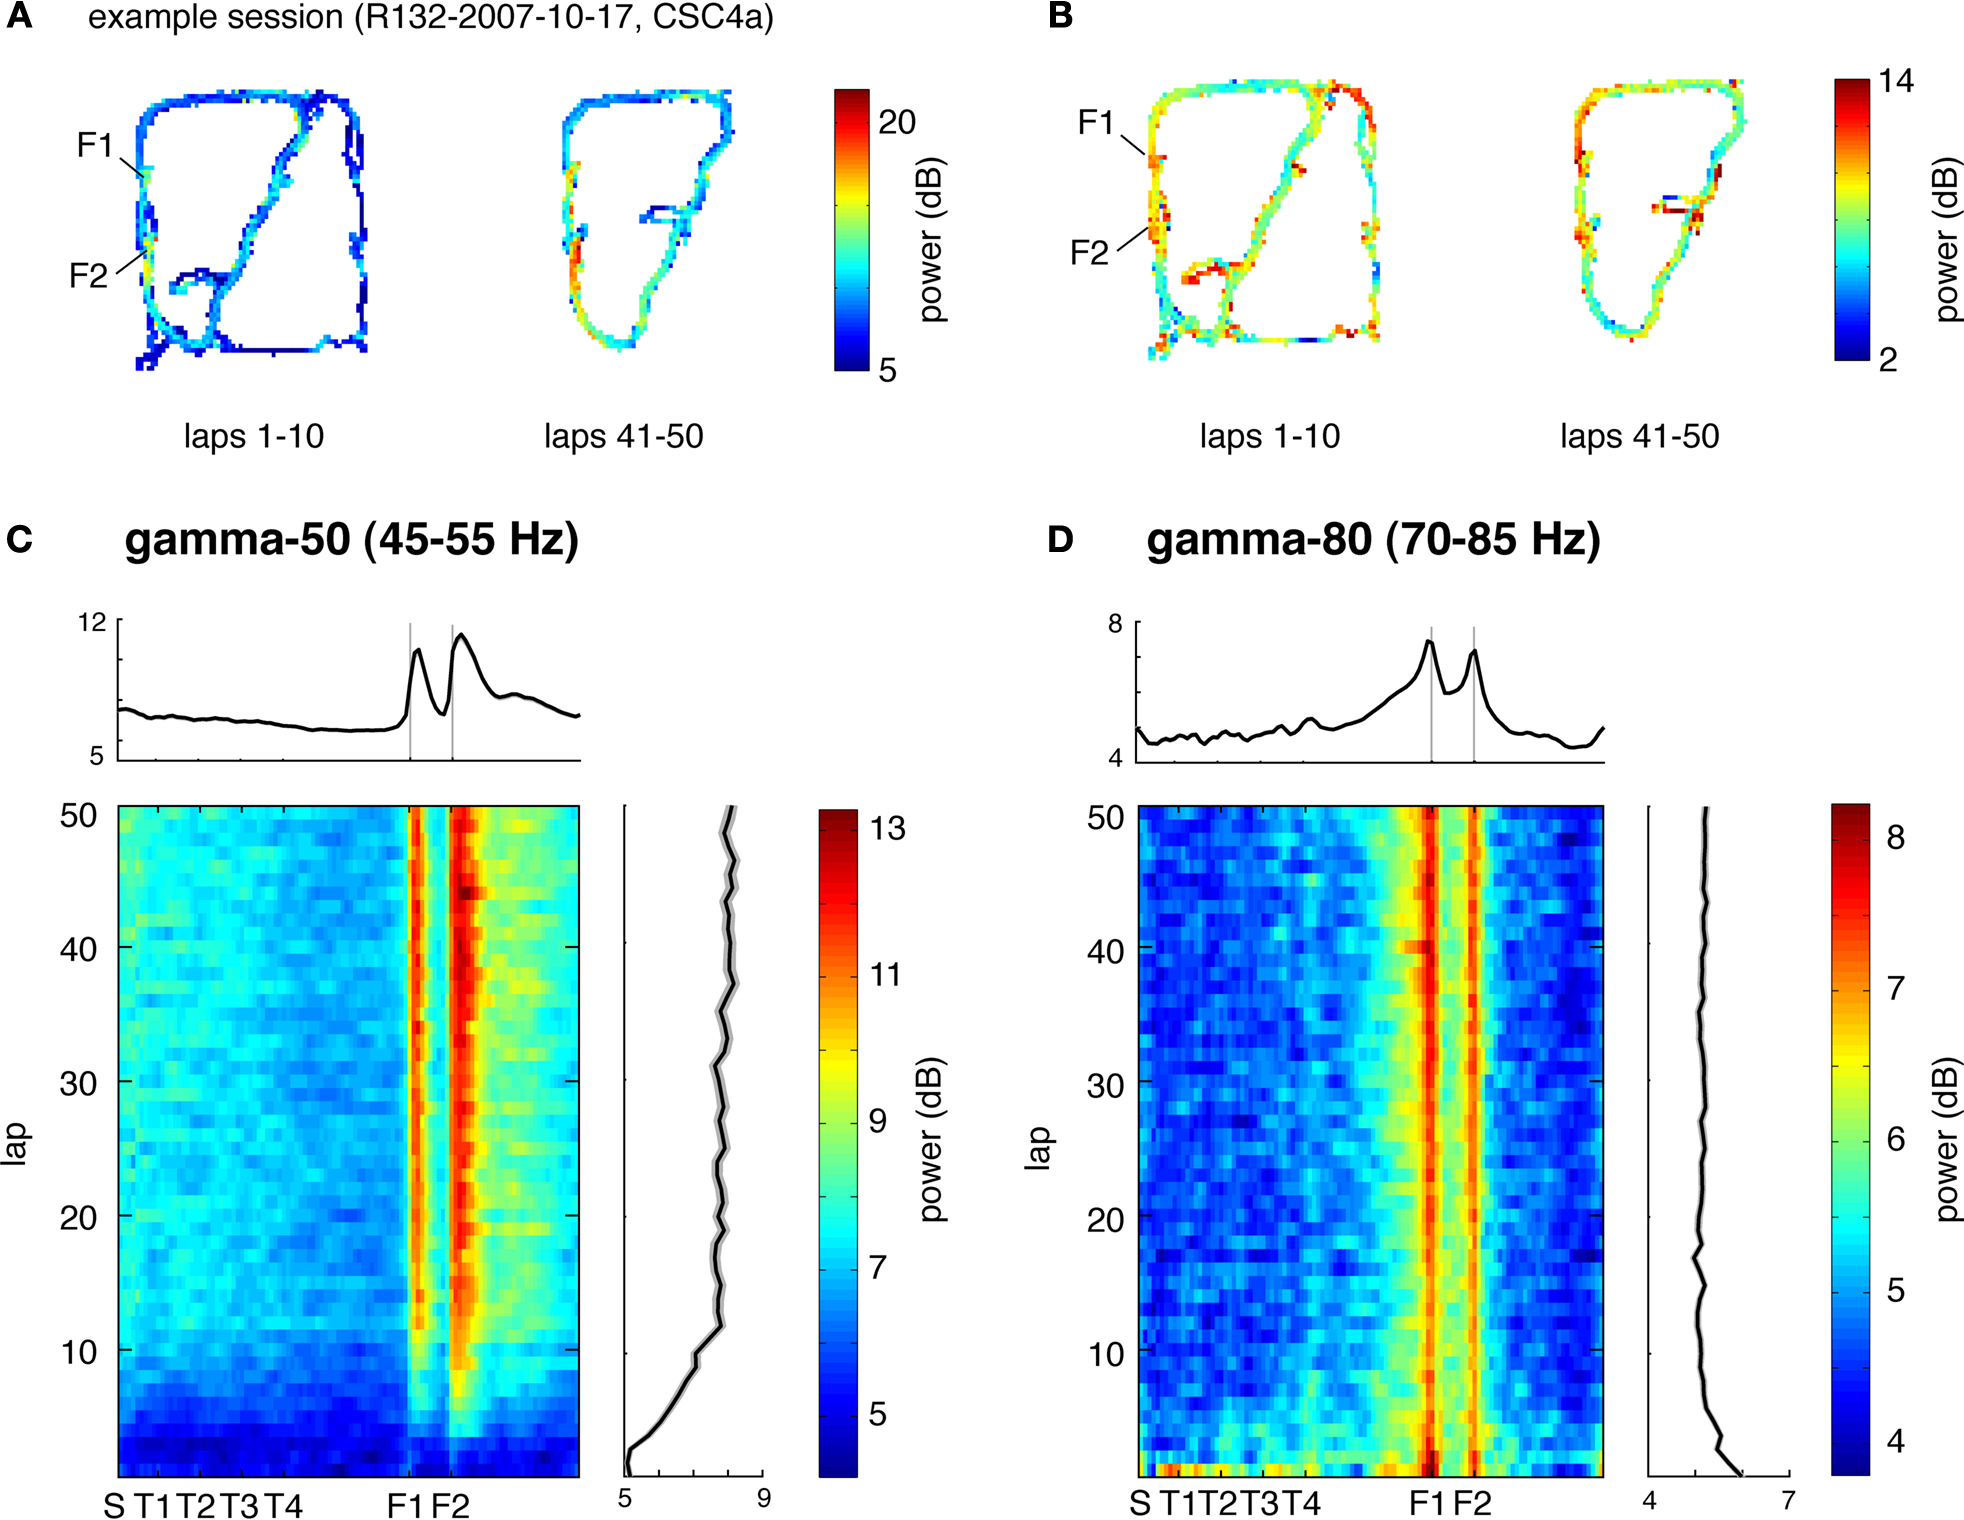
Figure 5. Low (45–55 Hz, “gamma-50”) and high (70–85 Hz, “gamma-80”) gamma power are differentially modulated across the track and over time. (A) Representative spatial distribution of gamma-50 power over the track for early laps (1–10, left) and late laps (41–50, right) from a single session. (B) Spatial distribution of gamma-80 power over the track for early laps (1–10, left) and late laps (41–50, right) from the same session (R132-2007-10-17, tetrode 4). (C) Distribution of gamma-50 power over position on the track (horizontal axis) and lap (vertical axis) averaged over correct (rewarded) laps from all sessions. Averages over laps and over space are shown to the top and to the right respectively. Note the abrupt increase in power at the feeder sites, the more gradual return back to baseline, and the development of this pattern over the first few laps. (D) Distribution of gamma-80 power over position on the track (horizontal axis) and lap (vertical axis) with panel layout as in (C). Note the contrast with (C) in both space and time: high gamma power increases gradually up to the reward sites, and is highest during early laps.
Another difference was apparent in the temporal evolution of the spatial distributions for gamma-50 and gamma-80 power. Gamma-50 power was lowest, and without spatial structure, at the start of the session, developing discernible modulation within about 5 laps, and then relatively stable within 10 laps. In contrast, gamma-80 power was highest during early laps, dropping to a relatively stable level within 10 laps. Thus, gamma-50 and gamma-80 oscillations not only showed a differential expression over the spatial extent of the track, but also evolved differently during the initial phase of learning.
Because Figures 5
C,D were obtained by averaging power time series with potentially very different absolute values, a single high power session or subject could dominate the average. To address this, we examined the spatial distribution of low and high gamma power for each rat individually. Shown in Figure 6
are the spatial distributions over the linearized track, with values for each session z-scored against their distribution over space. Different rats showed a similar modulation consistent with the average in Figures 5
C,D, with gamma-50 increasing after the reward sites, and gamma-80 ramping up before them. Thus, although absolute power levels could differ between animals, differential modulation of gamma-50 and gamma-80 was consistently observed across subjects.
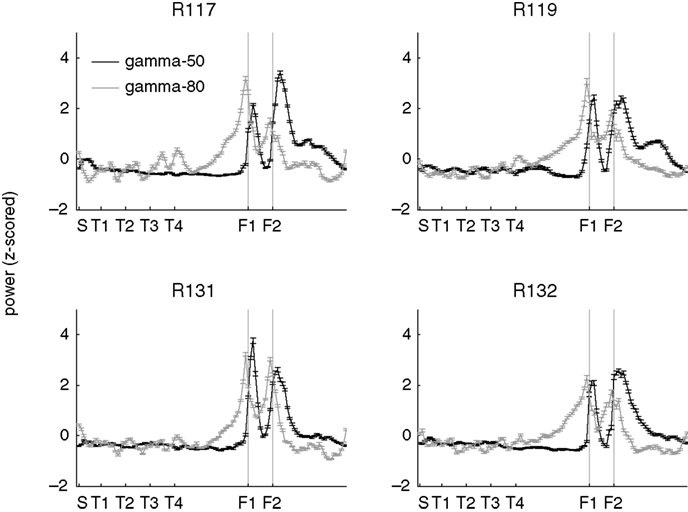
Figure 6. Distinct spatial modulation of gamma-50 and gamma-80 power is consistent across subjects. Power values were z-scored across space for each session individually and plotted in black (gamma-50) and grey (gamma-80). Error bars represent SEM over sessions.
The spatial distribution of gamma-50 and gamma-80 on the track suggests a relationship to the reward sites. To further investigate the effect of rewards, we examined gamma power on error laps, where animals received no reward. Because errors were more frequent early in sessions (Figure 7
C), when gamma-50 and gamma-80 power are not yet stable (Figures 5
C,D) we compared error laps to a set of matched correct (rewarded) laps, by randomly choosing the preceding or following correct lap for each error lap (errors on lap 1, for which no preceding lap is available, were excluded to reduce bias). The spatial distributions for the error laps and matched correct laps are shown in Figures 7
A,B. Gamma-50 power was increased at the reward sites on rewarded laps compared to error laps, while in contrast, gamma-80 power approaching and at the rewarded sites was similar on this spatial scale (but see Figure 9
for a finer-time scale analysis). We noted an increase in gamma-80 power on error laps on the segment following the second reward site; the significance of this is unclear (see Discussion).
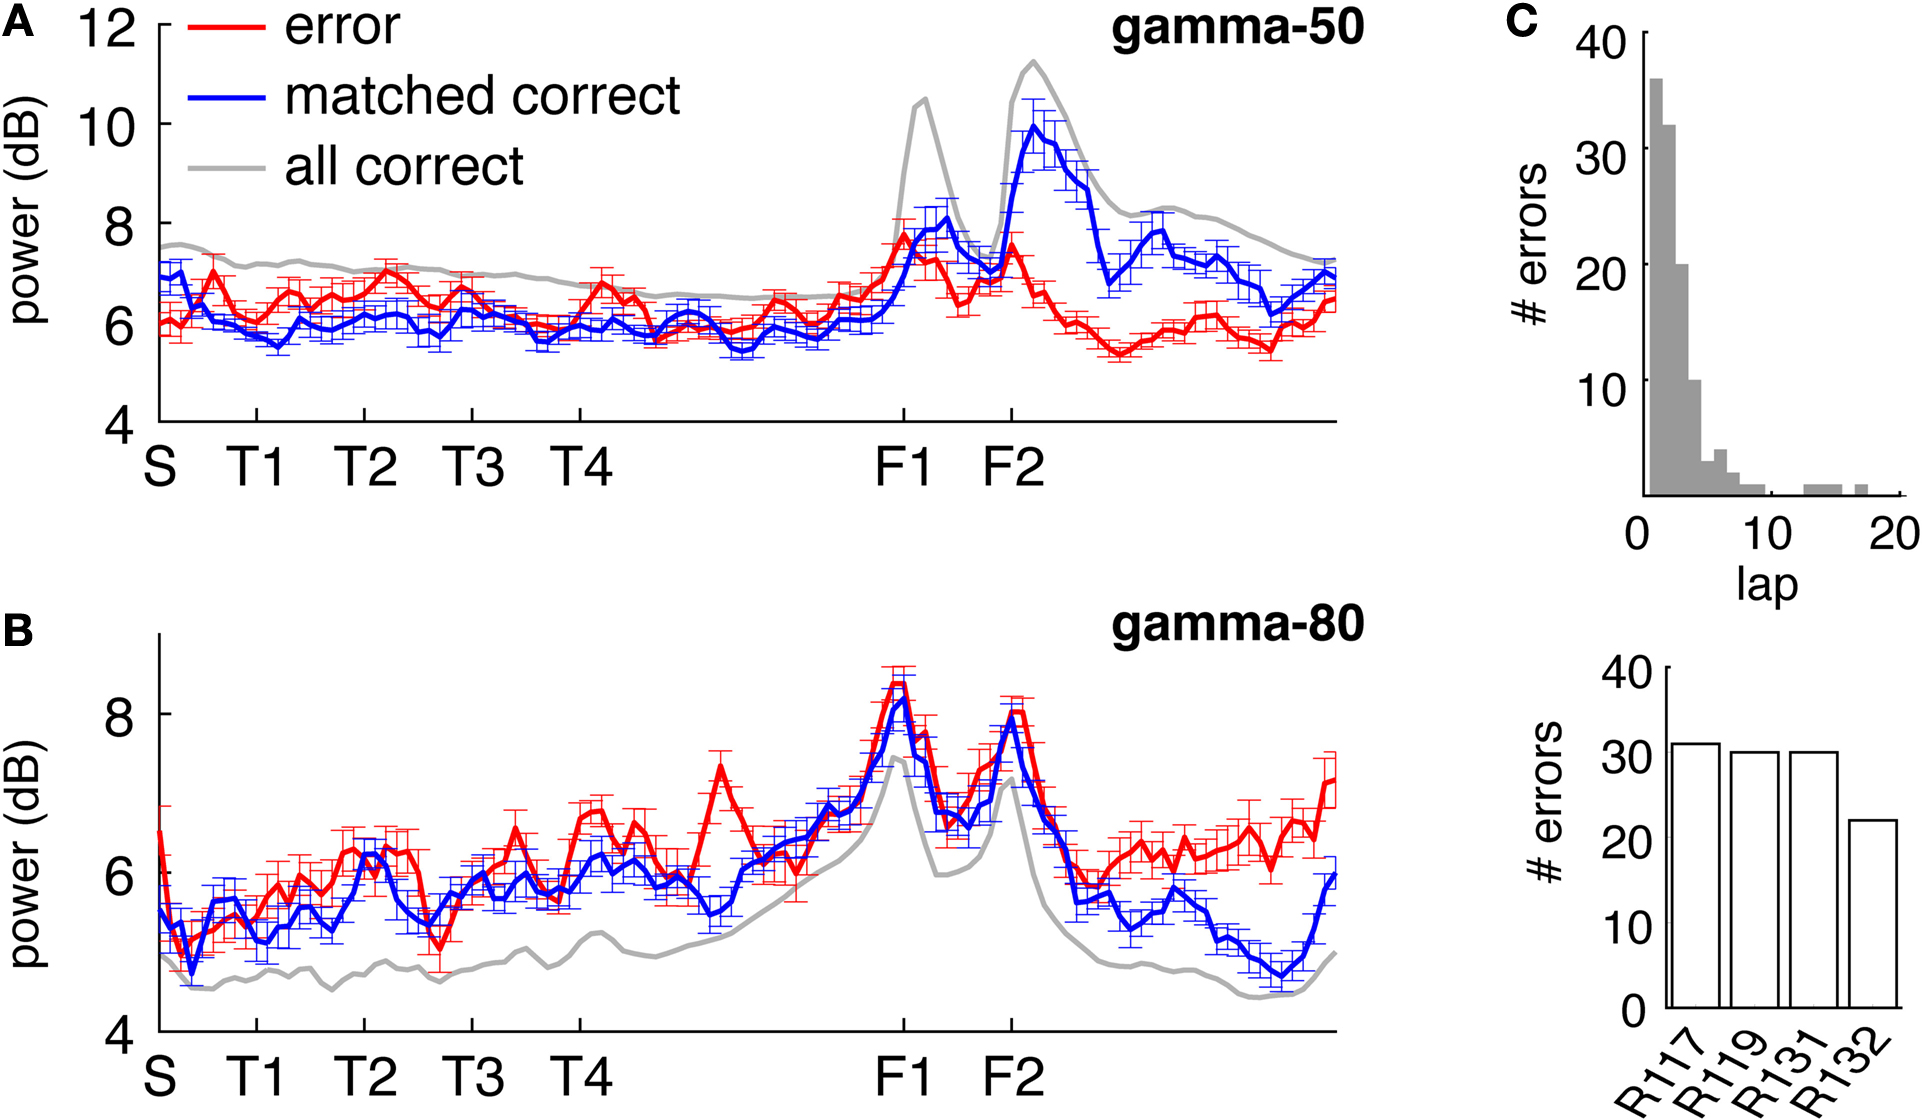
Figure 7. The spatial distribution of gamma-50 power, but not gamma-80 power, is affected by the presence or absence of reward receipt at the reward sites. (A) Spatial distribution of gamma-50 power on error laps (red line, no reward received), matched correct laps (blue line, reward received) and all correct laps (grey line). Note the higher power at F2 on correct laps. (B) Spatial distribution of gamma-80 power; panel layout as in (A). While gamma-80 power was increased elsewhere on the track, power at the reward sites was similar between rewarded and non-rewarded laps (but see Figure 9
for a closer look). (C) Distribution of error laps (top); most errors occurred before lap 10, when gamma-50 and gamma-80 power levels had not yet stabilized (Figures 5
C,D). To avoid biasing the comparison between error and correct laps, we compared error laps to a set of matched correct laps (the preceding or following correct lap for each error lap, chosen randomly). Different rats contributed a similar number of error laps (bottom).
van der Meer and Redish (2009)
found that reward-responsive cells in ventral striatum tended to be activated at the final choice point (T4) during early learning. To assess whether gamma power showed a similar change at the final choice point, we plotted the z-scored power (across spatial bins) for early (first 10 min of recording sessions, black line) and late (last 10 min, grey line) segments separately (Figure 8
). For gamma-50, there was no significant difference between early and late power at T4 (T4 point ±2 spatial bins, two-sample Student’s t-test: t(810) = −1.09, p = 0.23). For gamma-80, there was an overall tendency for gamma-80 to be elevated during early learning (two-way ANOVA with early/late and location (regular intervals centered around S, T1, T2, T3, T4, and after T4) as factors; main effect of early/late: F(1) = 78.0, p < 10−10), but this increase was not distributed uniformly across the maze (two-way ANOVA, early/late and location interaction: F(5) = 18.38, p = 10−10), with the largest difference occurring at T4 (two-sample Student’s t-test, early vs. late: t(810) = 10.4, p = 10−10). Thus, while overall gamma-80 power was increased during early learning (see also Figure 5
), the spatial distribution of gamma-80 power also changed with experience, with the largest increase between early and late learning occurring at the final choice point.
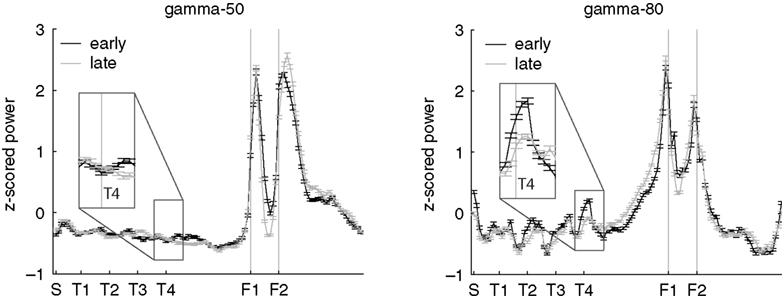
Figure 8. Gamma-80, but not gamma-50, power was elevated at the final choice point (T4) during early laps. Shown are average z-scored power values for the first quarter of recording sessions (first 10 min, black) and the last quarter (final 10 min, grey) for gamma-50 (left) and gamma-80 (right). Insets show a close up at T4. As shown in Figure 5
, overall power levels for both gamma-50 and gamma-80 changed between early and late laps; this analysis reveals the spatial distribution of that power normalized for absolute levels.
A different view of the differential modulation of gamma-50 and gamma-80 oscillations can be obtained from their temporal relationship to reward-related events. Figure 9
A shows the average gamma-50 (left column) and gamma-80 (right) power around the time of the rat’s arrival at the feeder sites (time 0). Because pellet release was triggered when rats crossed the reward trigger lines some distance in front of the reward sites (see Figure 2
A), and pellets took up to 2 s to arrive at the track, the rats tended to arrive before the pellets, catching the pellets in their mouth. Comparing gamma-50 and gamma-80 power over all correct laps (Figure 9
A, grey line), gamma-50 power showed a clear peak following reward receipt, while gamma-80 was strongly decreased. At both frequencies, this initial transient was followed by a more sustained increase (or alternatively, a fast transient was superimposed on a slow, sustained increase). For both gamma-50 and gamma-80, these transient responses were absent during non-rewarded error laps (red line) but not from matched rewarded laps (blue line), indicating that the presence or absence of reward modulates gamma power. However, we noted that the animals’ average speed (to which both head movements and running contribute) showed some differences between rewarded and non-rewarded trials (Figure 9
B), so it is possible that there is a contribution of movement differences to these effects.
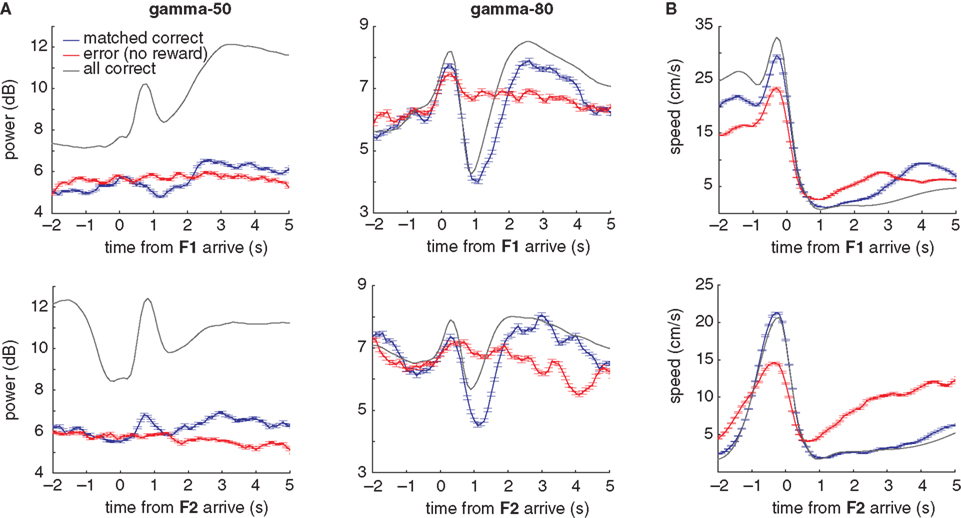
Figure 9. Gamma-50 and gamma-80 power are differentially modulated around the time of reward receipt. (A) Peri-event power averages, aligned to arrival times at the first reward site (F1, top) or the second reward site (F2, bottom) for gamma-50 (left column) and gamma-80 (right). As before, error laps (no reward received, red line) were matched with a set of correct laps that occurred at comparable times within sessions (blue line). The average for all correct laps is shown in grey. Food pellet reward usually arrived within 0.5 s of the rat’s arrival at reward sites. Over all correct laps, a clear response to reward delivery was apparent in gamma-50 power (peaking at about 0.75 s). During error laps, this response was absent, while a small response to reward delivery at the second reward site could be distinguished, indicating that this effect was not due to a non-specific suppression of gamma-50 power or modulation. Gamma-50 power exhibited a sustained increase following reward receipt. Gamma-80 power also distinguished between rewarded and non-rewarded laps, with a strong reduction in power following reward receipt absent during non-rewarded trials. (B) Average running speed; panel layout as in (A).
To investigate whether changes in gamma power were related to behavior other than reward receipt (or the absence thereof), we identified “turnaround” or “reversal” points in the rats’ path (van der Meer and Redish, 2009
), where animals deviated from the correct path before returning. Consistent with previous reports of 50 Hz oscillations preceding movement initiation (Masimore et al., 2005
), gamma-50 power was transiently increased before the turnaround time (Figure 10
A). Gamma-80 power did not show a clearly turnaround-aligned profile, although it was markedly higher before compared to after the turnaround (Figures 10
B,C). Turnaround points were taken from the sequence of turns on the central part of the maze only, such that in contrast to movement initiation at the reward sites (Figure 9
) they were not preceded by recent reward receipt.
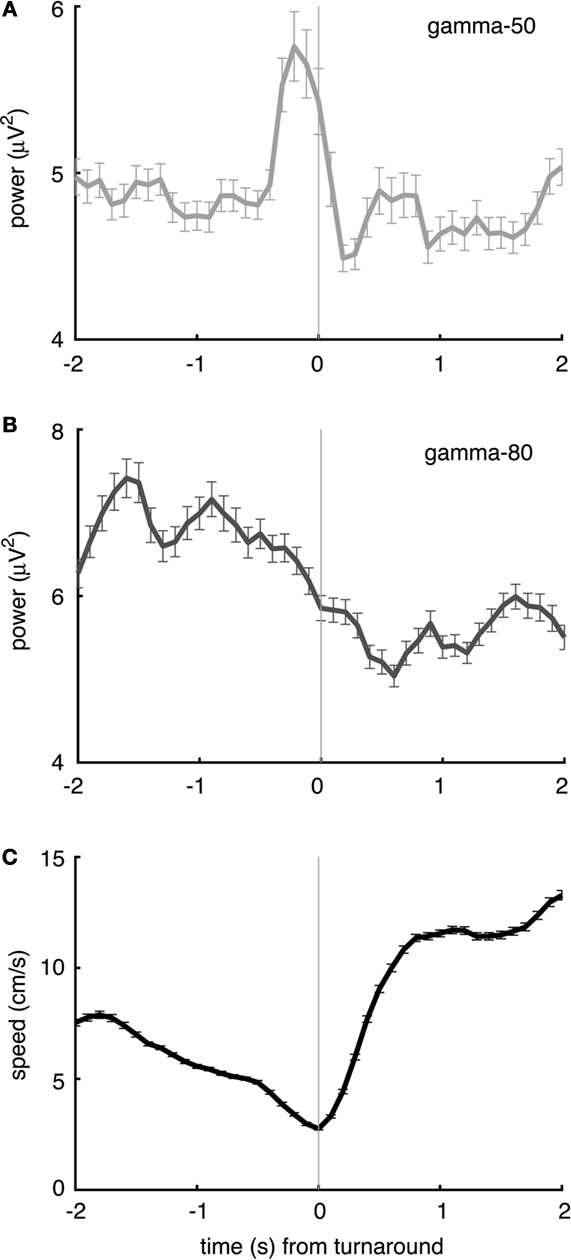
Figure 10. Gamma-50 and gamma-80 power are differentially modulated before turnaround points on the central segment of the maze, in the absence of reward. (A) Gamma-50 power was briefly elevated shortly before turnaround (thin vertical line at time 0), while gamma-80 power (grey line) did not show sharp peaks but was higher overall before turnaround compared to after (B). The animals’ average speed indicated an onset of movement at the time of turnaround (C).
Relationships of Local Field Potential Oscillations to Spiking Activity
In theory, the observed LFP oscillation patterns could arise from volume conductance from a different source than ventral striatum itself, such as nearby piriform cortex, where gamma oscillations are prominent (Berke, 2005
; Kay and Freeman, 1998
). To address whether ventral striatal LFPs were locally relevant, we compared the spike times of putative FSIs to LFP activity. Relationships between spike times and particular phases of the ongoing LFP, or spike-field coherency (Fries et al., 2001
; Mitra and Bokil, 2008
), can be examined by the spike-triggered average (STA) which shows the average LFP in some time window around the time of a spike. Two example STAs for ventral striatal FSIs against the LFP recorded from the same tetrode are shown in Figures 11
A,B. The STA of the neuron in Figure 11
A showed strong ∼60 Hz modulation, while the STA of the neuron in Figure 11
B showed no such modulation but tended to fire at the trough of a ∼12 Hz rhythm instead. In general, different neurons exhibited STA modulations at a range of frequencies, with a substantial number showing no apparent phase modulation. The average STA over all cells (Figure 11
C) shows that on average, FSIs showed gamma modulation and are followed by a slow, asymmetric upward deflection that might reflect broad synaptic inhibition of FSIs onto nearby medium spiny neurons (Koós and Tepper, 1999
; Mallet et al., 2005
).
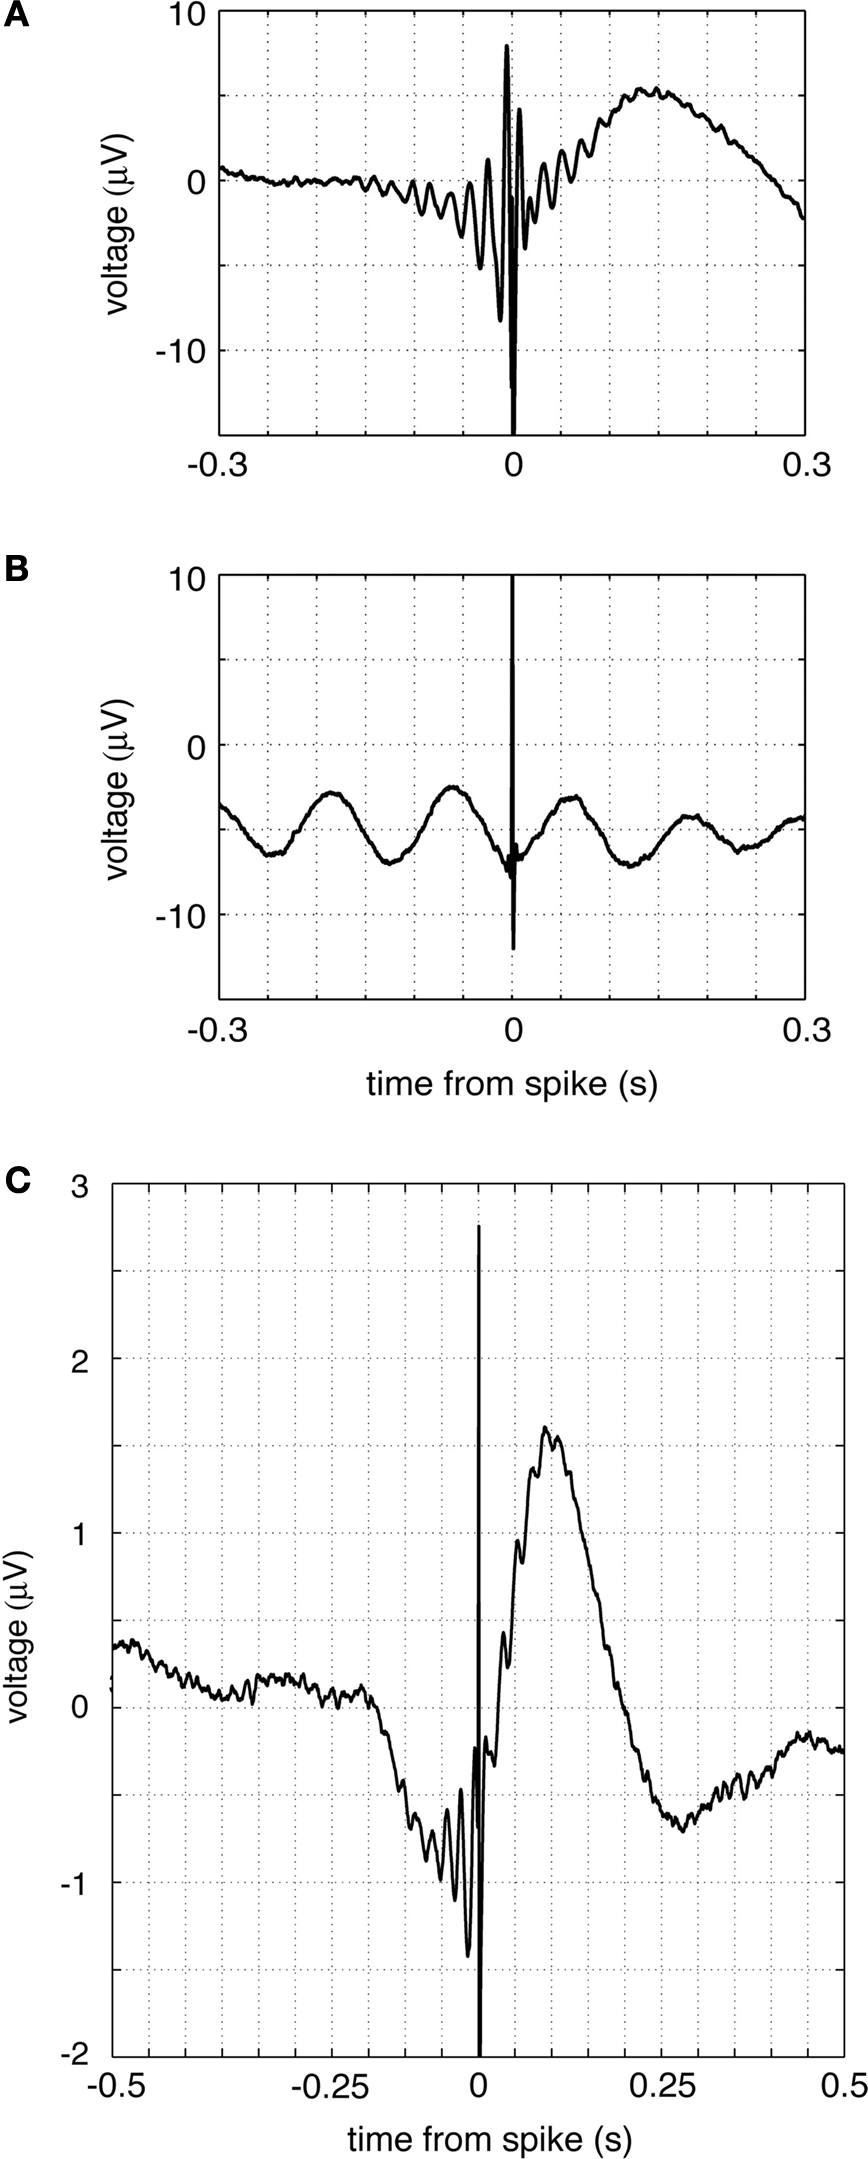
Figure 11. Putative fast-spiking interneuron (FSI) spike-triggered averages (STAs) indicate interactions with local field potentials. (A,B) Example STA of two FSIs. The STA of the top neuron shows clear gamma modulation; note also the asymmetric slow component following a spike. The bottom neuron shows 12 Hz, but not gamma, modulation. In general, different FSIs exhibited a range of different STA patterns, and a significant proportion were not modulated. (C) Average STA across all FSIs; note gamma oscillation and asymmetric slow deflection. The sharp spike at time 0 likely resulted from the spike waveform interfering with the LFP, a consequence of recording both from the same tetrode.
The presence of a clearly modulated STA suggests that systematic phase relationships with spike times exist. Two example LFP traces with simultaneously recorded putative FSI spikes are shown in Figure 12
A, and suggest a relationship between the phase of gamma oscillations and spike times. To quantify this effect, histograms over the phase of each spike relative to gamma-50 and gamma-80 were computed for each cell, and the preferred firing phase extracted by circular mean. (Example shown in Figure 12
B; while this method of assessing phase preference, based on the length of the mean vector, does not deal with multimodal phase distributions, where e.g., two opposing modes of equal magnitude could cancel each other out; however, inspection of individual phase preference curves revealed no such patterns.) For both gamma-50 and gamma-80, the majority of FSIs showed a small but significant phase preference (Rayleigh’s r, p < 0.001, corrected for multiple comparisons; 32/53 for gamma-50, 36/53 for gamma-80). Over all FSIs, the distributions of mean phase angles were significantly non-uniform (Rayleigh’s r, p = 0.0093 and 0.0039 for gamma-50 and gamma-80 respectively, Figure 12
C), indicating that individually as well as at the population level, FSIs have a preferred gamma firing phase, consistent with recent results in anesthetized rats (Sharott et al., 2009
).
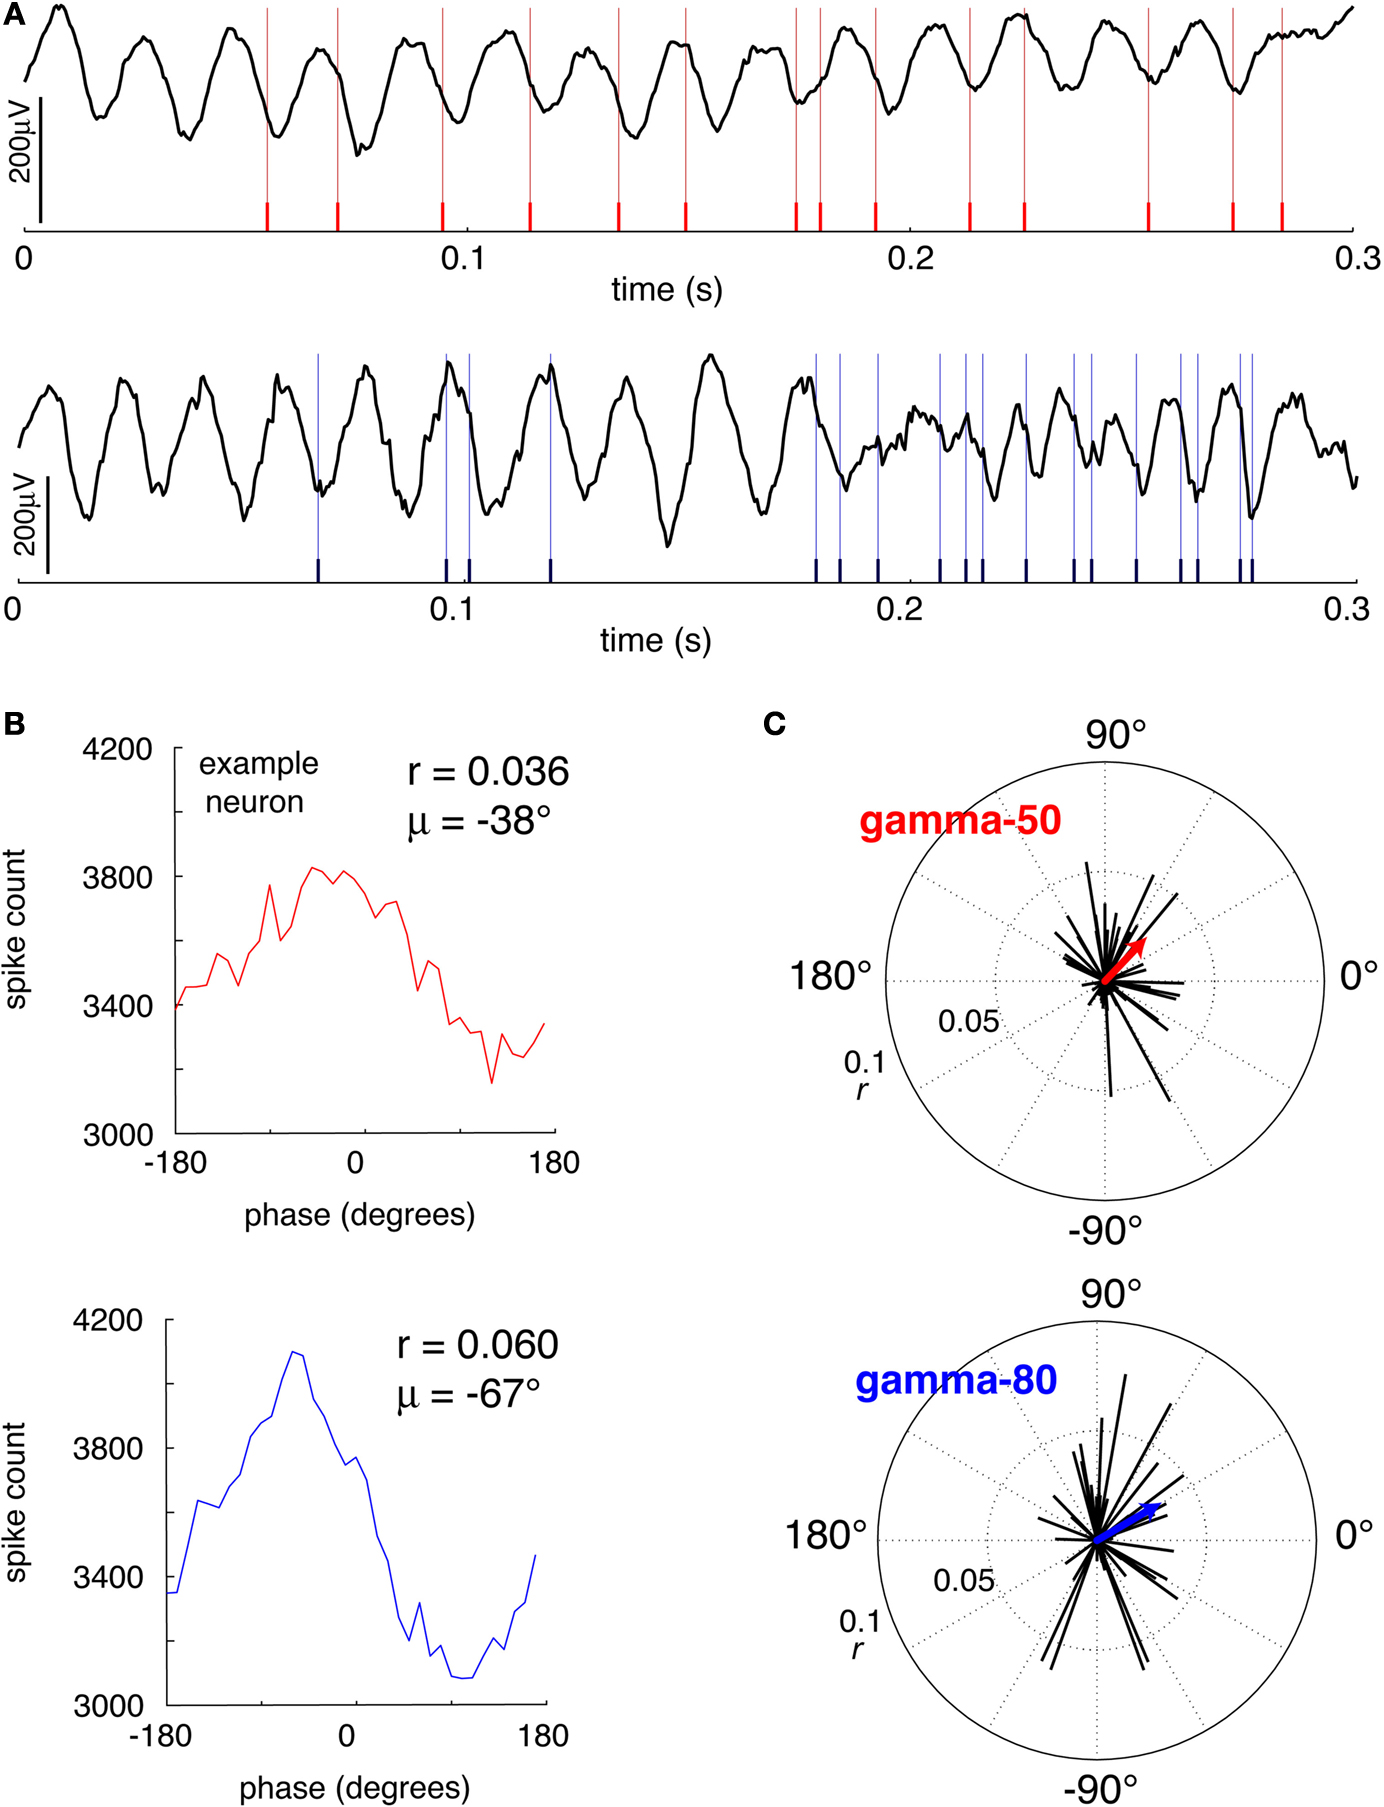
Figure 12. Putative fast-spiking interneurons (FSIs) showed significant gamma phase modulation. (A) Example LFP traces showing episodes of high coherence at 50 Hz (top) and 80 Hz (bottom). (B) Gamma phase histograms at 50 Hz (top) and 80 Hz (bottom) for an example neuron (same neuron as A, top). (C) Polar plots of the phase angle and magnitude for all FSIs at 50 Hz (top) and 80 Hz (bottom). For both frequencies, the majority of cells showed a significant phase preference (Rayleigh’s r, p < 0.001, corrected for multiple comparisons; 32/53 for gamma-50, 36/53 for gamma-80). At both frequencies, the distributions of mean phase angles were significantly non-uniform (see main text for details).
Phase relationships between LFPs and FSI spike times leave open the question of whether FSI firing rates are modulated in relationship to LFPs. Such relationships would provide further evidence for the relevance of ventral striatal LFPs for local processing. To address this, we constructed tuning curves of firing rate as a function of gamma-50 and gamma-80 power. In order to compare sessions with different gamma power levels and neurons with different firing rates, gamma power was z-scored and firing rates were plotted as a fraction of the neuron’s minimum firing rate of the raw tuning curve. Because the resulting tuning curves were generally well fit by a line, we used linear regression in order to quantify the magnitude and significance of tuning. In general, FSIs tuned to either gamma-50 power, gamma-80 power, both, or neither were observed, although the majority (31/53) were tuned to at least one. Figure 13
A shows an example of a neuron that increased its firing rate with power in both gamma bands, while the neuron in Figure 13
B had decreased firing with gamma-50 power but increased firing with gamma-80 power (top row). For both example neurons, gamma power did not significantly affect spike-field coherence (bottom row).
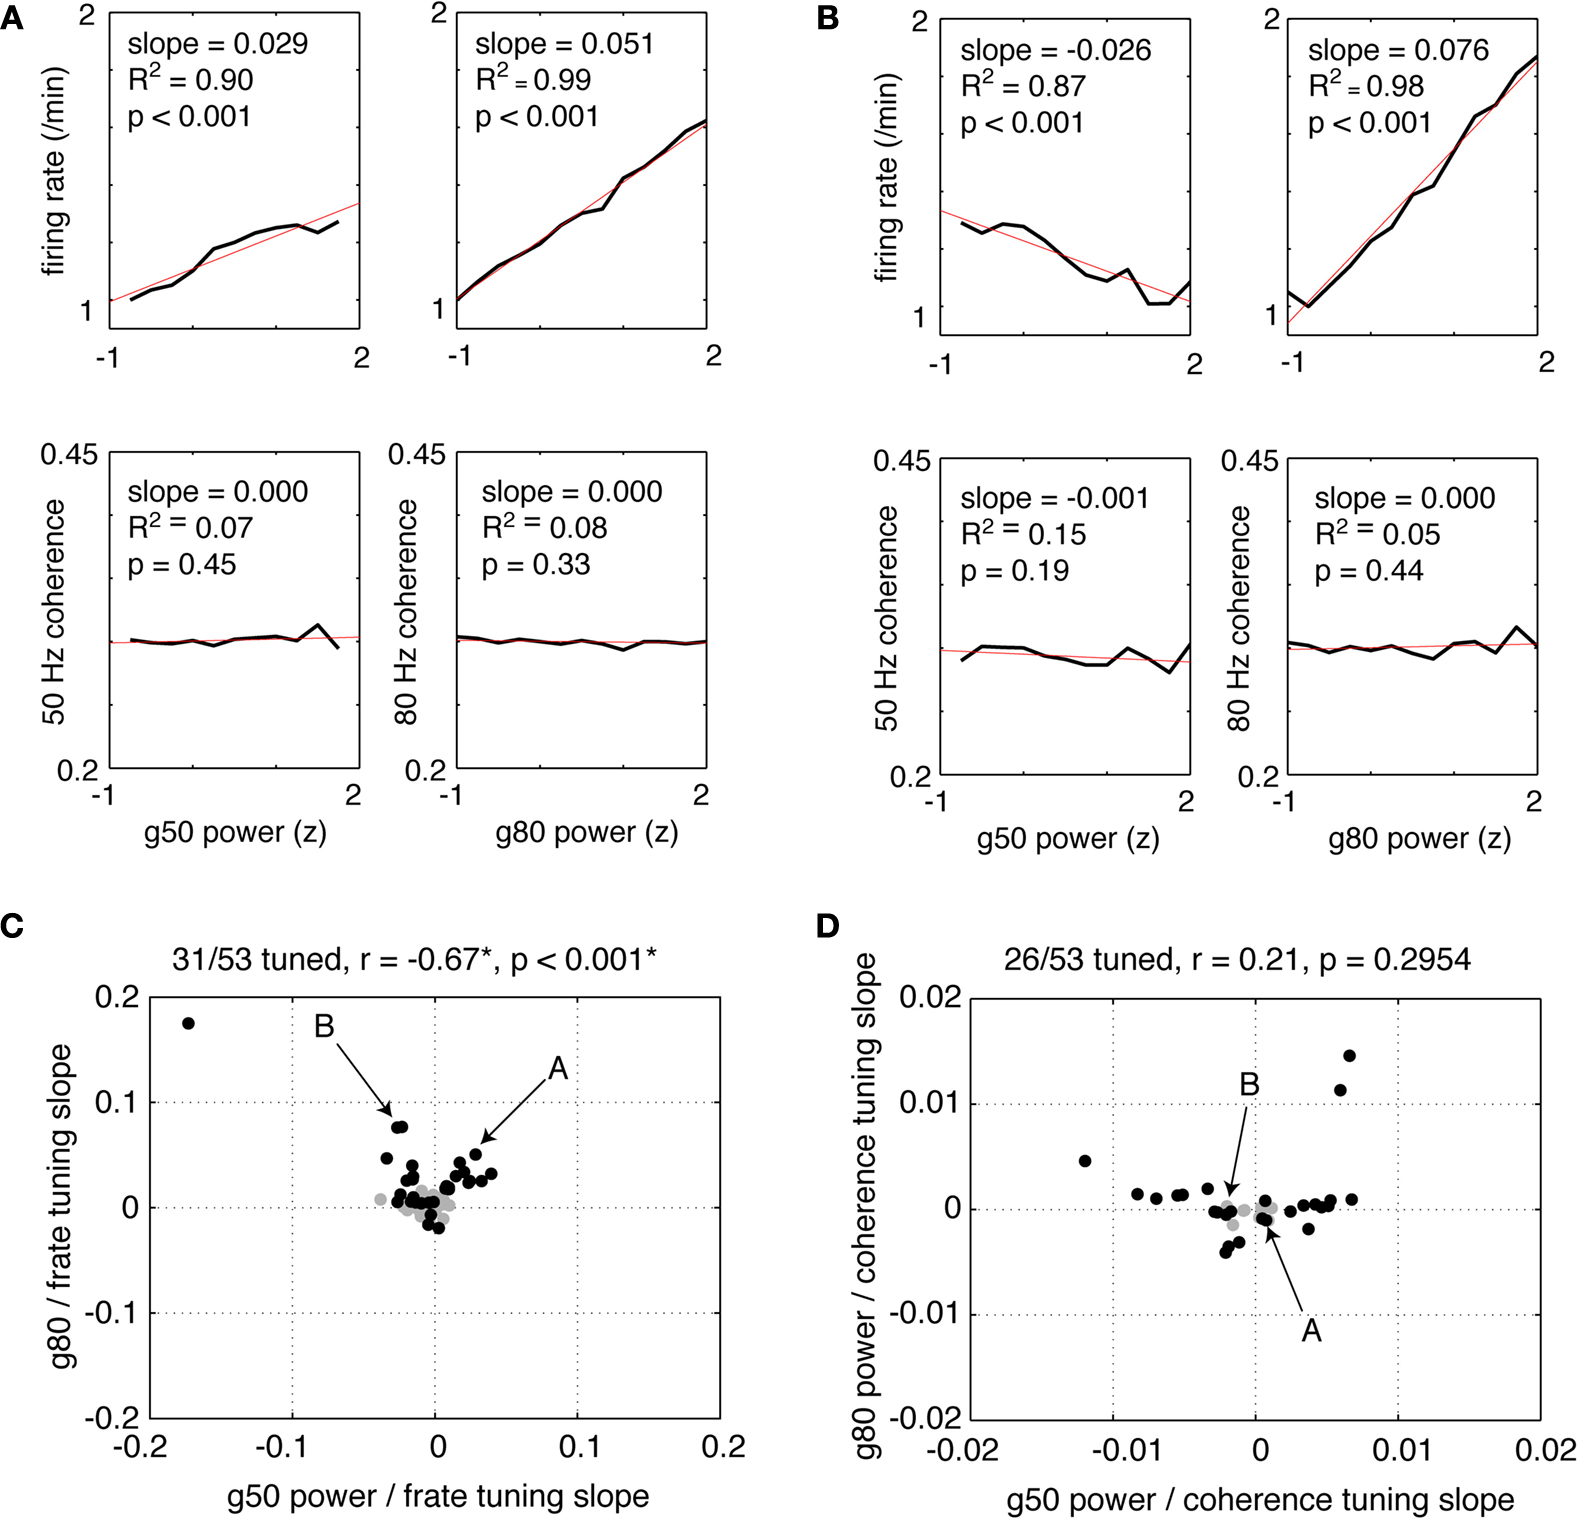
Figure 13. Putative fast-spiking interneurons (FSIs) showed a variety of firing rate tuning relationships to gamma-50 and gamma-80 power. (A,B) Firing rate tuning (top row) and coherence tuning (bottom row) to gamma-50 power (left column) and gamma-80 power (right column) for two example FSIs. Firing rates were normalized to each neuron’s minimum firing rate of its raw tuning curve. Power was z-scored within sessions in order to allow comparison of tuning curves on the same scale. The neuron in (A) increased its firing rate with increasing gamma-50 and gamma-80 power, by a factor of 1.5 or more for the latter, while the neuron in (B) decreased its firing rate with increased gamma-50, but increased firing with stronger gamma-80. For neither neuron did coherence change significantly with gamma power. (C) Population scatterplot of tuning to gamma-50 against tuning to gamma-80. Significant linear regression fits (corrected for multiple comparisons) are shown in black; 31 of 53 neurons were tuned to either gamma-50 power, gamma-80 power, or both. While overall there was a significant negative correlation between gamma-50 and gamma-80 power tuning, this relationship depended on the strongly tuned point in the top left corner. With this point removed, the two were uncorrelated (r = 0.0023, p = 0.99). Arrows indicate the neurons in the examples (A,B). (D) While about half of FSIs (26/53) showed an effect of gamma power on coherence, coherence tuning to gamma-50 and tuning to gamma-80 power were uncorrelated.
To quantify the overall relationship between FSI firing rate dependence on gamma-50 power and gamma-80 power, we plotted the slopes of the linear regression fits or firing rate relative to gamma-50 and gamma-80 power in a scatter diagram (Figure 13
B). Only neurons with significant firing rate dependence (corrected for multiple comparisons) on either gamma-50 power, gamma-80 power, or both were plotted. While overall there was a significant negative correlation between gamma-50 and gamma-80 power tuning (Figure 13
C), this relationship depended on the strongly tuned neuron in the top left corner. Removing this neuron from analysis resulted in a non-significant correlation of 0.0023 (p = 0.99) suggesting that FSI firing rates are tuned to gamma-50 and gamma-80 power independently. While the coherence of the example neurons in Figures 13
A,B did not show a significant dependence on gamma-50 or gamma-80 power, about half of FSIs did show such a relationship for at least one of the power bands (Figure 13
D). However, we did not find significant relationships between coherence tuning to gamma-50 and gamma-80, coherence at gamma-50 and firing rate tuning to gamma-50, and coherence at gamma-80 and firing rate tuning to gamma-80 (all p > 0.13) indicating that in this data set, there was no significant relationship between coherence and firing rate tuning.
Are the same, or different, putative FSIs phase-modulated by gamma-50 and gamma-80? To address this, we computed spike-field coherograms for each neuron with its associated LFP recorded from the same tetrode. Spike-field coherence for a given frequency ranges from 0 to 1, where 0 indicates there is no relationship between spike times and the phase of the LFP component at that frequency, and 1 indicates perfect phase locking. The average coherence for all FSIs is shown in Figure 14
A (red line); because coherence depends on firing rate in realistic situations (Curtis et al., 2009
) we compared the observed coherence to that obtained from ISI shuffled spike trains, where the temporal alignment between spike times and LFP is disturbed but first- and second-order spiking statistics are preserved (black line). This plot shows that while much of the structure of the average coherence was also present in the shuffled control data, the observed coherence was increased at a range of frequencies, prominently so in the gamma range. To assess the contribution of individual FSIs, we plotted each cell’s coherence z- score against the shuffled coherence distribution, ordered by z-score at 50 Hz (Figure 14
B). This plot shows first, that the vast majority of neurons had significant coherence relationships with the LFP at some frequency; furthermore, it indicates that while there were some neurons with high 50 Hz coherence that were also coherent at 80 Hz, there was a clear number of neurons coherent at 50 Hz but not 80 Hz, and vice versa. At a conservative threshold of z > 5, 11/53 neurons cohered with gamma-50, 18/53 with gamma-80, and 5/53 with both. Over all FSIs, there was no significant cross-frequency correlation between the raw or z-scored coherence at 50 and 80 Hz (both 0 < r < 0.06, p > 0.68); however, with different cells having different overall coherence levels, subtracting the mean coherence from each cell resulted in a strong anticorrelation between gamma-50 and gamma-80 coherence (raw coherence: r = −0.47, p = 0.0004; z-scored coherence: r = −0.91, p < 0.0001), indicating that cells’ relative preference for cohering at 50 Hz and 80 Hz was anticorrelated. Furthermore, comparison of the observed 50–80 Hz coherence cross-frequency correlation with that obtained from the shuffled bootstrap samples revealed the correlation between 50 Hz and 80 Hz coherence to be much smaller than expected (compare Figures 14
C,D; white arrows, z = −7.33, p < 0.0001). Taken together, these results indicate that overall, FSIs cohered at 50 Hz or 80 Hz independently. It is important to note that this result is not implied by the previously shown relationship between power in these frequency bands (Figure 4
C); in theory it is possible for single neurons to fire coherently in both these ranges (and some do), but the data in Figure 14
indicate that overall, at least partially distinct populations of FSIs cohered at gamma-50 and gamma-80 frequencies.
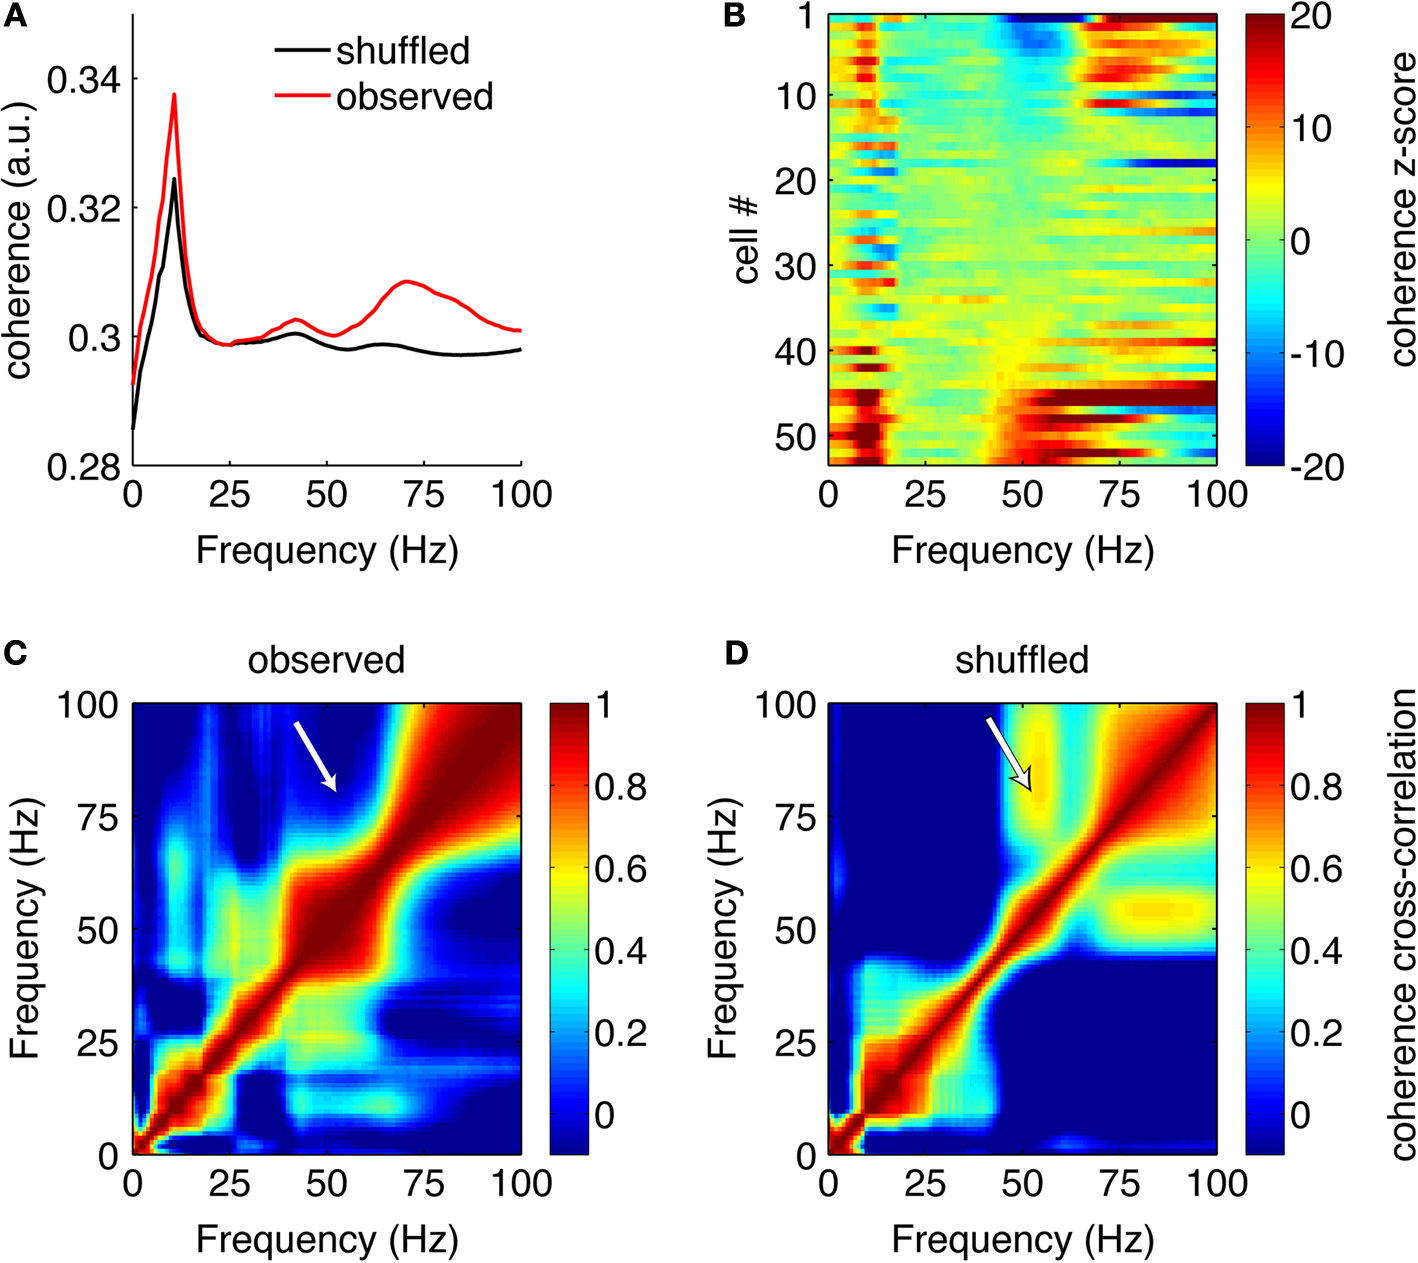
Figure 14. Distinct putative fast-spiking interneurons (FSIs) cohere with gamma-50 or gamma-80. (A) Average spike-field coherence for all FSIs (red) and the average obtained from randomly interspike-interval-shuffled bootstrap samples (black) shows overall coherence in the wide gamma band that cannot be explained by first- or second-order spiking statistics. (B) Coherence for all FSIs individually, z-scored against the distribution of bootstrap samples, ordered by coherence z-score at 50 Hz (bottom to top). While some neurons cohere at both 50 and 80 Hz, there are clear, distinct subgroups that cohere at one, but not the other. (C) Correlation between (raw) coherence at different frequencies across all FSIs. The observed correlation between 50 and 80 Hz was much less than that expected by chance (bootstrap-shuffled correlation in (D), white arrows).
We report that in rats running a spatial decision task, gamma-50 (45–55 Hz) and gamma-80 (70–85 Hz) oscillations in ventral striatal LFPs exhibited distinct relationships to behavior, task events, and spiking activity. Gamma-50 power was increased following reward delivery and before movement initiation; in contrast, gamma-80 power ramped up gradually to reward locations. Gamma-50 power was low and contained little structure early during sessions, but developed a stable pattern within 10 laps, while gamma-80 power was high during early laps, particularly at the final choice point, and returned to a relatively stable level within a similar timeframe. These patterns were consistent across subjects. Putative FSIs exhibited a variety of spiking relationships with both gamma-50 and gamma-80, including phase preference, independent firing rate tuning to gamma-50 and gamma-80 power, and independent coherence at gamma-50 and gamma-80. Implications of these results are discussed below.
Are Gamma-50 and Gamma-80 Generated in Ventral Striatum?
We found relationships between putative FSI spiking activity and gamma oscillations using four different approaches: STA, phase preference, firing rate changes with gamma power, and spike-field coherency. The average STA over all neurons exhibited clear structure, consistent with earlier reports (Berke, 2005
; Kalenscher et al., 2008
); about half of FSIs sampled had a significant phase preference; the majority of FSIs changed their firing rate with changes in gamma power; and many FSIs exhibited significant spike-field coherence in the gamma band. Taken together, these results clearly show that gamma oscillations are relevant to ventral striatal processing, whatever their source; however, these results alone cannot address whether such oscillations are generated elsewhere and affect spiking activity in ventral striatum, or are generated by ventral striatal processes.
In general, in the absence of clear phase reversals such as those observed relative to hippocampal cell layers (Buzsáki et al., 1983
), or without current source density analysis, the possibility that field potentials are volume-conducted from elsewhere in the brain instead of generated locally is difficult to exclude. Specifically, it has been suggested that ventral striatal gamma oscillations may include contributions from nearby piriform cortex (Berke, 2005
), where gamma power is prominent (Kay and Freeman, 1998
). However, there is evidence that such an explanation cannot account for the full range of gamma oscillations observed in the striatum. Recording from putative FSIs in anesthetized rats, Sharott et al. (2009)
found the phase relationship between gamma oscillations in cortex and a range of sites across the striatum to be inconsistent with volume conduction. Furthermore, oscillations in the gamma range have been found using intracellular recordings in identified PV+ FSIs in the striatum (Bracci et al., 2003
; ventral striatum specifically: Taverna et al., 2007
). In vitro studies of such striatal FSIs have revealed prominent subthreshold oscillations in the 50 Hz range. Importantly, these oscillations did not require fast synaptic input, but depended on the amount of membrane depolarization instead (Bracci et al., 2003
), suggesting that they are generated by intrinsic membrane properties and not volume-conducted or the result of network properties.
The suggestion that striatal FSIs contribute to the generation of local gamma oscillations is compatible with observations from hippocampus and a number of cortical areas, where there is much support for the role of PV+ FSIs in the generation of gamma oscillations (Buzsáki et al., 1983
; Freund and Katona, 2007
; Klausberger et al., 2003
; Tamás et al., 2000
). An open question is whether the intensity of subthreshold gamma oscillations in striatum displays an anatomical gradient consistent with that seen in LFP gamma power (Berke et al., 2004
; Masimore, 2008
) and if these oscillations synchronize across FSIs; if found, such data would provide further evidence supporting the local generation of ventral striatal gamma oscillations.
Differences in Putative Fast-Spiking Interneuron Relationships to Gamma-50 and Gamma-80
While examples of entrainment of striatal FSIs to gamma oscillations have been documented before (Berke, 2005
; Kalenscher et al., 2008
), we found distinct FSIs cohering with gamma-50 and gamma-80, as well as FSIs changing their firing rate differentially with gamma-50 and gamma-80 power. This suggests that, regardless of the origin of the field potential, there are local effects of gamma-50 and gamma-80, mediated by at least partially distinct populations of ventral striatal neurons. Bracci et al. (2003)
reported that the frequency of FSI intrinsic subthreshold membrane oscillations could be increased (from about 45 to about 80 Hz on average; their Figure 4
B) by increasing the amount of injected current. This suggests that individual FSIs are, in principle, capable of expressing the range of oscillation frequencies considered here, and might switch between different oscillation frequencies given appropriate stimulation. However, we observed a partial separation between gamma-50 and gamma-80 in terms of FSI firing rate tuning and coherence; whether this distinction arises from differences in afferent input or neuromodulation, intrinsic properties, or their interaction, remains to be determined. As suggested by the opposing gradients of high voltage spindle-entrained FSIs in dorsolateral striatum and high gamma power in ventromedial striatum (Berke et al., 2004
), such differences are unlikely to be homogeneous throughout the striatum. A limitation of the current data set is that we sampled a relatively large area within ventral striatum that likely includes relevant anatomical and cytological distinctions (Pennartz et al., 1994
; Zahm and Brog, 1992
), raising the possibility of segregation between gamma-50 and gamma-80 generation and/or relevance, obscured by lack of anatomical specificity in our data. Nevertheless, the separation between gamma-50 and gamma-80 related FSIs provides an entry point that can be connected to membrane properties and their dependence on neuromodulators such as dopamine (Bracci et al., 2002
; Costa et al., 2006
; Dejean et al., 2008
), as well as to differences in FSI firing correlates (Berke, 2008
; Sharott et al., 2009
) in further experiments.
Functional Roles of Ventral Striatal Gamma Oscillations and Fast-Spiking Interneurons
Gamma oscillations are widespread in the brain, and are thought to be important in organizing local activity within networks, as well as in “binding” information between them (Buzsáki, 2006
; Fries et al., 2007
; Singer, 1999
; Varela et al., 2001
). In this regard, is notable that two areas with prominent gamma oscillations, the hippocampus and frontal cortex (Bragin et al., 1995
; Magill et al., 2005
) both send functionally relevant projections to ventral striatum (Block et al., 2007
; Goto and Grace, 2008
; Ito et al., 2008
), raising the possibility that gamma oscillations mediate the synchronization or “gating” of information flow between these areas. Gruber et al. (2009)
examined the cross-coherence between ventral striatum, hippocampus, and frontal cortex during lever-pressing for reward, but their report did not include the gamma band. Recording from dorsal striatum, Tort et al. (2008)
found gamma oscillations occurring at particular phases of the hippocampal theta rhythm, with the strength of this cross-frequency coupling dependent on task variables. These striatal gamma oscillations did not appear to be coherent with hippocampal gamma (see also DeCoteau et al., 2007
), but our results suggest it would be of interest to determine the nature of this relationship for ventral striatal recording sites.
In human studies, as in rats, gamma oscillations in the basal ganglia have been found to precede movement (Brown, 2003
) and are thought to be of functional importance, as demonstrated by their recovery following levodopa treatment (Brown et al., 2001
; Cassidy et al., 2002
). Pathological oscillation patterns in the basal ganglia, including the striatum, are a key characteristic of Parkinson’s disease. While much effort has focused on oscillations in the GP and STN where DBS is particularly effective (Brown, 2007
), the role of the striatum in providing inputs to these areas is also being explored (Courtemanche et al., 2003
; Goldberg et al., 2004
; Levy et al., 2002
; Raz et al., 2001
). As the main input nucleus of the basal ganglia, the striatum is likely to be an important contributor to oscillation patterns observed in STN and GP. In ventral striatum, the effectiveness of DBS to alleviate the symptoms of OCD and major depression is starting to be explored, with some success (Aouizerate et al., 2009
; Okun et al., 2007
; Schlaepfer et al., 2008
; Tass et al., 2003
; Vassoler et al. 2008
). While it is possible that some of these effects arise from stimulation of ventral striatal afferents, such as orbitofrontal cortex (McCracken and Grace, 2007
), these results are consistent with a functional role for ventral striatal oscillatory activity. Furthermore, recording from ventral striatum in humans, Cohen et al. (2009)
found gamma activity following reward receipt; thus, both our study and studies in humans indicate that ventral striatal gamma activity is associated with both reward processing and movement initiation (Brown, 2003
). Such observations suggest significant overlap with our data from rats, such that a better understanding of gamma oscillations in ventral striatum could provide a useful tool in guiding and interpreting human studies.
Distinct Behavioral Correlates of Gamma-50 and Gamma-80
We found striking dissociations between gamma-50 and gamma-80 power in (1) their distribution relative to reward locations on the track, and (2) their evolution with experience. Gamma-50 increased sharply following reward receipt, while gamma-80 power showed a ramp-like increase up to reward receipt, followed by an abrupt decline. Overall gamma-80 power declined with experience, whereas gamma-50 power increased. Kalenscher et al. (2008)
reported reward-related oscillations in rats running a lap-based task, but they did not distinguish between gamma-50 and gamma-80. Tort et al. (2008)
reported the presence of gamma-50 and gamma-80 in dorsal striatum; while gamma-50 on their T-maze task was highest at the reward site, consistent with the present results, their gamma-80 did not appear to show anticipatory ramping activity. To what extent this reflects task differences or dorsal-ventral differences is not known. It is important to note that on our task, neither gamma-50 or gamma-80 modulation can be straightforwardly explained by a relationship to running speed. For gamma-80, the reward-approach ramp observed on the segment between the final choice point and the first reward site (T4-F1) is accompanied by a similar speed profile to that of the F2-S segment, where no gamma-80 ramp is seen. Similarly, elevated gamma-50 power persists well into the F2-S segment, but is absent on T4-F1.
The ramping-up-to-reward effect of ventral striatal gamma-80 power suggests it is primarily related to anticipating aspects of reward, similar to ramping activity observed in ventral striatal units (Lavoie and Mizumori, 1994
; Miyazaki et al., 1998
; Schultz et al., 1992
). It has been suggested that covert representations of reward contribute to flexible, outcome-dependent decision making (Balleine, 2001
; Overmier and Lawry, 1979
; van der Meer and Redish, 2009
); consistent with this idea, there was evidence that high gamma power was increased at the final choice point early in the session, and before turnarounds, suggesting a possible relationship to decision making. This pattern of modulation was reminiscent of the covert representation-of-reward effect reported in van der Meer and Redish (2009)
;indeed, the peak of increased gamma-80 at the final choice point during early learning matched that of increased reward cell firing in that earlier study, and in both a smaller increase can be seen at other points on the track (e.g., start of maze). This suggests a link between reward-responsive cell activity and gamma-80 that is specific to covert representation of reward. The fact that gamma-80 power was high overall during early laps compared to later laps is consistent with the idea that representations of reward are involved in flexible decision-making processes engaged during early learning (Johnson et al., 2007
; van der Meer and Redish, 2009
). While it may seem paradoxical that representations of reward should be activated during early learning, when uncertainty about reward is relatively high, it is possible that this reflects a multiple-systems organization: during early learning, a “flexible” system representing and evaluating possible outcomes may give rise to reward signals in ventral striatum, while with experience, other areas (such as dorsal striatum) may assume control (Daw et al., 2005
; Johnson et al., 2007
). Further studies manipulating the value of rewards, as well as tests for the behavioral strategy (outcome-dependent or habitual) could address what specific properties of reward or motivation this signal is associated with.
Gamma-50 oscillations in rat ventral striatum have previously been related to movement initiation (Masimore et al., 2005
) and to reward receipt (Berke and Kunec, 2004
; Kalenscher et al., 2008
). In such freely moving paradigms (including ours) reward receipt tends to be correlated with other aspects of behavior, such as movement cessation, pausing, and movement initiation, making the precise correlates of gamma-50 difficult to identify. Several aspects of the present analysis address this issue. First, the temporal profile of gamma-50 power (Figure 9
) shows a clear peak following reward receipt. The observation that this peak was absent from matched control laps where no reward was received suggests that it results from reward receipt; however, in principle it is possible that differences in behavior on rewarded vs. non-rewarded trials, rather than the presence or absence of reward per se, could account for this gamma-50 pattern. Rewarded and non-rewarded trials have at least movement cessation (stop running) and movement initiation (start running) in common, thus those factors cannot account for the observed difference. A possibility is that gamma-50 is associated with appetitive approach movements specifically, such as the rat actually placing its snout in the reward delivery tube in order to catch expected food pellets. However, we observed the rats engaging in such behavior on both rewarded and non-rewarded trials, with if anything more vigorous food-searching behavior on non-rewarded trials. Hence, differences in approach or food-seeking behaviors are unlikely to account for the observed gamma-50 differences on rewarded vs. non-rewarded trials. A further potential explanation is that gamma-50 is simply associated with pausing or non-activity. While this could in theory be consistent with both the gamma-50 increase before turnarounds and the slow, sustained increase following reward delivery, it cannot explain the sharp early peak that follows reward delivery, or the persistence of gamma-50 beyond movement initiation. Furthermore, modulations in gamma-50 power developed over the first 10 laps or so (Figures 5 and 9
). Taken together, these results strongly suggest that overt behaviors such as movement cessation or initiation, pausing, or approach cannot account for the observed pattern of gamma-50 power modulation at the reward sites.
What, then, explains the complex pattern of gamma-50 power modulation? Clearly it is not simply a response to reward delivery; we observed an initial sharp peak, followed by a slower, sustained increase in power following reward receipt, but also increased power before movement initiation (turnarounds) in the absence of reward, and little modulation was observed during reward receipt on early laps. This latter observation suggests a learning component; further experimental manipulations are needed to test whether gamma-50 power following reward reflects learned value, some kind of error-related signal (“reward received as expected”), or other aspects of reward. It is theoretically possible that the gamma-50 signal we observed consists of multiple independent components, which are generated in anatomically distinct circuits but sum through volume conduction, such that the components appear indistinguishable on individual electrodes. In the absence of simple ways to test and verify such a scenario, an alternative possibility is that gamma-50 reflects different settings in which reward-related processing is engaged. There is a growing literature documenting representations of reward not being activated only by reward receipt itself, but also during movement preparation (German and Fields, 2007
; Jin and Costa, 2009
; Lauwereyns et al., 2002
; Taha et al., 2007
), decision-making (van der Meer and Redish, 2009
), and offline processing (Lansink et al., 2008
). Reinforcement learning models require explicit links between actions and action values (Sutton and Barto, 1998
), which need to be updated following rewards, as well as retrieved during action selection. The results reported here are consistent with the idea that ventral striatal gamma oscillations play a role in both the formation and recall of associations relevant to motivated behavior. The observed separation between gamma-50 and gamma-80, their complex behavioral correlates, and their relationship with spiking activity likely reflect functionally important aspects of ventral striatal processing, and provide entry points for further investigation.
The authors declare that the research was conducted in the absence of any commercial or financial relationships that could be construed as a potential conflict of interest.
We thank Josh Berke, Kendra Burbank, John Ferguson, Anoopum Gupta, Steve Jensen, Adam Johnson, Adam Steiner, and Dan Wolf for discussion, and Chris Boldt for technical assistance. We are grateful to Sacha van Albada, Marieke van Vugt, and the referees for their detailed comments on a previous version of the manuscript.
Aouizerate, B., Cuny, E., Bardinet, E., Yelnik, J., Martin-Guehl, C., Rotge, J. Y., Rougier, A., Bioulac, B., Tignol, J., Mallet, L., Burbaud, P., and Guehl, D. (2009). Distinct striatal targets in treating obsessive-compulsive disorder and major depression. J. Neurosurg. doi: 10.3171/2009.2.JNS0881.
Okun, M. S., Mann, G., Foote, K. D., Shapira, N. A., Bowers, D., Springer, U., Knight, W., Martin, P., and Goodman, W. K. (2007). Deep brain stimulation in the internal capsule and nucleus accumbens region: responses observed during active and sham programming. J. Neurol. Neurosurg. Psychiatry 78, 310–314.
Tort, A. B. L., Kramer, M. A., Thorn, C., Gibson, D. J., Kubota, Y., Graybiel, A. M., and Kopell, N. J. (2008). Dynamic cross-frequency couplings of local field potential oscillations in rat striatum and hippocampus during performance of a T-maze task. Proc. Natl. Acad. Sci. U. S. A. 105, 20517–20522.