The impact of incorporating molecular evolutionary model into predictions of phylogenetic signal and noise
 Zhuo Su
 Zheng Wang
 Francesc López-Giráldez
 Jeffrey P. Townsend
- 1Department of Ecology and Evolutionary Biology, Yale University, New Haven, CT, USA
- 2Department of Biostatistics, Yale University, New Haven, CT, USA
- 3Yale Center for Genomic Analysis, Yale University, New Haven, CT, USA
- 4Program in Computational Biology and Bioinformatics, Yale University, New Haven, CT, USA
Phylogenetic inference can be improved by the development and use of better models for inference given the data available, or by gathering more appropriate data given the potential inferences to be made. Numerous studies have demonstrated the crucial importance of selecting a best-fit model to conducting accurate phylogenetic inference given a data set, explicitly revealing how model choice affects the results of phylogenetic inferences. However, the importance of specifying a correct model of evolution for predictions of the best data to be gathered has never been examined. Here, we extend analyses of phylogenetic signal and noise that predict the potential to resolve nodes in a phylogeny to incorporate all time-reversible Markov models of nucleotide substitution. Extending previous results on the canonical four-taxon tree, our theory yields an analytical method that uses estimates of the rates of evolution and the model of molecular evolution to predict the distribution of signal, noise, and polytomy. We applied our methods to a study of 29 taxa of the yeast genus Candida and allied members to predict the power of five markers, COX2, ACT1, RPB1, RPB2, and D1/D2 LSU, to resolve a poorly supported backbone node corresponding to a clade of haploid Candida species, as well as 19 other nodes that are reasonably short and at least moderately deep in the consensus tree. The use of simple, unrealistic models that did not take into account transition/transversion rate differences led to some discrepancies in predictions, but overall our results demonstrate that predictions of signal and noise in phylogenetics are fairly robust to model specification.
Introduction
Phylogenetic inferences can be improved either by improving the models applied to data, or by improving the quality of the data. Enormous progress has been made in the development of realistic, powerful evolutionary models for phylogenetic inference, and studies have demonstrated that using correct evolutionary models on a same data set can be essential to making correct inferences (e.g., Sullivan and Swofford, 1997; Kelsey et al., 1999; Ripplinger and Sullivan, 2010). Nonetheless, still larger gains in accuracy of inference could be obtained by optimal selection of the data to be gathered to address the phylogenetic question at hand (Goldman, 1998; Townsend et al., 2008; Tekle et al., 2010; Fong and Fujita, 2011; Moeller and Townsend, 2011; Crawley and Hilu, 2012; Horreo, 2012; Silva et al., 2012; Walker et al., 2012; Granados Mendoza et al., 2013). Furthermore, given the advance of next-generation sequencing methods, such as RAD Sequencing (Baird et al., 2008) and anchored hybrid enrichment (Lemmon et al., 2012), which allow generation of sequence data from hundreds to thousands of putatively orthologous loci, it is becoming increasingly important to either selectively generate or selectively filter the immense data sets generated by next-generation sequencing methods. Thus, inference can be based on the most useful or least misleading loci for resolving the phylogeny at hand. However, it remains to be explored the degree to which model selection impacts the determination of optimal loci for phylogenetic inference.
Less accurate and even inconsistent inferences can result from incorrect model assumptions (Felsenstein, 1978; Huelsenbeck and Hillis, 1993; Penny et al., 1994; Bruno and Halpern, 1999; but see Rzhetsky and Sitnikova, 1996; Yang, 1997; Posada and Crandall, 2001). Typically, under-parameterization of models will lead to underestimates of some high-magnitude components of the evolutionary process (e.g., Huelsenbeck and Hillis, 1993; Gaut and Lewis, 1995; Sullivan and Swofford, 1997, 2001), components that then become a source of homoplasy and misleading inference. While the apparent fit of a model to the data can always be improved by adding additional parameters, over-parameterization without sufficient data can lead to large stochastic errors and misestimation of individual parameters, simultaneous with a higher computational demand (Rannala, 2002; Lemmon and Moriarty, 2004). To find a balance between these issues, a variety of statistical approaches have been developed to select models for maximum likelihood (ML) analysis and Bayesian estimation, such as the hierarchical likelihood-ratio test (hLRT; Frati et al., 1997; Sullivan et al., 1997; Posada and Crandall, 1998), relative Akaike information (Akaike, 1973), relative Bayesian information (Schwarz, 1978), and Decision Theory (Minin et al., 2003; Abdo et al., 2004). Multiple models are often supported by different selection methods and alternatively supported models often do lead to incongruent optimal tree topologies.
Nevertheless, ML analysis with alternatively supported models rarely yields significantly different evolutionary inferences, because different outcomes attributable to alternatively supported models are mostly limited to nodes that are poorly resolved by the data set under any model (Ripplinger and Sullivan, 2008). Because the prospects for improvement of phylogenetic inference by use of optimal data are so promising, obtaining a better idea of their robustness to model selection is paramount. Recently, several analytical approaches to quantifying the phylogenetic power of molecular characters have been introduced. Goldman (1998) pioneered an analytical method that uses the Fisher information matrix to determine optimal evolutionary rates and taxon-sampling strategies to maximize the information to resolve a divergence in a phylogeny. Susko (2011) calculated via large sequence-length approximations the probabilities of correct phylogenetic reconstruction for ML estimation for a single poorly resolved internode. For a proposed discrete data set, Townsend et al. (2012) applied empirical estimates of site substitution rates and an s-state Poisson model of molecular evolution (s ≥ 2) to predict the probabilities of a data set leading to correct, incorrect, and polytomous resolution of a quartet-taxon phylogeny. This analytical approach makes it possible to address the unresolved question of whether choice in model selection affects predictions of phylogenetic informativeness. Not only does phylogenetic informativeness depend critically on estimates of the rate of evolution of the characters to be applied to a phylogenetic problem (Graybeal, 1994; Naylor and Brown, 1998; Yang, 1998; Rokas and Holland, 2000; Townsend, 2007; Townsend and Leuenberger, 2011; Townsend et al., 2012), but also the impact of characters on inference would likely depend upon the model of evolution to which they presumably adhere. To investigate this question, we generalize the Townsend et al. (2012) phylogenetic signal and noise analysis based on the s-state Poisson model, to incorporate any time-reversible homogenous Markov model of nucleotide substitution. This generalization allows the signal and noise analysis to incorporate more realistic, higher parameterized assumptions of molecular evolution than the s-state Poisson model.
After developing this theory, we apply it to an example study, analyzing 29 taxa of the yeast genus Candida and allied teleomorph genera using phylogenetic signal and noise analysis based on 14 commonly used nucleotide substitution models (Figure 1). The yeast genus Candida and allied teleomorph genera belong to the order of Saccharomycetales. Members of the genus Candida are ubiquitous in numerous natural and artificial habitats (Kurtzman and Fell, 1998). Several species of Candida, such as C. parapsilosis, C. tropicalis, and C. albicans, are among the most common human pathogenic fungi. Relationships among different genera or families of the Saccharomycetales have not yet been fully resolved, especially for relationships along the backbone of the trees. In a recent study of a six-gene yeast phylogeny with a focus on medically important Candida species by Diezmann et al. (2004), major clades were recognized with statistical support in the order, but several backbone nodes of the clade 2, which included haploid Candida species such as C. guillermondii, C. lusitaniae, Debaryomyces hansenii, and other Candida species that are not invasive pathogens for humans, were not well supported. Similarly, in another five-gene yeast phylogeny study of 70 taxa of the genus Candida and allied sexually reproducing genera (Tsui et al., 2008), the backbone node corresponding to the clade of a similar set of haploid Candida taxa was not well supported. However, in a recent study using data selected from 706 orthologs for only 17 yeast species, the haploid Candida clade was strongly supported by peptide sequences but not by coding nucleotide sequences from the selected genes (Butler et al., 2009). In our example study, we assay five markers: the second subunit of the mitochondrial cytochrome oxidase gene (COX2), the largest subunit (RPB1) and the second largest subunit (RPB2) of the RNA polymerase II gene, the actin gene (ACT1), and the D1/D2 LSU rRNA gene, for their power to resolve a backbone node corresponding to a clade of haploid Candida species, which has been poorly resolved in previous studies, as well as 19 other nodes featuring a relatively short, deep internode in the consensus tree. By comparing the five genes' predicted probabilities of resolution for the 20 assayed nodes based on all alternative models, we elucidate the degree to which choice in model selection affects predictions of phylogenetic signal and noise.
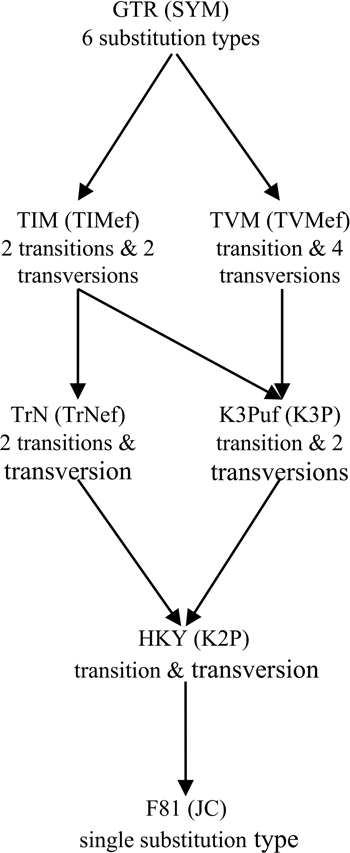
Figure 1. Relationship among 14 homogenous time-reversible models of nucleotide substitution. Arrows indicate parameter restrictions that reduce a more general, higher-parameterized model to a more restricted, lower-parameterized one. For each case of distinct substitution types corresponding to a pair of models, the model outside the brackets allows unequal equilibrium base frequencies and the model inside the brackets assumes equal equilibrium base frequencies. These models are: JC (Jukes and Cantor, 1969), which is equivalent to the s-state Poisson model for nucleotides (s = 4); K2P (Kimura 2-Parameter, a.k.a. K80; Kimura, 1980); TrNef (Tamura and Nei, 1993 model with equal base frequencies); K3P (Kimura 3-Parameter, a.k.a. K81; Kimura, 1981); TIMef (TransItional Model with equal base frequencies); TVMef (TransVersional Model with equal base frequencies); SYM (SYMmetric, Zharkikh, 1994); F81 (Felsenstein, 1981); HKY (Hasegawa et al., 1985; Felsenstein described an essentially identical model, F84, using a different parameterization—see Kishino and Hasegawa, 1989; Felsenstein and Churchill, 1996; implemented in the software DNADIST in PHYLIP—see Felsenstein, 1993); TrN (Tamura and Nei, 1993); K3Puf (K3P model with unequal base frequencies, a.k.a. K81uf); TIM (TransItional Model: rAC = rGT ≠ rAT = rCG ≠ rAG ≠ rCT); TVM (TransVersional Model: rAG = rCT ≠ rAC ≠ rAT ≠ rCG ≠ rGT); and GTR (General Time Reversible, Tavaré, 1986; Rodriguez et al., 1990).
Theory
As in Townsend et al. (2012), we model phylogenetic signal and noise as accurate and inaccurate parsimony-informative sites for resolution of a four-taxon tree. A site is considered parsimony-informative for resolving the four-taxon tree if it exhibits an AABB pattern of character states at the branch leaves, meaning that at the given site, two of the branch leaves feature an identical character state (suggesting these two branches belong to the same clade) while the other two branch leaves share a different character state. The four-taxon tree has three possible tip-labeled subtrees, all of which can be supported by an AABB pattern, but only one of the three subtrees matches the actual four-taxon tree topology (c.f. Figure 1 in Townsend et al., 2012). Any other pattern yields no net contribution per site to phylogeny resolution under maximum parsimony and very minimal impact per site under ML analysis and Bayesian methods; thus any non-AABB pattern is conservatively assumed to make no contribution away from a polytomy by our approach.
Each Markov model of nucleotide substitution can be mathematically expressed as a four-by-four instantaneous rate matrix Q, in which the element qij is the rate of change from nucleotide base i to base j during an infinitesimal time period dt, where j ≠ i. We use 1, 2, 3, and 4 in matrix indices to denote the four nucleotide character states in the order of Thymine (T), Cytosine (C), Adenine (A), and Guanine (G). To date almost all of the nucleotide substitution models proposed in the literature are time-reversible, meaning that the overall rate of change from base i to base j in a given length of time is assumed to be the same as that from base j to base i, i.e., πiqij = πjqji(j ≠ i). For the most general time-reversible Markov process of nucleotide characters, the General Time Reversible (GTR) model, the rate matrix can be written as
in which the diagonal elements (*) are qii = −∑j≠iqij such that elements across each row sum to zero. The product of the mean instantaneous substitution rate, μ, and a relative rate parameter, a,b,c,d,e, or f, yields a rate parameter. The frequency parameters, πT, πC, πA, and πG, represent the equilibrium frequencies of the four nucleotide bases, thereby obeying πT +πC + πA +πG = 1. Imposing further constraints on the model parameters reduces Equation 1 from the GTR model to lower-parameterized models (Table 1).
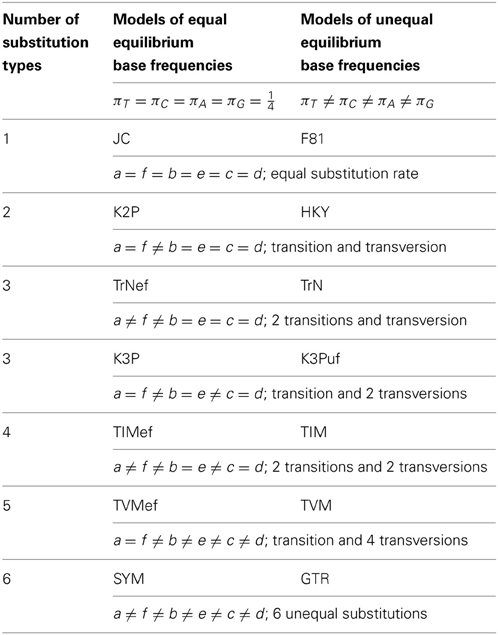
Table 1. Parameterization of 14 nucleotide substitution models.
The average substitution rate per nucleotide character, λ, can be expressed in terms of the rate and frequency parameters as
For a nucleotide site with a substitution rate λ and a branch of length t, λt gives the expected number of substitutions accumulated at the site between the two ends of the branch. Because modeling of signal and noise probability functions depends on the site substitution rate λ, the rate matrix needs to be written as a function of λ, Q(λ), by solving Equation 2 for μ, yielding
Then μ from Equation 3 may be substituted into Equation 1. To calculate the probabilities of character state changes over a branch of a finite length, we need to calculate the matrix of substitution probability P(λ, t), via Equation 4:
in which the element pij (λ, t) represents the probability of change from nucleotide base i to base j at a site with a substitution rate λ over a branch of length t. To solve for pij (λ, t), we apply eigen decomposition to the instantaneous rate matrix Q(λ):
in which U is a four-by-four matrix whose i-th column is the i-th eigenvector of Q(λ) and Λ is a four-by-four diagonal matrix whose i-th diagonal element is the i-th eigenvalue of Q(λ). The matrix exponential in Equation 4 can thus be evaluated as
For lower-parameterized models (i.e., JC, F81, K2P, HKY, TrNef, TrN, and K3P models), analytical solutions exist for Equation 6 (also see Yang, 1994). Regardless of model complexity, Equation 6 can also be evaluated numerically after substitution of estimated values of the relative rate and base frequency parameters of any given model.
We utilize the substitution probabilities calculated via Equation 6, appropriate for any time-reversible Markov model of nucleotide substitution, to quantify probabilities for the evolution of character states at a single site with a substitution rate of λ across an ultrametric four-taxon tree with an internode of length to and four subtending branches of equal length T (Figure 2).
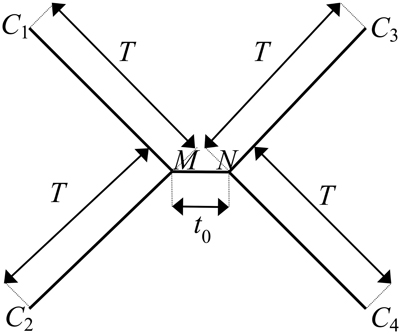
Figure 2. The canonical phylogenetic quartet in an ultrametric form, with an internode of length to and four subtending branches of equal length T. The ancestral character states at the two ends of the internode are denoted as M and N. The character states at the terminal leaves of the four branches are denoted as C1, C2, C3, and C4. The pattern of character states at a site consistent with the true topology of the four-taxon tree, τ3, is C1 = C2, C3 = C4, C1 ≠ C3. A site pattern that matches C1 = C3, C2 = C4, C1 ≠ C2 or C1 = C4, C2 = C3, C1 ≠ C2 is consistent with one of the two possible incorrect subtrees of the four-taxon tree: τ1 or τ2, respectively.
We denote the ancestral character states at the two ends of the internode as M and N and the character states at the terminal leaves of the four branches as C1, C2, C3, and C4, respectively, (Figure 2). The pattern of character states that is consistent with the correct subtree, denoted as τ3, is C1 = C2, C3 = C4, C1 ≠ C3. The rooting of the tree does not affect analysis outcomes for time-reversible models; consequently, we can write out the potential evolutionary histories of character states by arbitrarily starting from the ancestral character state M on one end of the internode. M can be any of the four character states, and the probability of each possible state occurring there is given by its corresponding nucleotide base frequency πM, where M = 1, 2, 3, or 4. Likewise, on the other end of the internode, N can be any of the four states, and the probability of observing each possible state at N from M is pMN (λ, to), where N = 1, 2, 3, or 4. Moving along the four branches to the terminal leaves, the probability of observing every possible permutation of character states at the leaves conditional on M and N is given by pMC1 (λ, T)pMC2 (λ, T)pNC3 (λ, T)pNC4 (λ, T), where C1, C2, C3, C4 = 1, 2, 3, or 4.
Phylogenetic signal leads to the true topology τ3, which demonstrates the synapomorphic pattern of character states, C1 = C2, C3 = C4, C1 ≠ C3. Phylogenetic signal arises if a character state change has occurred during the deep short internode (i.e., M ≠ N) and the signal is preserved if zero subsequent character state change has occurred on the subtending lineages to obscure the ancestral character states (i.e., C1 = C2 = M, C3 = C4 = N). In the meantime, noise due to homoplasy can also lead to the pattern of character states that is consistent with τ3, through character state changes along subtending lineages that randomize the character states to the desired pattern at the branch terminal leaves regardless of the presence of signal over the internode (c.f. Figure 1 in Townsend et al., 2012). Therefore, the probability of a site supporting the true topology τ3 with internode length to and length of subtending branches T due to either signal or homoplasy, is equal to the sum of probabilities associated with these two scenarios that both lead to the synapomorphic pattern of C1 = C2, C3 = C4, C1 ≠ C3:
A homoplasious site pattern of character states that is consistent with either of the two incorrect quartet topologies, τ1 and τ2, matches C1 = C3, C2 = C4, C1 ≠ C2, or C1 = C4, C2 = C3, C1 ≠ C2, respectively, (Figure 2). Both patterns are a result of homoplasy along the subtending branches that randomize the character states regardless of the presence of signal over the internode. The probabilities of a site supporting either of the incorrect topologies (τ1 and τ2) with the defined internode and branch lengths can be evaluated as the sum of probabilities associated with all possible scenarios of character state changes that lead to the respective homoplasious pattern, C1 = C3, C2 = C4, C1 ≠ C2, or C1 = C4, C2 = C3, C1 ≠ C2:
The probability of a site supporting any pattern that is not consistent with τ1, τ2, or τ3 (i.e., any non-AABB pattern) is given by
Following Townsend et al. (2012), we consider n nucleotide sites, each with its own distinct rate of substitution λi, 1 ≤ i ≤ n. For this set of sites, Equations 7–10 calculate the probabilities of each nucleotide site i supporting the correct topology (y), the two incorrect topologies (x1 and x2), and polytomy (z) for an ultrametric four-taxon tree with branch lengths to and T based on any time-reversible Markov model of nucleotide substitution. The greater the number of sites that support the correct topology there are compared to the numbers of sites that support either of the incorrect topologies, the more likely the whole set of sites will lead to correct resolution of the four-taxon tree. The probabilities of the whole set of n sites leading to correct, incorrect, and polytomous resolution of the four-taxon tree can then be evaluated either by building a histogram of potential levels of resolution by repeated serial Monte Carlo across sites (c.f. Townsend et al., 2012), or by use of an accurate analytical approximation that yields essentially identical results (Equations 11–13 of Townsend et al., 2012; c.f. Appendix II of Townsend et al., 2012). Compared to the Monte Carlo approach, the analytical approximation demands a significantly less amount of computation power and has no stochastic element to its result.
Materials and Methods
The existing COX2, RPB1, RPB2, ACT1, and D1/D2 LSU sequences of Schizosaccharomyces pombe and Zygoascus hellenicus (chosen as the outgroups; Diezmann et al., 2004) and 29 taxa of the yeast genus Candida and allied teleomorph genera were downloaded from GenBank (Data Sheet 1). The sequence alignments of the five markers were generated from SATé (Liu et al., 2009) and used for all subsequent analyses without manual adjustment except necessary trimming of the highly gapped ends and indels using MacClade 4.0 (Maddison and Maddison, 2000). The best-fit nucleotide substitution models for the five gene sequences were selected with the Akaike information criterion (AIC) measure and four gamma categories via ModelGenerator v0.85 (Keane et al., 2006). The search for the best-fit model was limited to the 14 models in Figure 1 without and with Γ, I, and I + Γ.
One single data set which consisted of the 31 taxa and 3617 characters was prepared with five partitions from alignments of the five markers (597 characters from COX2, 574 from RPB1, 936 from RPB2, 979 from ACT1, and 531 from D1/D2 LSU; Data Sheet 2) and was deposited in TreeBase under the accession number S14200. Bayesian phylogenetic analysis of the five-gene data set was performed via MrBayes 3.1.2 (Ronquist and Huelsenbeck, 2003) using the Metropolis-coupled Markov chain Monte Carlo method under the optimal model for each gene partition selected by ModelGenerator, by running four chains with 2,000,000 generations. At every 100th generation trees were sampled, and the first 1000 trees sampled prior to the likelihoods converging to stable values were discarded as burn-ins. A 50% majority consensus tree was computed with the remaining Bayesian trees, and significantly supported nodes were defined to exhibit a Bayesian posterior probability (BPP) ≥ 0.95.
A chronogram for the combined five-gene data set was obtained based on the consensus tree topology across the converged Bayesian posterior computed by MrBayes 3.1.2. S. Pombe and Z. hellenicus were removed from the consensus tree, leaving a tree with a basal trichotomy. This species phylogeny was calibrated by constraining the new basal split to a minimum age of 160 Myr and a maximum age of 180 Myr (cf. Miranda et al., 2006). Divergence times were estimated by penalized likelihood with a truncated Newton algorithm in r8s version 1.71 (Sanderson, 2006), setting the r8s smoothing parameter to 4.1, a value obtained by following the r8s program manual instructions (available at http://loco.biosci.arizona.edu/r8s/).
Rates of substitution for each individual site in the five-gene data set were independently estimated based on each of the 14 alternative models in Figure 1 by submitting the sequence alignment with the obtained chronogram to PhyDesign (López-Giráldez and Townsend, 2011), to execute ML estimation of nucleotide substitution rates via HyPhy (Pond et al., 2005). ModelGenerator v0.85 was executed to supply the values of relative rate and frequency parameters for each of the five markers based on each of the models. The node corresponding to the haploid Candida clade and 19 other nodes featuring a relatively short, deep internode in the chronogram were selected to be assayed for signal and noise analysis, and the internode length to and subtending branch length T of each of the 20 assayed nodes were abstracted from the chronogram.
For each assayed node, four representative taxa were selected so that each internode corresponded to a four-taxon problem in which the lengths of the four subtending branches of the internode were as close to one another as possible. In cases where the four subtending branches of a given node had unequal lengths, T was approximated as the length of the shortest of the four subtending branches. This approximation was justified based on the observation that in all of the assayed nodes, the subtending branches were all similar in length and significantly longer than the internode. Using the estimated site substitution rates for the five gene sequence alignments based on the 14 models and the length measures of the 20 assayed nodes, the probabilities of each of the five markers providing incorrect, polytomous, and correct resolution of each of the 20 nodes based on the 14 alternative models were calculated via the analytical method for signal and noise analysis (via Equations 7–10 per nucleotide site and Equations 11–13 of Townsend et al., 2012 per data set). These calculations were implemented via Wolfram Mathematica 7 (Wolfram Research, Inc.). The Wolfram Mathematica 7 implementation of the signal and noise analysis calculations is available for download with instructions from the PhyDesign website (López-Giráldez and Townsend, 2011; http://phydesign.townsend.yale.edu/).
Results
The best-fit models selected by AIC were TVM + Γ for COX2; GTR + I + Γ for RPB1, RPB2, and ACT1; and GTR + Γ for D1/D2 LSU. In the computed consensus tree (Figure 3), the backbone node corresponding to the haploid Candida clade was poorly supported (BPP = 0.72). Of the other 19 assayed nodes, all except one (BPP = 0.57) were significantly supported (Data Sheet 3). Subtending branch lengths (Data Sheet 4) were extracted from the obtained chronogram based on the consensus tree (Data Sheet 3).
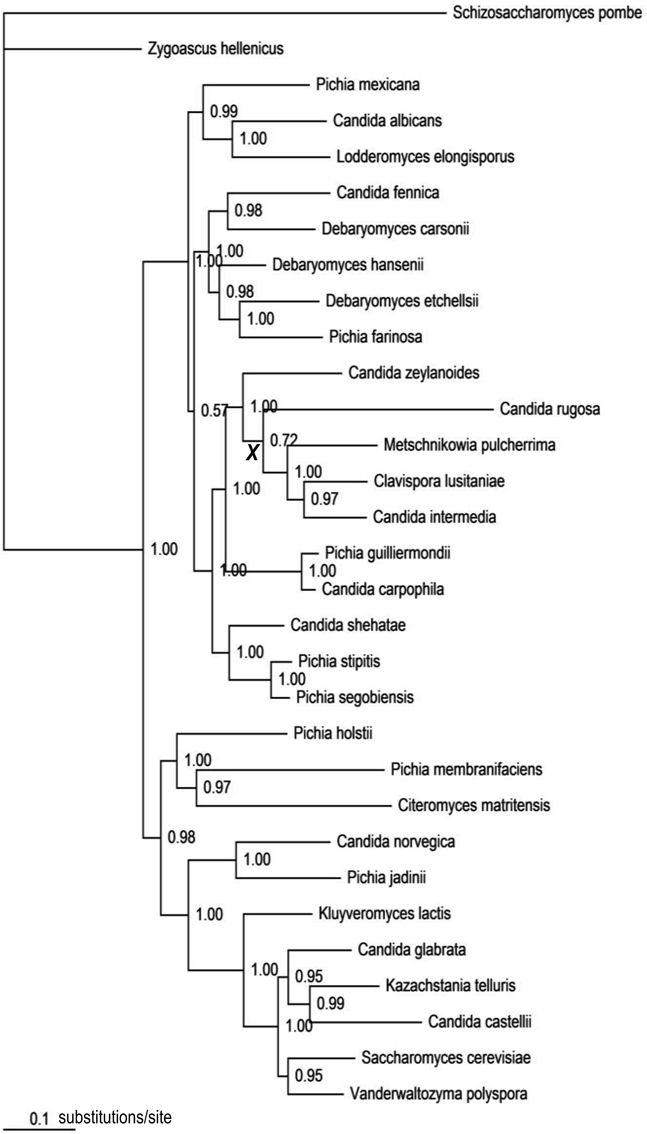
Figure 3. The consensus tree topology obtained from the Bayesian analysis of the combined five-gene data set. Numbers at nodes represent Bayesian posterior probabilities. The internode marked with a bold, italic “X” corresponds to the poorly resolved backbone node of the haploid Candida clade (BPP = 0.72).
To prioritize different markers for resolving a given node, it is necessary to compare their probabilities of incorrect resolution, polytomy, and correct resolution simultaneously to make the optimal marker selection based on the specific experimental design goal at hand. Here we assumed that the GTR model predicts the correct ranking of the five markers' powers for resolving a given node, because the best-fit model selected by AIC was the GTR model for four of the five markers, and the TVM model selected for COX2 is highly similar to the GTR model in terms of parameterization complexity. Based on the GTR model, the probabilities of correct resolution, polytomy, and incorrect resolution were similar across the five markers for the backbone node corresponding to the haploid Candida clade; among the five markers, RPB2, which had the highest probability of correct resolution and the lowest probability of incorrect resolution for the node (Figure 4), was the optimal marker.
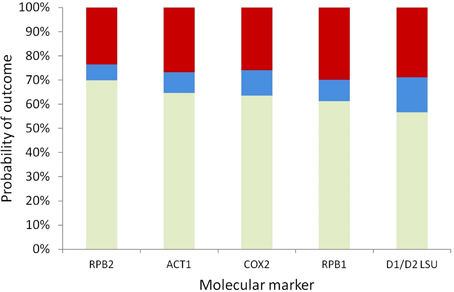
Figure 4. Stacked probabilities of correct resolution (bottom, light green), polytomy (middle, blue), and incorrect resolution (top, dark red) of the backbone node of the haploid Candida clade based on the GTR model, for five markers.
To efficiently report the results for all of the 20 assayed nodes, comparisons of only the probabilities of correct resolution were presented, because the probabilities of incorrect resolution were similar across the five markers for any given node (e.g., Figure 4). Within every assayed marker, signal and noise analysis based on the 14 alternative models predicted highly consistent probabilities of the marker correctly resolving the haploid Candida clade, albeit with several modest deviations (Figure 5). For RPB1, RPB2, ACT1, and D1/D2 LSU, the JC and F81 models predicted higher probabilities of correct nodal resolution than those predicted when analyzed with the other 12 models. For COX2, the probabilities of correct nodal resolution predicted by the JC, K2P, and TrNef models were considerably higher than those by the other eleven models (Figure 5). Exactly the same overall trends and deviations were observed from signal and noise analysis of the other 19 nodes, regardless of whether the node was significantly supported or not.
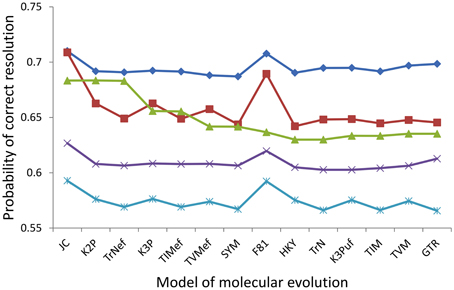
Figure 5. Probabilities of correct resolution for the backbone node of the haploid Candida clade for RPB2 (diamond), ACT1 (square), COX2 (triangle), RPB1 (cross), and D1/D2 LSU (star) calculated for each of the the 14 alternative models.
For all of the 20 assayed nodes, the GTR model ranked the five markers in the same order of RPB2 (highest probability of correct resolution), ACT1, COX2, RPB1, and D1/D2 LSU (lowest). For every single assayed node (e.g., Figure 5), half or more of the 14 models predicted the correct ranking of the five markers and at least 10 models predicted the correct optimal marker, RPB2. Moreover, only the JC, F81, K2P, and TrNef models ever failed to predict the correct optimal marker to resolve one of the assayed nodes, while the other ten more complex models never failed to predict the optimal marker for any of the 20 assayed nodes.
By comparing the parameter values of the 14 models estimated for the five markers (Data Sheet 5), we observed that within each marker, there was an exact match between the models whose predicted probabilities of correct nodal resolution were inconsistent with those by the other models and the models whose estimated rate or frequency parameter values deviated significantly from those of the other models. In RPB1, RPB2, ACT1, and D1/D2 LSU, a shared salient feature of the underlying evolutionary processes is that transitions happened much faster than transversions. In particular, the transition between T and C occurred at the fastest rate among all substitutions. For example, based on GTR, the optimal model for these four markers, rTC/rTG was 9.1 for ACT1, 4.9 for RPB1, 4.5 for RPB2, and 3.2 for D1/D2 LSU (Data Sheet 5). Because the JC and F81 models restrict all substitutions to occur at the same rate, these two models failed to account for the high transition/transversion bias that the other models accounted for with regard to these four markers. In COX2, the sole mitochondrial gene analyzed, the distinct characteristic of the underlying evolutionary process was that the equilibrium frequencies of T and A were much higher than those of C and G. For example, in the best-fit TVM model for COX2, πT = 0.34, πC = 0.16, πA = 0.32, and πG = 0.18 (Data Sheet 5). The JC, K2P, and TrNef models, which constrain base frequencies to equality, failed to account for the much higher T and A frequencies in COX2. Meanwhile, the K3P, TIMef, TVM, and SYM models, which also assume equal base frequencies, fit the COX2 marker increasingly better by allowing a progressively higher value of rTA to compensate these models' inability to account for the higher frequencies of T and A. In contrast, because the JC, K2P, and TrNef models are further restricted to assume equal transversion rates, the three models could not compensate for their poor fit to the high T and A frequencies by raising the transversion rate between T and A.
Discussion
We have extended the Townsend et al. (2012) phylogenetic signal and noise analysis by incorporating all time-reversible Markov models of nucleotide substitution into the prediction of the power of a data set for resolving a quartet-taxon phylogeny. By implementing diverse models of molecular evolution, we have enhanced the precision of signal and noise analysis. If an optimal model for a given data set can be established with confidence, the probability distribution of signal, noise, and polytomy for a node of phylogenetic interest that can be achieved from the data set can now be calculated using the most realistic estimates of the optimal model parameters for the data set. It has been shown by an empirical study of a previous method of phylogenetic informativeness based on a Poisson model that, for real and simulated data, predictions from the method correlate with tree distances between true and estimated trees and with bootstrap probabilities (López-Giráldez et al., 2013). Given this study's finding that better-fit (typically more complex) models yield more accurate predictions of which loci are most informative, the generalization to more complex models developed herein is thus expected to further enhance performance. Additionally, signal and noise analysis based on even the most complex time-reversible model of nucleotide substitution, the GTR model, can be implemented almost as easily and rapidly as analysis based on the simplest models. The generalized signal and noise analysis thus yields a highly convenient tool of model-based phylogenetic informativeness analysis.
Our results suggest that there are not major discrepancies between predictions by signal and noise analysis based on different models. In the example study of representative Candida species and allied members using COX2, RPB1, RPB2, ACT1, and D1/D2 LSU, we found that the prediction of the five markers' probabilities of correct resolution for 20 assayed nodes was fairly robust to 14 alternative models commonly used in model-based phylogenetic studies. However, the results did suggest that deviations in relative predicted probabilities of correct nodal resolution could result from assuming the simplest models that poorly capture the underlying evolutionary process—in particular, transition/transversion bias and base frequency composition. If there are particularly high- or low-magnitude variables in the underlying evolutionary process, the lowest-parameterized models, namely the JC, F81, K2P, and TrNef models, tend to fit the data set poorly because these models' restricted settings are often unable to account for heterogeneity of rates in the Q matrix or for heterogeneity of base composition. Consequently, signal and noise analysis applied with these precariously simple models tends to predict a ranking that can deviate moderately from the correct ranking of the utility of the assayed markers. Overall, if there are grounds for supporting one model over another for a gene, due to the result of a model selection test on preliminary data or on a sister clade, it is advisable to eliminate overly simple models that are unlikely to reflect the evolutionary process for the data to be gathered. Nevertheless, our results suggested that predictions of signal and noise analysis are highly robust across models that incorporate transition/transversion bias and heterogeneity of base composition. Robustness to most models exhibited by the generalized signal and noise analysis is reassuring in that it would be challenging to confidently assert a model for data that has yet to be gathered, although preliminary data, data from the closest genome-sequenced species, or data from sister clades can help to do so.
Considering the importance of model selection to phylogenetic inference (e.g., Sullivan and Swofford, 1997; Kelsey et al., 1999; Ripplinger and Sullivan, 2010), it is instructive to speculate regarding this perhaps surprisingly modest impact of evolutionary models on predictions of signal and noise analysis. In phylogenetic inference problems, it is frequently crucial to select the optimal—frequently the most complex—molecular evolutionary models, because the state identities at ancestral nodes are highly constrained by the state identities at the tips of divergent lineages; thus inference of topology at ancestral nodes is sensitive to which evolutionary model is assumed (Sullivan and Joyce, 2005). In contrast, phylogenetic informativeness analysis provides predictions of the utility of data that has not yet been gathered, and operates without constraint by the unknown state identities at the tips of divergent lineages. Phylogenetic informativeness depends instead on how likely synapomorphic and homoplasious site patterns may arise and maintain along the tree branches.
Thus, the substitution rate of a character is the most important factor predicting the likelihood of synapomorphy and homoplasy (e.g., Swofford et al., 1996; Goldman, 1998; Yang, 1998; Shpak and Churchill, 2000; Bininda-Emonds et al., 2001; Sanderson and Shaffer, 2002; Lin and Danforth, 2004; Danforth et al., 2005; Mueller, 2006; Townsend, 2007; Jian et al., 2008; Regier et al., 2008). The model only has a significant impact on informativeness in cases where extreme actual values of model parameters lead to inaccurate estimation of average rate when analyzed under a simpler model. The substitution rate of a character given by Equation 2 is a weighted average of the frequency and rate parameters in a molecular evolutionary model. In other words, among the more complex models, differences in signal and noise estimation are unlikely to arise because the effect of some parameters assuming higher values is very likely countered by the effect of other parameters assuming lower values. Therefore, although specifying different evolutionary models will lead to differences in the individual parameter values, the average rate of substitution is not expected to drastically differ for most character sets with realistic parameter values. Consequently, predictions based on phylogenetic signal and noise analysis, which are chiefly dependent on the rate of evolution, do not tend to experience significant changes when selecting among the diversity of more complex evolutionary models.
We may gain a further intuitive understanding of the impact of model selection on phylogenetic informativeness analysis by examining how more complex evolutionary models modify the space of character states. In Townsend et al. (2012), the probability functions of support for the correct subtree and incorrect subtrees per site were based on character state spaces consisting of exactly s character states under the Poisson model of molecular evolution, where s ≥ 2 (c.f. Equations 4–7 in Townsend et al., 2012). Signal and noise probability modeling based on different numbers of character states leads to different probability functions (c.f. Figure 2 in Townsend et al., 2012). Plotting the ratio of the probability of support for the correct subtree to support for an incorrect subtree demonstrates that larger character state spaces have a higher ratio of support for the correct subtree to an incorrect subtree (Figure 6). This analysis demonstrates that a nontrivial increase of the character state space leads to a higher prediction of the power of a given data set for resolving the node of interest.
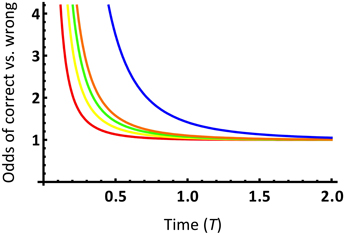
Figure 6. Ratio of the probability of support for the correct topology to the probability of support for either incorrect topology over time T, for a site with a substitution rate λ = 1 and an internode length t0 = 0.1, from Equations 4 and 5 in Townsend et al. (2012). The probability ratio curves are depicted for state spaces of 2, 3, 4, 5, and 20 states, respectively, from bottom to top.
How, then, does specifying more complex molecular evolution models relate to the character state space? Consider how the “effective” character state space changes when the K2P model replaces the JC model to describe the same data. In the JC model, the four nucleotide states occur at equal frequencies and convert to each other at identical rates. The character state space thus consists of exactly four states that have equal scope to impact to the evolutionary process. Now, for the K2P model, consider an extreme case where transitions occur at a fast or ordinary rate, while transversions occur at a negligible rate. With negligible transversions, a purine cannot convert to a pyrimidine and vice versa. Only transitions between purines or between pyrimidines can occur. Effectively, this character state space under the extreme K2P model consists of two dominating separate subspaces of A and G and of C and T. Because no intrinsic factors distinguish these two subspaces, the character state space for the K2P model is effectively reduced to two by this extreme parameterization. Generally, for more realistic transversion rates, the effect of introducing the K2P model will not be as severe as in the extreme case considered. But in all nondegenerate parameterizations, the effect of using the K2P model instead of the JC model for the same data set remains a slight decrease of the effective character state space.
This extreme example illustrates the general effect of specifying more complex Markov models on the effective character state space. Given any fixed data set, extreme parameter values are more possible in models with more parameters. As a result, those character states that are involved in substitutions occurring as a consequence of particularly high model parameters will begin to form subspaces that dominate the character state space for each character. Other character states undergoing substitutions with low model parameters, representing shifts away from one dominant, high-rate-change character state subspace to another, will still occur, but their overall frequencies will be lower. As a result, when the molecular evolutionary model grows in complexity, certain character state subspaces, by virtue of their association with higher model parameter values, will dominate the evolution of the character and thus effectively reduce the character state space in the short term. In most realistic data sets, there is always a degree of heterogeneity in model parameter values when described by an optimal model. Therefore, specifying the simplest models, such as the JC, K2P, and F81 models, can fail to sufficiently account for the heterogeneity in the evolutionary process and thus lead to a nontrivial increase of the effective character state space. In these cases, it is necessary to assume a model of sufficient complexity to account for the heterogeneity in model parameters, to decrease the effective character state space to its actual size, and to thereby accurately predict the utility of the site for phylogenetic inference. Thus, specifying increasingly more complex evolutionary models is predicted to lead to decreasingly small impacts on the predictions of signal and noise analysis.
This prediction was verified by empirical observations from the Candida species study. In RPB1, RPB2, ACT1, and D1/D2 LSU, both the JC and F81 models were inadequate to account for the high transition/transversion bias in the underlying evolutionary processes and thus caused a nontrivial and inaccurate increase of the “effective” character state space. As a result, probabilities of correct nodal resolution predicted by the two models were consistently higher than those by the other 12 more complex models that could account for the transition/transversion bias. In the case of COX2, significant heterogeneity in base equilibrium frequencies meant that specifying the JC, K2P, and TrNef models, which all assume equal frequencies, also led to a nontrivial and inaccurate increase of the “effective” character state space, thus consistently leading to higher predictions of probabilities of correct nodal resolution. Although the K3P, TIM, TVM, and SYM models also assume equal base frequencies, these more parameterized models were able to progressively compensate for this inaccuracy in terms of the effective character state space, giving way to estimates of an higher transversion rate between T and A, thereby achieving an effective state space closer to the actual size. Correspondingly, these four models predicted probabilities of correct nodal resolution that were relatively more consistent with probabilities predicted by models of unequal base frequencies. In all five markers, probabilities of correct nodal resolution predicted by the ten models more complex than the JC, F81, K2P, and TrNef models were highly consistent.
Our results suggest that sequence evolving in accordance with simpler models at informative rates will tend to exhibit a slightly higher probability of correct resolution than sequence evolving in accordance with more complex models. However, it does not mean that simply applying simpler models to inference analysis will yield greater actual phylogenetic utility. Simpler models can often predict a higher probability of correct resolution because simpler models tend to average out heterogeneity of rate (by mutation class, or by site). Therefore, if the loci are evolving at rates that are at least moderately appropriate for the problem at hand, using a simple model tends to push the inferred rates closer to the average, (coincidentally) ideal rate, and increase predicted informativeness. However, when a more complex model would be a better fit, this increase is, of course, unrealizable in practice; or to the extent that it is realizable, it will be inaccurate or convey inappropriately high support.
Lastly, the signal and noise analysis of representative Candida species and allied members offers several insights for resolving the haploid Candida clade. Due to extremely reduced single-cellular morphology and highly divergent and adaptive ecology, yeasts have been a problematic group that relies on molecular data for understanding their evolutionary histories, which are critical in contending with many yeast pathogens. Because of their medical and industrial importance and generally small genome size, many Candida species have been sequenced for genome data (e.g., Butler et al., 2009). However, more data would not necessarily guarantee a fully resolved phylogeny for these yeast species, as demonstrated in Butler et al. (2009). Furthermore, there are more than 350 Candida species in the Saccharomycetales (Kirk et al., 2008), and it will remain some time before genome data can be gathered for most of them. It should be noted that as regards to our chronogram, lacking a fossil record, the estimation of absolute divergence times for yeast species is difficult (Taylor and Berbee, 2006). Most diversification events sampled in this study are likely earlier than the splits among Saccharomyes species that are thought to have evolved about 20 million years ago with a level of nucleotide divergence similar to that found between birds and human (Dujon, 2006). However, an accurate time scale is irrelevant to the conclusions obtained here, all of which can be exactly replicated on a purely relative time scale (e.g., Moeller and Townsend, 2011). Other sources of heterogeneity include the long evolutionary history potentially accompanied with inconsistent substitution rates of different gene sets that could be associated with unique ecological shifts such as association with hosts (Kurtzman and Robnett, 2003; Scannell et al., 2011). The emergence and maintenance of haploid lineages via what appears to be long-term asexual reproduction in some Candida species is associated with shifting rates of evolution (Ben-Ari et al., 2005; Webster and Hurst, 2012), contributing additional complexity to the solution of the yeast phylogeny. Results of signal and noise analysis on the five assayed markers under alternative models disclosed some issues behind the unresolved phylogeny of the haploid Candida clade and pointed out an efficient approach toward future phylogenetic experimental design on this group of fungi. We demonstrated that signal and noise analysis ranked the five assayed markers in the order of RPB2 (most informative), ACT1, COX2, RPB1, and D1/D2 LSU (least informative) for resolving the evolution events at the time when the haploid clade split from the diploid pathogens. The current five-gene data did not provide enough information to resolve the relationship between the haploid clade and its sibling pathogens. The haploid Candida clade might thus be best resolved by focusing on data collection for the more informative markers such as RPB2. In the future, it could be especially worthwhile to apply signal and noise analysis across numerous loci obtained from diverse genome sequences to identify markers even more informative than RPB2 for the historic epoch in question, and to resolve the haploid Candida clade.
Conflict of Interest Statement
The authors declare that the research was conducted in the absence of any commercial or financial relationships that could be construed as a potential conflict of interest.
Acknowledgments
We sincerely thank Dylan Greaves for helpful discussion of the topic.
Supplementary Material
The Supplementary Material for this article can be found online at: http://www.frontiersin.org/journal/10.3389/fevo.2014.00011/abstract
References
Abdo, Z., Minin, V. N., Joyce, P., and Sullivan, J. (2004). Accounting for uncertainty in the tree topology has little effect on the decision-theoretic approach to model selection in phylogeny estimation. Mol. Biol. Evol. 22, 691–703. doi: 10.1093/molbev/msi050
Akaike, H. (1973). “Information theory as an extension of the maximum likelihood principle,” in Proceedings of the Second International Symposium on Information Theory (Budapest: Akademiai Kiado), 267–281.
Baird, N. A., Etter, P. D., Atwood, T. S., Currey, M. C., Shiver, A. L., Lewis, Z. A., et al. (2008). Rapid SNP discovery and genetic mapping using sequenced RAD markers. PLoS ONE 3:e3376. doi: 10.1371/journal.pone.0003376
Ben-Ari, G., Zenvirth, D., Sherman, A., Simchen, G., Lavi, U., and Hillel, J. (2005). Application of SNPs for assessing biodiversity and phylogeny among yeast strains. Heredity 95, 493–501. doi: 10.1038/sj.hdy.6800759
Bininda-Emonds, O. R. P., Brady, S. G., Kim, J., and Sanderson, M. J. (2001). Scaling of accuracy in extremely large phylogenetic trees. Pac. Symp. Biocomput. 6, 547–558. doi: 10.1142/9789814447362_0053
Bruno, W. J., and Halpern, A. L. (1999). Topological bias and inconsistency of maximum likelihood using wrong models. Mol. Biol. Evol. 16, 564–566. doi: 10.1093/oxfordjournals.molbev.a026137
Butler, G., Rasmussen, M. D., Lin, M. F., Santos, M. A., Sakthikumar, S., Munro, C. A., et al. (2009). Evolution of pathogenicity and sexual reproduction in eight Candiada genomes. Nature 459, 657–662. doi: 10.1038/nature08064
Crawley, S. S., and Hilu, K. W. (2012). Caryophyllales: evaluating phylogenetic signal in trnK intron versus matK. J. Syst. Evol. 50, 387–410. doi: 10.1111/j.1759-6831.2012.00197.x
Danforth, B. N., Lin, C.-P., and Fang, J. (2005). How do insect nuclear ribosomal genes compare to protein-coding genes in phylogenetic utility and nucleotide substitution patterns? Syst. Entomol. 30, 549–562. doi: 10.1111/j.1365-3113.2005.00305.x
Diezmann, S., Cox, C. J., Schonlian, G., Vilgalys, R. J., and Mitchell, T. G. (2004). Phylogeny and evolution of medical species of Candida and related taxa: a multigenic analysis. J. Clin. Microbiol. 42, 5624–5635. doi: 10.1128/JCM.42.12.5624-5635.2004
Dujon, B. (2006). Yeasts illustrate the molecular mechanisms of eukaryotic genome evolution. Trends. Genet. 22, 375–387. doi: 10.1016/j.tig.2006.05.007
Felsenstein, J. (1978). Cases in which parsimony or compatibility methods will be positively misleading. Syst. Zool. 27, 401–410. doi: 10.2307/2412923
Felsenstein, J. (1981). Evolutionary tree from DNA sequences: a maximum likelihood approach. J. Mol. Evol. 17, 368–376. doi: 10.1007/BF01734359
Felsenstein, J. (1993). PHYLIP (Phylogeny Inference Package). Seattle: Department of Genetics, University of Washington.
Felsenstein, J., and Churchill, G. A. (1996). A hidden Markov model approach to variation among sites in rate of evolution. Mol. Biol. Evol. 13, 93–104. doi: 10.1093/oxfordjournals.molbev.a025575
Fong, J. J., and Fujita, M. K. (2011). Evaluating phylogenetic informativeness and data-type usage for new protein-coding genes across Vertebrata. Mol. Phylogenet. Evol. 61, 300–307. doi: 10.1016/j.ympev.2011.06.016
Frati, F., Simon, C., Sullivan, J., and Swofford, D. L. (1997). Evolution of the mitochondrial cytochrome oxidase II gene in Collembola. J. Mol. Evol. 44, 145–158. doi: 10.1007/PL00006131
Gaut, B. S., and Lewis, P. O. (1995). Success of maximum likelihood phylogeny inference in the four taxon case. Mol. Biol. Evol. 12, 152–162. doi: 10.1093/oxfordjournals.molbev.a040183
Goldman, N. (1998). Phylogenetic information and experimental design in molecular systematics. Proc. Biol. Sci. 265, 1779–1786. doi: 10.1098/rspb.1998.0502
Granados Mendoza, C., Wanke, S., Salomo, K., Goetghebeur, P., and Samain, M. S. (2013). Application of the phylogenetic informativeness method to chloroplast markers: a test case of closely related species in tribe Hydrangeeae (Hydrangeaceae). Mol. Phylogenet. Evol. 66, 233–242. doi: 10.1016/j.ympev.2012.09.029
Graybeal, A. (1994). Evaluating the phylogenetic utility of genes: a search for genes informative about deep divergences among vertebrates. Syst. Biol. 43, 174–193.
Hasegawa, M., Kishino, K., and Yano, T. (1985). Dating the human-ape splitting by a molecular clock of mitochondrial DNA. J. Mol. Evol. 22, 160–174. doi: 10.1007/BF02101694
Horreo, J. L. (2012). “Representative Genes”, is it OK to use a small amount of data to obtain a phylogeny that is at least close to the true tree? J. Evol. Biol. 25, 2661–2664. doi: 10.1111/j.1420-9101.2012.02622.x
Huelsenbeck, J. P., and Hillis, D. M. (1993). Success of phylogenetic methods in the four-taxon case. Syst. Biol. 42, 247–264.
Jian, S., Soltis, P. S., Gitzendanner, M. A., Moore, M. J., Li, R., Hendry, T. A., et al. (2008). Resolving an ancient, rapid radiation in Saxifragales. Syst. Biol. 57, 38–57. doi: 10.1080/10635150801888871
Jukes, T. H., and Cantor, C. R. (1969). “Evolution of protein molecules,” in Mammalian Protein Metabolism, ed H. M. Munro (NewYork, NY: Academic Press), 21–132. doi: 10.1016/B978-1-4832-3211-9.50009-7
Keane, T. M., Creevey, C. J., Pentony, M. M., Naughton, T. J., and McInerney, J. O. (2006). Assessment of methods for amino acid matrix selection and their use on empirical data shows that ad hoc assumptions for choice of matrix are not justified. BMC Evol. Biol. 6:29. doi: 10.1186/1471-2148-6-29
Kelsey, C. R., Crandall, K. A., and Voevodin, A. F. (1999). Different models, different trees: the geographic origin of PTLV-I. Mol. Phylogenet. Evol. 13, 336–347. doi: 10.1006/mpev.1999.0663
Kimura, M. (1980). A simple method for estimating evolutionary rate of base substitutions through comparative studies of nucleotide sequences. J. Mol. Evol. 16, 111–120. doi: 10.1007/BF01731581
Kimura, M. (1981). Estimation of evolutionary distances between homologous nucleotide sequences. Proc. Natl. Acad. Sci. U.S.A. 78, 454–458. doi: 10.1073/pnas.78.1.454
Kirk, P. M., Cannon, P. F., Minter, D. W., and Stalpers, J. A. (2008). Dictionary of the Fungi, 10th Edn. Wallingford: CABI.
Kishino, H, and Hasegawa, M. (1989). Evaluation of the maximum likelihood estimate of the evolutionary tree topologies from DNA sequence data, and the branching order in hominoidea. J. Mol. Evol. 29, 170–179. doi: 10.1007/BF02100115
Kurtzman, C. P, and Fell, J. W. (1998). “Definition, classification and nomenclature of the yeasts,” in The Yeasts, A Taxonomic Study, 4th Edn. eds C. P. Kurtzman and J. W. Fell (Amsterdam: Elsevier Science B.V), 3–5. doi: 10.1016/B978-044481312-1/50004-6
Kurtzman, C. P., and Robnett, C. J. (2003). Phylogenetic relationships among yeasts of the “Saccharomyces complex” determined from multigene sequence analyses. FEMS Yeast Res. 3, 417–432. doi: 10.1016/S1567-1356(03)00012-6
Lemmon, A. R., Emme, S. A., and Lemmon, E. M. (2012). Anchored hybrid enrichment for massively high-throughput phylogenomics. Syst. Biol. 61, 727–744. doi: 10.1093/sysbio/sys049
Lemmon, A. R., and Moriarty, E. C. (2004). The importance of proper model assumptions in Bayesian phylogenetics. Syst. Biol. 53, 265–277. doi: 10.1080/10635150490423520
Lin, C.-P., and Danforth, B. N. (2004). How do insect nuclear and mitochondrial gene substitution patterns differ? Insights from Bayesian analyses of combined data sets. Mol. Phylogenet. Evol. 30, 686–702. doi: 10.1016/S1055-7903(03)00241-0
Liu, K., Raghavan, S., Nelesen, S., Linder, C. R., and Warnow, T. (2009). Rapid and accurate large-scale coestimation of sequence alignments and phylogenetic trees. Science 324, 1561–1564. doi: 10.1126/science.1171243
López-Giráldez F., Moeller, A. H., and Townsend, J. P. (2013). Evaluating phylogenetic informativeness as a predictor of phylogenetic signal for metazoan, fungal, and mammalian phylogenomic data sets. Biomed. Res. Int. 2013:621604. doi: 10.1155/2013/621604
López-Giráldez, F., and Townsend, J. P. (2011). PhyDesign: an online application for profiling phylogenetic informativeness. BMC Evol. Biol. 11:152. doi: 10.1186/1471-2148-11-152
Minin, V., Abdo, Z., Joyce, P., and Sullivan, J. (2003). Performance-based selection of likelihood models for phylogeny estimation. Syst. Biol. 52, 1–10. doi: 10.1080/10635150390235494
Miranda, I., Silva, R., and Santos, M. A. (2006). Evolution of the genetic code in yeasts. Yeast 23, 203–213. doi: 10.1002/yea.1350
Moeller, A. H., and Townsend, J. P. (2011). Phylogenetic informativeness profiling of 12 genes for 28 vertebrate taxa without divergence dates. Mol. Phylogenet. Evol. 60, 271–272. doi: 10.1016/j.ympev.2011.04.023
Mueller, R. L. (2006). Evolutionary rates, divergence dates, and the performance of mitochondrial genes in Bayesian phylogenetic analysis. Syst. Biol. 55, 289–300. doi: 10.1080/10635150500541672
Naylor, G. J. P., and Brown, W. M. (1998). Amphioxus mitochondrial DNA, chordate phylogeny, and the limits of inference based on comparisons of sequences. Syst. Biol. 47, 61–76. doi: 10.1080/106351598261030
Penny, D., Lockhart, P. J., Steel, M. A., and Hendy, M. D. (1994). “The role of models in reconstructing evolutionary trees,” in Models in Phylogenetic Reconstruction, eds R. W. Scotland, D. J. Siebert, and D. M. Williams (Oxford, England: Clarendon Press), 211–230
Pond, S. L. K., Frost, S. D. W., and Muse, S. V. (2005). Hyphy: hypothesis testing using phylogenies. Bioinformatics 21, 676–679. doi: 10.1093/bioinformatics/bti079
Posada, D., and Crandall, K. A. (1998). Modeltest: testing the model of DNA substitution. Bioinformatics 14, 817–818. doi: 10.1093/bioinformatics/14.9.817
Posada, D., and Crandall, K. A. (2001). Simple (wrong) models for complex trees: empirical bias. Mol. Biol. Evol. 18, 271–275. doi: 10.1093/oxfordjournals.molbev.a003802
Rannala, B. (2002). Identifiability of parameters in MCMC Bayesian inference of phylogeny. Syst. Biol. 51, 754–760. doi: 10.1080/10635150290102429
Regier, J. C., Shultz, J. W., Ganley, A. R. D., Hussey, A., Shi, D., Ball, B., et al. (2008). Resolving arthropod phylogeny: exploring phylogenetic signal within 41 kb of protein-coding nuclear gene sequence. Syst. Biol. 57, 920–938. doi: 10.1080/10635150802570791
Ripplinger, J., and Sullivan, J. (2008). Does choice in model selection affect maximum likelihood analysis? Syst. Biol. 57, 76–85. doi: 10.1080/10635150801898920
Ripplinger, J., and Sullivan, J. (2010). Assessment of substitution model adequacy using frequentist and Bayesian methods. Mol. Biol. Evol. 27, 2790–2803. doi: 10.1093/molbev/msq168
Rodriguez, F., Oliver, J. F., Marin, A., and Medina, J. R. (1990). The general stochastic model of nucleotide substitution. J. Theor. Biol. 142, 485–501. doi: 10.1016/S0022-5193(05)80104-3
Rokas, A., and Holland, P. W. (2000). Rare genomic changes as a tool for phylogenetics. Trends Ecol. Evol. 15, 454–459. doi: 10.1016/S0169-5347(00)01967-4
Ronquist, F., and Huelsenbeck, J. P. (2003). MrBayes 3: Bayesian phylogenetic inference under mixed models. Bioinformatics 19, 1572–1574. doi: 10.1093/bioinformatics/btg180
Rzhetsky, A., and Sitnikova, T. (1996). When is it safe to use an oversimplified substitution model in tree-making? Mol. Biol. Evol. 13, 1255–1265. doi: 10.1093/oxfordjournals.molbev.a025691
Sanderson, M. (2006). Analysis of Rates (“r8s”) of Evolution. [Internet]. Available online at: http://loco.biosci.arizona.edu/r8s/
Sanderson, M. J., and Shaffer, H. B. (2002). Troubleshooting molecular phylogenetic analyses. Annu. Rev. Ecol. Evol. Syst. 33, 49–72. doi: 10.1146/annurev.ecolsys.33.010802.150509
Scannell, D. R., Zill, O. A., Rokas, A., Payen, C., Dunham, M. J., Eisen, M. B., et al. (2011). The awesome power of yeast evolutionary genetics: new genome sequences and strain resources for the Saccharomyces sensu stricto Genus. G3 (Bethesda) 1, 11–25. doi: 10.1534/g3.111.000273
Schwarz, G. (1978). Estimating the dimensions of a model. Ann. Stat. 6, 461–464. doi: 10.1214/aos/1176344136
Shpak, M., and Churchill, G. A. (2000). The information content of a character under a Markov model of evolution. Mol. Phylogenet. Evol. 17, 231–243. doi: 10.1006/mpev.2000.0846
Silva, D. N., Talhinhas, P., Várzea V., Cai, L., Paulo, O. S., and Batista, D. (2012). Application of the Apn2/MAT locus to improve the systematics of the Colletotrichum gloeosporioides complex: an example from coffee (Coffea spp.) hosts. Mycologia 104, 396–409. doi: 10.3852/11-145
Sullivan, J., and Joyce, P. (2005). Model selection in phylogenetics. Annu. Rev. Ecol. Evol. Syst. 36, 445–466. doi: 10.1146/annurev.ecolsys.36.102003.152633
Sullivan, J., Markert, J. A., and Kilpatrick, C. W. (1997). Phylogeography and molecular systematics of the Peromyscus aztecus species group (Rodentia: Muridae) inferred using parsimony and likelihood. Syst. Biol. 46, 426–440. doi: 10.1093/sysbio/46.3.426
Sullivan, J., and Swofford, D. L. (1997). Are guinea pigs rodents? The importance of adequate models in molecular phylogenies. J. Mamm. Evol. 4, 77–86. doi: 10.1023/A:1027314112438
Sullivan, J., and Swofford, D. L. (2001). Should we use model-based methods for phylogenetic inference when we know that assumptions about among-site rate variation and nucleotide substitution pattern are violated? Syst. Biol. 50, 723–729. doi: 10.1080/106351501753328848
Susko, E. (2011). Large sample approximations of probabilities of correct topological estimation and biases of maximum likelihood estimation. Statist. Appl. Gen. Mol. Biol. 10:10. doi: 10.2202/1544-6115.1626
Swofford, D. L., Olsen, G. L., Waddell, P. J., and Hillis, D. M. (1996). “Phylogenetic inference,” in Molecular Systematics, eds D. M. Hillis, C. Morowitz, and B. K. Mable (Sunderland, MA: Sinauer), 407–514.
Tamura, K., and Nei, M. (1993). Estimation of the number of nucleotide substitutions in the control region of mitochondrial DNA in humans and chimpanzees. Mol. Biol. Evol. 10, 512–526.
Tavaré, S. (1986). “Some probabilistic and statistical problems in the analysis of DNA sequences,” in Some Mathematical Questions in Biology: DNA Sequence Analysis (Lectures on Mathematics in the Life Sciences), ed R. M. Miura (NewYork, NY: American Mathematical Society). 57–86.
Taylor, J. W., and Berbee, M. L. (2006). Dating divergences in the Fungal Tree of Life: review and new analyses. Mycologia 98, 838–849. doi: 10.3852/mycologia.98.6.838
Tekle, Y. I., Grant, J. R., Kovner, A. M., Townsend, J. P., and Katz, L. A. (2010). Identification of new molecular markers for assembling the eukaryotic tree of life. Mol. Phylogenet. Evol. 55, 1177–1182. doi: 10.1016/j.ympev.2010.03.010
Townsend, J. P. (2007). Profiling phylogenetic informativeness. Syst. Biol. 56, 222–231. doi: 10.1080/10635150701311362
Townsend, J. P., and Leuenberger, C. (2011). Taxon sampling and the optimal rates of evolution for phylogenetic inference. Syst. Biol. 60, 358–365. doi: 10.1093/sysbio/syq097
Townsend, J. P., López-Giráldez, F., and Friedman, R. (2008). The phylogenetic informativeness of nucleotide and amino acid sequences for reconstructing the vertebrate tree. J. Mol. Evol. 67, 437–447. doi: 10.1007/s00239-008-9142-0
Townsend, J. P., Su, Z., and Tekle, Y. I. (2012). Phylogenetic signal and noise: predicting the power of a data set to resolve phylogeny. Syst. Biol. 61, 835–849. doi: 10.1093/sysbio/sys036
Tsui, C. K. M., Daniel, H. M., Robert, V., and Meyer, W. (2008). Re-examining the phylogeny of clinically relevant Candida species and allied genera based on multigene analyses. FEMS Yeast Res. 8, 651–659. doi: 10.1111/j.1567-1364.2007.00342.x
Walker, D. M., Castlebury, L. A., Rossman, A. Y., and White, J. F. (2012). New molecular markers for fungal phylogenetics: two genes for species-level systematics in the Sordariomycetes (Ascomycota). Mol. Phylogenet. Evol. 64, 500–512. doi: 10.1016/j.ympev.2012.05.005
Webster, M. T., and Hurst, L. D. (2012). Direct and indirect consequences of meiotic recombination: implications for genome evolution. Trends Genet. 28, 101–109. doi: 10.1016/j.tig.2011.11.002
Yang, Z. (1994). Estimating the pattern of nucleotide substitution. J. Mol. Evol. 39, 105–111. doi: 10.1007/BF00178256
Yang, Z. (1997). How often do wrong models produce better phylogenies? Mol. Biol. Evol. 14, 105–108. doi: 10.1093/oxfordjournals.molbev.a025695
Yang, Z. (1998). On the best evolutionary rate for phylogenetic analysis. Syst. Biol. 47, 125–133. doi: 10.1080/106351598261067
Keywords: model selection, signal, noise, phylogenetic informativeness, phylogenetic inference, maximum likelihood, Bayesian estimation
Citation: Su Z, Wang Z, López-Giráldez F and Townsend JP (2014) The impact of incorporating molecular evolutionary model into predictions of phylogenetic signal and noise. Front. Ecol. Evol. 2:11. doi: 10.3389/fevo.2014.00011
Received: 31 January 2014; Paper pending published: 01 March 2014;
Accepted: 27 March 2014; Published online: 16 April 2014.
Edited by:
Enrique P. Lessa, Universidad de la República, UruguayReviewed by:
Charles Bell, University of New Orleans, USAJames H. Degnan, University of New Mexico, USA
Copyright © 2014 Su, Wang, López-Giráldez and Townsend. This is an open-access article distributed under the terms of the Creative Commons Attribution License (CC BY). The use, distribution or reproduction in other forums is permitted, provided the original author(s) or licensor are credited and that the original publication in this journal is cited, in accordance with accepted academic practice. No use, distribution or reproduction is permitted which does not comply with these terms.
*Correspondence: Jeffrey P. Townsend, Department of Biostatistics, Yale School of Public Health, 135 College St. #222, New Haven, CT 06510, USA e-mail: jeffrey.townsend@yale.edu