 Hiroshi Tsugawa1,2*
 Erika Ohta2
 Yoshihiro Izumi2
 Atsushi Ogiwara3Daichi Yukihira3Takeshi Bamba2
 Eiichiro Fukusaki2
 Masanori Arita1,4
- 1Metabolome Informatics Research Team, Metabolomics Research Group, RIKEN Center for Sustainable Resource Science, Yokohama, Japan
- 2Department of Biotechnology, Graduate School of Engineering, Osaka University, Suita, Osaka, Japan
- 3Reifycs Inc., Tokyo, Japan
- 4National Institute of Genetics, Shizuoka, Japan
Based on theoretically calculated comprehensive lipid libraries, in lipidomics as many as 1000 multiple reaction monitoring (MRM) transitions can be monitored for each single run. On the other hand, lipid analysis from each MRM chromatogram requires tremendous manual efforts to identify and quantify lipid species. Isotopic peaks differing by up to a few atomic masses further complicate analysis. To accelerate the identification and quantification process we developed novel software, MRM-DIFF, for the differential analysis of large-scale MRM assays. It supports a correlation optimized warping (COW) algorithm to align MRM chromatograms and utilizes quality control (QC) sample datasets to automatically adjust the alignment parameters. Moreover, user-defined reference libraries that include the molecular formula, retention time, and MRM transition can be used to identify target lipids and to correct peak abundances by considering isotopic peaks. Here, we demonstrate the software pipeline and introduce key points for MRM-based lipidomics research to reduce the mis-identification and overestimation of lipid profiles. The MRM-DIFF program, example data set and the tutorials are downloadable at the “Standalone software” section of the PRIMe (Platform for RIKEN Metabolomics, http://prime.psc.riken.jp/) database website.
Introduction
Multiple reaction monitoring (MRM) during liquid chromatography coupled to a triple quadrupole mass spectrometer (LC/QqQ/MS) is one of the standard methods in lipidomics research (Shaner et al., 2009; Quehenberger et al., 2010). Its highly sensitive and selective performance allows for the reliable monitoring of lipid compounds of low abundance such as oxidized lipids when MRM transitions, i.e., precursor- and product ion pairs, are conditioned appropriately (Uchikata et al., 2012). The key to success in lipidomics are lipid databases such as LIPID MAPS (Fahy et al., 2007) and LipidBlast (Kind et al., 2013) that provide in silico MS/MS spectra (and thereby MRM transitions) of major lipid classes such as glycerolipids, phospholipids, and sphingolipids. Thus, large-scale MRM assays monitor 500–1000 “theoretical” transitions on high-end QqQ/MS platforms (Ikeda et al., 2008).
Compared to production scanning by LC quadrupole- time-of-flight or Orbitrap MS (Q-TOF or Q-Orbitrap), the drawback of such theoretical MRM assays is the uncertain reliability of compound identification (Kind et al., 2013; Perez-Riverol et al., 2013). This is largely due to the scan speed of QqQ/MS; it is not fast enough to monitor three or more fragment ions to determine their lipid class and acyl chain properties. The importance of diagnostic transitions has been emphasized in metabolomics (Stein and Heller, 2006; Tsugawa et al., 2013) and it also applies for lipidomics. For example, the notation of phosphatidyl choline (PC) 38:2 [M+H]+ can match more than 100 acyl chain combinations, at least in theory, and they are expected to elute almost simultaneously at the transition 814.6->184.1. Moreover, the exact retention times for these of lipid isomers are currently unavailable.
To solve this problem by informatics we presented a “pattern recognition” approach (Sugimoto et al., 2012) for MRM assays. We called it “differential analysis” for multiple chromatograms because reliable ions and their isotopic ions can be estimated by comparing multiple chromatograms. In addition, candidate annotations can be reduced by statistical analyses before confirming each peak by authentic standards (Sugimoto et al., 2009).
In exchange, to accurately perform MRM based lipidomics with the differential analysis approach, it necessitates the standardized management of all experimental processes from experimental design to data processing. From the experimental design, peak alignment parameters can be determined and signal intensity drifts adjusted. Based on information of isotopic ions, peak- identification can be corrected and quantification can be adjusted because isotopic peaks from abundant ions sometimes overlap with ions of minor lipids. To get around such processes for large datasets we developed a software program that facilitates the differential analysis of large-scale MRM-based lipidomics. Our Multiple Reaction Monitoring-based DIFFerential (MRM-DIFF) analysis software supports chromatographic alignment and compound identification with estimation of isotopic peaks. Here we introduce a systematic strategy to perform differential analysis by MRM-DIFF with pooled quality control (QC) datasets. The pooled QC data, a mixture of small aliquots from each sample, were originally used to correct MS intensity drifts across a given analytical batch (Dunn et al., 2011). We use them to select a suitable “reference” for chromatographic alignment and peak quantification and demonstrate the advantages of our strategy with 37 serum datasets with 189 MRM transitions each.
Results
Figure 1 is a summary of our data processing method. After LC conditioning, pooled QC samples are analyzed at each fifth sample injection (Figure 1A). Based on the “chromatographic centroid” concept (see Theory below), one QC dataset is automatically selected from among all raw data files to serve as the reference. All other chromatograms, including the QC datasets, are aligned to the selected reference chromatogram by correlation optimized warping (COW), a popular dynamic programming algorithm for non-linear chromatographic alignment (Figure 1B) (Nielsen et al., 1998; Tomasi et al., 2004). Then a user-defined library of the retention time, the MRM transition, and the molecular formula for compounds is imported to perform peak identification and isotopic estimation. The program also implements a peak detection algorithm and uses the abundance of detected peaks for multivariate analysis (Figure 1C). The QC data are also exploited in the peak detection process. Since the pooled QC data are expected to contain all detectable lipid compounds from all samples, missing peaks, i.e., existing but unidentified peaks in some biological samples, can be interpolated based on the peak widths and retention times of the QC peaks. The algorithmic detail is described in the Theory section. The graphic user interface assists the workflow and contributes to a better understanding of compound identification and peak quantification (Figure 1C). The abundances of isotopic peaks are resolved and signal intensity drifts are corrected with LOESS (Cleveland, 1979) and cubic spline before statistical analyses (Figure 1D).
Figure 1. Differential analysis strategy for large-scale MRM-based lipidomics. (A) Since this strategy utilizes pooled quality control (QC) datasets for data processing methods, pooled QCs are injected at every five biological samples. (B) After reference file selection based on chromatograms of pooled QC datasets, MRM chromatograms are adjusted to the MRM chromatogram reference file by correlation optimized warping based non-linear alignment. (C) The data processing results including compound identifications and isotopic peak estimations can be monitored in the MRM-DIFF program. The graphical user interface facilitates manual curation of the results as well as validation of identification accuracy. (D) In addition to principal component analysis, MRM-DIFF supports standardization methods including isotopic peak reduction and LOESS/cubic spline based normalization.
In our proof-of-concept analysis, MRM-DIFF successfully profiled 259 lipids and 677 unknown metabolites in human-, mouse-, and rat-serum using 189 MRM transitions (see Supplementary File 1 for all profiles). Details of the MRM transitions and retention times of our focused lipids are shown in Table 1. The time for data processing was less than 20 min (Intel Core i7-4700MQ CPU at 2.4 Gb and 8 Gb RAM with Windows 8.1). For a few un-annotated peaks, the identification results were manually curated through the graphical user interface (GUI) of the MRM-DIFF program. The lipid coverage for the PC and phosphatidylethanolamine (PE) species on LC/QqQ/MS exceeded previously reported results (Psychogios et al., 2011).
Table 1. Detailed MRM conditions and retention times of targeted lipids.
The advantage of our strategy is the extensive use of isotopic peaks to reduce mis-identification and over-quantification. For example, in the 796.6–184.1 MRM chromatogram (Figure 2) the isotopic ion M+2 of highly abundant O-alkyl PC 37:5e (MW 794.6) was monitored at 25.4 min. Likewise, the isotopic ion M+2 of O-alkenyl phosphatidylcholine PC 37:5p (MW794.6) existed at 26.1 min but the isotope contributed only 16% of the total abundance, leaving 84% for another unidentified isomer. Therefore, to distinguish the isomer- and isotopic-peaks objectively, the MRM transitions for all patterns of different degrees of unsaturation (a ladder of 2 m/z decrements) must be monitored. The 796.6–184.1 MRM chromatogram contained six isomeric peaks including two unannotated peaks (24.6 and 27.3 min) and one isotopic peak from MW 794.6 (25.4 min). In our serum dataset, 71 significant peaks were dismissed as pure isotopic peaks of higher abundances.
Figure 2. Identification and quantification results from isotopic peak estimations. This example demonstrates how the isotopic peaks affect compound identifications and quantifications. The 13.798 and 13.786% of the monoisotopic peak abundances of PC 37:5e and PC 37:5p are theoretically monitored at the M+2 MRM transition. As shown in the bottom-left figure, two detected peaks eluted at 25.4 and 26.1 min were derived from 100 and 16% of the respective monoisotopic ions. This result shows that the isotopic peaks should be estimated for compound identifications and quantifications.
The second advantage is the smart selection of a QC reference for COW-based chromatographic alignment. The accurate alignment of MRM chromatograms is necessary for accurate lipid quantification. For reverse-phase LC methods, two user-defined parameters in the COW algorithm, “segment size” and “warp slack,” can be set as the peak width (0.5 min in our study) and as “1 or 2,” respectively. This leaves the selection of the reference chromatogram as the only critical parameter in the algorithm (Figure 3). The reference chromatogram should be positioned at the center of all chromatograms to be aligned. Moreover, the higher the chromatographic similarity, the better is the alignment. Therefore, we created pooled QC datasets as the average of all biological samples and chose one representative QC datum whose chromatogram was closest to the midpoint of all chromatograms (chromatographic centroid). The automatic selection picked the suitable reference and corrected the retention time drifts efficiently in our demonstration. Our example data sets are downloadable at http://prime.psc.riken.jp/.
Figure 3. Alignment results from two different reference files. The upper figure shows raw chromatograms; the blue and gray lines describe pooled QCs and biological samples, respectively. As shown in the bottom figures, alignment accuracy is considerably affected by the selected reference file. The automatic reference selection method in combination with pooled QC datasets robustly picks the suitable reference file. This contributes to better-aligned results.
The third advantage of our strategy is the use of LOESS and cubic spline normalization to reduce MS signal drifts in an analytical batch (Dunn et al., 2011). The LOESS smoother is first applied to the pooled QC datasets in the order of injection. Then the abundances of each metabolite in the biological samples are corrected by cubic spline interpolated from the abundances in the smoothed QC data. The score plot of principal component analysis (PCA) indicated a better decrease in the deviation of clustering results than when alternative normalization using an internal standard, PC (12:0/12:0), was applied (Figure 4). There is no consensus for normalization methods in the LIPID MAPS consortium (Ivanova et al., 2007) and MRM-DIFF provides for the application of both methods for abundance normalization. Most lipid compounds are commonly detected among human-, mouse-, and rat-sera. It seems that anabolic or cleavage enzymes such as fatty acid synthase and lipase are conserved at least for the major lipids identified in our study. In addition, the fatty acid varieties of human serum conjugated in glycerophospholipids were richer than in the other two species in which many PE species were not detected (Supplementary File 1).
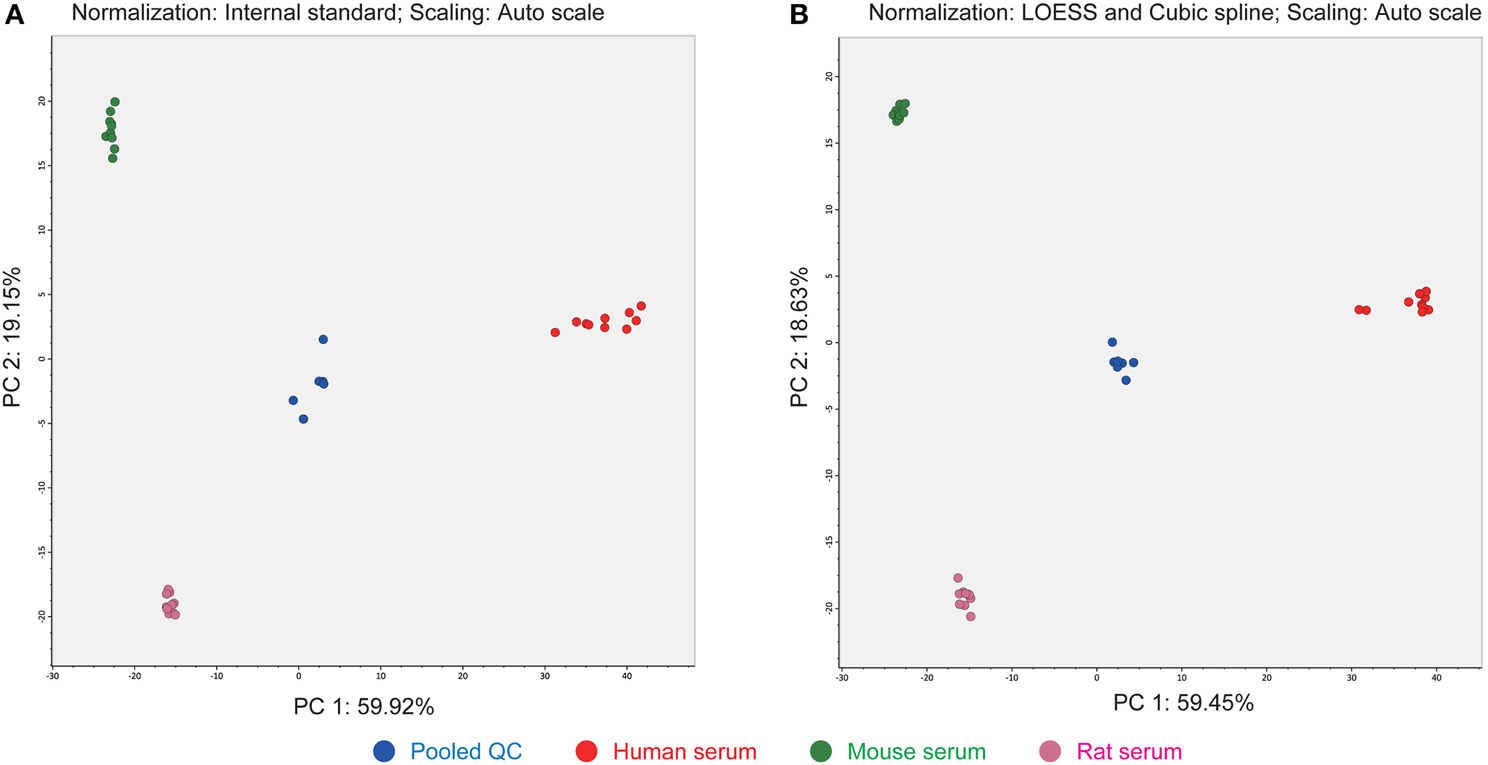
Figure 4. Differences in PCA score plots of internal standard- and LOESS/cubic spline-based normalizations. (A) The metabolite signals were normalized by one internal standard PC (12:0/12:0). (B) The metabolite signals were corrected by LOESS and cubic spline in combination with the abundances of pooled QC datasets that were analyzed at every five biological samples. This result shows that the clusters of each serum class were much improved with LOESS and cubic spline normalization.
Discussion
We demonstrated a different analysis with the systematic strategy for MRM-based lipid profiling. Our MRM-DIFF software program semi-automatically performs lipid identification and quantification of large scale MRM datasets. It also considers isotopic peaks to reduce false-positives and mis-quantifications. While pooled QC data are not always necessary, they help to find system parameters and to correct MS signal intensities for a better performance.
The advantage of pattern recognition from overlays is that many candidates can be detected as unknown or identified compounds (Ma et al., 2008; Vallejo et al., 2009). In this study, 677 unknown compounds were reliably detected in serum samples from three species. Such metabolites can be validated one-by-one by authentic standards or by high-resolution MS/MS platforms with structure prediction. In addition, the retention time of lipids in reverse phase LC methods can be theoretically estimated by the quantitative structure-retention relationship (QSRR) (Kaliszan, 2007; Audain et al., 2014; Cao et al., 2014), and its accuracy is improving. The combination of MRM-DIFF and QSRR methods may ease the tedious task of molecular identification in the future. Indeed, the sensitivity and selectivity of triple quadrupole MS for lipids far exceeded those of TOF- or Orbitrap-MS with respect to the identified lipids (data not shown). The reliability of quantification can be therefore improved by the higher signal to noise ratio. On the other hand, high-resolution MS systems have the advantage in its qualitative aspect: the O-alkyl or O-alkenyl derivatives can be distinguished from standard acyl derivatives by accurate masses.
We introduced MRM-DIFF as a differential analysis tool for large-scale MRM assays of up to 200 datasets. However, the classical “widely targeted” approach remains important for analyzing lipids by MRM assays. We developed another software program, MRMPROBS, to support the analysis of MRM assays by setting two or three transitions for each molecular target (Tsugawa et al., 2014). Either of the two software programs, MRM-DIFF or MRMPROBS, can be chosen depending on the research needs.
Materials and Methods
Reagents and Chemicals
Human-, mouse-, and rat-sera were purchased from Sigma-Aldrich Co. (St. Louis, MO, USA), authentic standard compounds from Sigma-Aldrich and Avanti Polar Lipids, Inc. (Alabaster, AL, USA), and ammonium acetate from Sigma-Aldrich. LC/MS grade distilled water and LC/MS grade methanol were purchased from Wako Pure Chemical Industries Ltd. (Osaka, Japan).
Sample Preparation
Lipid extraction from the sera was as described previously (Yamada et al., 2013) with minor modifications. Briefly, 10 μL of serum were mixed into 90 μL of methanol containing 10 μL of PC 12:0/12:0 (0.5 μg mL−1) as the internal standard. After vortexing at the maximum setting for 1 min, the samples were placed on ice for 10 min. The extracts were then centrifuged at 16,000 × g for 5 min at 4°C and the resulting supernatant (60 μL) was recovered. QC sample (150 μL) was prepared by mixing equal amounts (10 μL each) of human-, mouse-, and rat-serum extract (n = 5).
LC/MS/MS Conditions
The LC/MS/MS system was comprised of a Shimadzu Nexera ultra-high-performance liquid chromatograph and a Shimadzu LCMS-8040 triple quadrupole mass spectrometer equipped with an ESI ion source (Shimadzu Co., Kyoto, Japan). The conditions for LC/MS/MS analysis were: column, InertSustain (2.1 × 150 mm; particle size, 3 μm; GL Sciences Inc., Tokyo, Japan); column temperature, 40°C; mobile phase, 20 mM ammonium acetate in water (A) or methanol (B); flow rate, 0.35 mL min−1; gradient curve, 75% B at 0 min, 99% B at 22 min, 99% B at 39 min, 75% B at 39.1 min, and 75% B at 45 min; injection volume, 2 μL; mass analysis mode, both positive and negative ion mode with a polarity switching time of 15 ms; electrospray voltage, 4.5 kV for positive- and −3.5 kV for negative-ion mode; nebulizer gas flow, 3.0 L min−1; drying gas flow, 15.0 L min−1; desolvation temperature, 250°C; heat block temperature, 400°C; and detector voltage, 1.62 kV. The MRM mode with a dwell time of 5 ms per channel was used. Other optimized MRM parameters for each lipid and its related metabolite are shown in Table 1. One pooled QC sample was repeatedly analyzed at each fifth sample injection in this study.
Identification of Lipids
Major glycerophospholipids such as phosphatidylcholine (PC), phosphatidylethanolamine (PE), lysophosphatidylcholine (lysoPC), and lysophosphatidylethanolamine (lysoPE) manifest a wide variety of structures with a hydrophilic head group and/or hydrophobic fatty acid tails that include isobaric and isomeric lipid molecular species in the serum. The workflow for the identification of the glycerophospholipids in the human serum using the LC/MS/MS system is shown in Supplementary Figure 1. In short, the selection of glycerophospholipid candidates was based on previously reported information (Quehenberger et al., 2010) and our experimental findings with LC/MS/MS based virtual MRM screening (Supplementary Tables 1, 2). Identification of the PC, PE, lysoPC, and lysoPE molecular species on a triple quadrupole mass spectrometer requires the detection of specific fragment ions derived from both the head group (phosphocholine, m/z 184.1 or phosphatidylethanolamine, m/z M-140.0) in the positive-ion mode and the fatty acid (FA) moieties in the negative-ion mode. Therefore, after the head group moieties of targeted glycerophospholipids were confirmed by LC/MS/MS with MRM in the positive-ion mode, the FA moieties of targeted glycerophospholipids were identified by product-ion scanning on the triple quadrupole mass spectrometer in the negative-ion mode. In some cases, more than two different molecular species (structural isomers) were detected within the same m/z peaks, which was difficult to separate by our LC condition. Additionally, to distinguish plasmanyl (e) and plasmenyl (p) analogs of glycerophospholipids, the acid hydrolysis analysis was performed according to the previous report (Taguchi and Ishikawa, 2010). Structural characterization of two lysoglycerophospholipid regioisomers such as 2-acyl-1-lysophospholipids (e.g., lysoPC 14:0 sn-2) and 1-acyl-2-lysophospholipids (e.g., lysoPC 14:0 sn-1) was also performed using C18-based reverse phase column chromatography (Okudaira et al., 2014). Other lipids such as free fatty acid (FFA), acylcarnitine (AC), cholesterol, and cholic acid (CA) were identified on the basis of the manual curation with their authentic standards. Finally, the compound name, the molecular formula, the MRM transition, and the RT of 284 lipids molecular species were stored in the user-defined lipids library (Table 1).
MRM-DIFF Software and Data Processing Parameters
The MRM-DIFF program, the demonstration data set, and the tutorial are downloadable at the “Standalone software” section of PRIMe (Platform for RIKEN Metabolomics, http://prime.psc.riken.jp/) database website. MRM-DIFF can import two data formats: “Analysis Base File” (ABF) format converted by our file converter (Tsugawa et al., 2014) and the common mzML format converted by the ProteoWizard MSConvert software (Kessner et al., 2008). The ABF file converter is freely available at http://www.reifycs.com/english/AbfConverter/.
MRM-DIFF is available in Windows OS (.NET Framework 4.0 or later; RAM: 4.0 GB or more). Its source code was written in the C# language with the Windows Presentation Foundation (WPF) to develop the graphical user interface.
In this study, Shimadzu LCD files were converted to ABF format by our converter. The reference library for lipid identification was prepared from the above identification criteria and the library is downloadable at our RIKEN PRIMe website. After importing ABF files in the MRM-DIFF program, data processing was performed with the following parameters: smoothing method, linear weighted moving average; smoothing level, 2 scan; minimum peak width, 5 scan; minimum peak height, 100 amplitude; retention time tolerance, 0.2 min; minimum posterior, 70%; column type, ODS; segment size, 0.5 min; slack parameter, 1 scan; border limit, constant. The other details for the MRM-DIFF operation were described in the MRM-DIFF tutorial (http://prime.psc.riken.jp/).
Theory
This section describes the mathematical methods implemented in the MRM-DIFF software program. MRM-DIFF accepts two data formats: the mzML data format converted via ProteoWizard and the ABF data format converted via our file converter program (Tsugawa et al., 2014). After importing all data files, the reference file is automatically selected by means of pooled QC datasets for each MRM transition as in the equation.
where n indicates the scan number of the chromatogram data points. This equation calculates the “gravity” of each chromatogram. MRM-DIFF selects a reference file whose value is closest to the midpoint between the minimum and the maximum of pooled QCs gravities.
We implemented COW (Nielsen et al., 1998) in the MRM-DIFF program as the non-linear alignment algorithm. Three parameters are required for chromatogram alignments, the segment size, warp slack, and a targeted reference chromatogram. The most important chore, selection of the reference chromatogram, is performed with the chromatographic centroid algorithm. Based on our experience, the segment size and warp slack parameters should be set to “peak widths (min)” and “1 or 2,” respectively, as long as reverse phase LC methods are used for lipid profiling. We also looked for suitable parameters for hydrophilic interaction chromatography (HILIC)- and pentafluorophenylpropyl (PFPP) columns; the recommended parameters are described in the MRM-DIFF tutorial (http://prime.psc.riken.jp/).
The peak detection algorithm is performed in the MRM-DIFF program. The principle underlying the peak detection method for pattern recognition is: (1) The peak detection method is applied to one representative chromatogram. The peak detection algorithm is the same as in our previous report (Tsugawa et al., 2014). (2) Peak detections for other chromatograms are based on a representative chromatogram; we call the “data dependent peak detection method.” (3) In this method, the local maximum within the left- and right edges of the representative peak is recognized as the peak top in the other chromatograms. (4) The left- and right edge of other chromatograms now corresponds with the representative peak in the MRM-DIFF program. Local minimum search from the assigned peak top is an alternative option. We highly recommend the peak height as the quantification value for detected peaks.
In the MRM-DIFF program, compound identification is based on retention time accuracy:
RTact. and RTlib. indicate the measured- and reference retention time, respectively, and the σ value is the user-defined search tolerance. The value range is from 0 (non-consistency) to 1 (confidential); 0.7 is the default threshold for compound identifications. The criteria for isotopic ion estimation are: (1) isotopic ions up to M+6 are estimated. (2) MRM transitions including the same product ion are examined. (3) The abundance peaks higher than the monoisotopic ion are not recognized as the isotopic peaks. (4) Peak top differences within 1 s from the peak top of monoisotopic ions are recognized as the isotopic peaks.
In addition, the isotopic peak abundances are calculated by the theoretical isotopic ratio of the molecular formula with the following method [ Tsugawa et al. (2014). MS-DIAL: Data Independent MS/MS Deconvolution for Comprehensive Metabolome Analysis, submitted]. For example, the isotopic ratio for C42H82NO8P, i.e., PC(16:0/18:1), is represented as the coefficient values of expanded elements of the following equation.
The letter such as 12C indicates the natural abundance of each element. The above contents except for the mono-isotopic mass 12C142H1482N16O318P are expanded. The coefficient value of each expanded term represents the relative isotope abundances with respect to the mono-isotopic ion. Since only nominal masses are output from the triple quadrupole MS system, the theoretical abundances are binned into nominal values.
Finally, the LOESS/cubic spline method was implemented as described in our previous report (Tsugawa et al., 2014). Note that the MRM-DIFF program does not require pooled QC datasets. The QC datasets can be alternated with other files given the above mathematical details. However, the LOESS/cubic spline normalization method cannot be applied.
Conflict of Interest Statement
The authors declare that the research was conducted in the absence of any commercial or financial relationships that could be construed as a potential conflict of interest.
Acknowledgments
This work was supported by the NSF-JST Strategic International Collaborative Research Program (SICORP) for JP-US Metabolomics, the Japan Science and Technology Agency (JST)-Core Research for Evolutionary Science and Technology (JST-CREST), the Development of Systems and Technology for Advanced Measurement and Analysis Project (JST), and the Advanced Low Carbon Technology Research and Development Program (JST). Hiroshi Tsugawa and Yoshihiro Izumi were also supported by a grant-in-aid for young scientists (B) 25871136 and 24700455, respectively.
Supplementary Material
The Supplementary Material for this article can be found online at: http://www.frontiersin.org/journal/10.3389/fgene.2014.00471/abstract
References
Audain, E., Sanchez, A., Vizcaino, J. A., and Perez-Riverol, Y. (2014). A survey of molecular descriptors used in mass spectrometry based proteomics. Curr. Top. Med. Chem. 14, 388–397. doi: 10.2174/1568026613666131204113537
Pubmed Abstract | Pubmed Full Text | CrossRef Full Text | Google Scholar
Cao, M., Fraser, K., Huege, J., Featonby, T., Rasmussen, S., and Jones, C., et al. (2014). Predicting retention time in hydrophilic interaction liquid chromatography mass spectrometry and its use for peak annotation in metabolomics. Metabolomics. doi: 10.1007/s11306-014-0727-x
Cleveland, W. S. (1979). Robust locally weighted regression and smoothing scatterplots. J. Am. Stat. Assoc. 74, 829–836. doi: 10.1080/01621459.1979.10481038
Dunn, W. B., Broadhurst, D., Begley, P., Zelena, E., Francis-McIntyre, S., Anderson, N., et al. (2011). Procedures for large-scale metabolic profiling of serum and plasma using gas chromatography and liquid chromatography coupled to mass spectrometry. Nat. Protoc. 6, 1060–1083. doi: 10.1038/nprot.2011.335
Pubmed Abstract | Pubmed Full Text | CrossRef Full Text | Google Scholar
Fahy, E., Sud, M., Cotter, D., and Subramaniam, S. (2007). LIPID MAPS online tools for lipid research. Nucleic Acids Res. 35, 606–612. doi: 10.1093/nar/gkm324
Pubmed Abstract | Pubmed Full Text | CrossRef Full Text | Google Scholar
Ikeda, K., Shimizu, T., and Taguchi, R. (2008). Targeted analysis of ganglioside and sulfatide molecular species by LC/ESI-MS/MS with theoretically expanded multiple reaction monitoring. J. Lipid Res. 49, 2678–2689. doi: 10.1194/jlr.D800038-JLR200
Pubmed Abstract | Pubmed Full Text | CrossRef Full Text | Google Scholar
Ivanova, P. T., Milne, S. B., Byrne, M. O., Xiang, Y., and Brown, H. A. (2007). Glycerophospholipid identification and quantitation by electrospray ionization mass spectrometry. Methods Enzymol. 432, 21–57. doi: 10.1016/S0076-6879(07)32002-8
Pubmed Abstract | Pubmed Full Text | CrossRef Full Text | Google Scholar
Kaliszan, R. (2007). QSRR: Quantitative structure-(chromatographic) retention relationships. Chem. Rev. 107, 3212–3246. doi: 10.1021/cr068412z
Pubmed Abstract | Pubmed Full Text | CrossRef Full Text | Google Scholar
Kessner, D., Chambers, M., Burke, R., Agus, D., and Mallick, P. (2008). ProteoWizard: open source software for rapid proteomics tools development. Bioinformatics 24, 2534–2536. doi: 10.1093/bioinformatics/btn323
Pubmed Abstract | Pubmed Full Text | CrossRef Full Text | Google Scholar
Kind, T., Liu, K., Lee, D. Y., Defelice, B., Meissen, J. K., and Fiehn, O. et al. (2013). LipidBlast in silico tandem mass spectrometry database for lipid identification. Nat. Methods 10, 755–758. doi: 10.1038/nmeth.2551
Pubmed Abstract | Pubmed Full Text | CrossRef Full Text | Google Scholar
Ma, C., Wang, H., Lu, X., Xu, G., and Liu, B. (2008). Metabolic fingerprinting investigation of Artemisia annua L. in different stages of development by gas chromatography and gas chromatography-mass spectrometry. J. Chromatogr. A 1186, 412–419. doi: 10.1016/j.chroma.2007.09.023
Pubmed Abstract | Pubmed Full Text | CrossRef Full Text | Google Scholar
Nielsen, N.-P. V., Carstensen, J. M., and Smedsgaard, J. (1998). Aligning of single and multiple wavelength chromatographic profiles for chemometric data analysis using correlation optimised warping. J. Chromatogr. A 805, 17–35. doi: 10.1016/S0021-9673(98)00021-1
Okudaira, M., Inoue, A., Shuto, A., Nakanaga, K., Kano, K., Makide, K., et al. (2014). Separation and quantification of 2-acyl-1-lysophospholipids and 1-acyl-2-lysophospholipids in biological samples by LC-MS/MS. J. Lipid Res. 55, 2178–2192. doi: 10.1194/jlr.D048439
Pubmed Abstract | Pubmed Full Text | CrossRef Full Text | Google Scholar
Perez-Riverol, Y., Hermjakob, H., Kohlbacher, O., Martens, L., Creasy, D., Cox, J., et al. (2013). Computational proteomics pitfalls and challenges: HavanaBioinfo 2012 Workshop report. J. Proteomics 87, 134–138. doi: 10.1016/j.jprot.2013.01.019
Pubmed Abstract | Pubmed Full Text | CrossRef Full Text | Google Scholar
Psychogios, N., Hau, D. D., Peng, J., Cuo, A. C., Mandal, R., Bouatra, S., et al. (2011). The human serum metabolome. PLoS ONE 6:e16957. doi: 10.1371/journal.pone.0016957
Pubmed Abstract | Pubmed Full Text | CrossRef Full Text | Google Scholar
Quehenberger, O., Armando, A. M., Brown, A. H., Milne, S. B., Myers, D. S., Merrill, A. H., et al. (2010). Lipidomics reveals a remarkable diversity of lipids in human plasma. J. Lipid Res. 51, 3299–3305. doi: 10.1194/jlr.M009449
Pubmed Abstract | Pubmed Full Text | CrossRef Full Text | Google Scholar
Shaner, R. L., Allegood, J. C., Park, H., Wang, E., Kelly, S., Haynes, C. A., et al. (2009). Quantitative analysis of sphingolipids for lipidomics using triple quadrupole and quadrupole linear ion trap mass spectrometers. J. Lipid Res. 50, 1692–1707. doi: 10.1194/jlr.D800051-JLR200
Pubmed Abstract | Pubmed Full Text | CrossRef Full Text | Google Scholar
Stein, S. E., and Heller, D. N. (2006). On the risk of false positive identification using multiple ion monitoring in qualitative mass spectrometry: large-scale intercomparison with a comprehensive mass spectral library. J. Am. Soc. Mass Spectrom. 17, 823–835. doi: 10.1016/j.jasms.2006.02.021
Pubmed Abstract | Pubmed Full Text | CrossRef Full Text | Google Scholar
Sugimoto, M., Hirayama, A., Ishikawa, T., Robert, M., Baran, R., Uehara, K., et al. (2009). Differential metabolomics software for capillary electrophoresis-mass spectrometry data analysis. Metabolomics 6, 27–41. doi: 10.1007/s11306-009-0175-1
Pubmed Abstract | Pubmed Full Text | CrossRef Full Text | Google Scholar
Sugimoto, M., Kawakami, M., Robert, M., Soga, T., and Tomita, M. (2012). Bioinformatics tools for mass spectroscopy-based metabolomic data processing and analysis. Curr. Bioinform. 7, 96–108. doi: 10.2174/157489312799304431
Pubmed Abstract | Pubmed Full Text | CrossRef Full Text | Google Scholar
Taguchi, R., and Ishikawa, M. (2010). Precise and global identification of phospholipid molecular species by an Orbitrap mass spectrometer and automated search engine Lipid Search. J. Chromatogr. A 1217, 4229–4239. doi: 10.1016/j.chroma.2010.04.034
Pubmed Abstract | Pubmed Full Text | CrossRef Full Text | Google Scholar
Tomasi, G., van den Berg, F., and Andersson, C. (2004). Correlation optimized warping and dynamic time warping as preprocessing methods for chromatographic data. J. Chemometr. 18, 231–241. doi: 10.1002/cem.859
Tsugawa, H., Arita, M., Kanazawa, M., Ogiwara, A., Bamba, T., and Fukusaki, E., et al. (2013). MRMPROBS: a data assessment and metabolite identification tool for large-scale multiple reaction monitoring based widely targeted metabolomics. Anal. Chem. 85, 5191–5199. doi: 10.1021/ac400515s
Pubmed Abstract | Pubmed Full Text | CrossRef Full Text | Google Scholar
Tsugawa, H., Kanazawa, M., Ogiwara, A., and Arita, M. (2014). MRMPROBS suite for metabolomics using large-scale MRM assays. Bioinformatics 30, 2379–2380. doi: 10.1093/bioinformatics/btu203
Pubmed Abstract | Pubmed Full Text | CrossRef Full Text | Google Scholar
Uchikata, T., Matsubara, A., Nishiumi, S., Yoshida, M., Fukusaki, E., and Bamba, T., et al. (2012). Development of oxidized phosphatidylcholine isomer profiling method using supercritical fluid chromatography/tandem mass spectrometry. J. Chromatogr. A 1250, 205–211. doi: 10.1016/j.chroma.2012.05.083
Pubmed Abstract | Pubmed Full Text | CrossRef Full Text | Google Scholar
Vallejo, M., García, A., Tuñón, J., García-Martínez, D., Angulo, S., Martin-Ventura, J. L., et al. (2009). Plasma fingerprinting with GC-MS in acute coronary syndrome. Anal. Bioanal. Chem. 394, 1517–1524. doi: 10.1007/s00216-009-2610-6
Pubmed Abstract | Pubmed Full Text | CrossRef Full Text | Google Scholar
Yamada, T., Uchikata, T., Sakamoto, S., Yokoi, Y., Fukusaki, E., and Bamba, T., (2013). Development of a lipid profiling system using reverse-phase liquid chromatography coupled to high-resolution mass spectrometry with rapid polarity switching and an automated lipid identification software. J. Chromatogr. A 1292, 211–218. doi: 10.1016/j.chroma.2013.01.078
Pubmed Abstract | Pubmed Full Text | CrossRef Full Text | Google Scholar
Keywords: multiple reaction monitoring, differential analysis, lipidomics, compound identification, isotopic peak estimation
Citation: Tsugawa H, Ohta E, Izumi Y, Ogiwara A, Yukihira D, Bamba T, Fukusaki E and Arita M (2015) MRM-DIFF: data processing strategy for differential analysis in large scale MRM-based lipidomics studies. Front. Genet. 5:471. doi: 10.3389/fgene.2014.00471
Received: 28 October 2014; Accepted: 19 December 2014;
Published online: 30 January 2015.
Edited by:
Yasset Perez-Riverol, European Bioinformatics Institute (EMBL-EBI), UKReviewed by:
Juan Antonio Vizcaino, European Bioinformatics Institute (EMBL-EBI), UKYassel Ramos, Center for Genetic Engineering and Biotechnology, Cuba
Copyright © 2015 Tsugawa, Ohta, Izumi, Ogiwara, Yukihira, Bamba, Fukusaki and Arita. This is an open-access article distributed under the terms of the Creative Commons Attribution License (CC BY). The use, distribution or reproduction in other forums is permitted, provided the original author(s) or licensor are credited and that the original publication in this journal is cited, in accordance with accepted academic practice. No use, distribution or reproduction is permitted which does not comply with these terms.
*Correspondence: Hiroshi Tsugawa, RIKEN Center for Sustainable Resource Science, 1-7-22 Suehiro-cho, Tsurumi-ku, Yokohama, Kanagawa 230-0045, Japan;
Department of Biotechnology, Graduate School of Engineering, Osaka University, Suita, Osaka 565-0871, Japan e-mail: hiroshi.tsugawa@riken.jp