 Ken-ichi Lee1
 Masahiro Kusumoto1
 Tsuyoshi Sekizuka2
 Makoto Kuroda2
 Ikuo Uchida3
 Taketoshi Iwata1
 Susumu Okamoto4
 Kimiko Yabe4
 Takashi Inaoka4*
 Masato Akiba1,5*
- 1Bacterial and Parasitic Disease Research Division, National Institute of Animal Health, Ibaraki, Japan
- 2Pathogen Genomics Center, National Institute of Infectious Diseases, Tokyo, Japan
- 3Hokkaido Research Station, National Institute of Animal Health, Hokkaido, Japan
- 4Food Biotechnology Division, National Food Research Institute, Ibaraki, Japan
- 5Graduate School of Life and Environmental Sciences, Osaka Prefecture University, Osaka, Japan
GI-VII-6 is a chromosomally integrated multidrug resistance genomic island harbored by a specific clone of Salmonella enterica serovar Typhimurium (S.Typhimurium). It contains a gene encoding CMY-2 β-lactamase (blaCMY−2), and therefore contributes to extended-spectrum cephalosporin resistance. To elucidate the significance of GI-VII-6 on adaptive evolution, spontaneous mutants of S. Typhimurium strain L-3553 were selected on plates containing cefotaxime (CTX). The concentrations of CTX were higher than its minimum inhibition concentration to the parent strain. The mutants appeared on the plates containing 12.5 and 25 mg/L CTX at a frequency of 10−6 and 10−8, respectively. No colonies were observed at higher CTX concentrations. The copy number of blaCMY−2 increased up to 85 per genome in the mutants, while the parent strain contains one copy of that in the chromosome. This elevation was accompanied by increased amount of transcription. The blaCMY−2 copy number in the mutants drastically decreased in the absence of antimicrobial selection pressure. Southern hybridization analysis and short-read mapping indicated that the entire 125 kb GI-VII-6 or parts of it were tandemly amplified. GI-VII-6 amplification occurred at its original position, although it also transposed to other locations in the genome in some mutants, including an endogenous plasmid in some of the mutants, leading to the amplification of GI-VII-6 at different loci. Insertion sequences were observed at the junction of the amplified regions in the mutants, suggesting their significant roles in the transposition and amplification. Plasmid copy number in the selected mutants was 1.4 to 4.4 times higher than that of the parent strain. These data suggest that transposition and amplification of the blaCMY−2-containing region, along with the copy number variation of the plasmid, contributed to the extensive amplification of blaCMY−2 and increased resistance to CTX.
Introduction
Non-typhoidal Salmonella (NTS) infection causes enterocolitis with diarrhea and/or invasive disease with bacteremia. Extended-spectrum cephalosporins (ESCs) or fluoroquinolones are commonly used as a first-line agent for the treatment of NTS infections, if susceptibilities to antimicrobials are unknown. In particular, ESCs are preferred, because fluoroquinolones are not recommended for use in children (Hohmann, 2001). Therefore, emergence of ESC-resistant NTS poses a threat to public health. Resistance to ESCs among Salmonella enterica serovars is attributed to the acquisition of Ambler class A extended-spectrum β-lactamases (ESBLs) and/or Ambler class C cephamycinases (AmpC β-lactamases). Of these, CMY-2, an AmpC β-lactamase encoded by the blaCMY−2 gene, is the most frequently detected enzyme among NTS (Michael et al., 2006).
Human salmonellosis is mainly acquired by the ingestion of animal products, including meat, milk, and eggs (Mead et al., 1999). The use of antimicrobials in food-producing animals selects for bacteria resistant to antimicrobials used in humans (Phillips et al., 2004). We have continuously monitored the antimicrobial resistance of S. enterica serovar Typhimurium (S. Typhimurium) isolated from cattle in Japan (Tamada et al., 2001). Since 2004, S. Typhimurium isolates that are resistant to ESC have been detected in the northern major island, Hokkaido (Tamamura et al., 2011). Most of these ESC-resistant S. Typhimurium isolates have been noted to harbor one copy of blaCMY−2 in their chromosome as an element of a 125-kb genomic island, GI-VII-6 (Figure 1). A large proportion of GI-VII-6 (99%) shows a high sequence similarity (>99%) with Escherichia coli plasmid, pAR060302 (size, 167 kb). Directly repeated copies of insertion sequence IS26 were present at both ends of GI-VII-6 (Shahada et al., 2011). Insertion sequences are the simplest transposable elements and can induce transposition of flanking genes to other replicons with themselves (Mahillon and Chandler, 1998). In fact, junction region of this genomic island were flanked by an 8-bp direct repeat, suggesting that GI-VII-6 was acquired by transposition involving IS26 transposase (Shahada et al., 2011). Minimum inhibitory concentrations (MICs) of oxyimino-cephalosporins against these isolates have been found to be lower than those of other bacteria producing plasmid-encoded CMY-2 β-lactamases or ESBLs (Bonnet, 2004; Jacoby, 2009; Shahada et al., 2011). The significance of GI-VII-6 on ESC resistance and clonal spread of GI-VII-6 positive isolates is not yet clear.
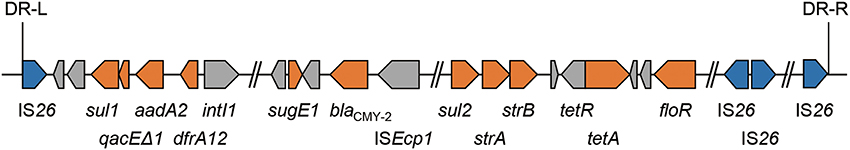
Figure 1. Schematic view of antimicrobial resistance regions located in GI-VII-6. Each arrow indicates gene according to the following scheme: blue, genes for IS26 transposase; orange, resistance genes; gray, other genes. GI-VII-6 were flanked by an 8-bp direct repeat.
Gene duplication and amplification (GDA) is known to be an important adaptive mechanism in both prokaryotes and eukaryotes under the existence of selection pressures such as anitimicrobials and carbon starvation (Andersson and Hughes, 2009). Bacterial genomic regions of up to 300 kb can be selected under antimicrobial selection pressures with the copy numbers of up to 40 (Sandegren and Andersson, 2009). The amplified genes alter the antimicrobial resistance phenotypes of the bacteria. For example, resistance of bacteria to sulfonamides, trimethoprim, and β-lactams can be increased by GDA of genes encoding antimicrobial hydrolytic enzymes, target enzymes, or efflux pumps (Andersson and Hughes, 2009; Sandegren and Andersson, 2009). Although the detailed mechanisms of GDA are still controversial, direct repeats flanking a region can contribute successful amplification (Sandegren and Andersson, 2009). The presence of directly repeated copies of IS26 flanking GI-VII-6 (Shahada et al., 2011) prompted us to investigate whether increased ESC resistance due to GDA occurs in the S. Typhimurium isolates harboring GI-VII-6. The purpose of the present study is to understand the significance of GI-VII-6 in the adaptive evolution of S. Typhimurium under antimicrobial selection pressure.
Thus, we selected and analyzed spontaneous mutants of an S. Typhimurium strain harboring GI-VII-6 on cephalosporin-containing plates. GI-VII-6 was extensively amplified in all of the mutants by GDA mechanisms. However, the amplification pattern was more complex than we initially predicted. Pre-existing or transposed insertion sequences were observed at the junction of the amplified regions. The importance of insertion sequences on the adaptive evolution was highlighted in this study.
Materials and Methods
Selection of S. Typhimurium Mutants with Increased Resistance to Cefotaxime
To select S. Typhimurium spontaneous mutants with increased resistance to cefotaxime (CTX), L-3553 (Shahada et al., 2011) harboring GI-VII-6 in the chromosome was used as the parent strain. Whole-genome sequence of this strain was reported previously (Sekizuka et al., 2014). The MIC of CTX against this strain was 8 mg/L. This strain was inoculated into 3 ml of Luria–Bertani (LB) broth (Becton, Dickinson and Company, Franklin Lakes, NJ, USA) and incubated at 37°C and 150 rpm for 20 h. The shaking speed employed for broth culture was the same throughout this study. The culture was serially diluted and spread on LB agar plates (Becton, Dickinson and Company) containing 12.5, 25, 50, or 100 mg/L CTX (Sigma-Aldrich Co. LLC., St. Louis, MO, USA). In addition, the same culture was spread on LB agar plates without antimicrobials. The frequency of the mutations was estimated from the number of colonies on LB agar plates with CTX divided by that on plates without CTX. Twenty colonies were picked from the CTX-containing plates and inoculated into fresh LB broth with CTX (at the same concentration to that used in the initial selection) and incubated at 37°C for 24 h under constant shaking. Each culture was mixed with same volume of 50% (vol/vol) glycerol and stored at -80°C until further use.
Determination of MIC
MIC was determined by the agar dilution method using Mueller–Hinton agar (Becton, Dickenson and Company), according to the procedure recommended by the Clinical and Laboratory Standards Institute (2008). The following internal quality control strains were used: Staphylococcus aureus ATCC 29213, Enterococcus faecalis ATCC 29212, E. coli ATCC 25922, and Pseudomonas aeruginosa ATCC 27853. The antimicrobials tested were as follows: CTX, ceftriaxone (CRO), ceftazidime (CAZ), cefoxitin (FOX), streptomycin (STR) (Sigma-Aldrich Co. LLC.), chloramphenicol (CHL) (Nacalai Tesque, Inc., Kyoto, Japan), and oxytetracycline (OTC) (Wako Pure Chemical Industries, Ltd., Osaka, Japan).
Extraction of Genomic DNA
Genomic DNA was extracted from 1 ml of 24-h culture using Wizard Genomic DNA Purification Kit (Promega Corporation, Madison, WI, USA), and used for quantitative real-time PCR (qPCR), PCR, and short-read DNA sequencing.
qPCR
Primers used in this study for qPCR are listed in Table S1. Oligonucleotides were purchased from Hokkaido System Science Co., Ltd. (Sapporo, Japan). The qPCR technique was used for the quantification of relative copy number of blaCMY−2. Each reaction mixture contained 1X THUNDERBIRD SYBR qPCR Mix (Toyobo Co., Ltd., Osaka, Japan), 0.1X ROX (Toyobo Co., Ltd.), and 0.15 μM of each primer. The thermal conditions were initial denaturation at 95°C for 1 min, followed by 30 cycles of 95°C for 15 s and 60°C for 40 s. The signal was monitored using ABI Prism 7500 Real-time PCR System (Life technologies, Carlsbad, CA, USA). Standard curve method was used for relative quantification of target genes (Peirson et al., 2003). The rpsJ and dnaN genes were used as a single copy control in all experiments. The copy number was generated from a ratio of the relative amount of blaCMY−2 to that of a single copy gene. DNA of the parent strain, L-3553, was used to normalize the blaCMY−2 copy number of the mutants in every individual run.
Periodical Quantification of blaCMY−2 Copy Number and mRNA Expression
One hundred microliter of the frozen stock of each strain was inoculated into 100 ml of LB broth containing CTX and incubated at 37°C under constant shaking. The optical density at 600 nm (OD600) of each culture was measured and a portion of the culture was collected for DNA and RNA extraction in early logarithmic phase (OD600 = 0.5), middle logarithmic phase (OD600 = 1.5), late logarithmic phase (OD600 = 2.5), early stationary phase (OD600 = 3.0), and late stationary phase (24 h). The genomic DNA was extracted as described above and total RNA was extracted using RNAprotect Bacteria Reagent and RNeasy Mini Kit (Qiagen, Venlo, Netherlands). mRNA was converted to cDNA using the PrimeScript RT reagent Kit (Takara Bio Inc., Shiga, Japan) with random hexamers provided with the kit. qPCR was performed as described earlier to determine the relative expression level of mRNA for blaCMY−2. The parent strain, L-3553, was used to normalize the mRNA fold change. Because our preliminary data suggested that the nrfG expression was stable throughout different growth stages (data not shown), it was used as an internal control for mRNA quantification.
PCR and DNA Sequencing
Primers used in this study for PCR are listed in Table S1. PCR was performed using an iCycler apparatus (Bio-Rad Laboratories, Hercules, CA, USA), and Takara Ex Taq (Takara Bio Inc.) was used as the DNA polymerase for each PCR. The amplified fragments were purified using the ExoSAP-IT (USB Corporation, Cleveland, OH, USA), and the nucleotide sequence of both strands was determined using an Applied Biosystems 3130xl Genetic Analyzer with the BigDye Terminator cycle sequencing kit (version 3.1; Applied Biosystems, Foster City, CA, USA). The sequences were then assembled with Sequencher version 4 (Hitachi Solutions, Kanagawa, Japan) and the DNA alignment was examined using the Basic Local Alignment Search Tool (http://blast.ncbi.nlm.nih.gov/Blast.cgi).
Short-Read DNA Sequencing and Mapping on GI-VII-6 Sequence
DNA libraries (insert size: ~600 bp) were prepared using the Nextera XT DNA Sample Prep Kit (Illumina, San Diego, WI). DNA cluster generation and paired-end sequencing run for 170 mers were performed using an Illumina MiSeq with the MiSeq 500 cycle Kit v2. The fluorescent images were analyzed using the Illumina RTA1.17.22/MCS2.1.43 base-calling pipeline to obtain FASTQ-formatted sequence data. To generate short-read mapping data of all strains compared to the chromosome and plasmid, pST3553 of S. Typhimurium L-3553 [DNA Data Bank of Japan (DDBJ) accession numbers AP014565 and AP014566, respectively], BWA-SW (Li and Durbin, 2010), and SAMtools (Li et al., 2009) software were used with the default parameters. The mapping data obtained were visualized with GenomeJack viewer software (Mitsubishi Space Software, Tokyo, Japan), and the mean coverage, which means average value of coverage of short reads on a specific genomic region, was calculated using R software version 3.0.0 (R Core Team, 2013).
Southern Hybridization Analysis
To confirm the chromosomal location of blaCMY−2 and relevant genes among the strains L-3553 and its derivatives, pulsed-field gel electrophoresis (PFGE) followed by Southern hybridization analysis were performed according to methods described previously (Shahada et al., 2011), with some modifications. In brief, a plug of each strain was prepared using 24-h cultures. The plugs were digested with 60 U/ml of XbaI (Takara Bio Inc.) or 40 U/ml of FseI (New England BioLabs, Ipswich, MA, USA) at 37°C for 6 h, or 2 U/ml of S1 nuclease (Takara Bio Inc.) at 37°C for 45 min. Primers used for probe synthesis were listed in Table S1.
Statistical Analysis
Wilcoxon rank sum test was used to compare the blaCMY−2 copy number between increased CTX resistance mutants selected from the 12.5 and 25 mg/L CTX-containing plates. R2-value between the copy number of the genomic DNA and the mRNA fold change in blaCMY−2 in all strains tested was calculated. These analyses were performed using R software version 3.0.0.
Nucleotide Sequence Accession Numbers
The sequence reads obtained from the S. Typhimurium strains were deposited in DDBJ Sequence Read Archive under the accession number DRA001681.
Results
Frequency of Selection and Copy Number of blaCMY−2 Gene in Spontaneous Mutants
Spontaneous mutants were selected on the plates containing 12.5 and 25 mg/L CTX with a frequency of 1.1 × 10⁻⁶± 6.0 × 10⁻⁷ and 3.4 × 10⁻⁸ ± 1.6 × 10⁻⁸ (mean ± SD), respectively. No colonies appeared on the plates containing 50 and 100 mg/L CTX, suggesting that the frequency was less than 1.2 × 10⁻¹⁰. Twenty colonies were picked from each of the plates containing 12.5 and 25 mg/L CTX, and the copy number of blaCMY−2 was quantified. In the preliminary experiments, we determined the blaCMY−2 copy number of selected strains for three times and calculated the coefficient of variation (CV = standard deviation divided by mean). CV for the biological replicate was 0.153, whereas that for the technical replicate was 0.102. As shown in Table 1, all the mutants harbored multiple blaCMY−2 copies, ranging from 5.9 to 85.3, while the average blaCMY−2 copy number in 10 colonies of L-3553 on the LB agar plate was 1.01 ± 0.06. Higher variance in copy numbers was observed in mutants selected at 25 mg/L CTX (9.0–85.3) than in mutants selected at 12.5 mg/L CTX (5.9–25.7). Moreover, the average copy number in the mutants selected from plates containing 25 mg/L CTX (24.2 ± 20.6) was higher than that from plates containing 12.5 mg/L CTX (17.1 ± 5.1), although the difference was not statistically significant (p = 0.62).
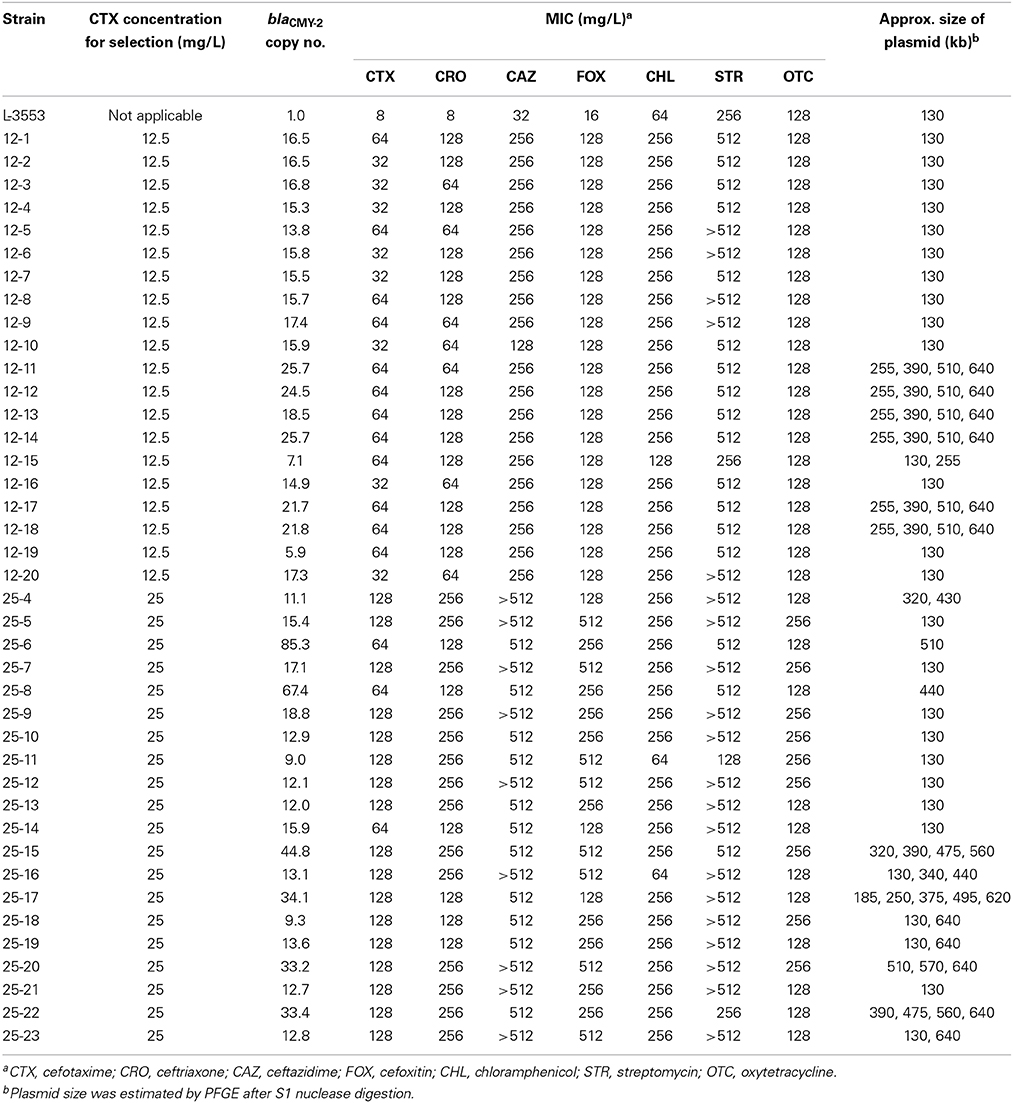
Table 1. Copy numbers of blaCMY−2 and MICs of various antimicrobials for S. Typhimurium L-3553 and the spontaneous mutants selected on CTX-containing plates.
MICs of Relevant Antimicrobials Against the Mutants
To confirm the phenotypic changes of the mutants, we determined the MICs of six additional antimicrobials whose resistance genes were located in GI-VII-6: resistance to CRO, CAZ, and FOX is conferred by blaCMY−2, CHL resistance is conferred by floR, STR resistance is conferred by aadA2, strA, and strB, and OTC resistance is conferred by tetA (Figure 1). As shown in Table 1, the MICs of CTX, CRO, and FOX were found to increase by four- to 32-fold. The MIC of CAZ against some of the mutants was over the detection limit. MIC50 and MIC90 of cephalosporin antimicrobials against the mutants selected from plates containing 25 mg/L CTX were higher than those from plates containing 12.5 mg/L CTX (Table S2). The MIC of chloramphenicol against the mutants increased four-fold, except for two strains showing the same value as that of the parent strain, whereas MIC of streptomycin against the mutants increased more than two-fold, but the values were over the detection limit in half of the strains. MIC of oxytetracycline against the mutants was comparable to that of the parent strain.
Periodical Quantification of blaCMY−2 Copy Number and mRNA Expression
blaCMY−2 copy number in the genomic DNA and fold change of mRNA were measured to confirm the correlation between them. As shown in Figure 2, the copy number of blaCMY−2 increased rapidly in the early logarithmic phase, and then gradually increased from late logarithmic to stationary phase in strains 12-1, 12-19, and 25-11. In contrast, the copy number increased linearly even in the stationary phase in strains 12-14, 25-6, and 25-17, leading to higher copy numbers. Furthermore, the fold changes of mRNA were significantly correlated with the blaCMY−2 copy numbers (R2 = 0.97, p < 10−5).
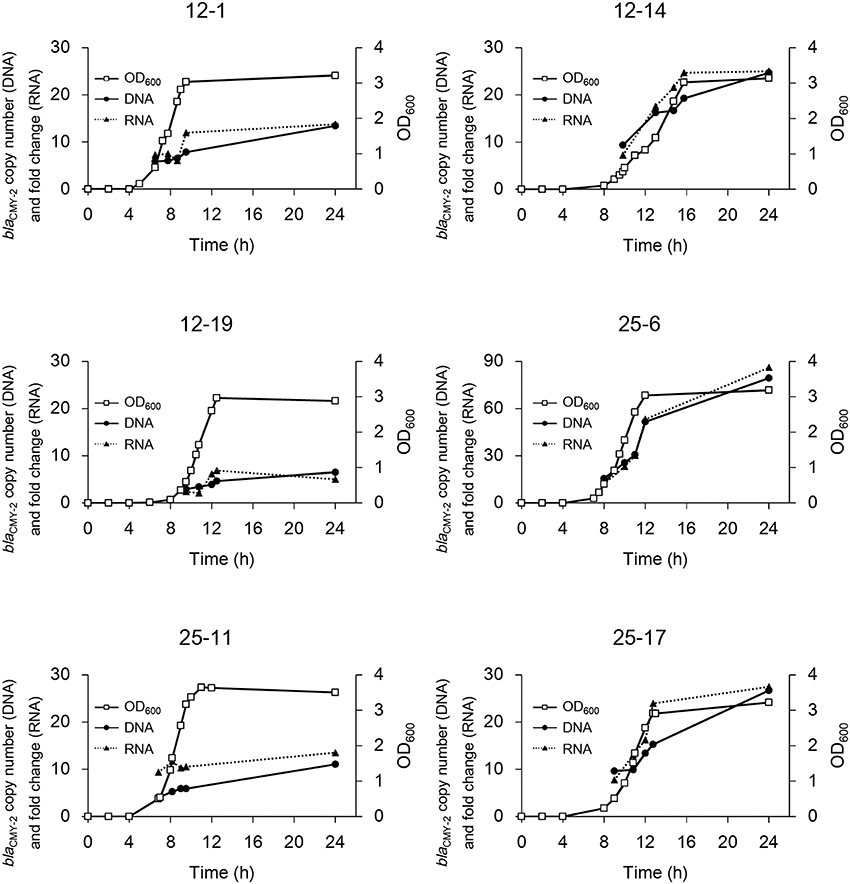
Figure 2. Time courses of bacterial growth and blaCMY−2 gene amplification in the six selected mutants. Bacterial growth is shown as OD600. The copy number of gene and fold change of mRNA are indicated. Note that the y-axis for strain 25-6 is different from that for the others.
Effect of Serial Subculture without CTX on blaCMY−2 Copy Numbers
To check the stability of the amplified regions in the absence of selection pressure, the six selected mutants were serially subcultured in LB broth without CTX for ten times (100 generations). As shown in Figure 3, the blaCMY−2 copy numbers drastically decreased in all isolates. Strain 25-6 showed approximately 80% decrease in the copy number in the first subculture. Subsequently, the copy number continuously decreased during the serial subculture, and finally reached a value of 3.0. The copy numbers of the other five strains ranged from 0.8 to 2.9 at 100 generations.
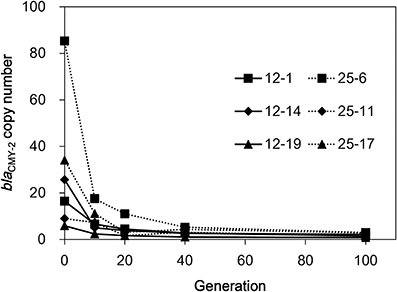
Figure 3. The blaCMY−2 copy number reduction in the six selected mutants in the course of serial subculture without antimicrobials.
Identification of Mutations by Short-Read Mapping
In the six selected mutants, no mutations were found in blaCMY−2, or its promoter region. Furthermore, no point mutations were observed among the mutants' whole-genome sequences, except for three non-synonymous mutations listed in Table S4. We observed a 51-kb deletion [nucleotide (nt) position 1763615–1814713] of chromosomal DNA in strain 25-17, although the XbaI and FseI restriction sites were not affected by these mutations.
Localization of blaCMY−2 by Southern Hybridization Analysis
The parent strain, L-3553, harbors a 133-kb plasmid, pST3553, which is a derivative of S. Typhimurium specific virulence plasmid and does not contain blaCMY−2 gene (Sekizuka et al., 2014). In some of the mutants, one or multiple plasmids with sizes larger than the original were observed. Estimation by S1 nuclease-PFGE indicated that the size of the plasmids varied from 255 to 660 kb (Table 1). Southern hybridization analysis revealed that blaCMY−2 and the virulence plasmid specific gene, spvB, were both present in the larger plasmids. In all strains tested, blaCMY−2 signal was also present in the largest band, which is originated from the chromosome (Figure 4A). spvB signals in the largest band seemed a non-specific one, because we observed the signal even in the parent strain L-3553.
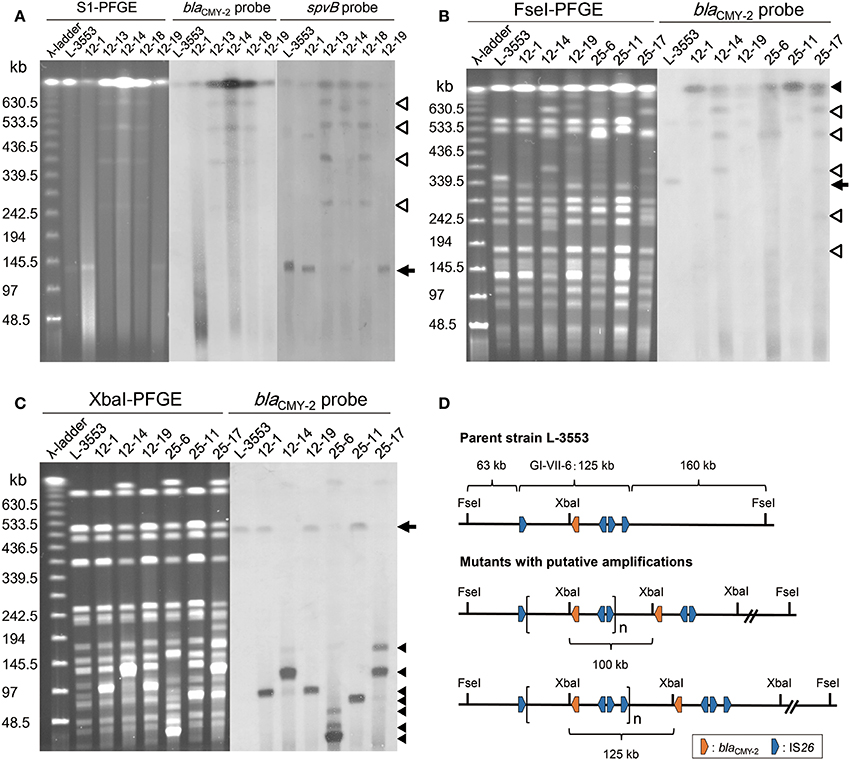
Figure 4. PFGE–Southern hybridization images demonstrating blaCMY−2 and spvB locations in S. Typhimurium strains. (A) PFGE separation of S1 nuclease-digested genomic DNA from the selected strains followed by Southern hybridization with probes specific to blaCMY−2 and spvB. An arrow indicates the position of the endogenous 133-kb plasmid, in which the spvB signal was detected. Open triangles indicate the positions of enlarged plasmids, in which both blaCMY−2 and spvB signals were detected. Both signals were observed in multiple plasmid bands in strains 12-13, 12-14, and 12-18. (B) PFGE separation of FseI-digested genomic DNA from the selected strains followed by Southern hybridization with a blaCMY−2 probe. An arrow indicates the original position of the restricted fragment (350 kb) in which the chromosomal blaCMY−2 signal was detected. In the selected mutants, this fragment was not present and the blaCMY−2 signal was identified on the largest band as indicated by a closed trangle. Open triangles indicate the position of enlarged plasmid observed in strains 12-14, 25-6, and 25-17. (C) PFGE separation of XbaI-digested genomic DNA from the selected strains followed by Southern hybridization with a blaCMY−2 probe. An arrow indicates the original position of the restricted fragment (520 kb) in which chromosomal blaCMY−2 signal was detected. Closed triangles indicate the position of blaCMY−2 signals that originated from tandemly amplified GI-VII-6. (D) Restriction maps of the GI-VII-6 and its flanking region in the parent strain L-3553 and the mutants with putative amplifications. One putative amplified region presented is flanked by the first and the third copies of IS26 (upper), and the other is flanked by the first and the fourth copies of IS26 (lower). These amplified regions generate 100-kb (upper) and 125-kb (lower) fragments after XbaI digestion, respectively.
To demonstrate the amplification of blaCMY−2 at the original chromosomal position, we performed additional PFGE–Southern hybridization analyses with a blaCMY−2 probe using FseI-digested genomic DNA of the six selected mutants. As GI-VII-6 does not contain an FseI site, it was located in its entirety in a 350-kb band in L-3553 (Figures 4B,D). This band was not present in the genomic DNA extracted from the mutants. A blaCMY−2 probe was found to hybridize with the largest band originating from the chromosome in the selected mutants. Additional blaCMY−2 signals originating from enlarged plasmids were observed in strains 12-14, 25-6, and 25-17. As the endogenous pST3553 plasmid contains one FseI site, the sizes of the blaCMY−2-positive bands corresponded to those of the enlarged plasmids.
Because GI-VII-6 contains one XbaI site (nt 1037120–1037125) (Shahada et al., 2011), tandemly arrayed GI-VII-6 sequences should generate multiple copies of a specific sized fragment after XbaI digestion (Figure 4D). As shown in Figure 4C, we observed several bands of different sizes, which were not found in the parent strain, after separation of XbaI-digested genomic DNA of the selected mutants by PFGE. Most of them were approximately 30–125 kb in size and showed higher fluorescence intensity compared to the other bands. In subsequent Southern hybridization analysis, blaCMY−2 signal was observed in these bands. The sizes of the bands that showed the prominent blaCMY−2 signal were approximately 100, 125, 100, 30, 80, and 110 kb in strains 12-1, 12-14, 12-19, 25-6, 25-11, and 25-17, respectively. In strain 25-6, additional weaker signals were observed in the bands of approximately 40 and 85 kb in size. An additional weaker signal was also observed in a 180-kb band in strain 25-17.
Estimation of Plasmid Copy Number by Short-Read Mapping
To estimate the plasmid copy number in the parent and each mutant, the mean coverage of the pST3553 plasmid was divided by that of the chromosome. The plasmid copy numbers of strains L-3553, 12-1, 12-14, 12-19, 25-6, 25-11, and 25-17 were estimated as 1.6, 2.3, 5.2, 2.7, 4.7, 1.9, and 7.1, respectively. Three strains with a blaCMY−2 copy number greater than 25 (12-14, 25-6, and 25-17) showed higher plasmid copy numbers.
Identification of the Amplified Region by Short-Read Mapping
The results of the short-read mapping showed that the mean coverage of the chromosomal genes (background) in the six selected mutants ranged from 20.7 to 61.1 (Table S3). In this study, regions showing a mean coverage that is greater than five times higher than the background were regarded as amplified regions. As shown in Figure 5, coverage of the entire or a part of GI-VII-6 was higher than other regions in the six selected mutants. The amplified regions of strains 12-1, 12-14, and 12-19 were flanked by directly repeated copies of IS26. The end points of the amplified regions in strains 12-1 and 12-19 were the first and third copies of IS26 (nt positions 983123–983942 and 1082604–1083423, respectively) from the 5′-end of GI-VII-6. The size of the amplified regions was 100 kb. In strain 12-14, the end point of the amplified region was the first and fourth (nt position 1107425–1108244) copies of IS26.
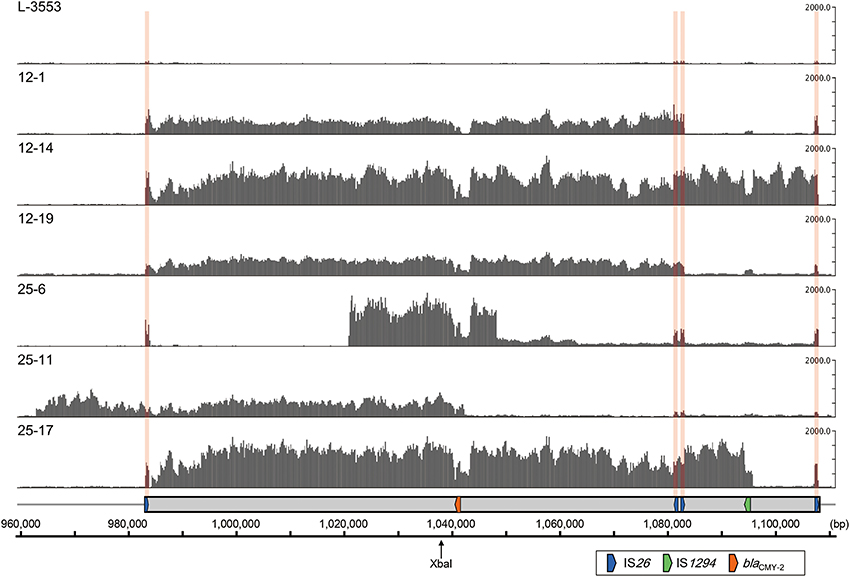
Figure 5. Coverage of short-reads obtained from S. Typhimurium L-3553 and the six mutants (DDBJ Sequence Read Archive; accession number DRA001681) on the GI-VII-6 sequence of strain L-3553 (DDBJ accession number AP014565). In each row, the y-axis shows the coverage of the short-reads. The ruler at the bottom indicates the nucleotide number in the chromosome of strain L-3553. The XbaI restriction site is indicated by a slim arrow. The gray rectangle indicates the location of GI-VII-6. The colored arrows indicate the location of key genes as explained in the open rectangle. The locations of IS26 are indicated by pink vertical bands. Short reads originated from IS26 are mapped to one of four copies of IS26 in GI-VII-6 randomly.
In contrast, we could not identify directly repeated sequences at the ends of the amplified regions in strains 25-6, 25-11, and 25-17. The amplified regions in strain 25-6 started from an intergenic region between STL3553_c09800 and STL3553_c09810 (nt position 1021052) and terminated at an intergenic region between STL3553_c10000 and STL3553_c10010 (nt position 1048473). The mean coverage of this amplified region was 1296.9. Furthermore, in this strain, the mean coverage from downstream of the amplified region to nt position 1063378, located in the middle of gene STL3553_c10130, was 231.1, which subsequently decreased to 102.5 until just before the fourth copy of IS26. These data suggest the existence of three different amplified regions [nt positions 1021052–1048473 (27 kb), 1021052–1063378 (42 kb), and 1021052–1108244 (87 kb)] sharing a portion of GI-VII-6 sequence. In strain 25-11, the 5′-end of the amplified region started from 21 kb upstream of the 5′-end of GI-VII-6 (nt position 962959) and terminated at the middle of ISEcp1 (nt position 1042417) within GI-VII-6, which accounted for a size of 80 kb. The coverage dropped sharply in the middle of ISEcp1, while it was still higher by several times than the background until the 5′-end of the ISEcp1 inverted repeat (nt position 1043519) (Figure S1). In strain 25-17, high mean coverage of 1269.7 was observed from an intergenic region between STL3553_c09480 and STL3553_c09490 (nt position 984235) to the 3′-end of IS1294 (nt position 1096148), which accounted for a size of 112 kb. (Figure S1). The sizes of these amplified regions in each mutant corresponded to those of the bands that showed the prominent or weaker blaCMY−2 signals (Figure 4C). Among the blaCMY−2 signals observed in Figure 4C, the origin of the 180-kb signal was not identified in this study.
DNA Sequence of the Junction Region
To determine the DNA sequence of the junction of the amplified region, we performed DNA sequencing of the PCR products. Location of each primer to amplify the junction region of strains 12-1, 12-14, 12-19, 25-6, and 25-11 is indicated in Figure S2. In strains 12-1, 12-14, and 12-19, the location of IS26 at the junction was confirmed. In addition, we confirmed the location of IS26 at the junctions of three different amplified regions in strain 25-6. The location of IS1 at the junction of amplified region was also confirmed in strain 25-11 (see Figure S3). We could not successfully amplify the junction region in strain 25-17.
Discussion
The present study demonstrates that increased cephalosporin resistance of S. Typhimurium harboring GI-VII-6 under CTX selection pressure is mainly based on the increased copy number of blaCMY−2 gene by GDA mechanisms. This conclusion is elicited from the following evidence. First, the mean coverage of the entire or a part of GI-VII-6 was greater than five times higher than that of other chromosomal regions (Table S3). Second, blaCMY−2-positive fragments that were 30–125 kb in size were observed after XbaI digestion of the genomic DNA (Figure 4C), suggesting a tandem array of the amplified regions. In addition, a blaCMY−2-positive chromosomal fragment of 350 kb in size was lost and a fragment of larger size appeared after FseI digestion by Southern hybridization analysis (Figure 4B), indicating that amplification occurred at the original position. Third, increased copy number of blaCMY−2 was accompanied by increased amount of transcription (Figure 2). Fourth, the blaCMY−2 copy number drastically decreased in the course of serial subculture without selection pressure (Figure 3). Lastly, the frequency of the spontaneous-mutants selection was 10−6 and 10−8 on 12.5 and 25 mg/L CTX-containing plates, respectively. These frequencies are similar to those reported in previous GDA studies and appear to be higher than those of point mutations. Above-mentioned characteristics are in concordance with those of GDA mechanisms reported previously (Andersson and Hughes, 2009; Sandegren and Andersson, 2009).
Two major mechanisms have been proposed that can increase gene copy number. One is the homologous and/or non-homologous recombination based replication and the other is rolling circle replication (Andersson and Hughes, 2009; Sandegren and Andersson, 2009). The initial step of the former mechanism is duplication either through non-equal homologous recombination between directly oriented repeats or through RecA-independent mechanisms between short- or no-homology regions. Following duplication, higher level amplification can occur as a result of RecA-dependent recombination between the tandem repeats generated by the initial duplication. Alternatively, no duplication intermediates are required in the rolling circle replication; a double-strand break allows single-strand invasion at a homologous or micro-homologous region, followed by amplification. Compared to non-equal homologous recombination, rolling circle replication can generate a large tandem array in a single generation (Sandegren and Andersson, 2009).
In the present study, the amplified regions in the three mutants selected on 12.5 mg/L CTX-containing plates had directly oriented IS26 copies at both ends (Figure 5). The initial duplication appeared to have occurred between pre-existing IS26 copies in these strains. In contrast, we could not find any homologous sequences at both ends of the amplified regions in the remaining three strains selected on 25 mg/L CTX-containing plates by short-read mapping. However, results of our PCR and sequencing analyses suggested that IS26 was found at the junctions of the three different amplified regions in strain 25-6. Also, IS1 was found at the junction of the amplified region in strain 25-11 (Figure S3). The IS26 and/or IS1 insertions at both ends of the amplified regions may have preceded the amplification in these mutants. In strain 25-6, we observed three prominent blaCMY−2 signals in Xba I-restricted fragments less than 100 kb in size (Figure 4C), suggesting these regions were amplified at different loci in the genome. Transposition of the blaCMY−2-containing region flanked by directly repeated IS26 copies may have preceded the amplification in this mutant. This signifies that the amplification site is not exclusively in the original position. Because the parent strain contains four copies each of the IS26 and IS1 transposases (Sekizuka et al., 2014), these insertion sequences may transpose in the parent strain with a relatively high frequency. Reams et al. (2012) reported that 97% of duplication events resulted from recombination between IS3 among non-selectively trapped 1800 spontaneous lac duplications, and that the formation of the duplications was stimulated by IS3 transposase and plasmid transfer functions (TraI). As GI-VII-6 contains traI, the multiple copies of IS26, IS1, and traI may increase the duplication frequency mediated by IS26 and IS1.
S. Typhimurium L-3553 harbors a 133-kb virulence and antimicrobial resistance plasmid, pST3553. We observed several plasmids larger than pST3553 in part of the spontaneous mutants. For example, the same set of four differently sized plasmids were detected in strains 12-11, 12-12, 12-13, 12-14, 12-17, and 12-18 by PFGE after S1 nuclease digestion with a size interval of 120–135 kb. We observed both blaCMY−2 and spvB signals in most plasmids (Figure 2), suggesting that these plasmids were cointegrates of the endogenous plasmids with different copies of GI-VII-6. We obtained E. coli transformant harboring the plasmid from strain 12-18. Results of PCR scanning to check the structure of GI-VII-6 (Shahada et al., 2011) revealed that the enlarged plasmid contained the entire GI-VII-6 sequence (data not shown). We thus concluded that the enlarged plasmids were generated by the transposition of GI-VII-6 into pST3553. The size of the plasmid is 38 times smaller than that of the chromosome. However, pST3553 shares several homologous regions with GI-VII-6 (Sekizuka et al., 2014). The regions would increase the frequency of integration of the GI-VII-6 into the plasmid mediated by homologous recombination. In addition, the plasmid copy number in the six selected strains was 1.4 to 4.4 times higher than that of the parent strain. Especially, strains with higher copy numbers of blaCMY−2 (12-14, 25-6, and 25-17) harbored enlarged plasmids and expressed higher copy numbers of plasmid. With the exception of the three non-synonymous mutations (Table S4), we could not detect any mutations among the genomic DNA of the selected mutants. Thus, these results may be due to the copy-number variation of the plasmid and selection of cells with higher copy-number of the plasmid under the selection pressure. These data suggest that transposition and amplification of the blaCMY−2-containing region, along with the copy number variation of the enlarged plasmid, contributed to the extensive amplification of blaCMY−2.
We showed that spontaneous mutants can be selected at CTX concentration marginally above the MIC. No mutants were detected on 50 and 100 mg/L CTX-containing plates, suggesting that GDA is amenable to the mutant selection window (MSW) theory (Drlica and Zhao, 2007). The MSW theory postulates that antimicrobial-resistant mutant subpopulations present before the initiation of antimicrobial treatment are enriched and amplified during the therapy when the antimicrobial concentrations remain in a specific range, the MSW. The upper boundary of the MSW is the minimum concentration that can inhibit the growth of all types of single mutants, called mutant prevention concentration (MPC). As duplication of any specific bacterial gene occurs at a high rate (10−3–10−5/cell/division) (Anderson and Roth, 1981; Reams et al., 2010), overnight culture of the parent strain should comprise a certain number of mutants with duplications mediated by IS26 or IS1. These mutants may be enriched in the presence of CTX after amplification of the blaCMY−2-containing region with directly repeated copies of IS26 or IS1 at both ends. Although effective amplification may contribute to resistance against higher concentrations of CTX, there must be a limit, i.e., an increase in the genome poses a fitness cost to the host (Nilsson et al., 2006; Reams et al., 2010). In fact, we observed a drastic reduction in the blaCMY−2 copy number in the course of serial subculture without selection pressure.
Taken together, we conclude that GI-VII-6 amplification occurred at the original position, while it also transposed to other genomic locations, including an endogenous plasmid in some of the mutants. Insertion sequences played important roles in the transposition and amplification of blaCMY−2 containing regions. The copy-number variation in the blaCMY−2-positive plasmid partially contributed to the extensive amplification of blaCMY−2 in some of the mutants. In addition, the selection frequency of mutants with gene amplification was higher than that of typical mutations, suggesting that gene amplification is one of the adaptive mechanisms that occur prior to acquiring additional mutations in order to facilitate antimicrobial resistance.
Conflict of Interest Statement
The authors declare that the research was conducted in the absence of any commercial or financial relationships that could be construed as a potential conflict of interest.
Acknowledgments
This work was supported by the Japan Society for the Promotion of Science, a Grant-in-Aid for Scientific Research (C), 2013–2015 (25460553).
Supplementary Material
The Supplementary Material for this article can be found online at: http://www.frontiersin.org/journal/10.3389/fmicb.2015.00078/abstract
References
Anderson, P., and Roth, J. (1981). Spontaneous tandem genetic duplications in Salmonella typhimurium arise by unequal recombination between rRNA (rrn) cistrons. Proc. Natl. Acad. Sci. U.S.A. 78, 3113–3117. doi: 10.1073/pnas.78.5.3113
Pubmed Abstract | Pubmed Full Text | CrossRef Full Text | Google Scholar
Andersson, D. I., and Hughes, D. (2009). Gene amplification and adaptive evolution in bacteria. Annu. Rev. Genet. 43, 167–195. doi: 10.1146/annurev-genet-102108-134805
Pubmed Abstract | Pubmed Full Text | CrossRef Full Text | Google Scholar
Bonnet, R. (2004). Growing group of extended-spectrum β-lactamases: the CTX-M enzymes. Antimicrob. Agents Chemother. 48, 1–14. doi: 10.1128/AAC.48.1.1-14.2004
Pubmed Abstract | Pubmed Full Text | CrossRef Full Text | Google Scholar
Clinical and Laboratory Standards Institute. (2008). Performance Standards for Antimicrobial Disk and Dilution Susceptibility Test for Bacteria Isolated from Animals, 3rd Edn., Approved Standard M31-A3. Wayne, PA: Clinical and Laboratory Standards Institute.
Drlica, K., and Zhao, X. L. (2007). Mutant selection window hypothesis updated. Clin. Infect. Dis. 44, 681–688. doi: 10.1086/511642
Pubmed Abstract | Pubmed Full Text | CrossRef Full Text | Google Scholar
Hohmann, E. L. (2001). Nontyphoidal salmonellosis. Clin. Infect. Dis. 32, 263–269. doi: 10.1086/318457
Pubmed Abstract | Pubmed Full Text | CrossRef Full Text | Google Scholar
Jacoby, G. A. (2009). AmpC β-lactamases. Clin. Microbiol. Rev. 22, 161–182. doi: 10.1128/CMR.00036-08
Pubmed Abstract | Pubmed Full Text | CrossRef Full Text | Google Scholar
Li, H., and Durbin, R. (2010). Fast and accurate long-read alignment with Burrows-Wheeler transform. Bioinformatics 26, 589–595. doi: 10.1093/bioinformatics/btp698
Pubmed Abstract | Pubmed Full Text | CrossRef Full Text | Google Scholar
Li, H., Handsaker, B., Wysoker, A., Fennell, T., Ruan, J., Homer, N., et al. (2009). The Sequence Alignment/Map format and SAMtools. Bioinformatics 25, 2078–2079. doi: 10.1093/bioinformatics/btp352
Pubmed Abstract | Pubmed Full Text | CrossRef Full Text | Google Scholar
Mead, P. S., Slutsker, L., Griffin, P. M., and Tauxe, R. V. (1999). Food-related illness and death in the United States reply to Dr. Hedberg. Emerg. Infect. Dis. 5, 841–842. doi: 10.3201/eid0506.990625
Pubmed Abstract | Pubmed Full Text | CrossRef Full Text | Google Scholar
Michael, G. B., Butaye, P., Cloeckaert, A., and Schwarz, S. (2006). Genes and mutations conferring antimicrobial resistance in Salmonella: an update. Microbes Infect. 8, 1898–1914. doi: 10.1016/j.micinf.2005.12.019
Pubmed Abstract | Pubmed Full Text | CrossRef Full Text | Google Scholar
Nilsson, A. I., Zorzet, A., Kanth, A., Dahlstrom, S., Berg, O. G., and Andersson, D. I. (2006). Reducing the fitness cost of antibiotic resistance by amplification of initiator tRNA genes. Proc. Natl. Acad. Sci. U.S.A. 103, 6976–6981. doi: 10.1073/pnas.0602171103
Pubmed Abstract | Pubmed Full Text | CrossRef Full Text | Google Scholar
Peirson, S. N., Butler, J. N., and Foster, R. G. (2003). Experimental validation of novel and conventional approaches to quantitative real-time PCR data analysis. Nucleic Acids Res. 31:e73. doi: 10.1093/nar/gng073
Pubmed Abstract | Pubmed Full Text | CrossRef Full Text | Google Scholar
Phillips, I., Casewell, M., Cox, T., De Groot, B., Friis, C., Jones, R., et al. (2004). Does the use of antibiotics in food animals pose a risk to human health? A critical review of published data. J. Antimicrob. Chemother. 53, 28–52. doi: 10.1093/jac/dkg483
Pubmed Abstract | Pubmed Full Text | CrossRef Full Text | Google Scholar
R Core Team. (2013). R: A Language and Environment for Statistical Computing. Vienna: R Foundation for Statistical Computing. Available online at: http://www.r-project.org/
Reams, A. B., Kofoid, E., Kugelberg, E., and Roth, J. R. (2012). Multiple pathways of duplication formation with and without recombination (RecA) in Salmonella enterica. Genetics 192, 397–415. doi: 10.1534/genetics.112.142570
Pubmed Abstract | Pubmed Full Text | CrossRef Full Text | Google Scholar
Reams, A. B., Kofoid, E., Savageau, M., and Roth, J. R. (2010). Duplication frequency in a population of Salmonella enterica rapidly approaches steady state with or without recombination. Genetics 184, 1077–1094. doi: 10.1534/genetics.109.111963
Sandegren, L., and Andersson, D. I. (2009). Bacterial gene amplification: implications for the evolution of antibiotic resistance. Nat. Rev. Microbiol. 7, 578–588. doi: 10.1038/nrmicro2174
Pubmed Abstract | Pubmed Full Text | CrossRef Full Text | Google Scholar
Sekizuka, T., Lee, K., Kuroda, M., Kusumoto, M., Iwata, T., Uchida, I., et al. (2014). Whole genome sequence of CMY-2 β-lactamase-producing Salmonella enterica serovar Typhimurium strain L-3553. Genome Announc. 2, 4. doi: 10.1128/genomeA.00711-14
Pubmed Abstract | Pubmed Full Text | CrossRef Full Text | Google Scholar
Shahada, F., Sekizuka, T., Kuroda, M., Kusumoto, M., Ohishi, D., Matsumoto, A., et al. (2011). Characterization of Salmonella enterica serovar Typhimurium isolates harboring a chromosomally encoded CMY-2 β-lactamase gene located on a multidrug resistance genomic island. Antimicrob. Agents Chemother. 55, 4114–4121. doi: 10.1128/AAC.00560-11
Pubmed Abstract | Pubmed Full Text | CrossRef Full Text | Google Scholar
Tamada, Y., Nakaoka, Y., Nishimori, K., Doi, A., Kumaki, T., Uemura, N., et al. (2001). Molecular typing and epidemiological study of Salmonella enterica serotype Typhimurium isolates from cattle by fluorescent amplified-fragment length polymorphism fingerprinting and pulsed-field gel electrophoresis. J. Clin. Microbiol. 39, 1057–1066. doi: 10.1128/JCM.39.3.1057-1066.2001
Pubmed Abstract | Pubmed Full Text | CrossRef Full Text | Google Scholar
Tamamura, Y., Uchida, I., Tanaka, K., Okazaki, H., Tezuka, S., Hanyu, H., et al. (2011). Molecular epidemiology of Salmonella enterica serovar Typhimurium isolates from cattle in Hokkaido, Japan: evidence of clonal replacement and characterization of the disseminated clone. Appl. Environ. Microbiol. 77, 1739–1750. doi: 10.1128/AEM.01910-10
Pubmed Abstract | Pubmed Full Text | CrossRef Full Text | Google Scholar
Keywords: resistance, genomic island, insertion sequence, gene duplication and amplification, Salmonella enterica serovar Typhimurium
Citation: Lee K, Kusumoto M, Sekizuka T, Kuroda M, Uchida I, Iwata T, Okamoto S, Yabe K, Inaoka T and Akiba M (2015) Extensive amplification of GI-VII-6, a multidrug resistance genomic island of Salmonella enterica serovar Typhimurium, increases resistance to extended-spectrum cephalosporins. Front. Microbiol. 6:78. doi: 10.3389/fmicb.2015.00078
Received: 29 October 2014; Accepted: 21 January 2015;
Published online: 10 February 2015.
Edited by:
Kunihiko Nishino, Osaka University, JapanReviewed by:
Brian Brunelle, United States Department of Agriculture, USAVivi Miriagou, Hellenic Pasteur Institute, Greece
Copyright © 2015 Lee, Kusumoto, Sekizuka, Kuroda, Uchida, Iwata, Okamoto, Yabe, Inaoka and Akiba. This is an open-access article distributed under the terms of the Creative Commons Attribution License (CC BY). The use, distribution or reproduction in other forums is permitted, provided the original author(s) or licensor are credited and that the original publication in this journal is cited, in accordance with accepted academic practice. No use, distribution or reproduction is permitted which does not comply with these terms.
*Correspondence: Masato Akiba, Bacterial and Parasitic Disease Research Division, National Institute of Animal Health, 3-1-5 Kannondai, Tsukuba, Ibaraki 305-0856, Japan e-mail: akiba@affrc.go.jp;
Takashi Inaoka, Food Biotechnology Division, National Food Research Institute, 2-1-12 Kannondai, Tsukuba, Ibarali 305-8642, Japan e-mail: tina2672@affrc.go.jp