Optical recording of neuronal activity with a geneticallyencoded calcium indicator in anesthetized and freely moving mice
1
Department of Neurophysiology, Brain Research Institute, University of Zurich, Zurich, Switzerland
2
Department of Physiology, University of Bern, Bern, Switzerland
3
Behavioral Neurophysiology Laboratory, Brain Science Institute, RIKEN, Wako, Saitama, Japan
4
Department of Molecular Neurobiology, Max Planck Institute for Medical Research, Heidelberg, Germany
5
Department of Psychiatry, Central Institute for Mental Health, Mannheim, Germany
6
Department of Cell Biology and Morphology, University of Lausanne, Lausanne, Switzerland
7
University of Göttingen Medical School, Göttingen, Germany
8
Laboratory for Cell Function Dynamics, Brain Science Institute, RIKEN, Wako, Saitama, Japan
9
Research Institute for Electronic Science, Hokkaido University, Hokkaido, Japan
Fluorescent calcium (Ca2+) indicator proteins (FCIPs) are promising tools for functional imaging of cellular activity in living animals. However, they have still not reached their full potential for in vivo imaging of neuronal activity due to limitations in expression levels, dynamic range, and sensitivity for reporting action potentials. Here, we report that viral expression of the ratiometric Ca2+ sensor yellow cameleon 3.60 (YC3.60) in pyramidal neurons of mouse barrel cortex enables in vivo measurement of neuronal activity with high dynamic range and sensitivity across multiple spatial scales. By combining juxtacellular recordings and two-photon imaging in vitro and in vivo, we demonstrate that YC3.60 can resolve single action potential (AP)-evoked Ca2+ transients and reliably reports bursts of APs with negligible saturation. Spontaneous and whisker-evoked Ca2+ transients were detected in individual apical dendrites and somata as well as in local neuronal populations. Moreover, bulk measurements using wide-field imaging or fiber-optics revealed sensory-evoked YC3.60 signals in large areas of the barrel field. Fiber-optic recordings in particular enabled measurements in awake, freely moving mice and revealed complex Ca2+ dynamics, possibly reflecting different behavior-related brain states. Viral expression of YC3.60 – in combination with various optical techniques – thus opens a multitude of opportunities for functional studies of the neural basis of animal behavior, from dendrites to the levels of local and large-scale neuronal populations.
Neuronal circuits are organized at diverse spatial scales, from sub-cellular compartments such as dendrites to local neuronal populations to whole brain areas. For understanding how information is encoded in neuronal circuits, it is essential to record activity from a large number of neurons in living and, preferably, in freely moving animals. Advanced in vivo fluorescence staining and imaging techniques, in particular using fluorescent Ca2+ indicators, permit functional studies of neuronal activity in the living brain across all spatial scales (Helmchen and Denk, 2005
; Kerr and Denk, 2008
; Grewe and Helmchen, 2009
; Wilt et al., 2009
). Because action potentials induce Ca2+ transients in soma and dendrites via opening of voltage-gated Ca2+ channels (Markram and Sakmann, 1994
; Helmchen et al., 1996
), neuronal spiking activity can be inferred from the fluorescence measurements. Loading of synthetic Ca2+ indicators into cells by patch-pipettes has enabled high-resolution Ca2+ measurements from single neurons and their dendrites by in vivo two-photon imaging (Svoboda et al., 1997
; Helmchen et al., 1999
; Waters et al., 2003
). Probing of neuronal network activity in vivo became possible by a multi-cell bolus loading technique with membrane-permeant Ca2+ indicators (Stosiek et al., 2003
; Kerr et al., 2005
), enabling for example the study of the functional organization of sensory-evoked neuronal population responses in the rodent barrel cortex (Kerr et al., 2007
; Sato et al., 2007
). In addition, large-scale measurements of regional activation (without cellular resolution) can be performed by single-photon excitation and wide-field epifluorescence imaging (Berger et al., 2007
) or fiber-optic bulk recording (Adelsberger et al., 2005
). A great advantage of the latter approach is that it permits measurements in awake and freely moving animals (Murayama et al., 2007
; Murayama and Larkum, 2009a
; Murayama et al., 2009
). In spite of their strengths, synthetic Ca2+ indicators have disadvantages and limitations. In particular, they cannot label specific subpopulations of cells and subcellular compartments. Moreover, synthetic dye loading is not stable over time and potentially damaging to the brain tissue, limiting the duration of imaging to a few hours.
Genetically encoded fluorescent Ca2+ indicator proteins (FCIPs, Miyawaki et al., 2005
; Palmer and Tsien, 2006
; Hires et al., 2008
; Mank and Griesbeck, 2008
) allow for long-term, cell-type specific imaging of neural activity in living animals. Following the introduction of the first Ca2+-sensitive protein indicator ‘cameleon’ over a decade ago (Miyawaki et al., 1997
), great progress has been made in developing improved FCIPs for functional expression in the mammalian brain (Hasan et al., 2004
; Nagai et al., 2004
; Heim et al., 2007
; Mank et al., 2008
; Wallace et al., 2008
; Tian et al., 2009
). First generations of ‘yellow cameleons’ (YC) showed functional responses in cultured mammalian cells and in invertebrates but their performance in mammalian neurons in an intact tissue was disappointing (Hasan et al., 2004
), possibly due to (a) poor fluorescence-resonance-energy-transfer (FRET) efficiency in response to Ca2+ increases and (b) potential interaction of Ca2+ sensing domains in YCs with cellular targets. Subsequently, the use of a circular permuted Venus 173 variant (cpVenus 173) as a yellow fluorescent protein (YFP) FRET partner of cyano fluorescent protein (CFP) produced a YC sensor, yellow cameleon 3.60 (YC3.60), that showed efficient FRET responses with a large dynamic range in cuvette and also in cultured HeLa cells (Nagai et al., 2004
). Moreover, to reduce interaction of Ca2+ sensing modules with cellular targets, mutant CaM/M13 pairs and the skeletal muscle specific Ca2+ sensing protein troponin were used to engineer novel FCIPs, D3cpv (Palmer et al., 2006
) and TN-XXL (Mank et al., 2008
), respectively. In D3cpv, cpVenus 173 was used with CFP while in TN-XXL a circular permuted Citrine 174 was used with CFP. All three FCIPs, YC3.60 (Nagai et al., 2004
; Kuchibhotla et al., 2008
), D3cpv (Palmer et al., 2006
; Wallace et al., 2008
) and TN-XXL (Mank et al., 2008
) have been shown to be functional in vivo. Unlike for D3cpv and TN-XXL, however, functional characterization of YC3.60 has remained incomplete. Since these three FCIPs have the circular permuted YFP variants, cpVenus173 (YC3.60 and D3cpv) and cpCitrine 174 (TN-XXL), as a key feature in common, it appeared promising to further examine the suitability of YC3.60 for in vivo imaging of neural activity and deploy recombinant adeno-associated viruses (rAAVs) as a method of gene delivery that has been successfully applied in previous studies (Wallace et al., 2008
; Tian et al., 2009
).
Here, we report that viral expression of YC3.60 in the mouse barrel cortex allows in vivo measurements of spontaneous and whisker-evoked neuronal activity with high sensitivity and dynamic range. In combination with two-photon microscopy, YC3.60 permits Ca2+ measurements from individual apical dendrites of cortical neurons as well as from small populations of neurons. Moreover, we demonstrate that YC3.60 Ca2+ signals in barrel cortex can be read out in a bulk fashion, in particular through an optical fiber, which enables optical recording of neocortical activity during behavior in freely moving mice. Based on the excellent in vivo performance of virally-expressed YC3.60, we propose it as a sensitive and versatile tool for optical studies of brain function.
All experiments were performed in accordance with the animal welfare guidelines of the Max Planck Society and the guidelines of the Federal Veterinary Office of Switzerland, respectively. All experimental procedures were approved by the local authorities (Regierungspräsidium Karlsruhe and Cantonal Veterinary Offices in Zurich and Bern, respectively).
AAV-Mediated Gene Transfer into Mouse Neocortex
rAAV equipped with YC3.60 under control of a human synapsin promoter (Figure 1
A) was co-transfected with pDp1, pDp2 (ratio: 3:1) helper plasmids in HEK293 cells (Hasan et al., 2004
; Wallace et al., 2008
). Seventy-two hours after transfection, HEK293 cells were collected and packaged viruses were released by repeated freeze-and-thaw on dry-ice-ethanol bath. Viruses were purified first on the iodixanol gradient and later by pre-casted 1 ml Heparin columns (Amersham) using FPLC (Kügler et al., 2007
). Infectious virus titers were determined in primary neuron cultures and was 3 × 10⁸ transducing units per microliter. Before virus injection, 6–8 weeks old BL/C57 mice were anesthetized with ketamine plus xylazine by intraperitoneal injection (ketamine, 80 mg per kilogram body weight; xylazine, 10–16 mg/kg). Viruses (200–300 nl) were delivered through thin glass pipettes (tip size 8–12 μm) at a depth of about 250 μm to the whisker-related somatosensory cortex (L2/3) by stereotaxic injection (Hasan et al., 2004
; Wallace et al., 2008
). To facilitate intraparenchymal administration we included 20% hypertonic D-mannitol in the solution (Mastakov et al., 2001
). Infected animals were kept for at least 21 days before imaging or analysis of brain tissues.
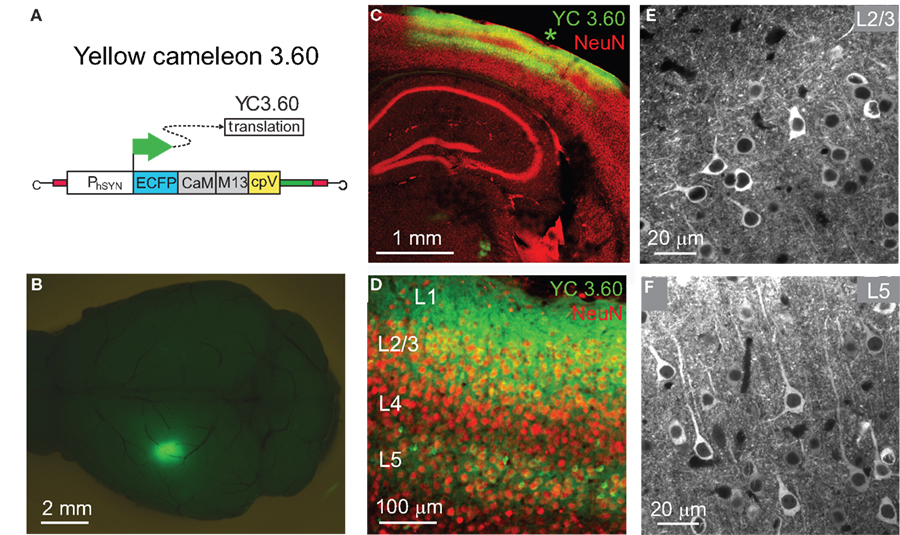
Figure 1. AAV-delivered expression of YC3.60 in mouse neocortex. (A) A recombinant adeno-associated virus with the human synapsin promoter (PhSYN) drives expression of YC3.60. (B) Dorsal view of a fixed mouse brain 4 weeks following stereotactic AAV-injection showing YC3.60 expression as a bright YFP fluorescence spot in barrel cortex in the left hemisphere. (C) Confocal image of a coronal section showing the expression pattern surrounding the injection site (asterisk) in a different brain together with NeuN counterstain. Dense YC3.60 labeling of cortical neurons is observed preferentially in L2/3 and L5. (D) A magnified view on the neocortical layers reveals that a large fraction of neurons (red) in L2/3 is also labeled with YC3.60. (E,F) Two-photon images of YFP fluorescence in fixed brain slices showing YC3.60 labeling of somata excluding the nucleus as well as of dendrites in L2/3 and in L5 neurons, respectively.
Tissue Fixation and Immunohistochemistry
Mouse brains were fixed for a few hours in 4% paraformaldehyde and YFP fluorescence was visualized as a bright spot at the virus-injection site using a stereomicroscope (SV11; Zeiss) (Figure 1
B). Brains were coronally sliced to a thickness of 75–100 μm using a vibratome (VT 1000S; Leica Instruments). Slices were counterstained for neuron-specific marker, NeuN, using a mouse anti-neuronal nuclei (NeuN) monoclonal antibody (1:1,000 dilution) (Millipore) and a Cy3-conjugated goat anti-mouse IgG (1:200 dilution; Jackson Immuno Research laboratories). Green (GFP) and red (Cy3) fluorescence were visualized with the Zeiss LSM 5 Pascal laser scanning confocal imaging system equipped with GFP filters.
Ca2+ Imaging and Electrophysiology in Slice Cultures
Organotypic hippocampal slices were prepared as previously described (Stoppini et al., 1991
) and superfused during recording at room temperature with artificial CSF (ACSF; Biometra) containing (in mM): 125 NaCl, 25 NaHCO3, 2.5 KCl, 1.25 NaH2PO4, 1 MgCl2, 2 CaCl2, 25 Glucose, saturated with 95% O2/5% CO2. Loose patch-clamp recordings were performed from CA3 pyramidal cells with ACSF-filled pipettes (50–100 MΩ). Cell spiking was elicited by monopolar electrical stimulation delivered at a rate of <0.1 Hz with an ACSF-filled glass pipette placed in the region of the apical dendrites (stratum lucidum or stratum radiatum). Multiple spikes were generated by varying the number of electrical stimuli delivered at 100 Hz. Electrophysiological signals were acquired with a software-controlled patch-clamp amplifier (EPC-9, Pulse 8.11; Heka Elektronik). For the in vitro characterization of YC3.60 we used hippocampal neurons because hippocampal slice cultures are routinely available in the lab. Neocortical and hippocampal neurons are known to exhibit very similar AP-evoked Ca2+ signaling (Helmchen et al., 1996
). Two-photon imaging of slice cultures was performed with a mode-locked femtosecond Ti-sapphire laser (Cameleon XR; Coherent) set at an excitation wavelength of 840 nm. Fluorescence signals were acquired with an upright laser scanning microscope (Zeiss LSM 510 NLO) equipped with a 63× water immersion objective (NA 1.0). Frame-scan acquisition was performed from somatic regions of interest (ROIs) at a rate of 24.1 Hz. Frames typically were 30 × 27 pixels (pixel size 140 nm × 140 nm). While ROI width could vary the number of lines was kept constant to ensure the same sampling rate for all recordings.
In vivo Ca2+ Imaging and Electrophysiology
Animals were surgically prepared for in vivo imaging as described previously (Waters et al., 2003
; Nimmerjahn et al., 2004
; Wallace et al., 2008
). Briefly, mice were anesthetized with urethane (∼1.5 g/kg) and a stainless steel plate was attached to the exposed skull. For experiments combining electrophysiology and imaging the dura was carefully removed. The exposed tissue was superfused with normal rat Ringer solution (in mM: 135 NaCl, 5.4 KCl, 5 HEPES, 1.8 CaCl2, pH 7.2 with NaOH). To dampen heartbeat and breathing-induced motion, we filled the cranial window with agarose (type III-A, Sigma; 1% in NRR) and covered it with an immobilized glass coverslip. Body temperature was maintained at 37°C with the help of a heating blanket. For in vivo imaging (Figure 2
), we used a custom-built two-photon microscope with ∼100-fs laser pulses at 870 nm wavelength provided by a Ti:sapphire laser (Spectra-Physics) and a 40× water-immersion objective (NA 0.8; Olympus). CFP and YFP fluorescence were collected with blue (450–475 nm) and green (535–550 nm) emission filters (AHF AG). Frame scans were acquired at 7.81 Hz with 128 × 128 pixel resolution. Juxtacellular recordings were obtained from YC3.60-expressing L2/3 neurons with glass pipettes (5–7 MΩ) containing NRR solution and 0.025 mM Alexa-594 for pipette visualization. Neurons were visually targeted using the two-photon microscope. Action potentials were recorded in current-clamp using an Axoclamp 2-B amplifier (Axon Instruments, Molecular Devices) and digitized using software custom-written in LabView (National Instruments).
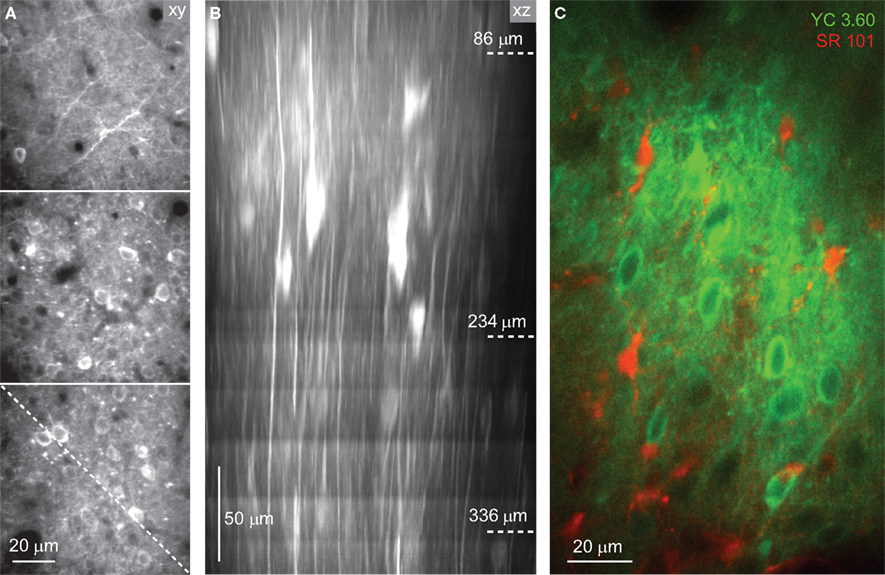
Figure 2. In vivo imaging of YC3.60-expressing neocortical neurons. (A) In vivo two-photon image stack of YC3.60-expressing neurons in mouse barrel cortex 4 weeks after AAV-injection. Three example YFP images are shown from superficial L1 (86 μm depth from pia, top), upper L2/3 (234 μm depth, middle) and deeper L2/3 (336 μm depth, bottom). Note labeled horizontal dendrites in L1 and dense labeling of somata in L2/3. (B) Vertically resliced side projection of the image stack in (A) showing apical dendrites of pyramidal neurons. Dashed line in the lower image in (A) indicates the section for vertical z-reslicing. Projection extension was about 20 μm. (C) In vivo two-photon image of neuronal YC3.60 expression (green, YFP channel) together with counterstaining of astrocytes with SR101 (red).
A commercial camera system (Optical Imaging) and custom made optics were used for wide-field recordings of single-photon excited YFP-fluorescence (excitation filter 440 nm, dichroic mirror 460 nm, emission filter 535 nm). Movies were acquired at 10 Hz from a 4.2 mm × 4.2 mm field of view (FOV) and the mean YFP-fluorescence signals from the entire FOV (expressed as relative fluorescence changes ΔF/FYFP) were analyzed during spontaneous activity and upon air-puff whisker stimulation. Control measurements using an emission filter for detecting CFP-fluorescence revealed signal decreases as expected (data not shown). Simultaneous local field potential (LFP) recordings were performed with a 16-site single shank probe (Neuronexustech) on a multichannel recording system (Cheetah, Neuralynx). The probe was inserted under visual control in the middle of the fluorescent spot and LFP signals from L2/3 were recorded.
Fiber-Optic Ca2+ Recordings
Fiber-optic recordings were performed as described previously (Murayama et al., 2007
; Murayama and Larkum, 2009b
). Briefly, eight mice (∼10 weeks old) were used in these experiments and were deeply anesthetized by isoflurane (1.5–3%, Baxter). Following surgery, an analgesic was administered (buprenorphine, twice per day; Essex Chemie) and local anesthetic (lidocaine; Sigma-Aldrich) applied to the scalp. On the day of the experiment, the head was fixed in a stereotaxic instrument (Narishige) and body temperature maintained at 36–37°C. A craniotomy was performed above the virus injected area (somatosensory barrel cortex, 1 mm diameter). In one experiment, the skull was thinned above the injected area. The dura mater remained intact. After anesthesia experiments, animals recovered for 1–2 h and were then transferred to the arena for behavioral observation and freely moving fluorescence imaging. Fixation of the fiber-optic mount to the animal’s head was performed as described previously (Murayama and Larkum, 2009b
). A blue LED (IBF + LS30ROB-3W-Slim-RX or IBF + LS30W-3W-Slim RX, Imac Co.) was used as a light source. An excitation filter (FF01-438/24-25, Semrock or D480/30x, Chroma Technology), a dichroic mirror (FF520-Di01-25x36, Semrock), and an emission filter (FF01-542/27-25, Semrock) were used for epifluorescence Ca2+ recordings. A 10x objective (Edmund Optics) was used for illuminating and imaging an optical fiber (NT57-069, NA, 0.22, core diameter of 440 μm; total diameter of 470 μm, Edmund Optics). A CCD camera (MicroMax, Roper Scientific) was used for collecting fluorescence. Sensory responses were evoked by a brief air puff (50 ms-duration) delivered to the contralateral whiskers. Fluorescence changes were sampled at 100 Hz. Data was acquired on a PC using WinView software (Roper Scientific). ROIs were chosen offline for measuring fluorescence changes (see below). Animal behavior was observed by using a CCD camera (Logitech, Japan). The video recording was acquired and stored to disk using QuickCam software (Logitech). Cadmium chloride was from Fluka.
Data Analysis
For all experiments in slices cultures as well as for in vivo two-photon imaging, Ca2+ signals were expressed as relative YFP/CFP ratio changes ΔR/R after background subtraction and further analyzed using Igor (Wavemetrics Inc.) and Matlab (Mathworks). Peak amplitudes of Ca2+ transients were determined as the mean of three sampling points around the peak location. Decay time constants were obtained from single-exponential fits. To quantify AP detection, we calculated the signal-to-noise ratio (SNR) of AP-evoked transients as the ratio of peak amplitude to SD of the unfiltered trace 750 ms prior to the first AP. Similarly, the SNR of baseline traces was computed as the ratio of peak to SD of the respective trace. The distribution of baseline SNR values was estimated by fitting a Gaussian and the detection threshold for AP-evoked transients was determined as the SNR value above which less than 5% of baseline traces would be classified as false positives (see Figure 4
E). For fiber-optic recordings, fluorescence signals were quantified by measuring the mean pixel value of a manually selected ROI for each frame of the image stack using Igor Pro (Wavemetrics) software. Ca2+ changes were expressed as ΔF/F = Ft/F0, where Ft was the average fluorescence intensity within the ROI at time t during the imaging experiment and F0 was the mean value of fluorescence intensity before stimulation.
AAV-Induced Expression of the Ca2+ Sensor YC3.60 in Mouse Barrel Cortex
YC3.60 is a genetic Ca2+ sensor based on a CFP, a Ca2+-sensitive linker, and a bright circularly permuted YFP (Nagai et al., 2004
). Here, we characterized YC3.60 as a promising candidate protein for reporting neuronal activity in the mammalian cortex in vivo. We expressed YC3.60 in mouse barrel cortex under control of a human synapsin promoter using a rAAV vector (Figure 1
A).
Three weeks or longer after stereotactic virus injection, YC3.60 expression appeared as a bright fluorescent spot with a diameter of 0.5–1 mm (Figure 1
B). Analyses of fixed brain slices showed that near the injection site a majority of cortical neurons (>80%) in layer 2/3 (L2/3) and L5 were fluorescently labeled (Figures 1
C,D). Neurospecificity of YC3.60 expression was confirmed by overlap with NeuN-staining. Cells showed bright staining in soma excluding the nucleus (Figures 1
E,F) as reported for other FCIPs (Hasan et al., 2004
; Wallace et al., 2008
; Tian et al., 2009
). Due to the dense expression, the neuropil (including dendrites and axons) was also brightly stained near the injection site. YC3.60-expressing cells could be imaged by two-photon microscopy in the living mouse brain down to about 400 μm covering the supergranular layers (Figure 2
A). Vertically running apical dendrites of pyramidal neurons were clearly visible in side projections of image stacks (Figure 2
B). In vivo counterstaining with the astrocyte-marker sulforhodamine 101 (SR101) (Nimmerjahn et al., 2004
) revealed a complete lack of overlap with YC3.60 staining confirming neurospecificity (Figure 2
C).
YC3.60 reports increases in intracellular free Ca2+ concentration as a FRET change caused by a conformational change that brings CFP and YFP closer together (Nagai et al., 2004
). The acceptor (YFP) fluorescence intensity is expected to increase while the donor (CFP) fluorescence should decrease. Indeed, YFP-increases and concomitant CFP-decreases were observed in initial experiments on rat organotypic hippocampal slices, in which increasing number of synaptic shocks were delivered to the mossy fibers and fluorescence changes were recorded in the neuropil of the CA3 region (Figure 3
A). Expressed as relative percentage change of the YFP/CFP ratio (ΔR/R), the evoked signals showed a large dynamic range, with peak signals up to 50% and little indication of saturation. AP-evoked calcium transients of smaller amplitude were readily observed in single cells, both in vitro (Figure 3
B) and in vivo (Figure 3
C). Even though a ratiometric measurement with simultaneous acquisition of fluorescence in the YFP- and CFP-channel is advantageous as it normalizes for common baseline drifts, the relative fluorescence changes in the YFP-channel alone (ΔF/FYFP) also clearly indicated Ca2+ transients (Figures 3
B,C). In the following sections, we will present Ca2+ transients either as relative percentage change of the ratio YFP/CFP (ΔR/R) or as ΔF/FYFP.
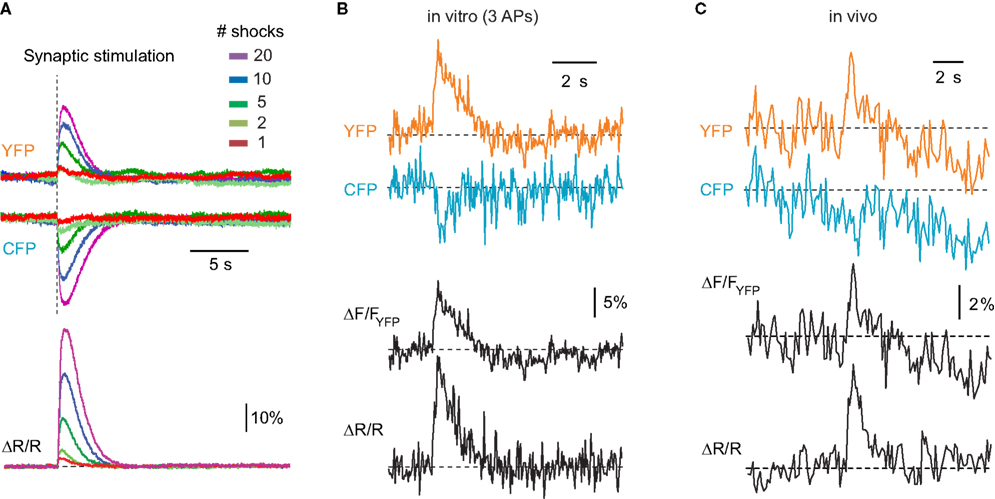
Figure 3. Ca2+ signals reported by YC3.60. (A) Two-photon line scan measurements of YC3.60 signals in the neuropil of hippocampal slice cultures. Fluorescence changes were evoked by extracellular stimulation at 100 Hz with different number of stimuli, averaged along the line length and over five stimulus presentations. Top: Fluorescence signals in the YFP and CFP channel (smoothed with a 30-ms window), Bottom: YFP/CFP ratio changes expressed as ΔR/R (smoothed with a 100-ms window). Note that intensity increases in the YFP-channel and decreases in the CFP-channel. (B) Example fluorescence transient from an individual YC3.60-expressing hippocampal neuron in vitro following synaptic stimulation, which evoked three action potentials. The Ca2+ transient is expressed either as relative percentage change in the YFP channel (ΔF/FYFP) or as percentage change in the YFP/CFP ratio (ΔR/R). (C) Analogous in vivo example of a spontaneously occurring fluorescence transient in a YC3.60-expressing L2/3 neocortical neuron. In (A–C) raw fluorescence intensities of CFP and YFP are reported in arbitrary units.
YC3.60 Reports AP Firing in vitro and in vivo
We next examined how sensitively YC3.60 reports AP firing in vitro and in vivo by combining targeted electrical recordings with two-photon imaging (see Materials and Methods). Synaptic stimulation of pyramidal neurons in slice cultures elicited single APs or bursts of AP trains as revealed by juxtacellular recordings (Figure 4
A). Single APs evoked Ca2+ transients with an average ΔR/R amplitude of 5.9 ± 0.3% (mean ± SEM, n = 32), while high-frequency bursts of 2, 3, and 5 APs elicited successively larger transients (10.1 ± 0.3% (40), 13.8 ± 0.4% (35) and 18.7 ± 1.1% (4), respectively). The increase in Ca2+ transient amplitude with number of APs was well approximated by a linear fit (Figure 4
C; slope = 3.15%/AP; r2 = 0.98). The decay of Ca2+ transients was relatively fast and did not significantly depend on AP number (Figure 4
D; time constants of exponential fits: 0.78 ± 0.05, 0.82 ± 0.03, 0.91 ± 0.04, and 0.80 ± 0.06 s for 1, 2, 3 and 5 APs, respectively; slope of linear regression 4 ms/AP).
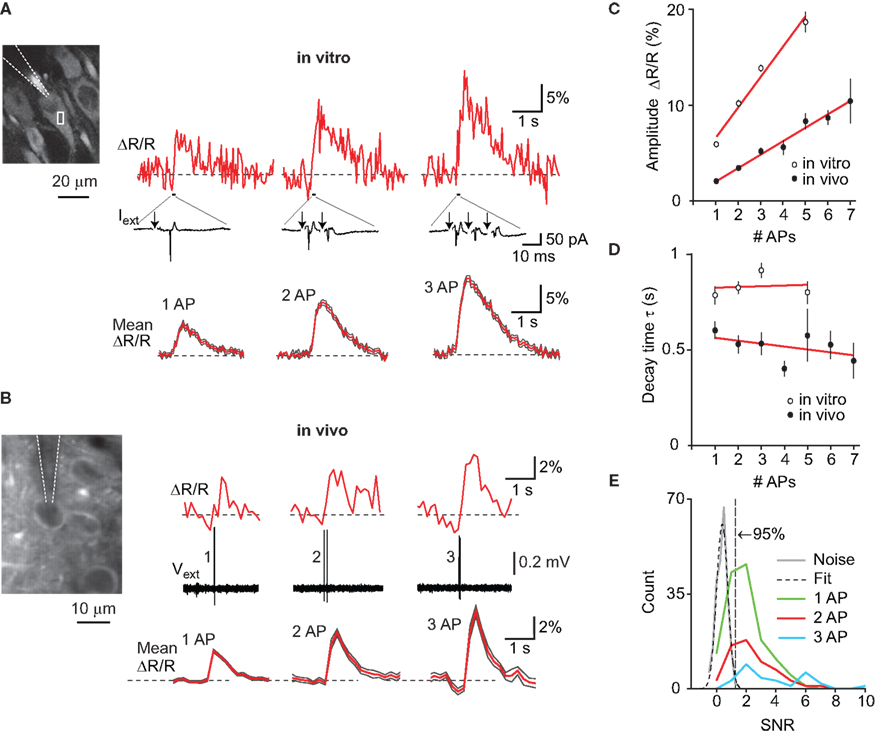
Figure 4. YC3.60 sensitivity to action potentials in vitro and in vivo. (A) Characterization of YC3.60 sensitivity in vitro. Top: Cell-attached recording at room temperature from a hippocampal CA3 pyramidal neuron (left image with recording pipette) and simultaneous fluorescence measurement from a somatic region of interest (white box). Extracellular current and single-trial Ca2+ transients are shown in response to 1, 2 and 3 APs elicited by synaptic stimulation (arrows; stimulation pipette not shown; stimulus artifacts blanked). Bottom: Mean fluorescence traces (±SEM) in response to 1, 2 and 3 APs (n = 32 traces from 4 cells for 1 AP; n = 40 (5) for 2 APs; n = 35 (5) for 3 APs). (B) Characterization of YC3.60 sensitivity in vivo. Top: Juxtacellular voltage recording from a L2/3 neuron in barrel cortex (left image with recording pipette) and simultaneous two-photon Ca2+ measurement from the soma region. Example Ca2+ transients are shown for spontaneously occurring 1, 2 and 3 APs. Bottom: Mean fluorescence traces (±SEM) in response to 1, 2 and 3 APs (n = 78 traces from 9 cells for 1 AP; n = 33 (7) for 2 APs; n = 23 (7) for 3 APs). (C) Peak amplitudes of Ca2+ transients as a function of number of APs (in vitro, open circles, n = 32, 40, 35 and 4 transients for 1, 2, 3 and 5 APs, respectively; in vivo, filled circles, n = 138 transients from 11 cells, 61 (9), 30 (9), 18 (7), 12 (6), 4 (3), 6 (5) for 1–7 APs, respectively). (D) Decay time constants of exponential fits as a function of number of APs (in vitro, open circles, same n as in (C); in vivo, filled circles n = 78 (9), 33 (7), 23 (7), 16 (6), 11 (5), 3 (2), 5 (5) for 1–7 APs, respectively). Red lines are linear regressions. Error bars are shown as SEM. (E) Efficiency of AP detection in vivo was determined by estimating the distribution of the signal-to-noise ratio (SNR) under noise conditions and fitting with a Gaussian. From the fit, we determined the SNR cutoff at which less than 5% of baseline traces would be classified as false positives (SNR = 1.3). Using this threshold, 71% of single APs (97/137), 80% of doublets (48/60) and 93% of triplets (27/29) were correctly detected.
To determine YC3.60 sensitivity in vivo, we performed two-photon targeted juxtacellular recordings from YC3.60-expressing L2/3 neurons in barrel cortex of anesthetized mice (Figure 4
B). In many cases, single APs were associated with clear ΔR/R transients. On average, single APs elicited transients of 2.00 ± 0.09% peak amplitude (n = 138 transients from 11 cells). Bursts of up to 7 APs elicited transients with successively larger amplitude (Figure 4
C). The relationship between Ca2+ transient amplitude and AP number again was well approximated by a linear fit (slope = 1.39%/AP; r2 = 0.98), indicating that YC3.60 fluorescence changes for bursts of APs were well below saturation. Indeed, much larger events (20–30% ΔR/R) were occasionally observed in response to trains of 10 or more APs (see Figure 5
B). We estimated AP-detection efficiency by comparing the SNR of AP-evoked transients to the baseline noise level (see Materials and Methods). Detection rates were 71% for single APs and 80 and 93% for bursts of 2 and 3 APs, respectively (Figure 4
E). Similar to the in vitro results, Ca2+ transients showed fast decays, which did not depend on AP number (Figure 4
D; for single APs 0.60 ± 0.05 s; n = 78 transients from nine cells; slope of linear regression −16 ms/AP). The differences in absolute values for peak amplitudes and decay time constants between in vitro and in vivo experiments most likely can be attributed to the differences in experimental conditions. In particular, a similar reduction of AP-evoked Ca2+ transient amplitude at physiological compared to room temperature has also been reported for other FCIPs (Mao et al., 2008
; Tian et al., 2009
). We conclude that YC3.60 sensitively reports AP firing both in vitro and in vivo and that it can even resolve single APs.
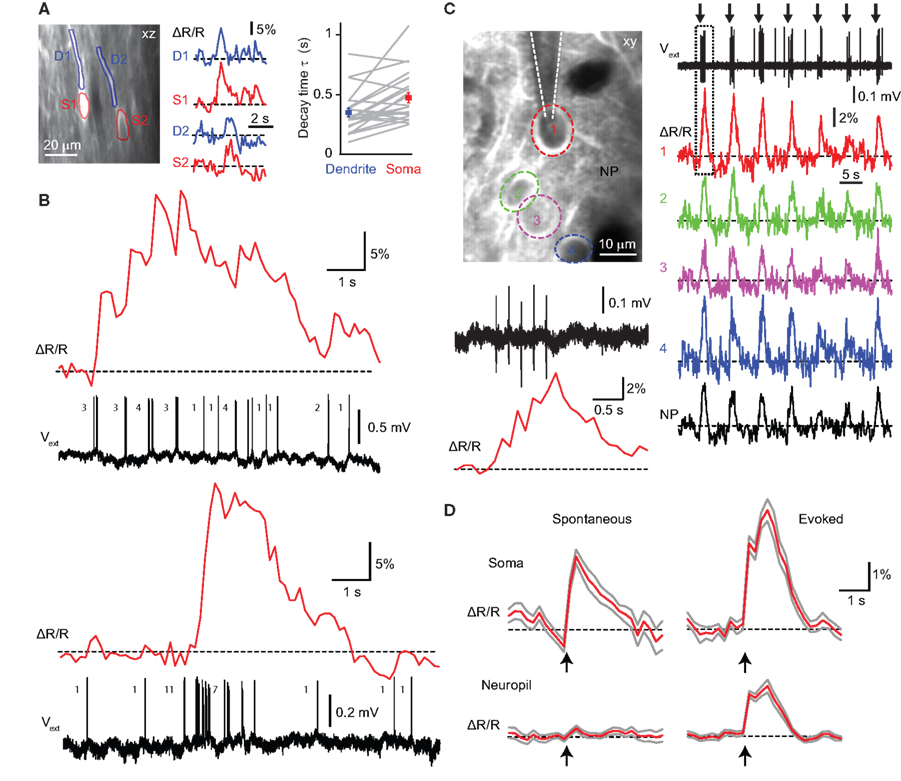
Figure 5. Single-cell and population YC3.60 Ca2+ signals in L2/3 of barrel cortex. (A) Simultaneous two-photon Ca2+ imaging in soma and dendrites of L2/3 neurons using vertical (xz-)imaging. Examples of spontaneous somatic (S, red) and apical dendritic (D, blue) YC3.60 Ca2+ transients for the cells depicted in the left image. Right: Mean decay times in dendrites compared to somata for 23 measurements (gray lines; mean ± SEM). (B) Simultaneous juxtacellular voltage recording and two photon Ca2+ imaging from a neuron showing rare events of sustained and high-frequency AP firing that are accompanied by large YC3.60 Ca2+ transients with peak amplitudes of up to 30% ΔR/R. Top: Sustained AP firing leads to prolonged elevation of the fluorescence ratio. Bottom: A short burst of 11 APs is accompanied by a fast Ca2+ transient, which returns to baseline following a stereotypical exponential decay. (C) Two-photon Ca2+ imaging of a small population of neurons during sensory stimulation (seven times five air-puffs to contra-lateral whiskers at 5 Hz). Large Ca2+ transients in cell 1 (red trace) correlated with the spiking activity observed in the simultaneous juxtacellular voltage recording. Concomitant Ca2+ transients were also evoked in neighboring neuronal somata and in the nearby neuropil (NP). The response to the first stimulation episode (dashed box) is shown on expanded scale in the lower left, indicating that YC3.60 resolves the individual steps in the accumulated Ca2+ response. (D) Event-triggered average Ca2+ traces from somata and adjacent neuropil for spontaneous (n = 37 events of 1–3 APs) and evoked (n = 32 events of 1–5 APs) action potentials. Multi-whisker air puff evoked Ca2+ transients in somata were significantly larger than those in the neuropil while spontaneous spikes were accompanied by somatic but no neuropil transients. Errors are shown as SEM.
Sensory-Evoked and Spontaneous Subcellular, Cellular and Wide-Field Ca2+ Signals
We next investigated in how far YC3.60 can be used to study sensory-evoked cortical activity on various spatial scales, ranging from dendrites of individual neurons to large areas of the barrel field. On the finest scale, we simultaneously measured spontaneous dendritic and somatic Ca2+ transients in L2/3 pyramidal neurons using ‘arbitrary plane’ imaging (Göbel and Helmchen, 2007b
) (Figure 5
A). As expected (Schiller et al., 1995
), Ca2+ transients showed faster decay times in apical dendrites compared to somata (0.35 ± 0.04 s vs. 0.47 ± 0.04 ms; n = 23; p < 0.01; paired two-tailed t-test), confirming relatively rapid kinetics of YC3.60. A large dynamic range of YC3.60 is demonstrated in Figure 5
B, where Ca2+ transients evoked by complex AP patterns (ranging from individual APs to trains of 10 or more APs) were revealed with high fidelity. The peak ΔR/R amplitudes of around 30% in these recordings presumably still are far from indicator saturation (see Figure 3
A).
On the level of local neuronal populations, air-puff whisker stimulation (5 Hz) elicited clear Ca2+ transients in neuronal somata but also in the neuropil (Figure 5
C). Bursts of AP firing could be distinguished even at relatively slow frame rates (7.81 Hz), highlighting the rapid kinetics of the Ca2+ sensor. Combined electrical recordings allowed us to directly assess the degree of potential contamination of somatic signals by Ca2+ signals in the surrounding neuropil (Kerr et al., 2005
; Göbel and Helmchen, 2007a
). Whisker-evoked events were associated with significantly larger Ca2+ transients in somata compared to the neighboring neuropil (4.0 ± 0.5 vs. 1.6 ± 0.2% ΔR/R, n = 32, p < 0.01, paired two-tailed t-test). In contrast, spontaneously occurring APs elicited Ca2+ transients in somata but not in the neuropil (2.3 ± 0.4 vs. 0.4 ± 0.1%, n = 37, p < 0.01) (Figure 5
D). From these observations we conclude that sensory stimulation can evoke Ca2+ transients in the neuropil in addition to somatic signals, presumably reflecting excitation of afferent axonal pathways (Kerr et al., 2005
), but that high-resolution two-photon imaging clearly distinguishes the cellular AP-evoked signals.
Activation of a substantial fraction of neurons in the local population as well as of the surrounding neuropil might cause sufficient YC3.60 signals for large-scale bulk recording of barrel cortex excitation. Indeed, in addition to sensory-evoked responses spontaneous fluctuating calcium signals were apparent in the neuropil when entire two-photon imaging frames were used as ROI (Figure 6
A). Similar spontaneous YC3.60 signals were observed with wide-field single-photon-excited fluorescence with a CCD-camera positioned above barrel cortex (Figure 6
B). These slow oscillations closely corresponded to the simultaneously measured LFP and most likely are due to synchronous activity during anesthesia. In addition, air puff stimulation of whiskers evoked stimulus-locked LFP signals and bulk fluorescence changes with an average ΔF/FYFP amplitude of 0.47 ± 0.03% and an average decay time of 0.48 ± 0.04 s (n = 3 animals). Bulk-activity in barrel cortex could also be read out using single-photon excitation and fluorescence collection through a single-core optical fiber (440 μm core diameter; see Materials and Methods). With the optical fiber placed on top of the dura (or the thinned skull) of anesthetized mice showing YC3.60 expression in barrel cortex, we observed both spontaneous and air puff-evoked ΔF/FYFP signals (Figure 6
C) that were similar to the signals observed by wide-field camera imaging.

Figure 6. Bulk recording of spontaneous and sensory-evoked YC3.60 Ca2+ signals in barrel cortex. (A) Large-area Ca2+ imaging using two-photon excitation and whisker stimulation by air puffs. Neuropil and two neurons visible about 100 μm deep in a 12-week-old mouse ∼6 weeks after virus infection. The entire frame was taken as region of interest. Bottom: Examples of single-trial spontaneous and sensory-evoked responses are shown along with average traces of 10 trials. (B) Large-area Ca2+ imaging using single-photon excitation and a camera and simultaneous local field potential (LFP) recording in barrel cortex of an anesthetized mouse (left schematic). Right: The mean YC3.60 fluorescence signal (ΔF/F in YFP-channel; red traces) correlated well with the LFP for both spontaneous activity (top) and upon air-puff whisker stimulation (bottom; dashed vertical lines). (C) Fiber-optic bulk recording of YC3.60 signals in barrel cortex in an anesthetized mouse (left schematic). Fluorescence excitation and detection were both accomplished through the optical fiber, the tip of which was placed on the cortical surface. Right: Examples of single-trial YC3.60 fluorescence traces (ΔF/F in YFP-channel) and mean of 10 traces for spontaneous activity (top) and upon air-puff whisker stimulation (bottom; dashed vertical lines).
Fiber-Optic Recording of Barrel Cortex Activity in Freely Moving Mice
Fiber-optic recordings enable measurements of neuronal activity in awake, freely behaving animals (Adelsberger et al., 2005
; Murayama et al., 2007
; Murayama and Larkum, 2009b
; for review see Grewe and Helmchen, 2009
; Wilt et al., 2009
). We tested if YC3.60 expression is suitable for such an application. Using firm attachment of the single optical fiber to the animal’s head (Murayama and Larkum, 2009b
) we measured bulk fluorescence from the barrel field in awake, freely moving mice (Figure 7
). While the mice were either passively sitting or actively exploring, we recorded complex ΔF/FYFP signals (Figures 7
A–C). We could block the Ca2+ transients by application of Cd2+, a Ca2+ channel blocker, to the cortical surface (Figure 7
D), indicating that the YC3.60 sensor was reporting Ca2+ transients. Mechanically jolting the fiber did not result in obvious fluorescence changes in YC3.60-expressing mice as in previous fiber-optic studies (Murayama et al., 2007
; Murayama and Larkum, 2009b
). Furthermore, fluorescence traces in a wild-type mouse (without YC3.60) were flat without any movement-related changes (Figure 7
E). Together these findings exclude opto-mechanical artifacts as source of the observed fluorescence changes and instead indicate that YC3.60 signals are caused by Ca2+ channel activation and thus provide a readout of the complex activation pattern in the barrel cortex. Fiber-optic recordings using YC3.60 thus should permit closer investigation of behavioral-related activity in specific neocortical areas.
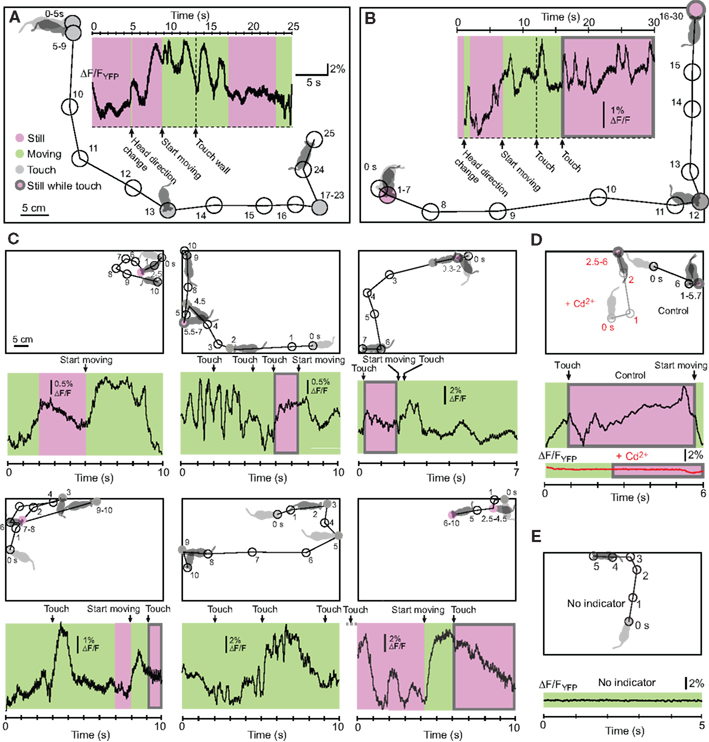
Figure 7. Fiber-optic recording of brain area activity in freely moving mice using YC3.60. (A,B) Two examples of fiber-optic recording of YC3.60 signals in awake, freely moving mice. Bulk Ca2+ signals indicating neuronal activity were recorded in somatosensory cortex through a single-core optical fiber as shown in Figure 6
C. Fluorescence changes in the YFP-channel are shown during 25–30 s periods together with the position of the mouse in an open field box. Animal behavior (sitting still, moving, touches, or having contact to the wall) is indicated by background colors. The trajectory of the animals’ movement is indicated with selected time stamps. (C) Six more examples of Ca2+ imaging from three mice, together with corresponding behavioral observations. Changes of the animal’s behavioral state (e.g., start of movement) were frequently associated with marked discontinuities in the fluorescence trace, indicating complex underlying Ca2+ dynamics. (D) Control experiment showing that Ca2+ signals are blocked by local perfusion of the cortical region with Cd2+. (E) Control experiment demonstrating that a flat fluorescence trace is observed in the absence of YC3.60 expression.
In vivo Ca2+ imaging in the mammalian neocortex so far mainly relied on synthetic indicator dyes (Garaschuk et al., 2006
; Göbel and Helmchen, 2007a
; Kerr and Denk, 2008
; Grewe and Helmchen, 2009
). Recently, different FCIPs (also called genetically encoded Ca2+ indicators or GECIs) have been developed that will allow for a more specific interrogation of various aspects of neural activity, compared to synthetic sensors. Here, we have shown that upon neuron-specific expression in the mouse neocortex, the FCIP YC3.60 can be used to read out activation of neocortical areas at different spatial scales both in anesthetized and awake, freely moving animals.
Original characterization of YC3.60 (Nagai et al., 2004
) defined it as an indicator with high sensitivity and dynamic range in vitro. However, reliable Ca2+ imaging in vivo was not demonstrated in transgenic animals (Nagai et al., 2004
), possibly due to the use of a plasma-membrane bound version of the sensor which may have resulted in a reduced AP detection efficiency (Mao et al., 2008
). Subsequently, YC3.60 was employed to obtain quantitative Ca2+ concentration measurements in brain slices (Liu et al., 2008
) and resting Ca2+ concentrations in vivo (Kuchibhotla et al., 2008
). The current study extends these findings by demonstrating that viral delivery of YC3.60 permits in vivo measurements of sensory-evoked Ca2+ signals that closely correspond to cellular AP firing patterns. Furthermore, we have shown that YC3.60 can be applied to monitor neural activity at diverse spatial scales, covering dendritic Ca2+ signals, AP firing in local neuronal populations as well as large scale brain areas.
Gene delivery by AAV-vectors (Zhu et al., 2007
) provides a highly flexible, straightforward and safe approach for dense and wide-spread expression of FCIPs in neurons (Kootstra and Verma, 2003
). For these reasons, viral delivery has been the method of choice in recent characterizations of FCIPs in the mammalian brain (Mank et al., 2008
; Wallace et al., 2008
; Tian et al., 2009
). An alternative approach for gene delivery of FCIPs into the brain is in utero electroporation, which provides the potential benefit of cell-type specificity, depending on the precise electroporation protocol (Borrell et al., 2005
) but which results in relatively sparse labeling of neurons compared to viral delivery (Mank et al., 2008
). Finally, the production of transgenic mice expressing a number of different FCIPs has been reported (Hasan et al., 2004
; Heim et al., 2007
) including membrane-bound YC3.60 (Nagai et al., 2004
). In one of these studies, sensory-evoked Ca2+ transients were demonstrated using wide-field imaging of the olfactory bulb with two FCIPs expressed under a tetracycline-inducible promoter (Hasan et al., 2004
). The widespread use of these mouse lines has been limited, however, by the failure to clearly monitor AP-evoked cellular Ca2+ signals in vivo, possibly due to low protein expression levels.
Comprehensive analysis of neural circuits will require reliable detection of single APs as well as estimation of the firing frequency during bursts of APs. Here we demonstrate that YC3.60 can detect the occurrence of single APs in pyramidal cells of mouse barrel cortex in vivo with a sensitivity comparable to recent reports of another ratiometric FCIP, D3cpV (Wallace et al., 2008
). Unlike D3cpV, however, YC3.60 shows faster kinetics and minimal saturation for bursts of up to at least 10 APs, thus making it a suitable tool for quantitative investigation of local neural network dynamics in vivo. Overall our analysis revealed that YC3.60 shows comparable signals in terms of sensitivity and decay times to the commonly used synthetic indicator Oregon Green BAPTA-1 (Kerr et al., 2005
), which has been used extensively for optical monitoring of AP firing in populations of neurons. Recently, in addition to D3cpV, two other novel FCIPs have been proposed for in vivo two-photon Ca2+ imaging in the mammalian brain. First, in utero electroporation of TN-XXL, a troponin-based ratiometric FCIP, allowed repeated Ca2+ imaging from the same neurons over days; however its sensitivity to AP firing was relatively low with single AP detection only achievable in brain slices (Mank et al., 2008
). Second, following AAV-delivery the single-fluorescent protein sensor GCaMP-3 has recently been shown to exhibit large fluorescence changes and to detect APs with fast kinetics and little saturation in mouse somatosensory cortex in vivo (Tian et al., 2009
). This Ca2+ sensor does not, however, permit ratiometric imaging and thus will be more susceptible to motion artifacts compared to YC3.60. It is likely that in the near future improved versions of either cameleons or GCaMPs will provide even better optical readout of neuronal spiking. Furthermore, single-fluorophore FCIPs may be co-expressed with a second indicator that is not Ca2+-sensitive in order to reduce their susceptibility to motion artifacts.
In addition to two-photon Ca2+ imaging at the level of single cells and small populations of neurons, we demonstrated the use of FCIPs to record large-scale neuronal activity in awake, freely moving animals. Using a fiber-optic approach (Murayama et al., 2007
; Murayama and Larkum, 2009b
) to image bulk neural activity in mouse barrel cortex, we showed complex Ca2+ dynamics associated with behaviorally salient events such as object-touching or moving. We suggest that these activity patterns may reflect the dynamic interaction of different behavior-related brain states with sensory-evoked activity.
In conclusion, viral delivery of YC3.60 provides a powerful tool for the optical interrogation of neural circuits at multiple spatial scales and with high sensitivity. Viral delivery of FCIPs may in the future be combined with the powerful tools of mouse genetics, allowing for cell-type specific or inducible expression of Ca2+ sensors (Zhu et al., 2007
; Wallace et al., 2008
). Thus, injection of AAV-FCIP vectors with loxP sites (Atasoy et al., 2008
; Kuhlman and Huang, 2008
) into Cre driver mouse lines should allow selective expression of YC3.60 in specific cortical layers (Madisen et al., 2010
) and interneuron subtypes (Oliva et al., 2000
; Chattopadhyaya et al., 2004
). Cell-type specific expression, combined with fiber optic recordings in freely moving animals, will allow functional correlation of specific neuronal populations with behavior. Moreover, the approach developed here may conceivably be adapted to other mammalian species, such as rats (Foti et al., 2007
) or even non-human primates (Stettler et al., 2006
) and is therefore likely to play an important role in the dissection of the neural underpinnings of complex behaviors.
The authors declare that the research was conducted in the absence of any commercial or financial relationships that could be construed as a potential conflict of interest.
We like to thank Winfried Denk and Peter H. Seeburg for generous support and interest in the project, and Andreas Schaefer for supporting Thomas Hahn. We also thank Erika Heil for art work (Art for Biomed, Frankfurt, Germany) and Matthias Heindorf for help on plots. The authors acknowledge support from the German Academic Exchange Service (DAAD) to Henry Lütcke; from the Sumitomo Foundation, the Research Foundation for Opto-Science and Technology and the CREST (Core Research for Evolution Science and Technology) of JST (Japan Science and Technology) to Masanori Murayama; from an Ambizione Grant of the Swiss National Science Foundation to David J. Margolis; from the Max Planck Society, a Collaborative Research Grant (SFB636/A4), and the Volkswagen foundation (AZ: I/80 704) to Rolf Sprengel; from the Swiss National Science Foundation (#3100A0-114624) to Fritjof Helmchen; from the Swiss Systems Biology Initiative SystemsX.ch (Neurochoice project) to Fritjof Helmchen and Matthew E. Larkum; and from the Schloessmann Foundation and Fritz Thyssen Stiftung to Mazahir T. Hasan.
Berger, T., Borgdorff, A., Crochet, S., Neubauer, F. B., Lefort, S., Fauvet, B., Ferezou, I., Carleton, A., Lüscher, H. R., and Petersen, C. C. (2007). Combined voltage and calcium epifluorescence imaging in vitro and in vivo reveals subthreshold and suprathreshold dynamics of mouse barrel cortex. J. Neurophysiol. 97, 3751–3762.
Hasan, M. T., Friedrich, R. W., Euler, T., Larkum, M. E., Giese, G., Both, M., Duebel, J., Waters, J., Bujard, H., Griesbeck, O., Tsien, R. Y., Nagai, T., Miyawaki, A., and Denk, W. (2004). Functional fluorescent Ca2+ indicator proteins in transgenic mice under TET control. PLoS Biol. 2, e163. doi: 10.1371/journal.pbio.0020163.
Madisen, L., Zwingman, T. A., Sunkin, S. M., Oh, S. W., Zariwala, H. A., Gu, H., Ng, L. L., Palmiter, R. D., Hawrylycz, M. J., Jones, A. R., Lein, E. S., and Zeng, H. (2010). A robust and high-throughput Cre reporting and characterization system for the whole mouse brain. Nat. Neurosci. 13, 133–140.
Tian, L., Hires, S. A., Mao, T., Huber, D., Chiappe, M. E., Chalasani, S. H., Petreanu, L., Akerboom, J., McKinney, S. A., Schreiter, E. R., Bargmann, C. I., Jayaraman, V., Svoboda, K., and Looger, L. L. (2009). Imaging neural activity in worms, flies and mice with improved GCaMP calcium indicators. Nat. Methods 6, 875–881.
Zhu, P., Aller, M. I., Baron, U., Cambridge, S., Bausen, M., Herb, J., Sawinski, J., Cetin, A., Osten, P., Nelson, M. L., Kügler, S., Seeburg, P. H., Sprengel, R., and Hasan, M. T. (2007). Silencing and un-silencing of tetracycline-controlled genes in neurons. PLoS ONE 2, e533. doi: 10.1371/journal.pone.0000533.