Ephus: multipurpose data acquisition software for neuroscience experiments
- 1 Department of Physiology, Feinberg School of Medicine, Northwestern University, Chicago, IL, USA
- 2 Janelia Farm Research Campus, Howard Hughes Medical Institute, Ashburn, VA, USA
Physiological measurements in neuroscience experiments often involve complex stimulus paradigms and multiple data channels. Ephus (http://www.ephus.org) is an open-source software package designed for general-purpose data acquisition and instrument control. Ephus operates as a collection of modular programs, including an ephys program for standard whole-cell recording with single or multiple electrodes in typical electrophysiological experiments, and a mapper program for synaptic circuit mapping experiments involving laser scanning photostimulation based on glutamate uncaging or channelrhodopsin-2 excitation. Custom user functions allow user-extensibility at multiple levels, including on-line analysis and closed-loop experiments, where experimental parameters can be changed based on recently acquired data, such as during in vivo behavioral experiments. Ephus is compatible with a variety of data acquisition and imaging hardware. This paper describes the main features and modules of Ephus and their use in representative experimental applications.
Introduction
Software tools are crucial for neuroscience experiments involving complex combinations of event-driven stimulus and recording paradigms. Although commercial software solutions exist, these are often limited by a variety of factors including cost, source code inaccessibility, hardware compatibility, and more. Consequently a strong tradition in neurophysiology research is to write custom software routines. While superb for the specific tasks at hand, these custom solutions rarely offer the flexibility and extensibility needed for them to be transferrable across platforms, hardware configurations, and experimental paradigms without significant modifications.
We present here a suite of software tools engineered around general-purpose data I/O. This package, Ephus, is module-based and includes functionality for a wide variety of applications ranging from traditional in vitro electrophysiology to highly customized circuit mapping and in vivo behavioral protocols. Ephus has evolved alongside ScanImage, a package dedicated for 2-photon laser scanning microscopy (Pologruto et al., 2003). Ephus offers a collection of both application-specific tools, such as those for electrophysiology, scanning and mapping, video imaging, as well as common (shared) tools for data binding, configuration switching, and experimental timing. Ephus has been used for standard cellular electrophysiology, synaptic circuit mapping using laser scanning photostimulation (LSPS), and electrophysiology in vivo behavioral paradigms, and it offers a wide range of potential applications: whole-cell recording with non-standard customized routines including multi-electrode applications; complex combinations of multiple I/O devices and signals; uncaging and optogenetic based synaptic mapping applications; and, event-driven in vivo behavioral experiments.
Parts of this work have been published in preliminary format (O’Connor et al., 2008, 2009).
Methods
Web Site
The Ephus web address is http://www.ephus.org. The site includes links for downloading Ephus and related tools, and extensive information about installation, configuration, and usage. Feedback can be provided as well (scanimagers@gmail.com).
Software Development
Ephus was developed and tested on multiple computers (Dell, Lenovo, Superlogics) running Microsoft Windows XP.
Setting up Hardware and Ancillary Software
Matlab and ancillary software
Ephus runs within Matlab (version 2007b and higher; Mathworks, Natick, MA, USA) as a series of scripts, classes, and custom toolboxes. No commercial Matlab toolboxes are required. Data acquisition is through NiMex, a custom toolbox which is included in Ephus. GLib, an open-source, cross-platform utility library, is automatically installed.
Computer
The Ephus computer must accommodate the data acquisition boards (via PCI/PCIe slots or USB connectors, as appropriate) and, where needed, a video camera (usually an IEEE 1394 interface connection).
Data acquisition boards
National Instruments (NI; Austin, TX, USA) data acquisition boards are supported (AO, E, and M series). NI driver version NI-DAQmx 8.5.05 or higher is recommended. For electrophysiology and mapping experiments boards such as the following are often used: PCI/USB-6229 and -6259; PCI-6040E; PCI-6713. The number and type depends on the number of channels required. Note that Ephus, through NiMex, is able to support precision-timed DIO (“correlated DIO” in NI terminology). This greatly expands the number of available data I/O channels available.
Amplifier
Axon Instruments amplifiers (Multiclamp 700A and 700B, Axopatch 200B; Molecular Devices, Sunnyvale, CA, USA) are supported. Amplifiers are implemented as object-oriented classes, allowing users to add support for their own amplifier hardware.
Video camera
Most QImaging (Surry, British Columbia, Canada) CCD cameras are supported (those in the Rolera series are not). Hardware triggering of video acquisition by Ephus is possible and requires a QImaging trigger board.
Hardware for LSPS
These items include scanning mirrors, a photodiode and a current preamplifier to read out laser power, equipment to control the duration and power of the laser beam such as a shutter and/or Pockels cell (electro-optical modulator). Alternatively, some laser models allow direct analog power modulation.
Results and Discussion: Description of the Software
Overview
Although focused on electrophysiological experiments, Ephus is fundamentally a collection of modules (termed programs) for general data acquisition. For instance, it contains modules such as the stimulator, a program that controls DA or DIO output; the acquirer, a program that controls AD input; and ephys, a specialized program for cellular electrophysiology supporting intracellular recordings.
The number of output and input channels is limited only by the available hardware. The mapping between hardware and output and input channels is configured in an initialization file. Data sent to stimulating devices can be specified by the pulseEditor. The user may control individual programs directly; in addition, each program can be triggered by other programs, or itself trigger other programs when started. Alternatively any program can be configured to be triggered by the loopGui, which allows the number and timing of triggers, each corresponding to an individual acquisition, to be controlled. The pulseJacker program allows iterating through a pre-configured set of stimulus (pulse) data for each output channel (configured in the stimulator and/or ephys programs) for each trigger received or generated by Ephus.
The above roughly recapitulates the functionality of standard electrophysiology data acquisition programs. Beyond this, Ephus has several unique features.
Multiple levels of customization
Ephus allows easy configuration and display of individual experimental parameters via controls on the graphical user interface (window) for the various programs. However, Ephus also allows rapid (<1 s) “en bloc” switching between experiments as a whole, through the use of settings files and programmable shortcuts, termed “hotswitches”. Each program stores its configuration (i.e., data acquisition parameters, window location) to a settings file on disk. A hotswitch captures the settings for a collection of appropriately configured programs and assigns a named shortcut. Once a desired experimental configuration has been saved as a hotswitch, one can rapidly return to this set-up by pressing the associated hotswitch button. For example, a user might have a hotswitch set-up for a series of current injections to examine threshold and firing response in a given neuron, but then use a second hotswitch to transition to a fixed voltage-clamp protocol for mapping synaptic inputs in LSPS. The hotswitch program (Figure 1A) provides one-click access to these shortcuts, and also provides the means for creating, modifying and deleting hotswitches.
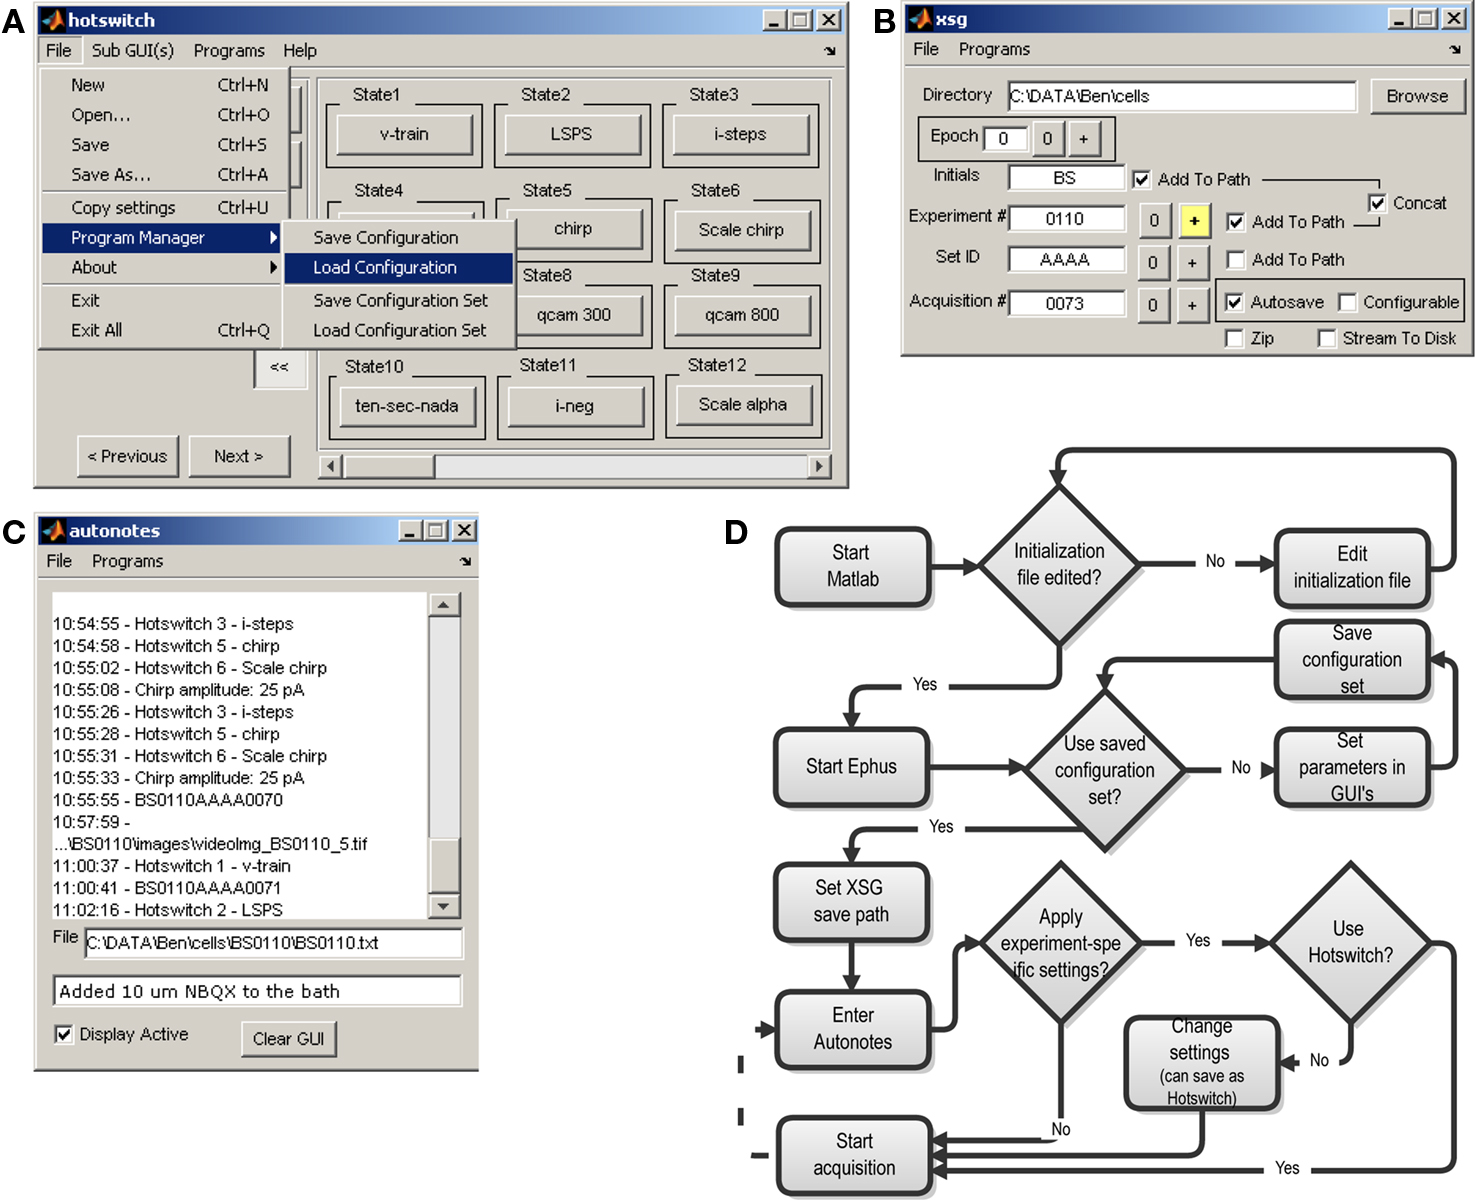
Figure 1. Ephus programs for management of general experimental information. (A) The hotswitch window provides many customizable buttons to rapidly switch between experimental configurations (e.g., family of current steps, synaptic circuit mapping) and program settings (e.g., video exposure time). Also visible are menu items to save or restore settings for individual programs, as well as all programs. The Copy settings menu item aids in sharing settings among lab members. This menu is available in every Ephus program. (B) The xsg program, responsible for binding data and header information from all programs and saving to disk, provides user controls for specifying the file-naming parameters and for indicating the start of a new experiment, or experimental epoch. (C) The autonotes program functions as an electronic laboratory notebook, automatically time-stamping text entries useful for recording experimental procedures. Some programs automatically add entries to this log (e.g., when a video image is captured, a hotswitch is pressed, or custom user functions are executed). Notes can also be entered manually in the text window. (D) Flowchart describing generic sequence of events during experiments.
Individual experimental set-ups can be joined into a logical group, which is saved as a “configuration set”. Each user typically maintains a small number (e.g., 1–5) of active configuration sets, each with multiple (e.g., 10) hotswitches. The “File” menu provides commands to save or restore the settings of a particular program, or of all running programs (Figure 1A).
User functions for on-line analysis and customization
Various modules expose events indicating particular points in program execution; these events can trigger the execution of custom user functions. Typically such functions implement custom data analysis following data acquisition. However, user functions can also change data acquisition parameters and therefore support on-line customization beyond what is available via the graphical user interface.
qcam. A program for video control, qcam acquires data from CCD cameras. qcam is used for fluorescence microscopy, bright-field microscopy for whole-cell recordings, intrinsic signal imaging, etc. Using hotswitches it is easy to switch quickly between different exposures, look-up tables, frame rates, window sizes and other parameters. Currently qcam is designed for use with QImaging CCD cameras; in the future, this will likely be expanded to support additional devices and vendors.
mapper. A program linking LSPS and electrophysiological measurements, the mapper is a highly optimized tool for circuit mapping or photochemical microscopy. The mapper is used to define the scan parameters and to align the scan with a video image of the sample. The mapper also orchestrates the stimulator, acquirer, and ephys, all of which must operate in a coordinated manner during a mapping experiment. The mapper relies on a few specialized calibration programs.
Data binding through the xsg
The xsg (“experiment saving GUI”) controls the saving of data files. All data acquired are bound together in a logical manner and all acquisition parameters are saved in a header. Files are saved as double-precision binary Matlab MAT-files, with the extension *.xsg. A single file on disk contains data and header information from all programs. Files are organized in folders and named in a systematic way that can be customized using the xsg controls. The xsg program is shown, during a slice electrophysiology experiment, in Figure 1B. The experiment number is incremented by the experimenter for each cell recorded, while the acquisition number increments automatically when new data is acquired, for example by the ephys program. A manually incremented “epoch” counter is available, allowing users to define different epochs of data acquisition (typically used in off-line analysis routines).
autonotes. During the course of an experiment, the autonotes program (Figure 1C) provides a convenient way to type notes on experimental procedures, the condition of the specimen, or parameters of the apparatus not automatically recorded by Ephus programs. In addition to notes entered manually, a number of Ephus programs automatically add autonotes entries – for example, whenever a data file is acquired, a video image captured, or a hotswitch activated. Every entry is automatically time-stamped. The resulting log is saved as a plain text file alongside the data files saved by the xsg program.
Ephus Set-Up and Startup
Installing Ephus
The current version of Ephus along with instructions for downloading and installation is available at the Ephus web site. It is distributed as open-source software under the “HHMI/Janelia Farm Open-Source License”.
Modifying the initialization file, and launching Ephus
When Ephus is launched, the user is prompted to supply an initialization file. This file establishes the correspondence between hardware channels and data, triggering, and other rig-specific settings – i.e., settings that do not change while running Ephus. A documented model initialization file is provided with the Ephus distribution, which the user can readily modify to suit their rig and experimental requirements.
To start Ephus, the command “ephus” is entered at the Matlab command line. During the first launch, certain programs require minor additional configuration (e.g., specifying which directory contains pulse files).
The flow of events in a generic Ephus experiment is depicted as a flowchart (Figure 1D).
In vitro Electrophysiology Experiments
Oscilloscope
Ephus includes a built-in multi-channel software oscilloscope, the scopeGui (Figure 2). This is convenient for amplifier control and on-line data display. Typically it is used to establish and monitor electrophysiological recordings. The scopeGui applies periodic test pulses and displays basic whole-cell recording parameters. Data are displayed, but not saved.
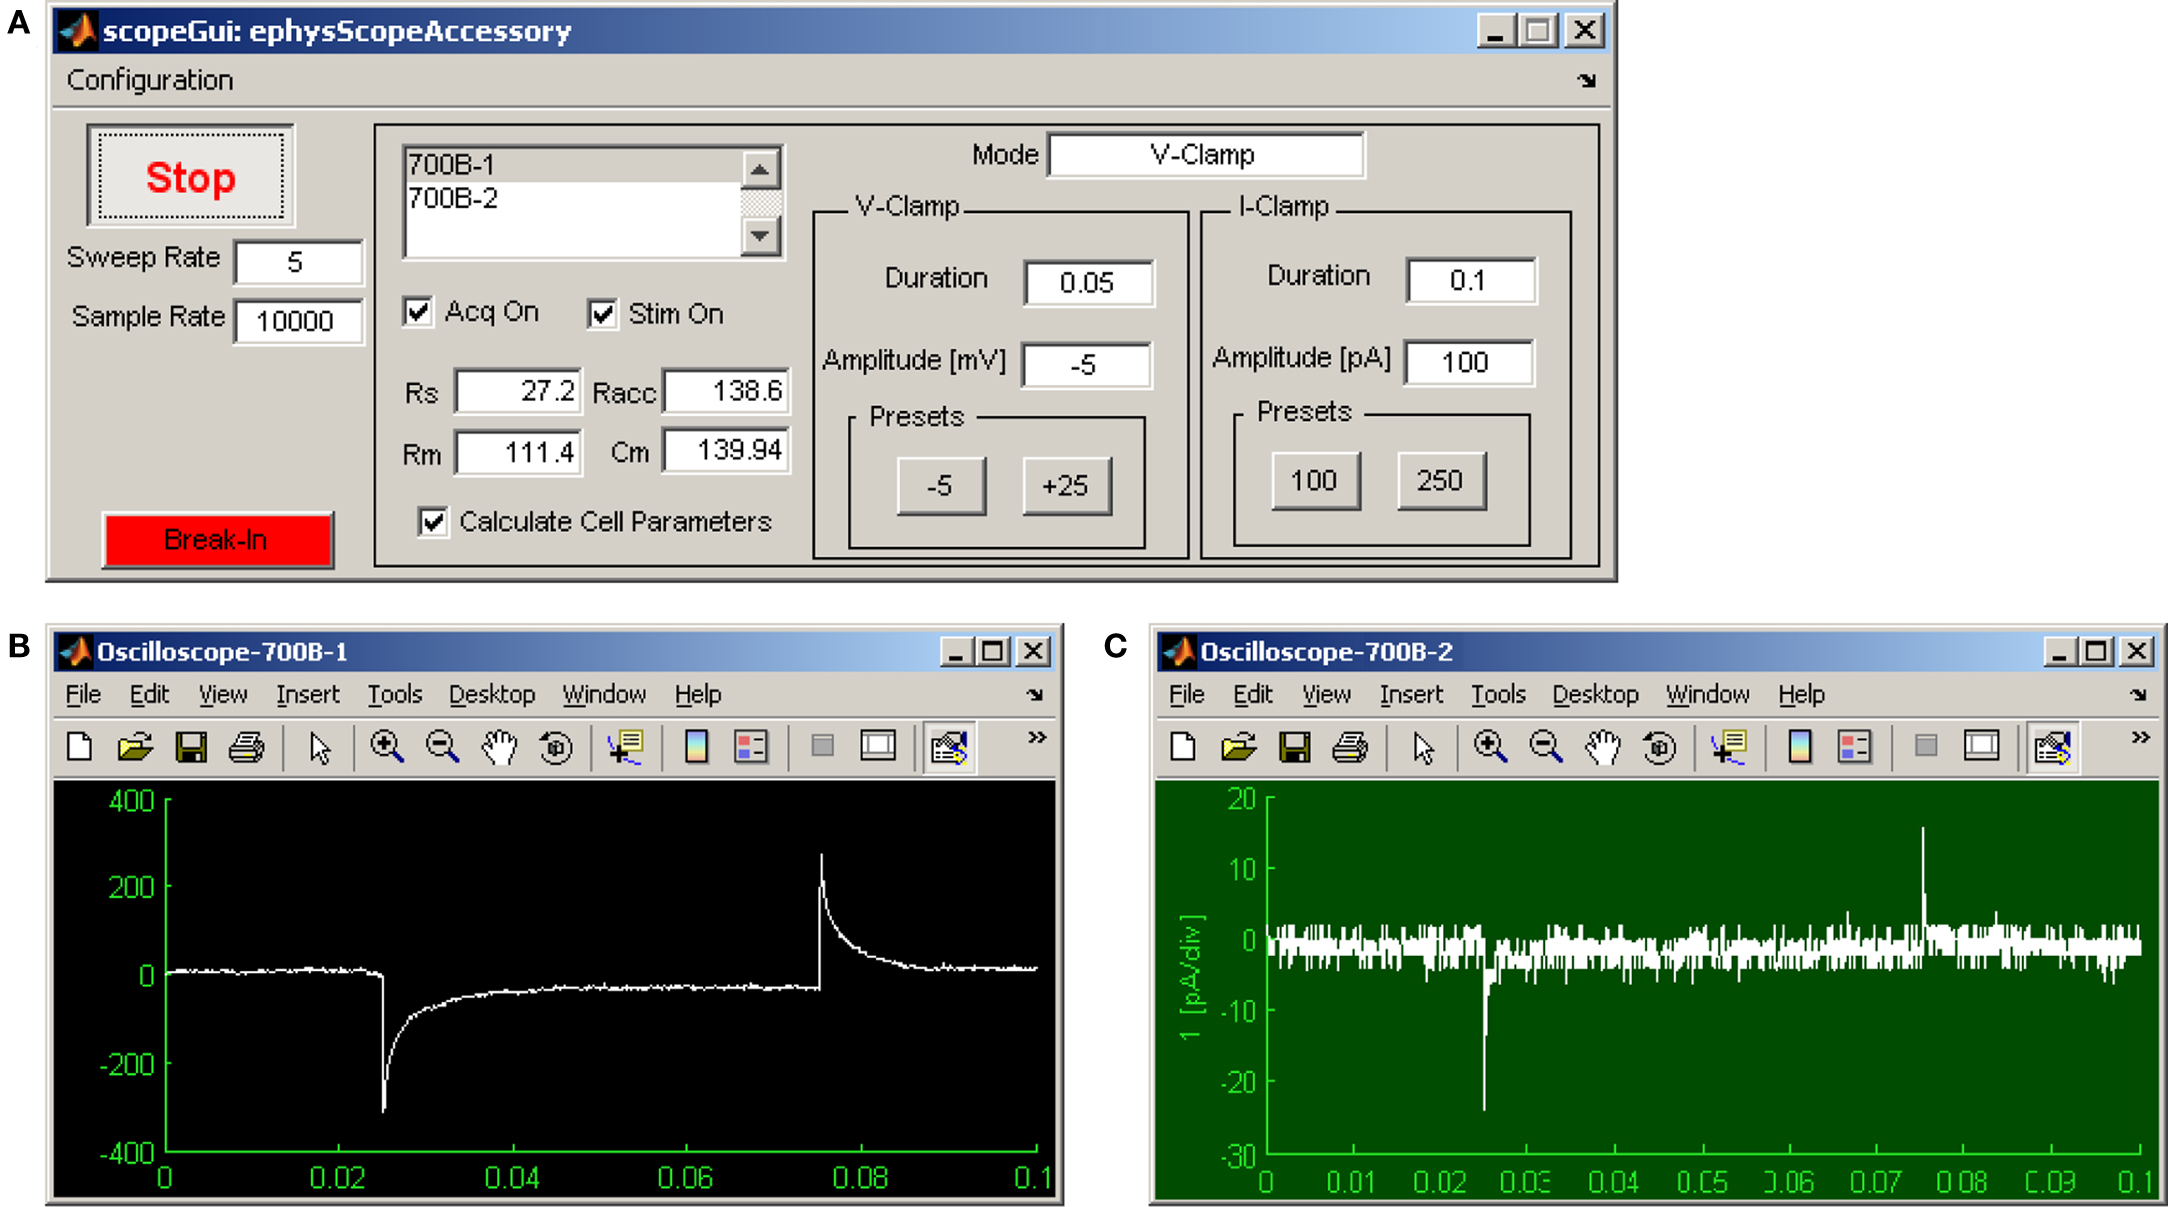
Figure 2. Ephus software oscilloscope, displaying two amplifier acquisition channels simultaneously. (A) The scopeGui can display voltage or current signals from multiple amplifier channels simultaneously, each in a separate window (B,C), as well as the associated amplifier mode (VC, IC, IC0). Sweep and sampling rate are adjustable. A periodic test pulse can be toggled on or off, and its duration and amplitude adjusted. When in voltage-clamp mode, basic cell parameters (input resistance and capacitance) and recording parameters (pipette, series, and access resistance) can be monitored for a selected channel. (B) Live display of whole-cell pipette current in voltage-clamp mode for channel #1. (C) Live display of pipette current in voltage-clamp mode after seal formation for channel #2.
Data acquisition with ephys
In the ephys program (Figure 3A), after selecting amplifier channels and assigning pulse patterns, a single trial is acquired by pushing the “Start” button. To repeat the same acquisition multiple times at a particular interval, ephys is placed in “External” trigger mode, the loopGui is set to the desired number of iterations and its “Start” button is then pushed to initiate and control the acquisition (Figure 3B).
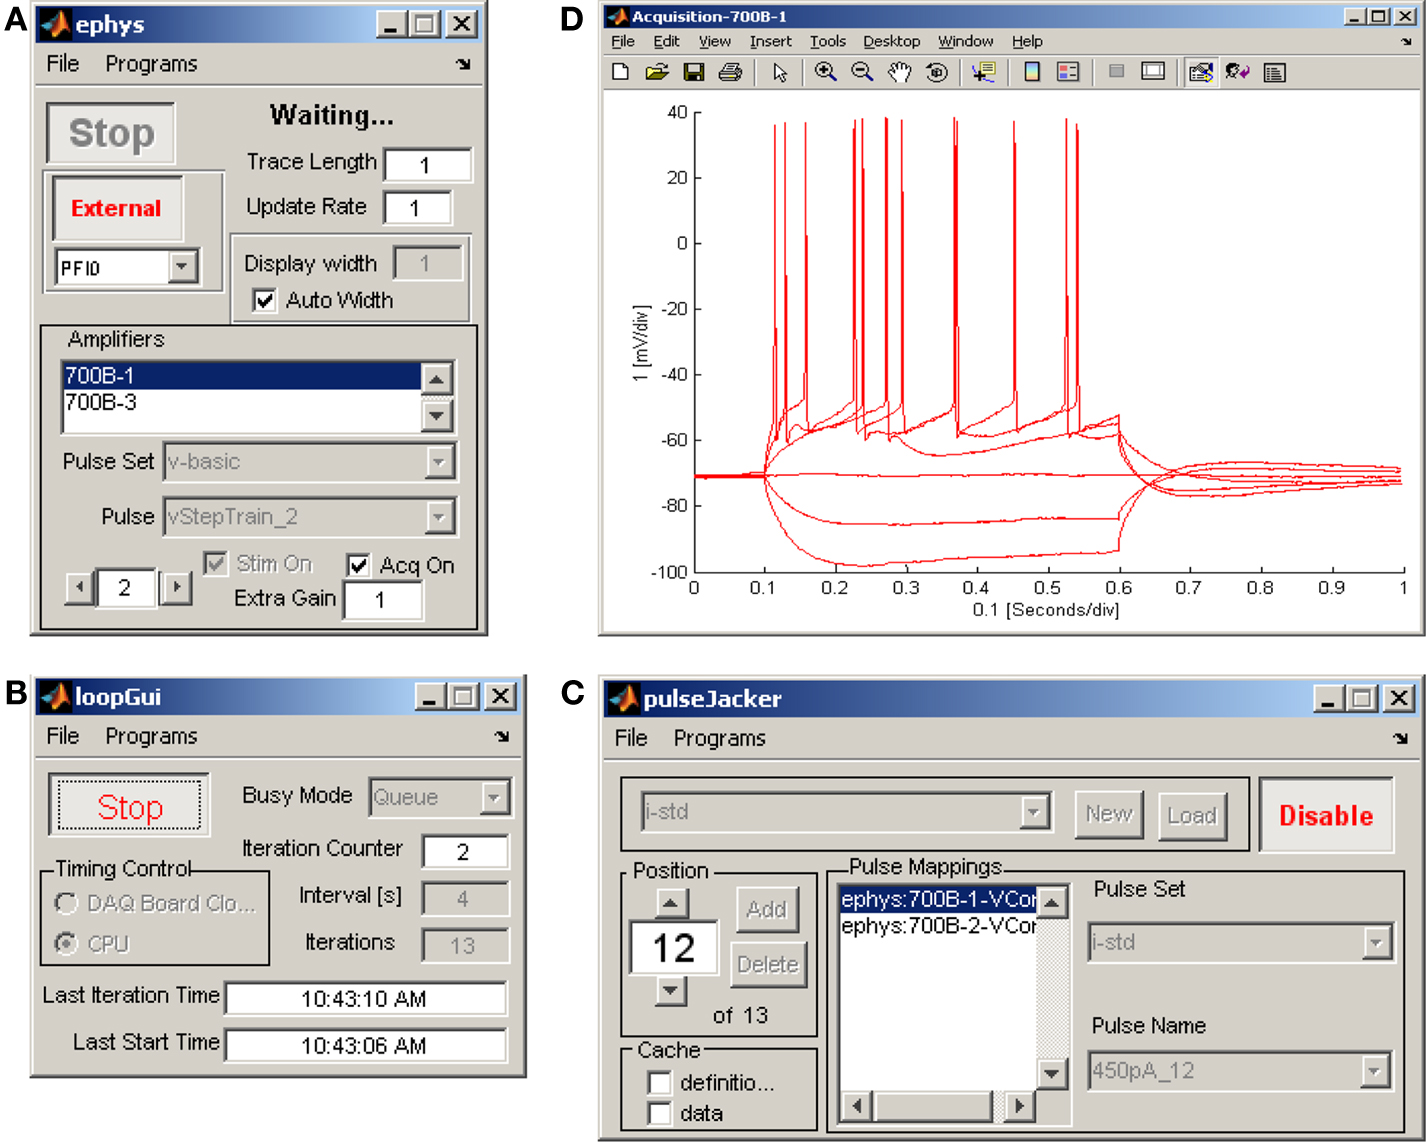
Figure 3. Ephus configuration for an in vitro electrophysiology experiment. Three Ephus programs coordinate to apply a family of current steps during a whole-cell recording. (A) ephys in external mode enables stimulation and acquisition on amplifier channel #1 in response to a trigger signal from loopGui. (B) loopGui triggers ephys, in 4-s intervals, for each pulse in the sequence defined by pulseJacker. (C) pulseJacker maps a sequence of pulse stimuli to individual amplifier channels. (D) The acquisition window displays the last record acquired, optionally overlaid with previously acquired records, as shown here for six sequential steps of increasing applied current.
It is often desirable to execute a series of pulses differing in one or more parameters. For example, a common paradigm in electrophysiology experiments is to present a family of step stimuli of differing amplitudes. This functionality is provided by the pulseJacker (Figures 3C,D), which allows cycle-by-cycle individual hardware channel specification (which channels will be active, and which pulses they will use). This is a particularly powerful feature in Ephus.
The Ephus layout for a typical electrophysiology recording session is shown in Figure 3.
Video-assisted electrophysiology
Many electrophysiology experiments involve a microscope and video imaging. Ephus includes the qcam program for both live display of a video image acquired using a digital video camera (see above), as well as saving single and multiple frames (i.e., movies) for off-line analysis. The qcam controls allow adjustments of exposure, temporal averaging, spatial binning, look-up tables, and region-of-interest zooming (Figure 4A). For saved video frames, the file-naming scheme can be specified manually, or delegated to the xsg program. The qcam program is commonly used in preview mode when establishing giga-ohm seals for patch-clamp whole-cell recordings (Figures 4A,B).
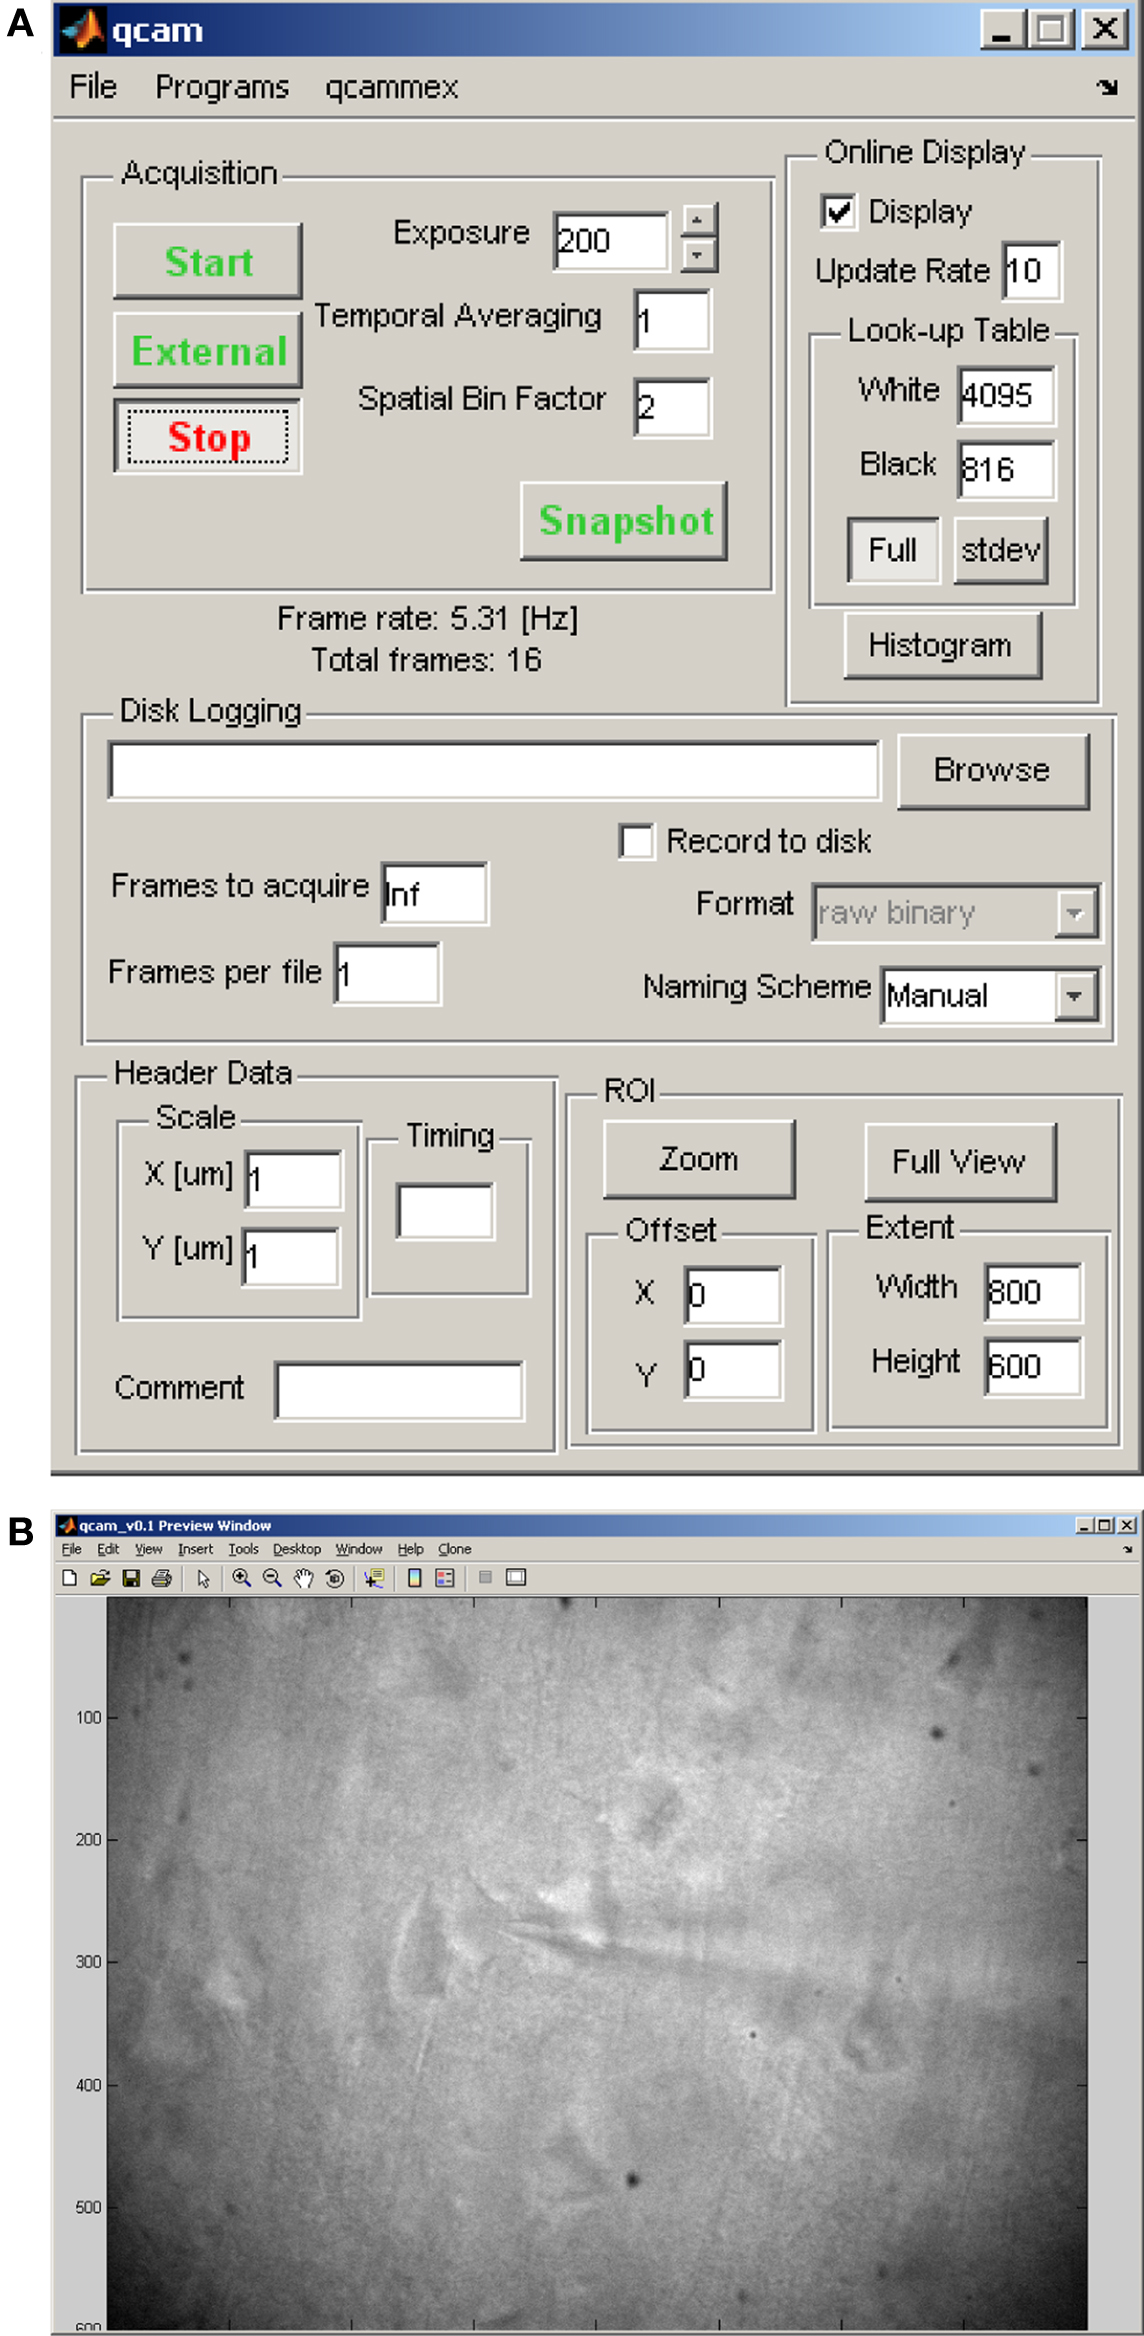
Figure 4. qcam: user interface for video control and display. (A) Control panel for video acquisition parameters (exposure, temporal averaging, spatial binning), online display parameters (frame rate, look-up table, zoom), and storage parameters. (B) Live video display, obtained by running the qcam program in preview mode, of pyramidal neurons in a brain slice during a patch-clamp experiment (60× water-immersion objective, 58 μm below surface of 300-μm thick sagittal slice in mouse motor cortex).
Synaptic Circuit Mapping Experiments
Hardware calibration
The photodiode program is used to calibrate the light sensitivity of a photodiode that samples the beam power. The imagingSys program is used to calibrate the voltage signals controlling mirror galvanometers. Calibration of a Pockels cell is performed at startup, and recalibration can be done at any time from the mapper.
mapper. The mapper program provides a collection of tools associated with synaptic circuit mapping. It consists of a single graphical user interface (Figure 5A) and a number of separate windows that facilitate alignment of the mapping grid to the sample (Figure 5B), visualization of the electrophysiologically recorded response to stimulation at a single site (Figure 5C), and to an entire pattern of stimulation sites (Figure 5D). One option allows “point-and-shoot” stimulation using the computer’s pointing device to select a single site, or at several user-selected sites in succession (see the “Flashing” section in Figure 5A). Another option allows map acquisition using rectangular stimulus grids and sequence patterns (see the “Mapping” section in Figure 5A). An associated video display window allows users to overlay stimulus grids on images of the sample, and to adjust the size and orientation of the mapping grid with respect to tissue landmarks (Figure 5B).
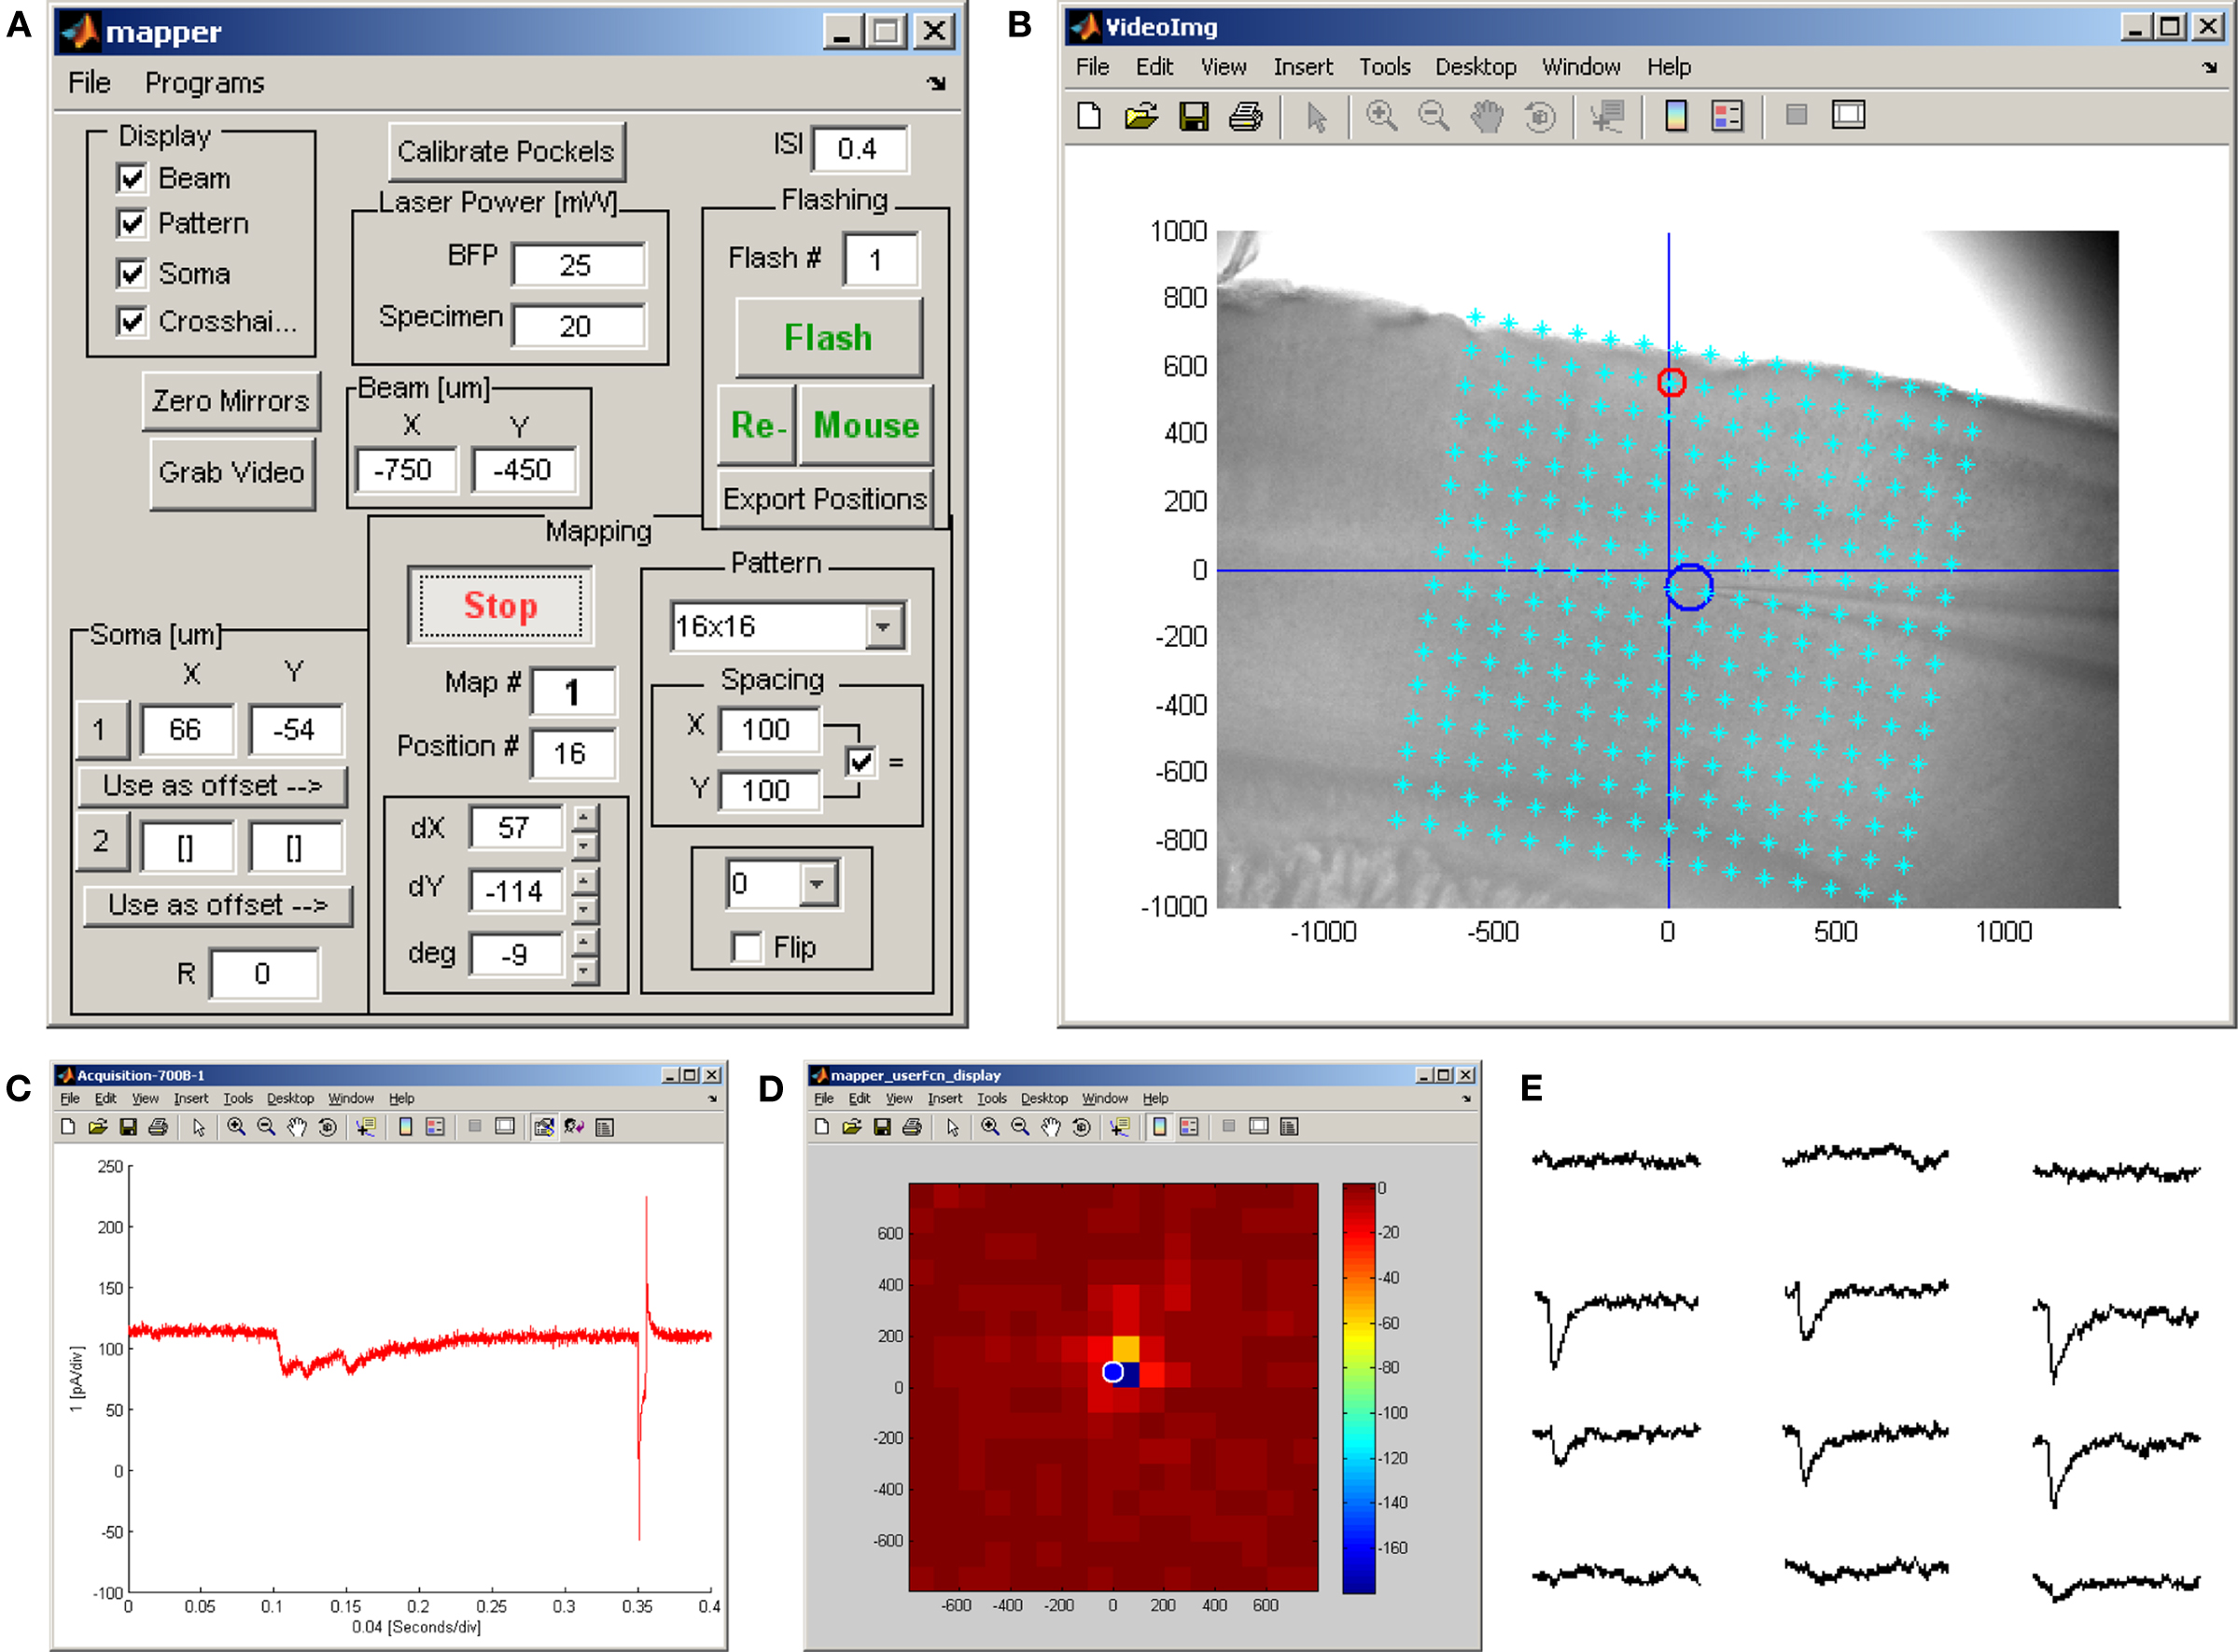
Figure 5. Ephus configuration for synaptic circuit mapping experiment. (A) The mapper program provides all controls necessary for scanning and flashing a laser beam across the sample in a specified grid pattern while simultaneously recording from one or more amplifier channels during each optical stimulus. Additional controls allow for calibrating a Pockels cell, calibrating transmitted laser power, selecting an appropriate grid pattern and adjusting its orientation, saving an image of the sample, marking the position of the recorded cell(s) in the field-of-view, and specifying the stimulation interval. Instead of a stimulation grid, the user can manually specify one or more positions at which to flash the sample. (B) An auxiliary window displaying the sample (in this case a sagittal slice of mouse motor cortex in 4× bright-field). The stimulation grid pattern is overlaid on the bright-field image and has been aligned (using the controls shown in A) to the pia and centered on the soma of the patched cell (blue circle). The red circle indicates the location of the last stimulus delivered. This display updates throughout the mapping procedure. (C) Voltage-clamp recording acquired during the last stimulus, showing a complex synaptic response, followed by a voltage step for monitoring recording parameters. (D) A standard user function performs a rapid analysis of the whole-cell recording (see C) and provides immediate feedback on the ongoing map in the form of a pseudo-color plot. This display updates throughout the mapping procedure. Note that this online display does not distinguish between direct (evident here in the strongest responses within 100–200 μm of the soma) from synaptic responses. (E) A map of traces acquired at 12 adjacent stimulation positions spanning a 400 by 300 μm region in layer 2/3; this is an excerpt of the map pattern shown in (B).
Once the stimulus grid has been translated and rotated into alignment with the sample, map acquisition is initiated and the mapper proceeds to stimulate the sample at every point specified in the map pattern, at the specified inter-stimulus interval. Figure 5E shows off-line visualization of a 4 × 6 excerpt of the raw current responses acquired during a 16 × 16 map using the stimulation grid shown in Figure 5B. Typically such current responses will be analyzed off-line to separate responses due to direct activation of the post-synaptic cell from those responses induced on the pre-synaptic population.
Event-Based in vivo Experiments
Multiple inputs can be recorded through AD and DIO channels with the acquirer program. The channels and the duration of recordings can be selected from the GUI (Figure 7A). For example, during behavioral experiments, event triggered recording of several readouts of the animal behavior can be simultaneously acquired (Figure 7B).
Notes on General Usage
Pulses
Pulses are made using the pulseEditor program. In addition, a standard set of electrophysiology-related pulses is available at the Ephus web site. The pulseEditor provides functionality for crafting step pulses, with options for specifying all standard parameters (number of steps, delay, duration, amplitude, etc.) and for simple combinations of pulses. Figure 6 shows the pulseEditor controls (Figure 6A) used to define a train of five pulses and to view the resulting waveform (Figure 6B) – this example makes use of the “additive” option to combine a train of five small negative pulses with a single, larger positive pulse. However, it is also possible to generate more elaborate custom pulses – indeed, any arbitrary waveform – by using the signalObject class included with Ephus. Figure 6C provides an example of such a custom pulse: this “chirp” signal is a sinusoid whose frequency increases linearly with time; it is used to study frequency-specific sub-threshold responses in whole-cell recordings.
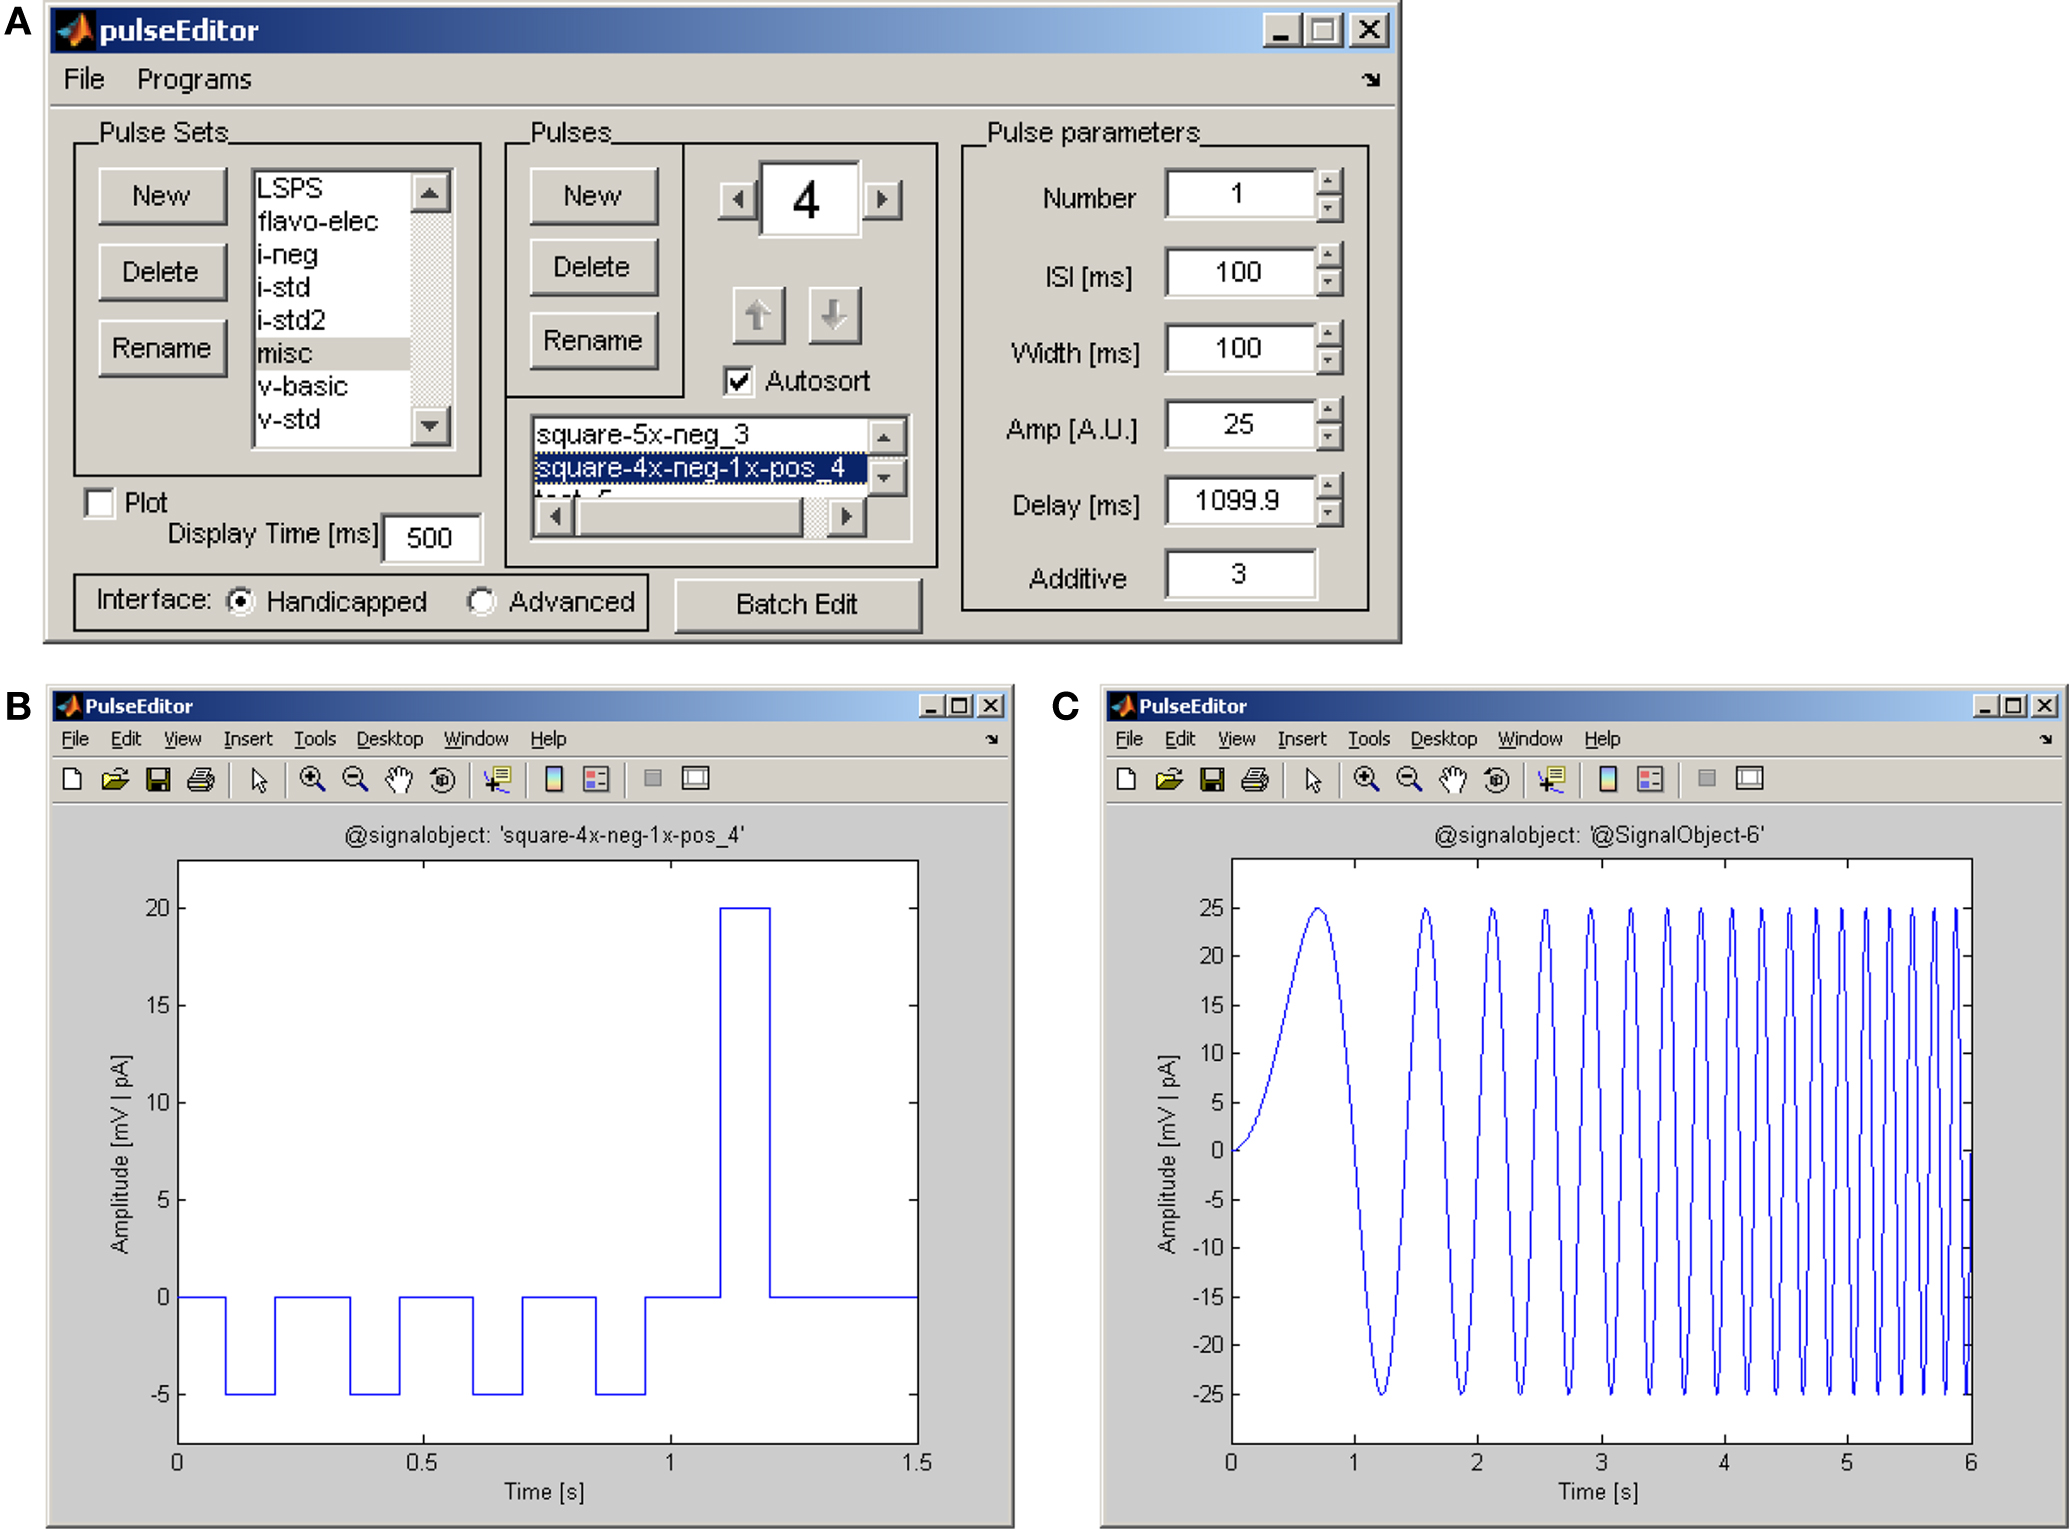
Figure 6. The pulseEditor program for creating and saving standard stimulation pulses. (A) User controls for defining pulse parameters (number of pulses in the train, inter-pulse interval, pulse duration, pulse amplitude, initial delay), grouping pulses into an ordered sequence, and plotting the stimulus amplitude vs. time. (B) Example of stimulation waveform created using the pulseEditor user interface with parameters set as in panel A. Here the “additive” feature is used to combine a single positive pulse with a previously created multi-pulse waveform. (C) Custom “chirp” waveform created using the signalObject Matlab object; the frequency of the sinusoid increases linearly with time.
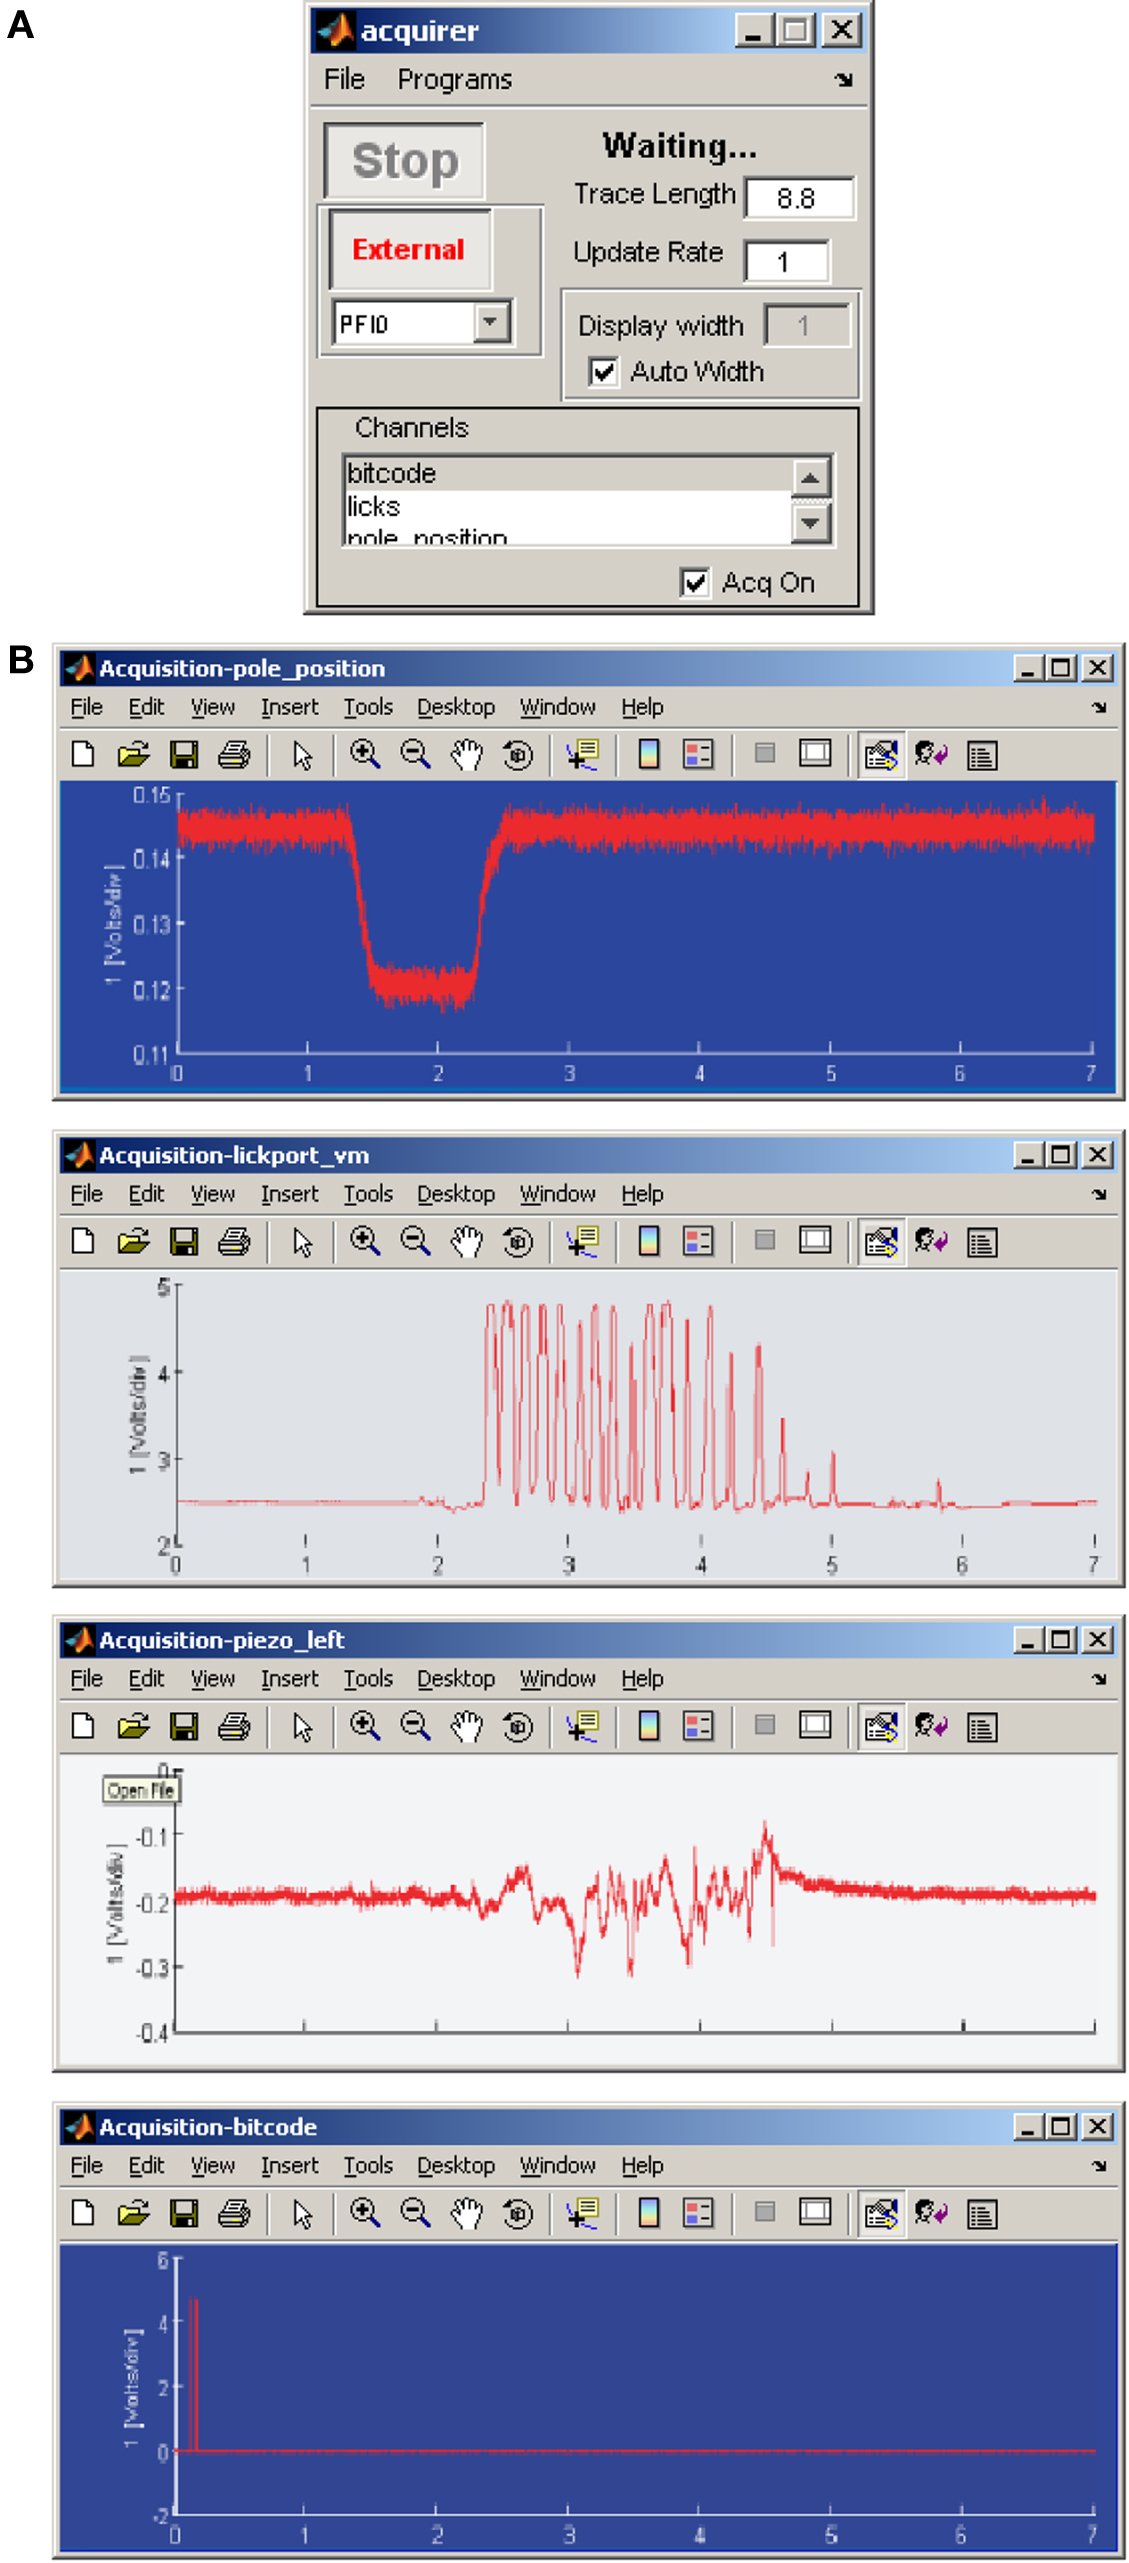
Figure 7. Ephus configuration for in vivo experiment. (A) Using the acquirer program several input channels can be configured for recording, triggered by an event. (B) Example of parameters simultaneously recorded during a behavioral experiment.
Map patterns
Map pattern files specify the sequence of stimulation sites in a grid and are available on the Ephus web site. In addition, the mapper accepts custom map patterns.
Saving settings and configurations
A particular collection and arrangement of Ephus modules can be saved as a named configuration. Multiple configurations can be saved. In addition, hotswitches provide a way to change program settings rapidly and conveniently.
Ephus menu bar
Every Ephus program has a menu bar providing at least two standard command items: One menu (“File”) provides access to configuration loading and saving. A second menu (“Programs”) provides access to all programs (Figure 1).
Start/External buttons
A subset of programs has these buttons. Pushing “Start” immediately triggers the acquisition. Pushing “External” puts the program in external-trigger mode. Programs in external mode can be triggered by pushing the “Start” button of another program; for example, in this way the loopGui can be used to launch ephys, stimulator, and acquirer together, ensuring a common start time. Alternatively, a trigger pulse generated by software or hardware outside of Ephus can also be used in external mode.
Loop control
In addition to setting the number of iterations and starting loops, the loopGui also provides an option for seamless (DAC mode) or intermittent (CPU mode) looping. In DAC mode a continuous record of the iteration sequence is saved to a single data file, while in CPU mode separate files contain a record for each iteration. The DAC mode provides real-time reliability between loop iterations, at the expense of logging/sending data at all times. Meanwhile, the CPU mode allows for closed-loop control and sparser data-logging, at the expense of potential inter-iteration jitter (typically on the order of milliseconds to tens of milliseconds) and longer inter-iteration intervals.
Stimulus/acquisition duration
The overall duration of stimulus pulses is not set in the pulseEditor; instead, the “Trace Length” parameter in the programs that use these pulses (e.g., ephys, stimulator) individually sets the duration of the stimulus pulses. Similarly, this parameter sets the duration of data acquisition in the acquirer.
The “Update Rate” and “Display Width” parameters in the data-acquiring programs (ephys and acquirer) allow users to modify the way data are displayed (there is no effect on the way data are stored). This is particularly useful when acquiring traces that are many seconds or more in duration.
Flexibility and Extensibility: Examples
Custom configurations
The use of configurations and hotswitches was described above. These allow users to switch rapidly between complex experimental configurations while viewing only those particular program windows necessary to the task at hand.
Custom stimulus pulses
While the pulseEditor provides controls for defining trains of square pulses, arbitrary stimulus waveforms (see Figure 6C) can be defined using the lower-level signalObject Matlab object included with Ephus. To use a custom stimulus the user first defines the waveform (e.g., as a linear combination of trigonometric functions, as an arbitrary analytic equation in time, a named probability distribution, or from arbitrary array data), saves the resulting signalObject as a pulse file, and selects it for delivery on an amplifier or other hardware DIO or DA channel as specified in stimulator or ephys.
Custom optical stimulation experiments
Optical stimulation protocols are not limited to the capabilities offered by the mapper. For example, custom routines can be used on-line to rapidly generate and deliver precise spatial and temporal stimuli to investigate spatio-temporal integration in synaptic circuits.
User functions
Ephus provides many hooks in the event flow and elsewhere that allow “user functions” to act on events and data. A number of user functions are built-in. Templates are provided to facilitate development of custom user functions.
Combining Ephus and multiphoton microscopy via Scanimage
There is growing interest in combining two-photon laser scanning microscopy and electrophysiological recording, an approach that has been used extensively for experiments such as high-resolution imaging of Ca2+ dynamics in dendritic spines. Ephus and ScanImage can be used simultaneously for this purpose (O’Connor et al., 2008). For most applications, this is as simple as linking the trigger signals between the two software packages, which is often all that is needed to interface Ephus with external instrumentation. More advanced experiments may employ custom user functions to simplify operating both software suites quickly. Telegraphed data, in either direction, may be used to provide timestamps across programs for use in analysis. Depending on hardware availability, physical space, and other concerns, Ephus and ScanImage may be run on the same computer (using one or separate instances of Matlab) or on separate machines.
For the Developer: Notes on Ephus Software Architecture
Ephus is heavily object-oriented (Booch et al., 1994) and event-based (Yourdon and Constantine, 1979). The layered architecture and interconnections for a selected set of core software and hardware components are presented as a schematic diagram (Figure 8). Ephus is object-oriented in the sense that the programs themselves, and the subcomponents (i.e., data acquisition, event distribution, device interfaces, etc.), are all implemented as classes/objects. The classes encapsulate related data and functionality and designate a specific, associated lifecycle for each object instance. This results in cleaner and more modular code than would be achieved with traditional functional programming. Since the mid-1990s, object-oriented programming has been standard in the design of most commercial software. Object-oriented design is not yet as common in the Matlab environment as in many other environments. Matlab has a number of object-orientation schemes that have grown over the years. Ephus is written using the earliest supported style of Matlab classes (which was all that was available at the start of the Ephus project), and implements its own pass-by-reference semantic scheme. Pass-by-reference is an important concept, which allows one instance of a particular object to be accessible from multiple, loosely coupled locations in the code, which in turn allows all such locations to see the same state for a given object. This becomes important when implementing event-based programming, where it is unclear, prior to runtime, which code will be accessing specific objects at any given time.
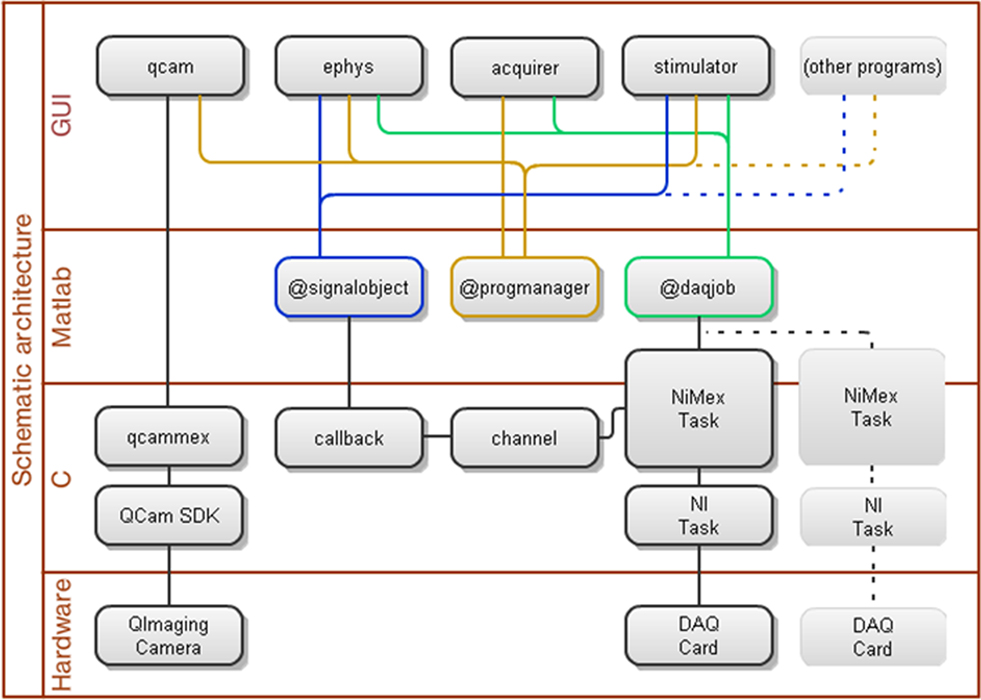
Figure 8. Schematic diagram describing connections and layered architecture for a selected set of software and hardware components of the core Ephus data acquisition system.
Matlab is a single-threaded environment. This means that the simple act of entering into a loop would prevent Matlab from performing other tasks, including processing any other input. To get around this limitation, critical sections of the Ephus architecture rely on the propagation of events. Objects interested in a specific event (typically an input event or a state change) must register with the appropriate agent, and when the event occurs, all registered listeners are notified. An event may be generated by a hardware subsystem (i.e., via NiMex), user input, or other source. With an event-based design, when a section of code needs a change in the program state (i.e., waiting for an external trigger, waiting for a loop iteration event, waiting for user input) in order to proceed, it does not tie up the Matlab interpreter, as it would if it used a polling loop (i.e., “while <state_not_set>”). The act of waiting for an event does not require constant computation, and subsequently leaves the Matlab interpreter free to carry out other actions. The propagation of events and the flow of control in response to user action are presented in a software sequence diagram (Figure 9). In this example, a user initiates an LSPS map by mouse-click in the mapper, and a number of programs, classes, user functions, toolboxes and device drivers interact to complete the map pixel-by-pixel.
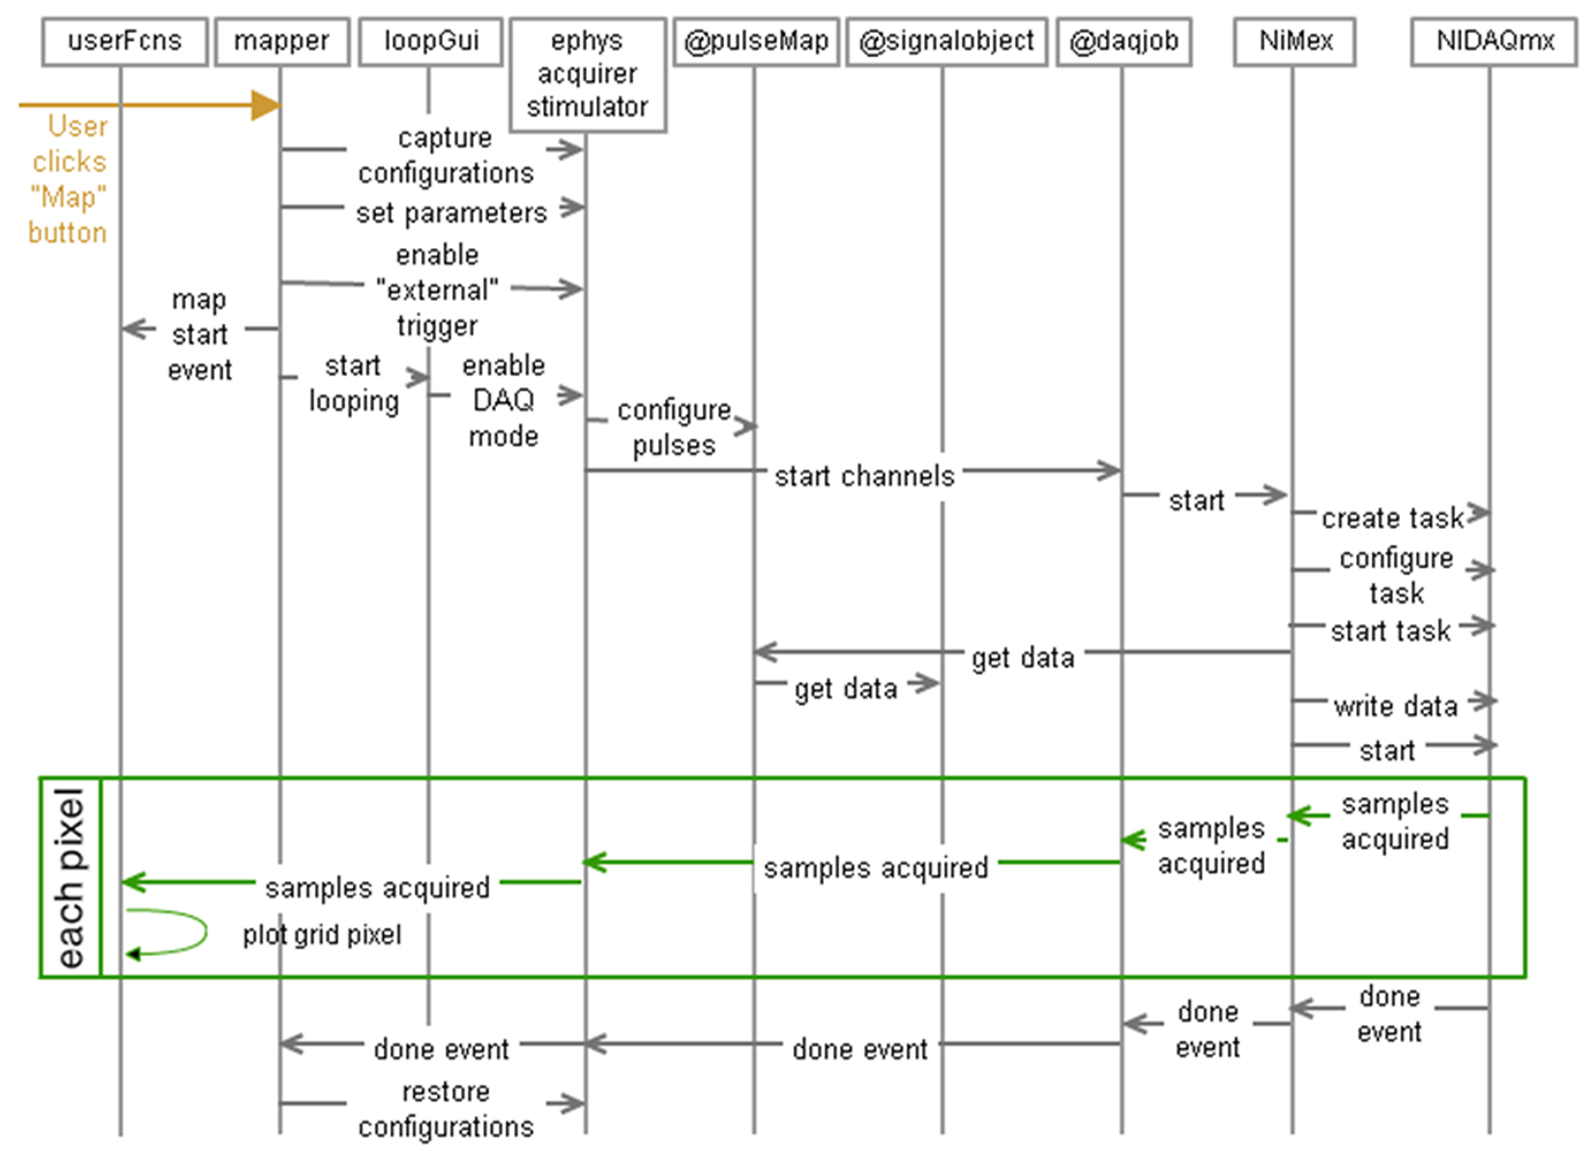
Figure 9. Sequence diagram of the propagation of events and the flow of control in response to user action. In this example, a user initiates an LSPS map by mouse-click in the mapper, and a number of programs, classes, user functions, toolboxes and device drivers interact to complete the map pixel-by-pixel.
The programmable user functions available throughout Ephus are one of the most obvious examples of the event-based system design. In the case of user functions, the event and registration mechanism is exposed all the way up to the user level. However, this design principle is inherent to the software architecture, all the way to the hardware interfaces (including down into the underlying C code).
A number of industry-standard design patterns (Gamma et al., 1995) and best practices are employed throughout the implementation of Ephus. The code is rigorously documented on a per-function basis, with descriptions of all arguments, usage, and caveats. The system was designed from the very beginning with the capability for it to be modified, particularly by end-users, in mind. Various levels of programming proficiency are acceptable for customizing Ephus, because it has its own levels of complexity designed into it. At the highest level (simplest from a programmer’s perspective), a user may write a new user function or modify an existing one. Moving to a lower level, users may write code to generate their own pulses and pulseJacker cycles. Lower still, users may write their own objects (i.e., write a new amplifier class for ephys to interface with new hardware). At an even lower level, users may create entirely new programs to add fundamentally new functionality to the system. Finally, users may modify the overall architecture and the C code (in NiMex). In practice, a large number of experiments may be automated simply by writing user functions and making pulseJacker cycles, it is rarely necessary to touch any of the lower-level code. Example functions are supplied with Ephus that demonstrate how to write user functions and how to create pulseJacker cycles in an automated fashion. These functions are heavily documented and are intended as tutorials and templates for users.
Conclusion
Ephus is an open-source, flexible software package for general-purpose data acquisition. Flexibility and extensibility make Ephus potentially useful for a wide variety of neuroscience experiments ranging from standard in vitro electrophysiology to synaptic circuit mapping to complex event-based in vivo paradigms.
Interested readers are referred to previous studies for further examples of different experimental paradigms enabled by Ephus software (Table 1). To date, a majority of the published studies have involved circuit mapping. We anticipate continued utility of Ephus both for “standard” LSPS mapping experiments, and for more customized mapping-type experiments involving user-specified spatio-temporal stimulation patterns.
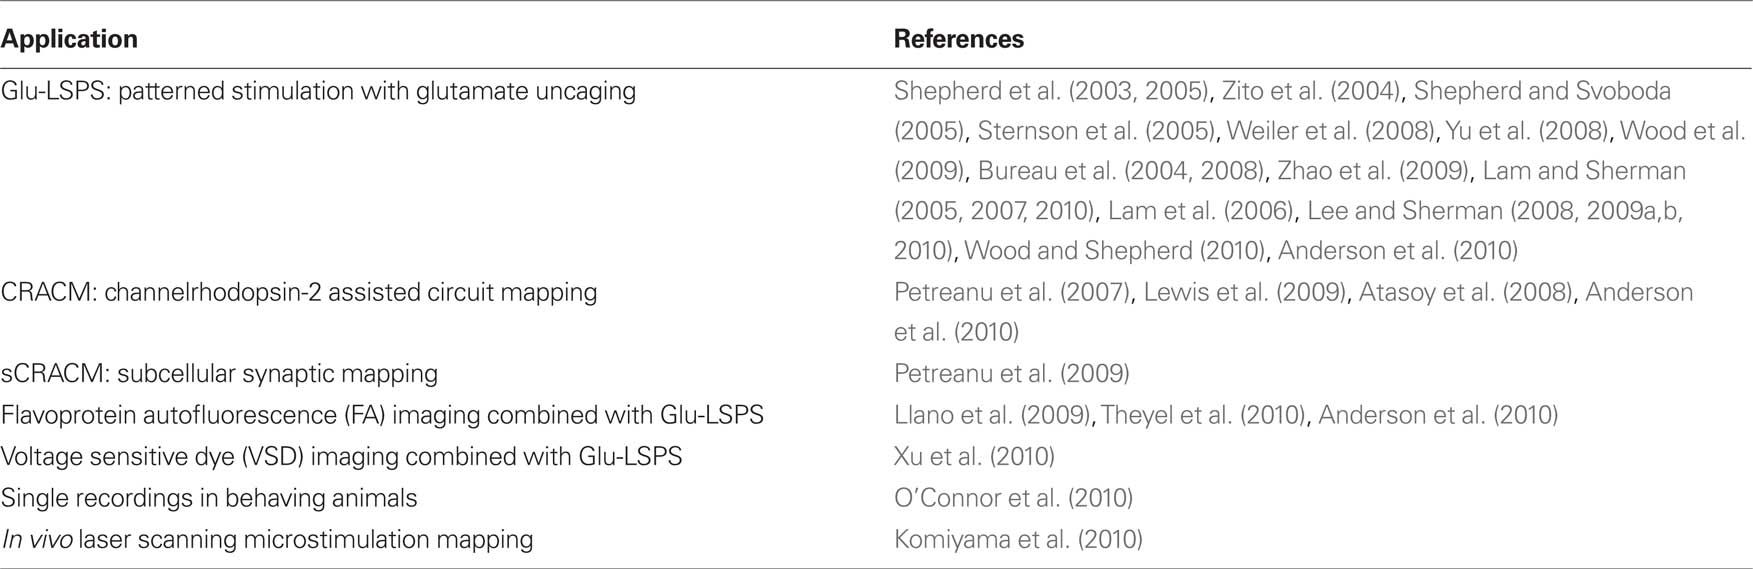
Table 1. Diverse experimental applications using Ephus.
In this report we have focused on the use of Ephus for data acquisition and have not described the various approaches that are possible for off-line analysis of Ephus-acquired data. The Ephus package does not include advanced analysis routines, as it is assumed that most users will require customized routines for analysis of their custom-acquired data sets. However, a simple GUI-based tool (traceBrowser) is provided, and serves as a starting point for users to develop their own analysis tools. Additionally, some basic tools with graphical user interfaces are provided on the Ephus web site for reviewing traces and analyzing mapping data.
Author Contributions
Timothy O’Connor led the software development and programming aspects of the project, and Vijay Iyer co-developed and programmed. Gordon M. G. Shepherd and Karel Svoboda designed the overall concept and managed the project. Benjamin A. Suter, Leopoldo T. Petreanu, Bryan M. Hooks, and Taro Kiritani tested software and helped with debugging. Benjamin A. Suter and Gordon M. G. Shepherd drafted the manuscript with input from all authors.
Conflict of Interest Statement
The authors declare that the research was conducted in the absence of any commercial or financial relationships that could be construed as a potential conflict of interest.
Acknowledgments
We thank our colleagues for field testing and feedback at many stages of development, including D. Huber, V. Jayaraman, T. Mao, D. O’Connor, P. Sheets, S. Sternson, T. Tzounopoulos, and X. Xu. Funded by the National Institutes of Health (EB001464) and Howard Hughes Medical Institute.
References
Anderson, C. T., Sheets, P. L., Kiritani, T., and Shepherd, G. M. (2010). Sublayer-specific microcircuits of corticospinal and corticostriatal neurons in motor cortex. Nat. Neurosci. 13, 739–744.
Atasoy, D., Aponte, Y., Su, H. H., and Sternson, S. M. (2008). A FLEX switch targets Channelrhodopsin-2 to multiple cell types for imaging and long-range circuit mapping. J. Neurosci. 28, 7025–7030.
Booch, G., Maksimchuk, R., Engle, M., Young, B., Conallen, J., and Houston, K. (1994). Object-Oriented Analysis and Design with Applications. Menlo Park, CA: Benjamin/Cummings.
Bureau, I., Shepherd, G. M., and Svoboda, K. (2004). Precise development of functional and anatomical columns in the neocortex. Neuron 42, 789–801.
Bureau, I., Shepherd, G. M., and Svoboda, K. (2008). Circuit and plasticity defects in the developing somatosensory cortex of FMR1 knock-out mice. J. Neurosci. 28, 5178–5188.
Gamma, E., Helm, R., Johnson, R., and Vlissides, J. (1995). Design Patterns: Elements of Reusable Object-Oriented Software. Reading, MA: Addison-Wesley.
Komiyama, T., Sato, T. R., O’Connor, D. H., Zhang, Y. X., Huber, D., Hooks, B. M., Gabitto, M., and Svoboda, K. (2010). Learning-related fine-scale specificity imaged in motor cortex circuits of behaving mice. Nature 464, 1182–1186.
Lam, Y. W., Nelson, C. S., and Sherman, S. M. (2006). Mapping of the functional interconnections between thalamic reticular neurons using photostimulation. J. Neurophysiol. 96, 2593–2600.
Lam, Y. W., and Sherman, S. M. (2005). Mapping by laser photostimulation of connections between the thalamic reticular and ventral posterior lateral nuclei in the rat. J. Neurophysiol. 94, 2472–2483.
Lam, Y. W., and Sherman, S. M. (2007). Different topography of the reticulothalmic inputs to first- and higher-order somatosensory thalamic relays revealed using photostimulation. J. Neurophysiol. 98, 2903–2909.
Lam, Y. W., and Sherman, S. M. (2010). Functional organization of the somatosensory cortical layer 6 feedback to the thalamus. Cereb. Cortex 20, 13–24.
Lee, C. C., and Sherman, S. M. (2008). Synaptic properties of thalamic and intracortical inputs to layer 4 of the first- and higher-order cortical areas in the auditory and somatosensory systems. J. Neurophysiol. 100, 317–326.
Lee, C. C., and Sherman, S. M. (2009a). Modulator property of the intrinsic cortical projection from layer 6 to layer 4. Front. Syst. Neurosci. 3:3. doi: 10.3389/neuro.06.003.2009.
Lee, C. C., and Sherman, S. M. (2009b). Glutamatergic inhibition in sensory neocortex. Cereb. Cortex 19, 2281–2289.
Lee, C. C., and Sherman, S. M. (2010). Topography and physiology of ascending streams in the auditory tectothalamic pathway. Proc. Natl. Acad. Sci. U.S.A. 107, 372–377.
Lewis, T. L. Jr., Mao, T., Svoboda, K., and Arnold, D. B. (2009). Myosin-dependent targeting of transmembrane proteins to neuronal dendrites. Nat. Neurosci. 12, 568–576.
Llano, D. A., Theyel, B. B., Mallik, A. K., Sherman, S. M., and Issa, N. P. (2009). Rapid and sensitive mapping of long-range connections in vitro using flavoprotein autofluorescence imaging combined with laser photostimulation. J. Neurophysiol. 101, 3325–3340.
O’Connor, D. H., Clack, N. G., Huber, D., Komiyama, T., Myers, E. W., and Svoboda, K. (2010). Vibrissa-based object localization in head-fixed mice. J. Neurosci. 30, 1947–1967.
O’Connor, T., Iyer, V., Liu, J., Petreanu, L., Jayaraman, V., Shepherd, G. M. G., and Svoboda, K. (2008). ScanImage and Ephus: modular control software for laser-scanning and neurophysiological measurements. Washington, DC: Society for Neuroscience.
O’Connor, T., Iyer, V., Petreanu, L., Hooks, B. M., Sternson, S. M., Svoboda, K., and Shepherd, G. M. G. (2009). Ephus: A suite of software tools for electrophysiological and circuit mapping experiments. Chicago, IL: Society for Neuroscience.
Petreanu, L., Huber, D., Sobczyk, A., and Svoboda, K. (2007). Channelrhodopsin-2-assisted circuit mapping of long-range callosal projections. Nat. Neurosci. 10, 663–668.
Petreanu, L., Mao, T., Sternson, S. M., and Svoboda, K. (2009). The subcellular organization of neocortical excitatory connections. Nature 457, 1142–1145.
Pologruto, T. A., Sabatini, B. L., and Svoboda, K. (2003). ScanImage: Flexible software for operating laser-scanning microscopes. Biomed. Eng. Online 2, 13. doi: 10.1186/1475-925X-2-13.
Shepherd, G. M. G., Pologruto, T. A., and Svoboda, K. (2003). Circuit analysis of experience-dependent plasticity in the developing rat barrel cortex. Neuron 38, 277–289.
Shepherd, G. M. G., Stepanyants, A., Bureau, I., Chklovskii, D. B., and Svoboda, K. (2005). Geometric and functional organization of cortical circuits. Nat. Neurosci. 8, 782–790.
Shepherd, G. M. G., and Svoboda, K. (2005). Laminar and columnar organization of ascending excitatory projections to layer 2/3 pyramidal neurons in rat barrel cortex. J. Neurosci. 25, 5670.
Sternson, S. M., Shepherd, G. M., and Friedman, J. M. (2005). Topographic mapping of VMH --> arcuate nucleus microcircuits and their reorganization by fasting. Nat. Neurosci. 8, 1356–1363.
Theyel, B. B., Llano, D. A., and Sherman, S. M. (2010). The corticothalamocortical circuit drives higher-order cortex in the mouse. Nat. Neurosci. 13, 84–88.
Weiler, N., Wood, L., Yu, J., Solla, S. A., and Shepherd, G. M. G. (2008). Top-down laminar organization of the excitatory network in motor cortex. Nat. Neurosci. 11, 360–366.
Wood, L., Gray, N. W., Zhou, Z., Greenberg, M. E., and Shepherd, G. M. (2009). Synaptic circuit abnormalities of motor-frontal layer 2/3 pyramidal neurons in an RNA interference model of methyl-CpG-binding protein 2 deficiency. J. Neurosci. 29, 12440–12448.
Wood, L., and Shepherd, G. M. (2010). Synaptic circuit abnormalities of motor-frontal layer 2/3 pyramidal neurons in a mutant mouse model of Rett syndrome. Neurobiol. Dis. 38, 281–287.
Xu, X., Olivas, N. D., Levi, R., Ikrar, T., and Nenadic, Z. (2010). High precision and fast functional mapping of cortical circuitry through a novel combination of voltage sensitive dye imaging and laser scanning photostimulation. J. Neurophysiol. 103, 2301–2312.
Yourdon, E., and Constantine, L. L. (1979). Structured Design: Fundamentals of a Discipline of Computer Program and System Design. Upper Saddle River, NJ: Prentice-Hall.
Yu, J., Anderson, C. T., Kiritani, T., Sheets, P. L., Wokosin, D. L., Wood, L., and Shepherd, G. M. (2008). Local-circuit phenotypes of layer 5 neurons in motor-frontal cortex of YFP-H mice. Front. Neural. Circuits 2:6. doi:10.3389/neuro.04.006.2008.
Zhao, C., Kao, J. P., and Kanold, P. O. (2009). Functional excitatory microcircuits in neonatal cortex connect thalamus and layer 4. J. Neurosci. 29, 15479–15488.
Keywords: software, data acquisition, electrophysiology, mapping, imaging
Citation: Suter BA, O’Connor T, Iyer V, Petreanu LT, Hooks BM, Kiritani T, Svoboda K and Shepherd GMG (2010) Ephus: multipurpose data acquisition software for neuroscience experiments. Front. Neural Circuits. 4:100. doi: 10.3389/fncir.2010.00100
Received: 18 April 2010;
Paper pending published: 18 May 2010;
Accepted: 01 July 2010;
Published online: 26 August 2010
Edited by:
Giorgio Ascoli, George Mason University, USAReviewed by:
German Barrionuevo, University of Pittsburgh, USAXiangmin Xu, University of California at Irvine, USA
Copyright: © 2010 Suter, O’Connor, Iyer, Petreanu, Hooks, Kiritani, Svoboda and Shepherd. This is an open-access article subject to an exclusive license agreement between the authors and the Frontiers Research Foundation, which permits unrestricted use, distribution, and reproduction in any medium, provided the original authors and source are credited.
*Correspondence: Gordon M. G. Shepherd, Department of Physiology, Feinberg School of Medicine, Northwestern University, Morton 5-660, 303 East Chicago Avenue, Chicago, IL 60611, USA. e-mail: scanimagers@gmail.com