In vivo labeling of constellations of functionally identified neurons for targeted in vitro recordings
- 1 Neurosciences Graduate Program, University of California San Diego, La Jolla, CA, USA
- 2 Howard Hughes Medical Institute, University of California San Diego, La Jolla, CA, USA
- 3 Center for Neural Circuits and Behavior, University of California San Diego, La Jolla, CA, USA
- 4 Neurobiology Section, Division of Biology, University of California San Diego, La Jolla, CA, USA
Relating the functional properties of neurons in an intact organism with their cellular and synaptic characteristics is necessary for a mechanistic understanding of brain function. However, while the functional properties of cortical neurons (e.g., tuning to sensory stimuli) are necessarily determined in vivo, detailed cellular and synaptic analysis relies on in vitro techniques. Here we describe an approach that combines in vivo calcium imaging (for functional characterization) with photo-activation of fluorescent proteins (for neuron labeling), thereby allowing targeted in vitro recording of multiple neurons with known functional properties. We expressed photo-activatable GFP rendered non-diffusible through fusion with a histone protein (H2B–PAGFP) in the mouse visual cortex to rapidly photo-label constellations of neurons in vivo at cellular and sub-cellular resolution using two-photon excitation. This photo-labeling method was compatible with two-photon calcium imaging of neuronal responses to visual stimuli, allowing us to label constellations of neurons with specific functional properties. Photo-labeled neurons were easily identified in vitro in acute brain slices and could be targeted for whole-cell recording. We also demonstrate that in vitro and in vivo image stacks of the same photo-labeled neurons could be registered to one another, allowing the exact in vivo response properties of individual neurons recorded in vitro to be known. The ability to perform in vitro recordings from neurons with known functional properties opens up exciting new possibilities for dissecting the cellular, synaptic, and circuit mechanisms that underlie neuronal function in vivo.
Introduction
Understanding the connectivity, synaptic properties, and intrinsic electrophysiological characteristics of neurons whose function has been established in response to sensory stimuli or during behavior is a major challenge in neuroscience. In fact while the function of individual neurons must be assessed in intact animals in vivo, connectivity, synaptic properties, and intrinsic electrophysiological characteristics of neurons are best determined in brain explants, in vitro. This holds true even for local connectivity patterns between neighboring neurons since, despite the existence of functional maps, neighboring neurons are not necessarily functionally identical (Ohki et al., 2005; Bandyopadhyay et al., 2010; Rothschild et al., 2010). Recent work relating sensory responses recorded in vivo with connectivity established in vitro has indeed revealed a tight correlation between function and connectivity among neurons in the mouse visual cortex (Bock et al., 2011; Ko et al., 2011).
Previous approaches for studying neurons with known in vivo functional properties have utilized in vivo intracellular or juxtacellular recording and staining of single neurons with dye-filled electrodes followed by post hoc morphological reconstruction (Gilbert and Wiesel, 1979; Pinault, 1996). The major drawback of this approach is that the recorded neurons are re-identified in fixed tissue, precluding targeted electrophysiology in acute brain slices. Additionally, neurons are recorded one at a time, making this technique inherently low-yield. One recent study overcame some of these issues by combining in vivo calcium imaging with 3D registration techniques to assign functional properties to neurons in acute brain slices, however this technique relies on careful alignment of in vivo and in vitro image stacks (Ko et al., 2011).
We have developed an approach that allows us to fluorescently label constellations of neurons transfected with a non-diffusible photo-activatable fluorescent protein in vivo. In combination with in vivo calcium imaging of sensory responses, this approach allows an experimenter to rapidly fluorescently label constellations of neurons based on their functional properties. We demonstrate that these functionally defined constellations can be targeted for subsequent detailed cellular and connectivity analysis in vitro. This approach, by greatly facilitating the identification and targeting of neurons in vitro whose function has been previously established in vivo will contribute toward integrating the experimental approaches of systems and cellular neuroscience.
Results
To photo-label neurons, we utilized photo-activatable GFP (PAGFP), a weakly fluorescent version of GFP that is converted to a strongly fluorescent form upon brief exposure to light of the appropriate wavelength (Patterson and Lippincott-Schwartz, 2002). To prevent diffusion of the photo-activated fraction throughout the cytoplasm of the neuron, which would result in substantial dimming of the fluorescence signal, we used a fusion protein containing PAGFP fused to the histone protein H2B (H2B–PAGFP), which is trafficked to the nucleus and integrated into the chromatin structure (Kruhlak et al., 2006; Testa et al., 2008).
We expressed H2B–PAGFP in the visual cortex of neonatal or juvenile mice through viral injection (Figure 1A; see Materials and Methods). To assess the expression pattern of H2B–PAGFP in layer 2/3 (L2/3) in vivo, we exposed the visual cortex and performed two-photon imaging with 850 nm excitation light since non-photo-activated H2B–PAGFP is only weakly excitable at 950–1000 nm (Schneider et al., 2005; Figure 1B). Importantly, non-photo-activated PAGFP can be sufficiently imaged with 850 nm excitation at power levels that minimize its photo-activation (Schneider et al., 2005). We selected an arbitrary constellation of seven H2B–PAGFP expressing neurons for photo-activation (Figure 1B, squares) with 750 nm light. Photo-activation increased the emission of PAGFP excited at 1000 nm by a factor of ∼20 (23.0 ± 8.6 SD, n = 7 cells). Photo-activated H2B–PAGFP was confined to the cell body of the neuron, consistent with the nuclear location of the fusion protein and was restricted to those neurons whose cell bodies were within the focal plane of the region excited at 750 nm (Testa et al., 2008; Figure 1B, XZ max). The slow diffusion of H2B–PAGFP also allowed us to test whether we could photo-activate the protein with sub-cellular resolution by performing linescans across somata with 750 nm light (Figure 1C). The pattern of photo-activation was confined to the path of the line scan, allowing different patterns to be imprinted onto each cell’s nucleus. Thus, H2B–PAGFP is efficiently expressed in cortical neurons and can be used to brightly photo-label user-defined constellations of neurons with cellular and sub-cellular resolution in vivo.
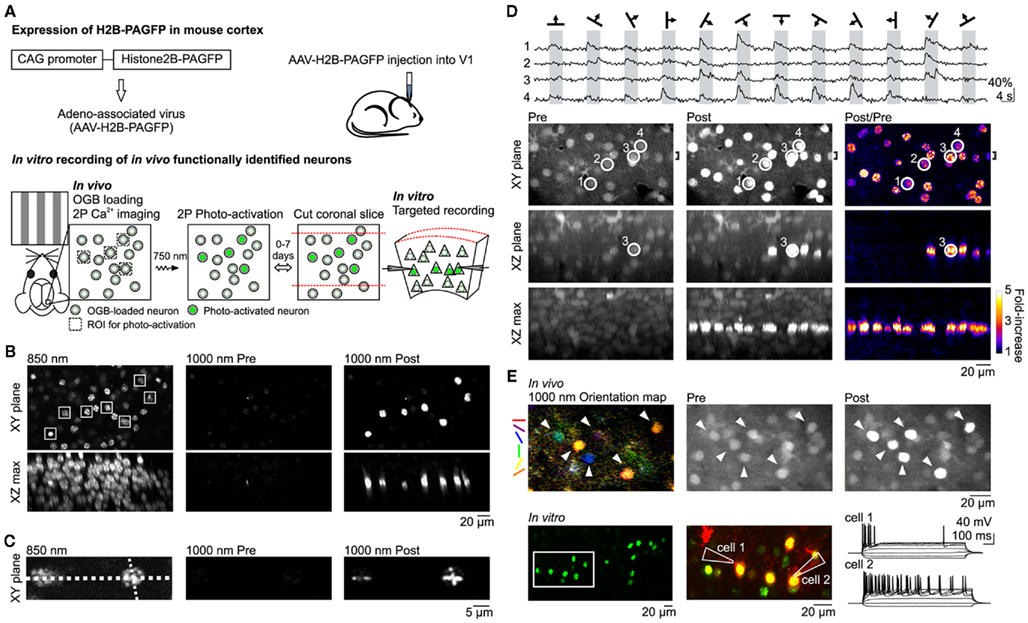
Figure 1. In vivo photo-labeling of functionally identified cortical neurons followed by in vitro targeted recording. (A) Summary of method. (B) In vivo photo-activation of L2/3 cells expressing H2B–PAGFP via AAV infection. (Top) XY plane imaged at 850 nm (left) and 1000 nm excitation before (center) and after (right) photo-activation. Constellation of seven neurons in the shape of the Big Dipper selected for photo-activation are indicated by white squares in the 850-nm image. (Bottom) Maximum intensity projections of the XZ plane through the entire field of view. (C) In vivo photo-activation with sub-cellular resolution. Line scan photo-activation pattern is indicated by the dotted lines in the 850-nm image. (D) In vivo photo-activation is compatible with functional OGB Ca2+ imaging of visual responses. (Top) Traces show single trial OGB fluorescence responses to drifting grating stimuli in four neurons imaged with 1000 nm excitation. Cell locations are circled in the bottom images. (Bottom) Images taken with 1000 nm excitation show the cells before (left column) and after (center column) photo-activation of the entire imaging plane as well as the fold-increase in fluorescence (right column). Top row shows the XY plane. XZ plane (center row) and XZ max (bottom raw) images are maximum intensity projections through the region indicated by the bracket (shown on top row) and the entire field of view, respectively. (E) In vitro whole-cell recording of neurons functionally characterized and photo-activated in vivo. (Top) Orientation map shows the responsiveness and orientation tuning of each pixel in response to drifting gratings. Visually responsive neurons (arrowheads) were targeted for photo-activation. (Bottom) Green photo-activated neurons in an acute coronal brain slice from the region imaged in vivo. Two neurons in the region indicated by the white rectangle were targeted for whole-cell recording. Middle panel shows the photo-activated neurons in green and Alexa 594 dye, which was included in the internal solution of the patch pipettes, in red. The membrane potential response to hyperpolarizing and depolarizing current steps is shown to the right.
Because calcium imaging with the indicator dye Oregon-Green BAPTA-1 AM (OGB) is one of the methods of choice to characterize the functional properties of cortical neurons in vivo (Stosiek et al., 2003; Ohki et al., 2005; Kerr et al., 2007; Komiyama et al., 2010) we tested whether we could combine the use of OGB with photo-activation of H2B–PAGFP to label functionally defined neuronal constellations. A potential caveat of this approach is the fact that the two fluorophores, OGB and PAGFP, have similar spectral properties. We bolus loaded OGB in vivo in L2/3 neurons of the primary visual cortex (V1) expressing H2B–PAGFP (Stosiek et al., 2003; Figure 1D, Pre images), presented visual stimuli consisting of drifting gratings of various orientation, and imaged OGB at 950–1000 nm excitation. The robust fluorescence change we observed in response to visual stimulation in OGB-loaded neurons (Ohki et al., 2005; Figure 1D, top) was not due to the lack of H2B–PAGFP expression in those neurons because subsequent scanning of the entire imaging plane at 750 nm lead to the photo-activation of H2B–PAGFP (fold-increase in somatic fluorescence: 2.9 ± 0.9 SD, n = 26 cells, Figure 1D, Post/Pre images). Thus, we can detect visually evoked calcium transients with OGB in individual neurons and subsequently label these same neurons in vivo by photo-activating H2B–PAGFP. These data show that despite spectral overlap, choice of proper wavelength and large differences in fluorescence magnitude and sub-cellular distribution allow one to combine OGB calcium imaging with H2B–PAGFP photo-labeling of neurons in vivo.
Can we perform targeted in vitro recordings from neurons that were selectively photo-labeled in vivo based on functional calcium imaging? We monitored visually evoked OGB responses in V1 L2/3 neurons expressing H2B–PAGFP and selected visually responsive neurons tuned to various orientations for photo-labeling (Figure 1E, top row). After photo-activating all neurons of interest, the craniotomy was closed, the skin sutured, and the animal allowed to recover and placed back in its home cage. Following a 72-h survival period we cut coronal slices from the imaged and photo-labeled region of the visual cortex for in vitro electrophysiological recordings. During this survival period OGB dissipated from the tissue while photo-labeled neurons could still be clearly detected, consistent with the strong expression and slow turnover of H2B–PAGFP (Testa et al., 2008; Figure 1E, bottom row), enabling targeted whole-cell patch clamp recordings. These results indicate that photo-activation of H2B–PAGFP is a reliable tool for targeted labeling of selected cortical neurons in vivo for subsequent electrophysiological experiments in vitro.
To perform targeted in vitro recordings selectively from neurons with desired response properties to sensory stimuli it may be useful to register a labeled neuron in a slice to its original position in vivo (Figure 2A). This would allow one to determine connectivity between neurons with known response properties (Ko et al., 2011) or compare intrinsic electrophysiological properties between neurons with different response properties to sensory stimuli. To illustrate the approach we compared input resistance (Rm) and resting membrane potential (Vrest) between visually responsive and non-responsive L2/3 neurons since both electrophysiological properties can influence the firing of neurons to synaptic excitation. Through OGB calcium imaging we characterized the response properties of L2/3 V1 neurons located within a single optical plane and photo-labeled all H2B–PAGFP expressing neurons in that plane (Figure 2B). Neurons could be subdivided into those that responded to at least one stimulus direction (>5% ΔF to preferred stimulus) and those that did not (<5% ΔF to preferred stimulus). We then cut coronal slices of the photo-labeled region of the cortex and performed targeted recordings from neurons with known response properties. To register the neurons in the slice with those recorded in vivo we created image stacks of the labeled region of the slice with the images parallel to the coronal plane (i.e., the surface) of the slice. We took advantage of the planes formed by the photo-labeled neurons at each cortical depth that was imaged in vivo to align the in vitro and in vivo image volumes. In our coronal slices, these planes extend into the depth of the slice and may have some slant due to the slicing angle. We rotated the in vitro image stack such that photo-labeled neurons became co-planar, thus matching the in vivo imaging perspective (Figure 2Ci). Despite distortions possibly due to the to the slicing procedure itself, in the majority of cases even simple visual inspection allowed us to reliably match each individually labeled neuron in the slice to its original position, in vivo (compare Figures 2Bi–Ci). This correspondence allows us to perform targeted electrophysiological in vitro recordings from neurons with desired response properties to sensory stimuli in vivo. We selectively recorded from photo-labeled L2/3 pyramidal cells identified as such via two-photon excitation at 1000 nm and IR oblique illumination (Figure 2Ci, right). Despite a relatively large neuron to neuron variability in %ΔF, Rm, and Vrest, we did not find any correlation between the magnitude of visually evoked %ΔF and Rm or %ΔF and Vrest (Figure 2D). The average Vrest of visually responsive pyramidal cells, measured immediately after breaking in was −62.3 ± 10.1 mV and the average Rm was 141.3 ± 21 MOhm (n = 5 cells). There was no significant difference between visually responsive and non-responsive pyramidal cells (non-responsive: Vrest: −67.5 ± 7.6 mV and Rm: 175 ± 81 MOhm, n = 8 cells; p = 0.29 for Rm, p = 0.34 for Vrest). Thus, the responsiveness of L2/3 pyramidal cells to visual stimuli is not to be influenced by Rm and Vrest.
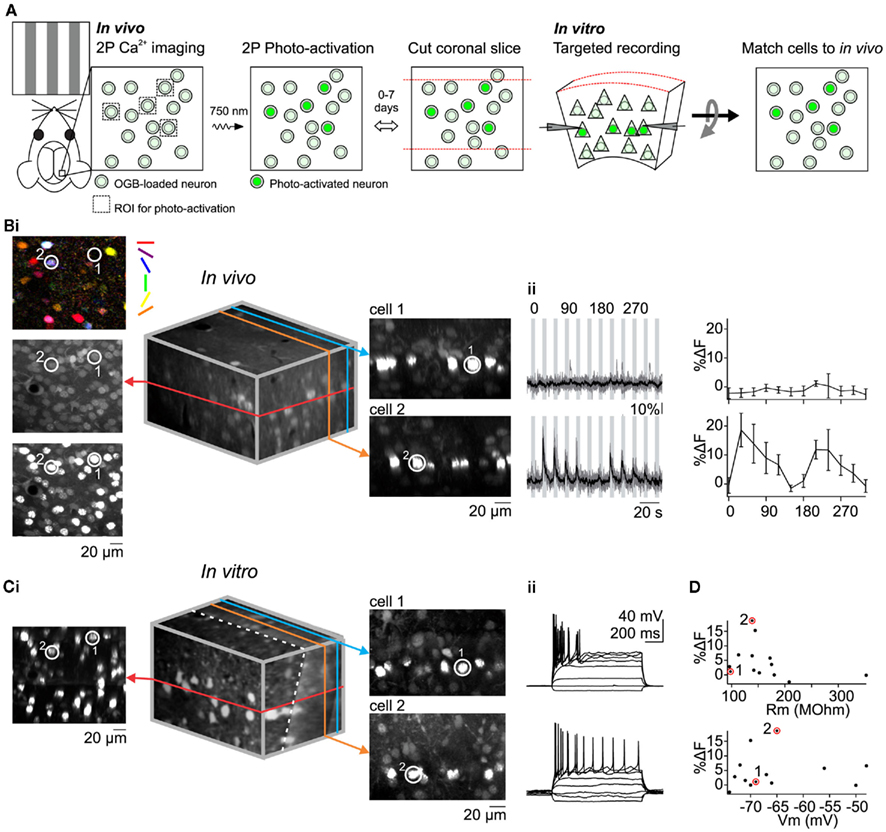
Figure 2. Matching in vivo and in vitro identities of photo-labeled neurons to correlate visual response properties with intrinsic electrophysiological properties. (A) Summary of method. (B) In vivo Ca2+ imaging of visual responses followed by photo-activation of all imaged cells in a single plane. [(i), left] Pixel-based orientation tuning map and images before and after photo-activation. Encircled cells (1 and 2) were recorded later in vitro. [(i), Middle] 3D reconstruction of in vivo image stack containing imaged and photo-activated plane (red). [(i), right] XZ optical sections containing cell 1 and cell 2. (ii) Visually evoked Ca2+ signals (left) and orientation tuning curves (right) for cell 1 and 2. (C) In vitro image registration and whole-cell recording. [(i), left] Optical section containing photo-activated neurons including cells 1 and 2. [(i), middle] 3D reconstruction of in vitro image stack after rotation to register with the in vivo stack. The dotted white line denotes the slicing angle (i.e., main plane of the slice) and the red line denotes the optical section containing the cells that were photo-activated in vivo. Note that the in vivo (red) optical section is not exactly perpendicular to the plane of the slice [(i), right] XZ optical sections containing cells 1 and 2. Note the correspondence between in vitro and in vivo(B) images. (ii) Membrane potential response of cells 1 and 2 to hyperpolarizing and depolarizing current injection. (D) Magnitude of visual response to gratings is not correlated with input resistance or membrane potential. Size of the visual response to the preferred orientation recorded in vivo is plotted against the input resistance (top) and membrane potential (bottom) recorded in vitro (n = 13 neurons). Data points corresponding to example cells 1 and 2 are circled.
Discussion
Performing recordings in vitro from cortical neurons with known responses to sensory stimuli is a demanding task that requires unambiguous registration of large neuronal populations imaged in vivo with the neurons in the slice (Ko et al., 2011). This type of approach, however, is fundamental for a mechanistic understanding of brain function. We have developed a simple approach that greatly facilitates recording in brain slices from the exact same neurons whose responses to sensory stimuli had been previously determined in vivo.
This approach is a substantial improvement over previous in vivo intracellular and juxtacellular recording and labeling methods (Gilbert and Wiesel, 1979; Pinault, 1996) because it allows an experimenter to functionally characterize hundreds of neurons and then select subpopulations of interest for photo-labeling and targeted recording in vitro. Furthermore, use of the non-diffusible histone-fused H2B–PAGFP results in a much faster photo-activation protocol compared to the diffusible cytosolic form (1 s versus tens of minutes; Datta et al., 2008), while still resulting in strong fluorescence.
We have combined H2B–PAGFP for labeling with OGB for functional characterization. Despite the similar excitation and emission spectra of these two molecules, the difference in excitation of OGB and non-photo-activated H2B–PAGFP, as well as the difference in strength, localization, and retention in the neuron allows for a clear separation of the signals both in vivo and in vitro. Future developments will likely generate additional photo-activatable fluorescent proteins and calcium indicators with distinct excitation/emission spectra for an even better separation of fluorescence signals (Ivanchenko et al., 2007; Zhao et al., 2011). Furthermore, the generation of transgenic mouse lines for both photo-activatable fluorescent proteins and genetically encoded calcium indicators will obviate problems associated with the variability of viral transfections and calcium dye loading. However, viral approaches and synthetic calcium indicators will still remain valuable options as they expand the range of organisms in which the tools can be used (Ohki et al., 2005; Han et al., 2009).
The method presented here will allow one to routinely perform multiple simultaneous recordings (to reveal, for example, the connectivity statistics) selectively between neurons with desired tuning properties, both within and across cortical layers and in a variety of cortical areas. Similarly, this technique will enable the assessment of synaptic strength and, using morphological analysis (Datta et al., 2008), the synaptic location between neurons of known function. Thus, the present approach will help reveal the matrix of connectivity, synaptic strength, and synaptic location between cortical neurons contingent on their specific, individual function established in vivo.
Although the present study focuses on electrophysiological properties, our approach will also allow isolation of photo-labeled neurons [using FACS sorting or hand picking (Sugino et al., 2006)] to reveal the unique molecular or biochemical properties as well as gene expression profiles of functionally identified neurons.
In conclusion, the possibility of studying the same cortical circuit first in vivo and subsequently in vitro will certainly contribute in the effort to close the gap between systems and cellular neuroscience.
Materials and Methods
All procedures were conducted in accordance with the National Institutes of Health guidelines and with the approval of the Committee on Animal Care at UCSD.
AAV Plasmid Construction and Virus Production
Plasmid containing the H2B–PAGFP fusion gene was a gift from André Nussenzweig (Kruhlak et al., 2006). The H2B–PAGFP gene was subcloned into the pACAGW-ChR2-Venus-AAV plasmid (Addgene # 20071), replacing the ChR2-Venus insert. AAV2 serotype 9 was produced from the pACAGW-H2B–PAGFP-AAV plasmid by the Salk Viral Vector Core. Virus titer was 3 × 10¹² GC/ml. The pACAGW-H2B–PAGFP-AAV plasmid was deposited to Addgene (plasmid #33000)1.
AAV Delivery
We used C57BL/6J mice. AAV2.9CAG-H2B–PAGFP was delivered to the mouse visual cortex via intracranial injection of neonates (P0–1) or juveniles (P14–21). For neonatal injection, pups were anesthetized via a cooling pad. Virus was loaded into a beveled glass pipette with 20–40 μm tip diameter. The pipette was inserted into the right visual cortex through the skin and injections of 23 nl volume were made at three different depths from 100 to 600 μm at one to three sites using a Nanoject II (Drummond). For juvenile viral injection, mice were anesthetized with 2.5% isoflurane. An incision was made to expose the cranium and a small metal headplate was attached with cyanoacrylate glue to head-fix the animal. A small opening over the right visual cortex was made in the cranium with a 30-gage needle and virus was delivered via a beveled glass pipette with 15–30 μm tip diameter. The pipette was inserted to a depth of 350 μm from the cortical surface and 50 nl of virus was injected over 5 min using a UMP3 microsyringe pump (WPI). Injections were made at one to four sites per animal with a separation of ∼800 μm. After injection, the headplate was removed, the scalp was sutured, and the animal was given analgesic (0.1 mg/kg Buprenex, SC) and allowed to recover.
Craniotomy for Imaging
Animals were used for imaging and photo-activation experiments 2 weeks to several months after virus injection. Mice were administered chlorprothixene (1 mg/kg, IP) and dexamethasone (2.6 mg/kg, SC) and then anesthetized with 1.5% isoflurane. A thin layer of silcone oil was applied to the eyes to prevent drying and maintain optical clarity. Once the mice reached a surgical level of anesthesia as evidenced by lack of response to toe or tail pinch, the cranium was exposed and a metal head plate was affixed over the right visual cortex with dental cement. After head-fixing the animal, a craniotomy of 1–2.5 mm diameter was performed with a micro motor drill (Foredom) and the dura was left intact. The exposed cortical surface was covered with a thin layer of 1.5% low-melting point agarose (Sigma) and a glass coverslip, which was sealed with Kwik-cast elastomer (WPI) or cyanoacrylate glue. In calcium imaging experiments, the coverslip was applied after dye loading (see below). At the end of survival experiments, the coverslip was removed, the craniotomy was covered with Kwik-cast and dental cement, the scalp was sutured, analgesic was administered (0.1 mg/kg Buprenex, SC), and the animal allowed to recover. Otherwise, animals were deeply anesthetized with isoflurane and sacrificed for acute slice preparation.
In vivo Two-Photon Imaging and Photo-Activation
Two-photon imaging and photo-activation was performed in upper L2/3 (100–300 μm depth) using a pulsed Ti:Sapphire laser (Chameleon Ultra II, Coherent; or Mai Tai, Spectra-Physics) coupled to a Sutter Moveable Objective Microscope. We used a 20 × 0.95 NA water immersion objective (XLUMPLFL20xW/0.95, Olympus). Green fluorescence emission light was filtered through a HQ535/50 m-18° aoi filter (Chroma) and collected via a photomultiplier tube (Hamamatsu). Non-photo-activated H2B–PAGFP was visualized using an excitation wavelength of 850 nm. Photo-activated H2B–PAGFP and OGB were imaged at 950–1000 nm excitation. All imaging and photo-activation was performed with Scanimage software2. Laser power was 10–50 mW after the objective and image stacks were taken at 2 μm intervals before and after photo-activation. Calcium imaging of visual responses was performed at 2 or 4 frames/s.
Two-photon photo-activation of H2B–PAGFP was performed with 750 nm excitation. Laser power was 20–70 mW after the objective. Photo-activation of single cells was performed by designating ∼10 μm × 10 μm square ROIs around individual somata and scanning each ROI for ∼0.5–1.5 s. Sub-cellular photo-activation was performed by scanning across a 250-μm line 512 times at 2 ms/line (∼1 s). Full-field photo-activation was performed by scanning a 250-μm × 250-μm field of view with 512 lines 60 times at 2 ms/line (∼1 min).
Calcium Indicator Loading
Calcium indicator OGB1-AM (Invitrogen) was delivered to cortical neurons using the multi-cell bolus loading method (Stosiek et al., 2003). Briefly, 50 μg of dye was dissolved in 4 μl of 20% Pluronic/DMSO and then diluted to a final concentration of 1 mM with a dye loading buffer (in mM: 140 NaCl, 2.5 KCl, 10 HEPES, pH 7.4). Dye solution also contained 50–100 μM Alexa 594 or 488 dye for visualization. This solution was loaded into a patch pipette that was guided into the cortex under the two-photon microscope to a depth of 200–300 μm and dye was pressure ejected for 1–2 min. Imaging was performed at least 45 min after loading.
Visual Stimulation
Stimuli were generated in Matlab with Psychophysics Toolbox and displayed on an LCD monitor positioned 25 cm from the animal. Full contrast drifting square gratings with a spatial frequency of 0.04 cycle/deg and a temporal frequency of 1 Hz were presented sequentially at 12 different angles from 0° to 330°. Gratings were presented for 4 s and were preceded and followed by a mean luminance gray screen for 4 s resulting in a 12-s epoch for each orientation. The full set of grating stimuli was presented eight times. The mean luminance of the monitor during stimulus presentation was 97 cd/m2.
Analysis of Visual Response
Image analysis was performed using custom-written scripts in ImageJ and IgorPro. Pixel-based orientation maps were generated by taking the average fluorescence signal of each pixel during the stimulus and subtracting the average fluorescence signal during the baseline period prior to the stimulus. This was done for each of the six orientations (responses to opposite directions were pooled), producing six images where the intensity value is the average response per pixel to each orientation. A local background subtraction was applied to reduce the contribution of neuropil signals and then each image was given a different color lookup table (Figure 1E) and merged in RGB color-space to produce the final orientation map.
More detailed analysis of neuronal visual responses was performed by defining cell ROIs and averaging the OGB signal within an ROI. Each cell ROI had a complementary neuropil ROI that consisted of pixels within a 20-μm radius of the cell that were not part of other cells. This neuropil ROI was subtracted from the cell ROI to remove neuropil contamination. For each stimulus epoch, the fluorescence signal was expressed as %ΔF = (F − Fbaseline)/Fbaseline where F is the fluorescence value of each time point and Fbaseline is the average fluorescence value during the 4-s pre-stimulus baseline period. Orientation tuning curves were constructed by plotting the mean %ΔF for each orientation.
Electrophysiology in Acute Slices
Acute cortical slices were prepared from previously imaged and photo-activated animals either immediately after in vivo experiments or after a survival period. Three-hundred micrometer-thick coronal slices were cut on a DSK microslicer in sucrose ACSF (in mM: NaCl 83, KCl 2.5, MgSO4 3.3, NaH2PO4 1, NaHCO3 26, glucose 22, sucrose 72, CaCl2 0.5) bubbled with carbogen. Slices were incubated in sucrose ACSF for 30 min at 34°C and then kept at room temperature. Individual slices were placed in a submersion-style recording chamber perfused with room temperature ACSF (in mM: NaCl 119, glucose 22, MgCl2 1.3, KCl 2.5, NaH2PO4 1.3, CaCl2 2.5, NaHCO3 26) and imaged under two-photon excitation at 1000 nm excitation with a 40 × 0.8 NA water immersion objective (LUMPLFLN40X/W, Olympus) to find the region containing photo-activated neurons. Individual photo-activated neurons were identified under the two-photon and targeted for whole-cell patch clamp recording under oblique IR LED illumination detected via an IR CCD camera (IR-1000, Dage-MTI).
Whole-cell recordings were obtained using borosilicate patch pipettes (3–5 MOhm) containing potassium-based internal solution (in mM: potassium gluconate 135, NaCl 8, HEPES 10, NaGTP 0.3, MgATP 4, EGTA 0.3, Alexa 594 0.1). Signals were recorded on a Multiclamp 700B amplifier (Molecular Devices). Membrane potential was assessed immediately after break-in. Input resistance was measured by recording the amount of steady-state hyperpolarization in response to small negative current steps. Average values were expressed as the mean ± SD. The Student’s t-test was used for statistical comparison.
In vitro and in vivo Image Registration
Image stacks were taken in vivo after photo-activation and in vitro prior to recording. After scaling the z-dimension of the in vitro stack to make it isotropic, the location of photo-activated neurons throughout the depth of the slice was noted. Because the photo-activated neurons were restricted to a single plane or a series of well-spaced planes in vivo, they should form a plane that extends into the depth of the slice. We rotated the image stack such that the co-planar photo-activated neurons appeared in the same optical section. Once this was accomplished, the in vivo optical section of the photo-activated plane could be compared to this rotated in vitro optical section, and the corresponding neurons could be easily identified.
Conflict of Interest Statement
The authors declare that the research was conducted in the absence of any commercial or financial relationships that could be construed as a potential conflict of interest.
Acknowledgments
We thank Jeff Isaacson and the members of the Scanziani and Isaacson lab for advice during the course of the study. We thank André Nussenzweig for the H2B–PAGFP fusion gene. This work was supported by the NIH grant NS069010, the Gatsby Charitable Foundation and the Howard Hughes Medical Institute.
Footnotes
References
Bandyopadhyay, S., Shamma, S. A., and Kanold, P. O. (2010). Dichotomy of functional organization in the mouse auditory cortex. Nat. Neurosci. 13, 361–368.
Bock, D. D., Lee, W.-C. A., Kerlin, A. M., Andermann, M. L., Hood, G., Wetzel, A. W., Yurgenson, S., Soucy, E. R., Kim, H. S., and Reid, R. C. (2011). Network anatomy and in vivo physiology of visual cortical neurons. Nature 471, 177–182.
Datta, S. R., Vasconcelos, M. L., Ruta, V., Luo, S., Wong, A., Demir, E., Flores, J., Balonze, K., Dickson, B. J., and Axel, R. (2008). The Drosophila pheromone cVA activates a sexually dimorphic neural circuit. Nature 452, 473–477.
Gilbert, C. D., and Wiesel, T. N. (1979). Morphology and intracortical projections of functionally characterised neurones in the cat visual cortex. Nature 280, 120–125.
Han, X., Qian, X., Bernstein, J. G., Zhou, H.-H., Franzesi, G. T., Stern, P., Bronson, R. T., Graybiel, A. M., Desimone, R., and Boyden, E. S. (2009). Millisecond-timescale optical control of neural dynamics in the nonhuman primate brain. Neuron 62, 191–198.
Ivanchenko, S., Glaschick, S., Röcker, C., Oswald, F., Wiedenmann, J., and Nienhaus, G. U. (2007). Two-photon excitation and photoconversion of EosFP in dual-color 4Pi confocal microscopy. Biophys. J. 92, 4451–4457.
Kerr, J. N. D., de Kock, C. P. J., Greenberg, D. S., Bruno, R. M., Sakmann, B., and Helmchen, F. (2007). Spatial organization of neuronal population responses in layer 2/3 of rat barrel cortex. J. Neurosci. 27, 13316–13328.
Ko, H., Hofer, S. B., Pichler, B., Buchanan, K. A., Sjöström, P. J., and Mrsic-Flogel, T. D. (2011). Functional specificity of local synaptic connections in neocortical networks. Nature 473, 87–91.
Komiyama, T., Sato, T. R., O’Connor, D. H., Zhang, Y.-X., Huber, D., Hooks, B. M., Gabitto, M., and Svoboda, K. (2010). Learning-related fine-scale specificity imaged in motor cortex circuits of behaving mice. Nature 464, 1182–1186.
Kruhlak, M. J., Celeste, A., Dellaire, G., Fernandez-Capetillo, O., Müller, W. G., McNally, J. G., Bazett-Jones, D. P., and Nussenzweig, A. (2006). Changes in chromatin structure and mobility in living cells at sites of DNA double-strand breaks. J. Cell Biol. 172, 823–834.
Ohki, K., Chung, S., Ch’ng, Y. H., Kara, P., and Reid, R. C. (2005). Functional imaging with cellular resolution reveals precise micro-architecture in visual cortex. Nature 433, 597–603.
Patterson, G. H., and Lippincott-Schwartz, J. (2002). A photoactivatable GFP for selective photolabeling of proteins and cells. Science 297, 1873–1877.
Pinault, D. (1996). A novel single-cell staining procedure performed in vivo under electrophysiological control: morpho-functional features of juxtacellularly labeled thalamic cells and other central neurons with biocytin or neurobiotin. J. Neurosci. Methods 65, 113–136.
Rothschild, G., Nelken, I., and Mizrahi, A. (2010). Functional organization and population dynamics in the mouse primary auditory cortex. Nat. Neurosci. 13, 353–360.
Schneider, M., Barozzi, S., Testa, I., Faretta, M., and Diaspro, A. (2005). Two-photon activation and excitation properties of PA-GFP in the 720-920-nm region. Biophys. J. 89, 1346–1352.
Stosiek, C., Garaschuk, O., Holthoff, K., and Konnerth, A. (2003). In vivo two-photon calcium imaging of neuronal networks. Proc. Natl. Acad. Sci. U.S.A. 100, 7319–7324.
Sugino, K., Hempel, C. M., Miller, M. N., Hattox, A. M., Shapiro, P., Wu, C., Huang, Z. J., and Nelson, S. B. (2006). Molecular taxonomy of major neuronal classes in the adult mouse forebrain. Nat. Neurosci. 9, 99–107.
Testa, I., Garrè, M., Parazzoli, D., Barozzi, S., Ponzanelli, I., Mazza, D., Faretta, M., and Diaspro, A. (2008). Photoactivation of pa-GFP in 3D: optical tools for spatial confinement. Eur. Biophys. J. 37, 1219–1227.
Keywords: photo-activatable GFP, two-photon, calcium imaging, visual cortex, whole-cell recording, brain slice
Citation: Lien AD and Scanziani M (2011) In vivo labeling of constellations of functionally identified neurons for targeted in vitro recordings. Front. Neural Circuits 5:16. doi: 10.3389/fncir.2011.00016
Received: 30 September 2011;
Accepted: 04 November 2011;
Published online: 29 November 2011.
Edited by:
Edward M. Callaway, The Salk Institute, USAReviewed by:
Gilad Silberberg, Karolinska Institute, SwedenSusana Q. Lima, Instituto Gulbenkian de Ciéncia, Portugal
Shaul Hestrin, Stanford University, USA
Copyright: © 2011 Lien and Scanziani. This is an open-access article subject to a non-exclusive license between the authors and Frontiers Media SA, which permits use, distribution and reproduction in other forums, provided the original authors and source are credited and other Frontiers conditions are complied with.
*Correspondence: Massimo Scanziani, Neurobiology Section, University of California, San Diego, 9500 Gilman Drive, La Jolla, CA 92093-0634, USA. e-mail: massimo@biomail.ucsd.edu