Retinal afferents synapse with relay cells targeting the middle temporal area in the pulvinar and lateral geniculate nuclei
1
Bourne Group, Australian Regenerative Medicine Institute, Monash University, Clayton, Victoria, Australia
2
Department of Anatomy and Developmental Biology, Monash University, Clayton, Victoria, Australia
Considerable debate continues regarding thalamic inputs to the middle temporal area (MT) of the visual cortex that bypass the primary visual cortex (V1) and the role they might have in the residual visual capability following a lesion of V1. Two specific retinothalamic projections to area MT have been speculated to relay through the medial portion of the inferior pulvinar nucleus (PIm) and the koniocellular layers of the dorsal lateral geniculate nucleus (LGN). Although a number of studies have demonstrated retinal inputs to regions of the thalamus where relays to area MT have been observed, the relationship between the retinal terminals and area MT relay cells has not been established. Here we examined direct retino-recipient regions of the marmoset monkey (Callithrix jacchus) pulvinar nucleus and the LGN following binocular injections of anterograde tracer, as well as area MT relay cells in these nuclei by injection of retrograde tracer into area MT. Retinal afferents were shown to synapse with area MT relay cells as demonstrated by colocalization with the presynaptic vesicle membrane protein synaptophysin. We also established the presence of direct synapes of retinal afferents on area MT relay cells within the PIm, as well as the koniocellular K1 and K3 layers of the LGN, thereby corroborating the existence of two disynaptic pathways from the retina to area MT that bypass V1.
According to current understanding, the dominant source of visual input to the middle temporal area (MT, V5), a ‘dorsal stream’ extrastriate area, comes from the primary visual cortex (V1), specifically via the magnocellular retinogeniculocortical pathway (Born and Bradley, 2005
). However, there is also evidence from earlier physiological studies that area MT receives non-geniculostriate input (Beckers and Zeki, 1995
).
Based on anatomical work two disynaptic retinothalamic pathways have been proposed to project to area MT in primates. One relays through the medial portion of the inferior pulvinar nucleus (PIm) (e.g. owl monkey, Lin and Kaas, 1980
; squirrel and rhesus monkey, Cusick et al., 1993
; macaque, Adams et al., 2000
) which is the recipient of direct retinal projections (e.g. macaque, Cowey et al., 1994
; O’Brien et al., 2001
). The second relays through the koniocellular layers of the LGN (e.g. owl monkey, Stepniewska et al., 1999
; macaque, Sincich et al., 2004
; Nassi and Callaway, 2006
), which is the recipient of direct retinal input in primates (e.g. macaque, Conley and Fitzpatrick, 1989
; marmoset, Szmajda et al., 2008
). However, to date, no evidence exists of direct synaptic connection of the two element pathways.
These retinothalamocortical pathways to area MT could be important drivers/modulators of visual perception (Laycock et al., 2007
), as well as accounting for the residual activity observed in the absence of V1 in a number of species, including humans (macaque, Rodman et al., 1989
; Girard et al., 1992
; marmoset, Rosa et al., 2000
; human, Bridge et al., 2008
). In addition, it has been hypothesized that a monosynaptic relay through the thalamus to area MT could be responsible for the early maturation of this area and its ‘primary’ like status (Sincich et al., 2004
; Bourne and Rosa, 2006
).
The aim of the present study was to establish whether a direct synaptic connection exists between the retinofugal and area MT relay projections in the pulvinar nucleus and the LGN of the New World marmoset monkey. Our main finding provides evidence that there are small, but clearly defined regions of synaptic colocalization with area MT labeled relay cells both in the PIm and the koniocellular layers of the LGN, demonstrating that area MT can is able to receive retinal information through two disynaptic projections that bypass V1.
Animals
Five adult marmosets (Callithrix jacchus) weighing ∼350 g were used in the present study. All animals received a fluorescent retrograde tracer injection into area MT of the left hemisphere. Three animals received binocular fluorescent anterograde tracer injections and the two remaining animals were only injected into the eye contralateral to the area MT injection. The animals were housed in family groups (12:12-h light/dark cycle, temperature 31°C, humidity 65%). All experiments were conducted in accordance with the Australian Code of Practice for the Care and Use of Animals for Scientific Purposes and were approved by the Monash University Animal Ethics Committee, which also monitored the welfare of the animals.
Surgery Preparation and Tracer Injections
The animals were initially anesthetized with intramuscular (i.m.) injections of alfaxalone (12 mg kg−1) and diazepam (3.0 mg kg−1). Antibiotic (procaine penicillin 25 mg kg−1, i.m.) was administered before the animals were placed in a stereotaxic frame on a thermostatically controlled heating pad to maintain core body temperature at 38°C. Anesthesia was maintained with isoflurane (1–2% in 0.5 l min−1 medical oxygen). Blood oxygen levels, heart rate and temperature were monitored continuously throughout the experiment (Surgivet® Advisor® Vital Signs Monitor, SurgiVet® Smiths Medical North America, Waukesha, WI, USA). All surgeries were performed under aseptic conditions.
Intraocular injections
Cycloplegia was induced with one drop of phenylephrine hydrochloride (10%) followed by one drop of antibiotic eye drops (0.5% chloramphenicol) 2 min later in each eye. A glass micropipette attached to a 10-μl Hamilton microsyringe (Scientific Glass Engineering, Melbourne, Australia) filled with cholera toxin subunit b (CTb) conjugated with fluorescent tracer (right eye, all cases: 8 μl 1% Alexa Fluor 488; left eye, three cases: 8 μl 1% Alexa Fluor 594; both from Molecular Probes, Eugene, OR, USA) was used for injection. CTb is principally used as a retrograde tracer in the cerebrum (Conte et al., 2009
) but has been successfully used as anterograde tracer to identify retinofugal projections (Angelucci et al., 1996
; Huberman et al., 2002
). The eyeball was slightly rotated nasally to expose the sclera, and connective tissue at the injection site was removed until blood vessels were visible. Tracer was injected behind the ora serrata into the vitreous chamber to be taken up by the retinal ganglion cells. The rate of injection was ∼2 μl min−1 and the microsyringe was held in place for a further 5 min to allow the tracer to diffuse away from the injection site. Leakage of tracer and clarity of the anterior chamber of the eye were monitored using a surgical microscope.
Cortical injections
Local anesthetic (bupivicaine, 0.1 ml per injection site) was injected into the temporal muscle before a craniotomy was made over the caudal temporal lobe of the left hemisphere. After the dura mater was resected, the retrograde fluorescent tracer Fast Blue (Polysciences, Inc., Warrington, PA, USA) which labels the cytoplasm of cells and intensely fine granules that have a greater intensity than the surrounding cytoplasm, giving a punctate appearance (Bentivoglio et al., 1980
; Condé, 1987
), was directly applied into the cortex (area MT), either as a crystal (∼200 μm in diameter) with the aid of a blunt tungsten wire in four cases or injected as a solution (2%, 0.5–1 μl, Polysciences, Inc.) using a microsyringe for a single case. For the injection, the microsyringe was secured to a motor microdrive (Narishige, Tokyo, Japan) and advanced into the cortex to a depth of 0.5–1.0 mm at a plane tangential to the cortex. Placement of the injections was guided by stereotaxic coordinates obtained in the course of previous studies of marmoset visual cortex (Rosa and Elston, 1998
), and care was taken not to impinge upon the white matter below, this being confirmed at a later stage by histopathology (see Figure 3
). The exact location of the injection in relation to cortical layers and areal boundaries was later assessed by histological methods. The cortex was then covered with a piece of sterile absorbable gelatin film (Gelfilm, Pharmacia & Upjohn Inc, Bridgewater, NJ, USA), the piece of bone removed during the craniotomy and temporal muscle were affixed with tissue adhesive (Vetbond™, 3M, St. Paul, MN, USA) and the scalp sutured. The animals were administered glucose saline subcutaneously (s.c.), as well as analgesic (carprofen, 4 mg kg−1, s.c.; buprenorphine, 0.01 mg kg−1, i.m.) and dexamethasone (0.3 mg kg−1, i.m.), to prevent cerebral edema.
Tissue Preparation
After a 7-day survival period, animals were overdosed with the anesthetic pentobarbitone sodium (100 mg kg−1) and transcardially perfused with 0.1 M heparinized phosphate buffer (PB; pH 7.2) followed by 4% paraformaldehyde in 0.1 M PB. Cerebral tissues were immediately removed and postfixed for 24 h in 4% paraformaldehyde in 0.1 M PB containing 10% sucrose. Cryoprotection was achieved by serially transferring the tissue through solutions of 20%, and 30% sucrose in 0.1 M PB before it was placed in a weigh tray and floated on liquid nitrogen to freeze. Brains were stored at −80°C until further processing. The brain was left whole and five series of coronal sections 40 μm thick were cut using a cryostat. Two series were mounted immediately from 0.1 M PB and coverslipped using Dako fluorescence mounting medium (Dako A/S, Glostrup, Denmark) for microscopic examination of fluorescent labeling. One of these series was stained 1 week later for Nissl substance. Sections to be stained for cytochrome oxidase (CO) were collected into 0.1 M PB and processed immediately, sections reserved for immunohistochemistry were stored at −20°C in cryoprotectant solution (50% 0.05 M PB, 30% ethylene glycol, 20% glycerol), and the fifth series of sections was placed in 4% formalin for at least 4 weeks before staining for myelin.
Immunohistochemistry
Immunohistochemical reactions using antibodies against nonphosphorylated neurofilament (NNF) and the calcium-binding proteins calbindin-D28k and parvalbumin were used to demarcate the subnuclei of the pulvinar nucleus, the layers of the LGN and the boundary of area MT. These data were then digitized using MDPlot (v 5.2, Accustage) and used to create a three dimensional model. Sections were also fluorescently single labeled with antibodies against Neuronal Nuclei (NeuN) to identify whether the tracer Fast Blue was specifically localized to area MT relay cells in the PIm. In the LGN and PIm of the monocularly injected animal, synaptophysin was used to identify expression of presynaptic vesicles colocalized within retinal terminals. The same protocol (described below) was followed for all antibodies except NeuN and synaptophysin, which did not include the endogenous peroxidase blocking treatment and were coverslipped with Dako fluorescence mounting medium after the rinses following incubation in the secondary antibody. Concentrations of blocking solutions, primary antibodies and secondary antibodies for each antibody are detailed in Table 1
. Free-floating sections were washed in 0.1 M PB for 20 min, followed by a 15-min wash in 0.1 M sodium phosphate buffer (PBS; Dulbecco A, Oxoid, Basingstoke, UK) containing 0.3% Triton X-100 (PBS-TX; BDH, Poole, UK). After a 30-min treatment with 0.3% hydrogen peroxide in 50% methyl alcohol made up with PBS, sections were rinsed in PBS (2 × 10 min), preincubated in an appropriate blocking solution for 1 h and transferred without rinsing into primary antibody solution (see Table 1
for details). After incubation for 16–18 h at 4°C, sections were rinsed (3 × 10 min) with Tween-20 (Sigma, St. Louis, MO, USA) in PBS, incubated in secondary antibody (see Table 1
for details) in PBS for a further 1 h, then rinsed in PBS (3 × 10 min). After processing with avidin-biotin horseradish peroxidase (1:200; Amersham Pharmacia Biotech, Little Chalfont, UK) in PBS for 1 h, immunoreactivity was revealed using a metal-enhanced chromogen, 3, 3-diaminobenzidine (DAB), and stable peroxide buffer (Pierce Biotechnology, Rockford, IL, USA; 3–6 min reaction time). Unless otherwise stated, all incubations were at room temperature with gentle agitation. Sections were then dehydrated in a series of graded alcohols, defatted in xylene, and coverslipped with DPX (BDH).
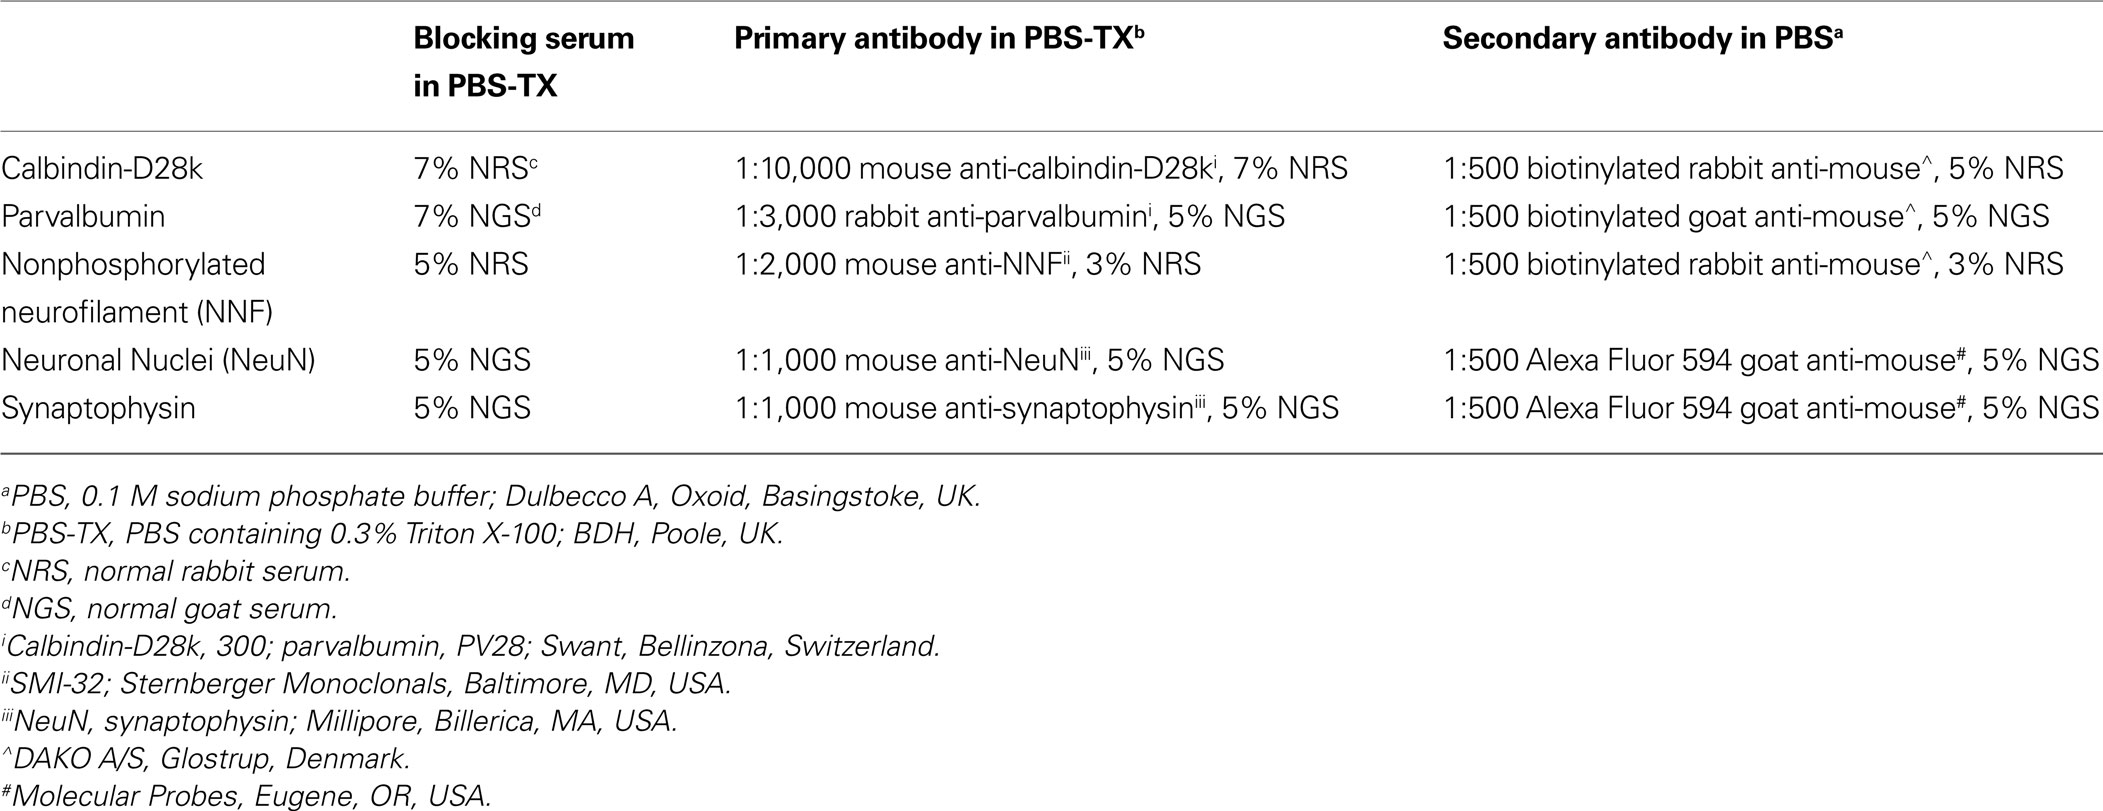
Table 1. Concentration of blocking solutions, primary antibodies and secondary antibodies used in immunohistochemistry.
Negative (omission of primary antibody) and positive controls were performed routinely. Omission of the primary antibody resulted in a complete loss of immunoreactivity (data not shown). For positive calbindin-D28k- and parvalbumin-immunoreactivity controls, the morphology and distribution of cells expressing calbindin-D28k and parvalbumin was compared to the immunolabeling previously described by Jones (2007)
in the New World primate pulvinar nucleus. For NNF positive controls, the morphology and distribution of NNF-immunoreactivity was compared to the immunolabeling previously described by our own studies in the marmoset (Bourne and Rosa, 2006
; Bourne et al., 2007
).
Histology
Sections adjacent to those used for immunolabeling were stained for myelin and CO. A modification of the Gallyas silver impregnation technique (Gallyas, 1979
) for slide-mounted sections was used for myelin staining. Processing for CO reactivity was performed on free-floating sections using the Wong-Riley method (Wong-Riley, 1979
). Sections were then dehydrated in a series of graded alcohols, defatted in xylene, and coverslipped with DPX (BDH). A 0.1% cresyl violet solution was used for Nissl substance staining; slide-mounted sections were reacted until layer 6 was discernible from other layers.
Data and Image Collection
Fluorescently labeled sections were examined using a Zeiss Axioplan 2 epifluorescence microscope. Labeled neurons and retinal terminals were identified using 20× or 40× dry objectives and their locations mapped with a digitizing system (MDPlot3, Accustage, Shoreview, MN, USA). Non-fluorescent sections were examined under brightfield microscopy with a Zeiss Axioplan imaging microscope. Photomicrographs (1300 × 1030 dpi) were obtained with Zeiss 2.5× and 5× Plan-Neofluar objectives, and acquired as digital images using a Zeiss AxioCam digital camera connected to AxioVision software (v. 4.2; Zeiss). Images were cropped and sized using Adobe Photoshop 11 and Illustrator 14. Area MT was identified in adjacent myelin-stained sections and its location demarcated in the photomicrographs using reference points such as corresponding blood vessels throughout the cortex.
Identification and Colocalization of Retinal Synapses with Labeled Area MT Relay Cells Using Confocal Microscopy
Confirming the synapsing of retinal afferents and area MT relay cells in the pulvinar and geniculate nuclei was achieved through laser scanning confocal microscopy and statistical analyses of the resultant images. These cells were imaged on a Nikon C1 inverted confocal microscope, using a Plan Apochromat 100×, 1.4NA oil immersion objective lens, sequential 408, 488 and 561 nm excitation and detection through emission windows of 432–467, 500–530 and 567–642 nm, respectively, to limit crosstalk and bleedthrough, and NIS Elements Software (Nikon, Tokyo, Japan). Stacks of 0.3 μm thick optical sections spanning above and below the cell were acquired. The resulting voxel size was 130 nm × 130 nm × 300 nm, and all images were left in grayscale for colocalization analysis and pseudocolored afterward for illustration of colocalization. Deconvolution was used to reduce background and extract statistically reliable, relevant information (Wouterlood et al., 2002a
,b
) from the z-stacks, which were deconvolved using the commercially available software AutoQuant X (vX2.1.1, MediaCybernetics, Inc). Colocalization of synaptophysin within retinal axons was demonstrated using the colocalization module of Imaris software (v6.3.1, Bitplane) to calculate Pearson’s coefficient which measures the strength of the linear relationship between the grey values of the fluorescence intensity pixels of green and red image pairs (Bolte and Cordelières, 2006
). A scatter plot of the intensity values of two channels against each other in a complete colocalization situation would result in a cloud of dots centred along a straight line and whose spread is quantified by Pearson’s coefficient. A Pearson’s coefficient equal to 1 indicates complete colocalization, a value of zero means no correlation and a value of −1 denotes negative correlation. The synaptic vesicle glycoprotein synaptophysin is located at the terminal of the retinal fiber and therefore, will only partially colocalize with the retinal afferent and the scatter plot will form a semi-uniform cloud representing a decreased Pearson’s coefficient. Bolte and Cordelières (2006)
suggest that mid-range coefficients do not allow conclusions concerning colocalization to be drawn and using their case of partial colocalization as a guide a Pearson’s coefficient greater than 0.6 was selected to indicate partial colocalization in this study. Images in the z-stack were masked so that the only parts of the image used for colocalization analysis were the voxels containing retinal fibers, with all other voxels outside this region being ignored. The masked images were automatically thresholded in both channels based on an algorithm developed by Costes et al. (2004)
. Costes’ approach evaluates the probability (P-value) of the Pearson’s coefficient by excluding colocalization of pixels due to chance, and suggests that the Pearson’s coefficient calculated for the unmasked regions represents true colocalization when a P-value >95% is obtained. In this study, all cases illustrated achieved a Pearson’s coefficient greater than 0.6 and a P-value >95%.
Three-Dimensional Reconstruction
A three-dimensional (3D) model of the pulvinar nucleus was constructed using a suite of programs collectively known as IMOD (image processing, modeling and display). IMOD was developed by the Boulder Laboratory and the Regents of the University of Colorado for 3D reconstruction of electron microscopy images (http://bio3d.colorado.edu/imod/
). To create a 3D model, photomicrographs were taken of sequential sections of the calbindin-D28k-, CO-, and myelin-stained series. The photomicrographs were interleaved with MDPlot diagrams which included fluorescently labeled cells/terminal fields from the two mapped series to produce a stack of images in the z plane with which to reconstruct the brain. Individual images were aligned with each other locally then transformed to align globally using the program ‘midas’. The program ‘3Dmod’ was then used to trace the areas of interest, creating contours which were used to render a surface. In order to render the surface of a structure IMOD creates a triangular mesh/skin around the contours drawn using an algorithm that minimizes the total area of the triangles used to connect the contours. Once rendering of the pulvinar nucleus and PIm surfaces was completed, TIF images of the reconstructed model were taken at 2.4 degree intervals while the model was rotated (150 frames for one revolution) to make a 10-s movie at 15 frames per second using MATLAB (R14 v7.1, The Mathworks, Inc, Supplementary Material).
Demarcation of Thalamic Nuclei and Cortical Area MT
We first confirmed the identity of areas of interest to this anatomical study, in particular the subregions of the pulvinar nucleus and the LGN and extrastriate cortical area MT, using a series of histochemical and immunohistological stains for each of the cases.
Pulvinar nucleus
Of the series of histological and immunohistochemical stains used, calbindin-D28k immunostaining proved to be the most useful for demarcating the inferior pulvinar (PI) subnuclei, which were labeled according to the nomenclature of Stepniewska et al. (2000)
. In Figure 1
A, immunostaining for calbindin-D28k revealed a crescent-shaped region starting at the caudal pole of the pulvinar nucleus, expanding anteriorly past the caudal end of the LGN and bisected by the corticotectal tract (brachium of the superior colliculus; bsc) that was free of immunostaining. This area was the PIm. Curving around the lateral side of PIm was the highly calbindin-D28k-immunoreactive (neuropil and cells; Figure 1
A) centromedial portion of the PI (PIcm). Cells in PIm, PIcm and the posterior portion of the PI (PIp) express parvalbumin in a complementary pattern to calbindin-D28k, with high immunoreactivity in PIm and less in PIcm and PIp (Figure 1
B).
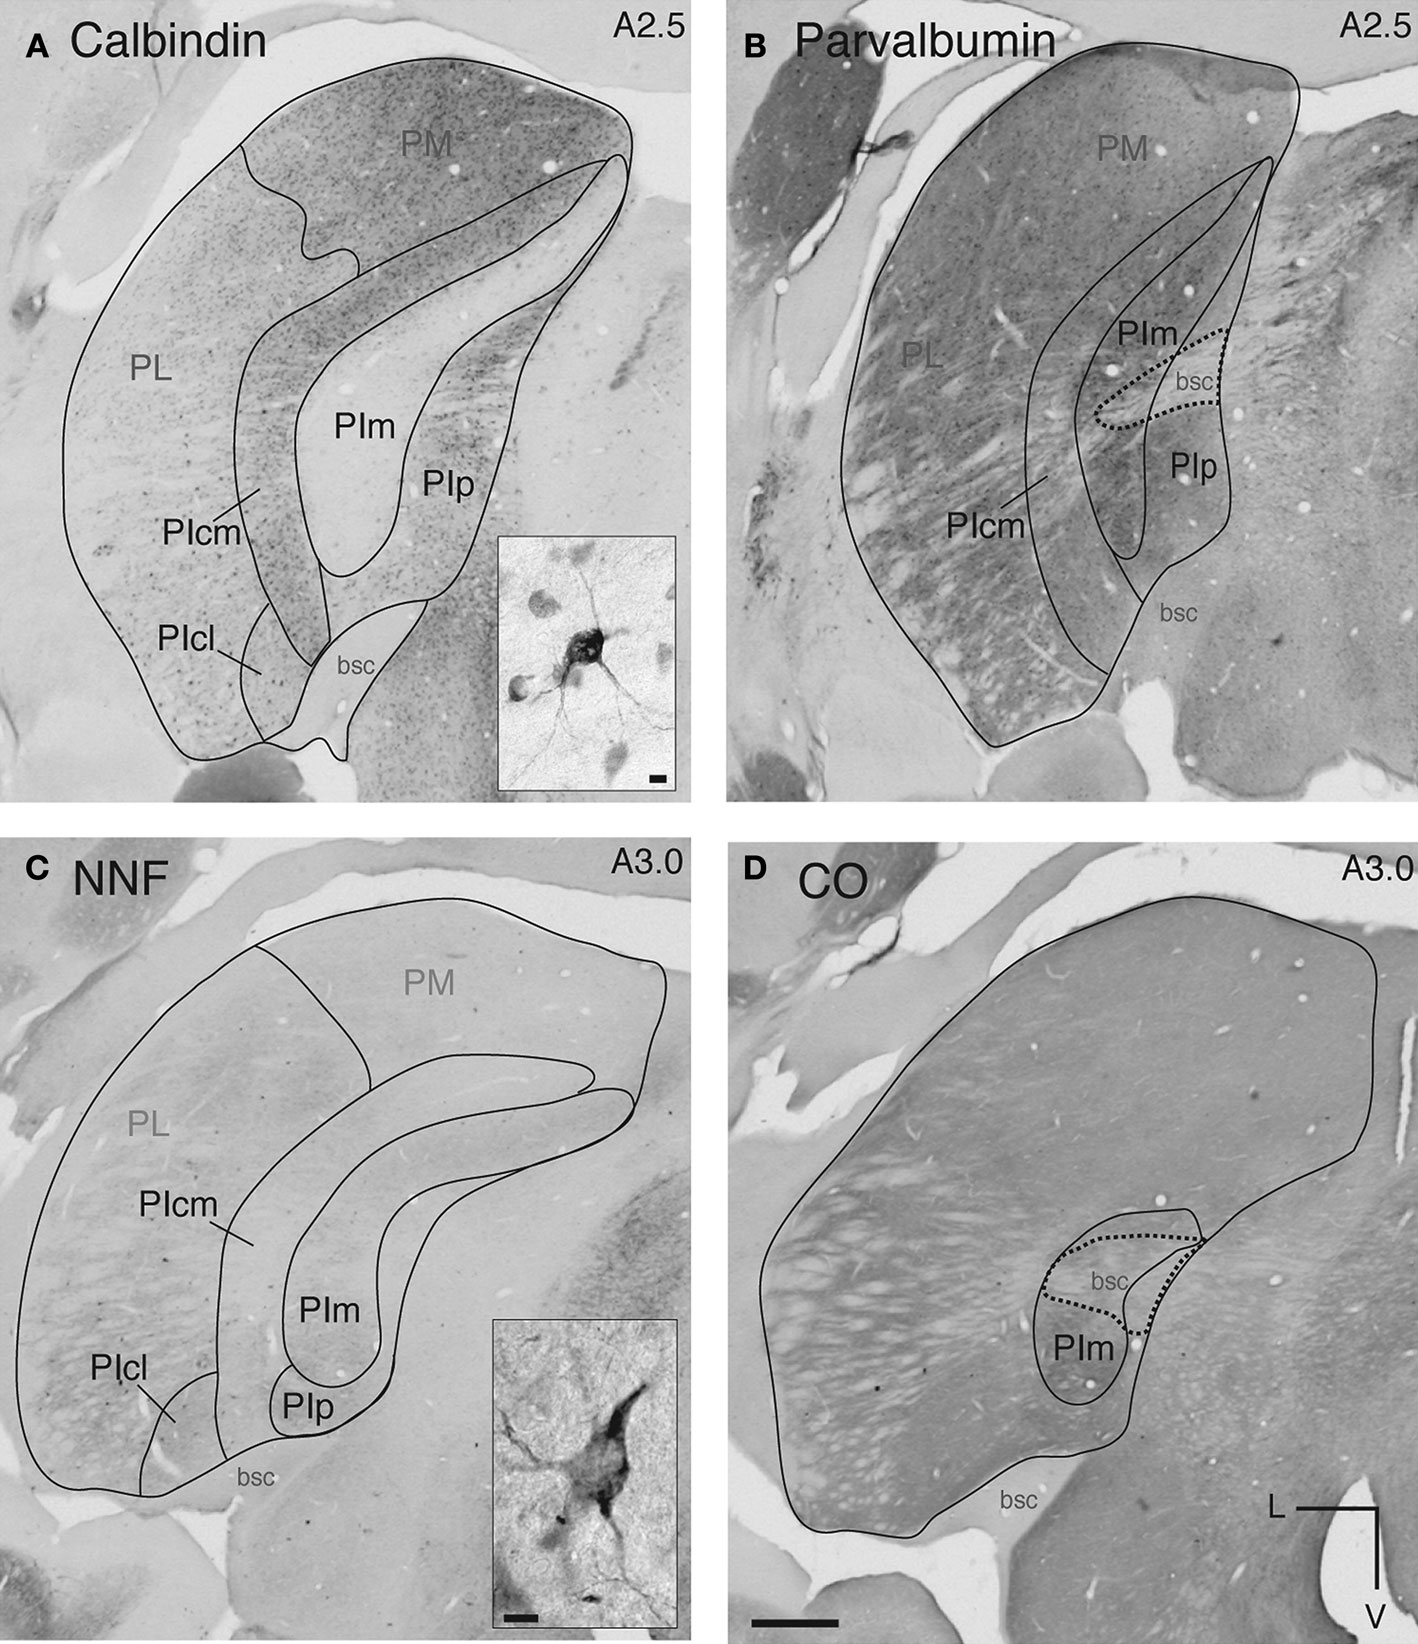
Figure 1. Immunohistochemical and histological staining of the marmoset pulvinar nucleus enables demarcation of subnuclei. Coronal sections at a similar A-P level (A,B: A 2.5 mm and C,D: A 3.0 mm) of the left hemisphere pulvinar nucleus (A,B: CJ59, C,D: NM32) processed with different histological and immunohistochemical techniques. Demarcations have been included where it was possible to identify these with each stain. (A) Section of pulvinar nucleus reacted with the antibody to calbindin-D28k showing a lack of immunoreactivity in PIm surrounded laterally by a more intensely stained (cells and neuropil) PIcm. Medially located PIp has light neuropil and dark cells that are less densely stained than those of PIcm. Ventrolateral to PIcm is PIcl which has darker neuropil and sparse small dark cells. Lateral to PIcl and PIcm is PL, most of which stains lightly for neuropil and cells with the exception of the dorsomedial part that has slightly increased staining in cells. Inset: Also present in PL, PIcl and PIcm are large intensely stained cells, the majority residing ventrally. Dorsal to PI and PL lies PM with moderate staining of neuropil and small dark cells. (B) Section of pulvinar nucleus adjacent to (A) reacted for parvalbumin showing a complementary reaction pattern to that observed for calbindin-D28k. PIm is more heavily immunostained than PIcm and PIp. Due to the darkness of the neuropil immunostaining the brachium of the superior colliculus can easily be seen bisecting the pulvinar nucleus. (C) Section of pulvinar nucleus reacted with NNF antibody, showing moderate immunostaining of PIm, an absence of immunostaining in the PIcm and very light NNF immunostaining of PM. Neuropil was immunostained in the PIcl and was slightly darker in the PL (ventrolateral portion of PL is darkest). Inset: Neurofilament expression in perikaryon and dendrites of large dark NNF-immunopositive cells in PL, PIcl and PIcm. (D) Section of pulvinar nucleus stained for cytochrome oxidase showing a dark stained PIm, with no reactivity in the brachium of the superior colliculus similar to the parvalbumin antigen-free region of the brachium of the superior colliculus in (B). All four protocols were used to demarcate the subdivisions of the pulvinar nucleus for the purposes of digitizing and the overlay of retinal afferents and area MT relay cells. L, lateral; V, ventral; scale bar = 500 μm, inset scale bar = 10 μm.
NNF-immunoreactivity revealed moderate immunostaining in PIm (Figure 1
C). Only the darker staining ventral portion of the PIm could be distinguished with CO staining (Figure 1
D; compare with Figure 1
A). Other larger subdivisions of the pulvinar nucleus (medial, PM; and, lateral, PL) were also discernible with these series of histological and immunohistochemical stains (Figure 1
).
Lateral geniculate nucleus
In the marmoset, the LGN has a different pattern of lamination and connectivity compared with that of Old World monkeys (Kaas et al., 1978
; Spatz, 1978
; White et al., 1998
; Szmajda et al., 2008
). In the marmoset, the LGN has two magnocellular layers, two parvocellular layers and four koniocellular layers along its dorsoventral axis. In the Nissl body-stained section in Figure 2
(Figure 2
A; 4.5 mm anterior to the interaural axis), all the magnocellular, parvocellular and koniocellular layers are discernible, with the large cell bodies of the magnocellular layers (two ventral layers; Figure 2
A) clearly distinct from the smaller cells in the parvocellular and koniocellular layers. NNF-immunoreactivity in the LGN revealed a denser labeling of both neuropil and cell bodies in magnocellular layers (Figure 2
B), whereas the parvocellular layers were almost devoid of any immunostaining. Calbindin-D28k immunostaining demarcated two large koniocellular layers (K1 and K3, Figure 2
C). All three antigen and histological stains were used in determining the precise laminar demarcation of the LGN.
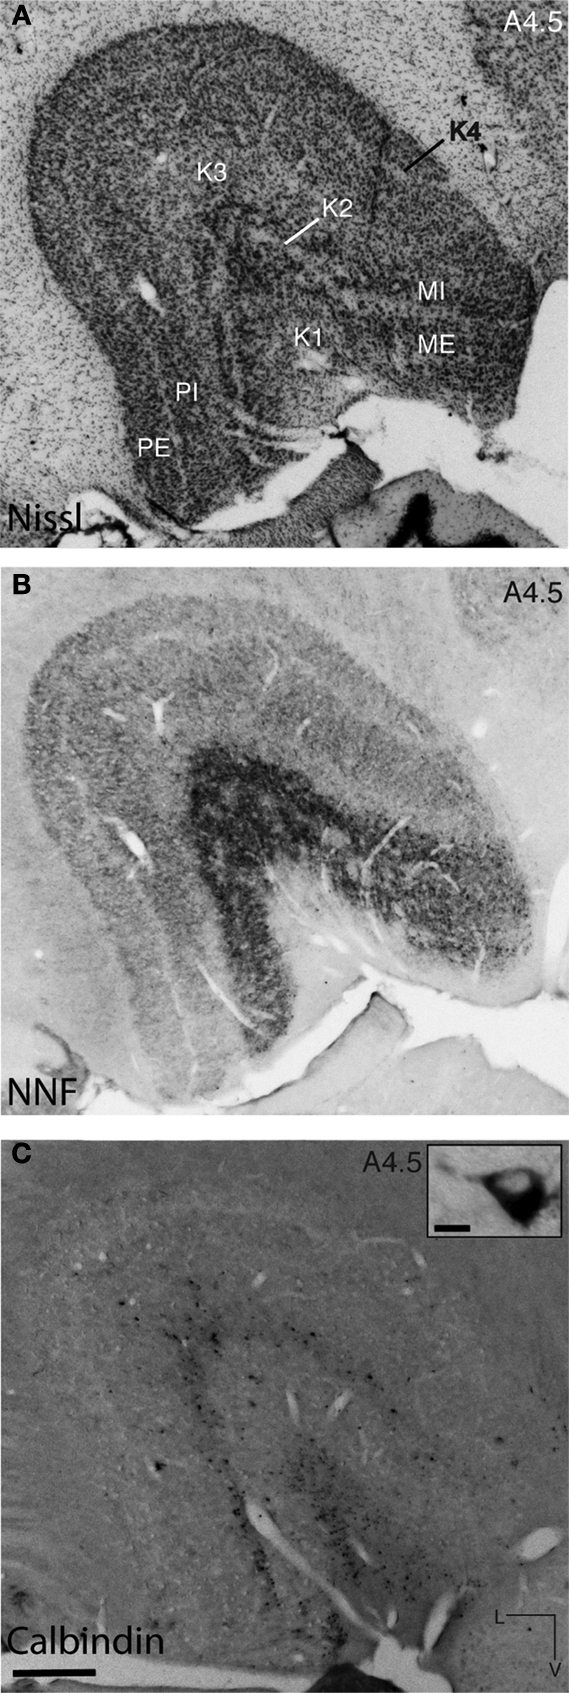
Figure 2. Photomicrographs of adjacent coronal sections of the marmoset LGN processed with different histological and immunohistochemical stains enable demarcation of the magnocellular, parvocellular and koniocellular layers. (A) Section stained with cresyl violet (Nissl bodies) revealing the large cells of the magnocellular layers (MI and ME) and the smaller cells in the two parvocellular layers (PI and PE). (B) Immunostaining for NNF shows an increase in reactivity in both cells and neuropil in the magnocellular layers compared with the parvocellular layers, making them clearly discernible. In both the Nissl substance and NNF stains, it is difficult to discern the discrete koniocellular (K1-4) layers, but staining with an antibody for calbindin-D28k (C) reveals these layers. Inset: Calbindin-D28k-immunoreactive cell in layer K3 of the LGN. All three protocols were used to demarcate the laminar borders in the LGN for the purposes of digitizing and the overlay of retinal afferents and area MT relay cells. L, lateral; V, ventral; scale bar = 500 μm, inset scale bar = 10 μm.
Middle temporal area
Positioned on the lateral bank of the cortical surface dorsal to the superior temporal sulcus and caudoventral to the lateral sulcus, area MT is most obvious by staining for myelin and NNF. Myelin staining is dense in the infragranular layers compared with surrounding areas, and likewise there is a strong increase in the density of NNF-immunoreactivity in layers 3 and 5, involving strong labeling in the cell cytoplasm and a more subtle increase in the density of immunostained neuropil. Both myelin staining and NNF-immunolabeling were used to confirm the dorsal and ventral boundaries of area MT and determine the accuracy of the injection site in each of the cases (Figure 3
). Serial reconstructions enabled demarcation of the anteroposterior/dorsoventral extent of each injection site (Figure 3
, inset) within area MT, and excluded the possibility of tracer infiltrating into neighboring satellites and impingement upon the white matter.
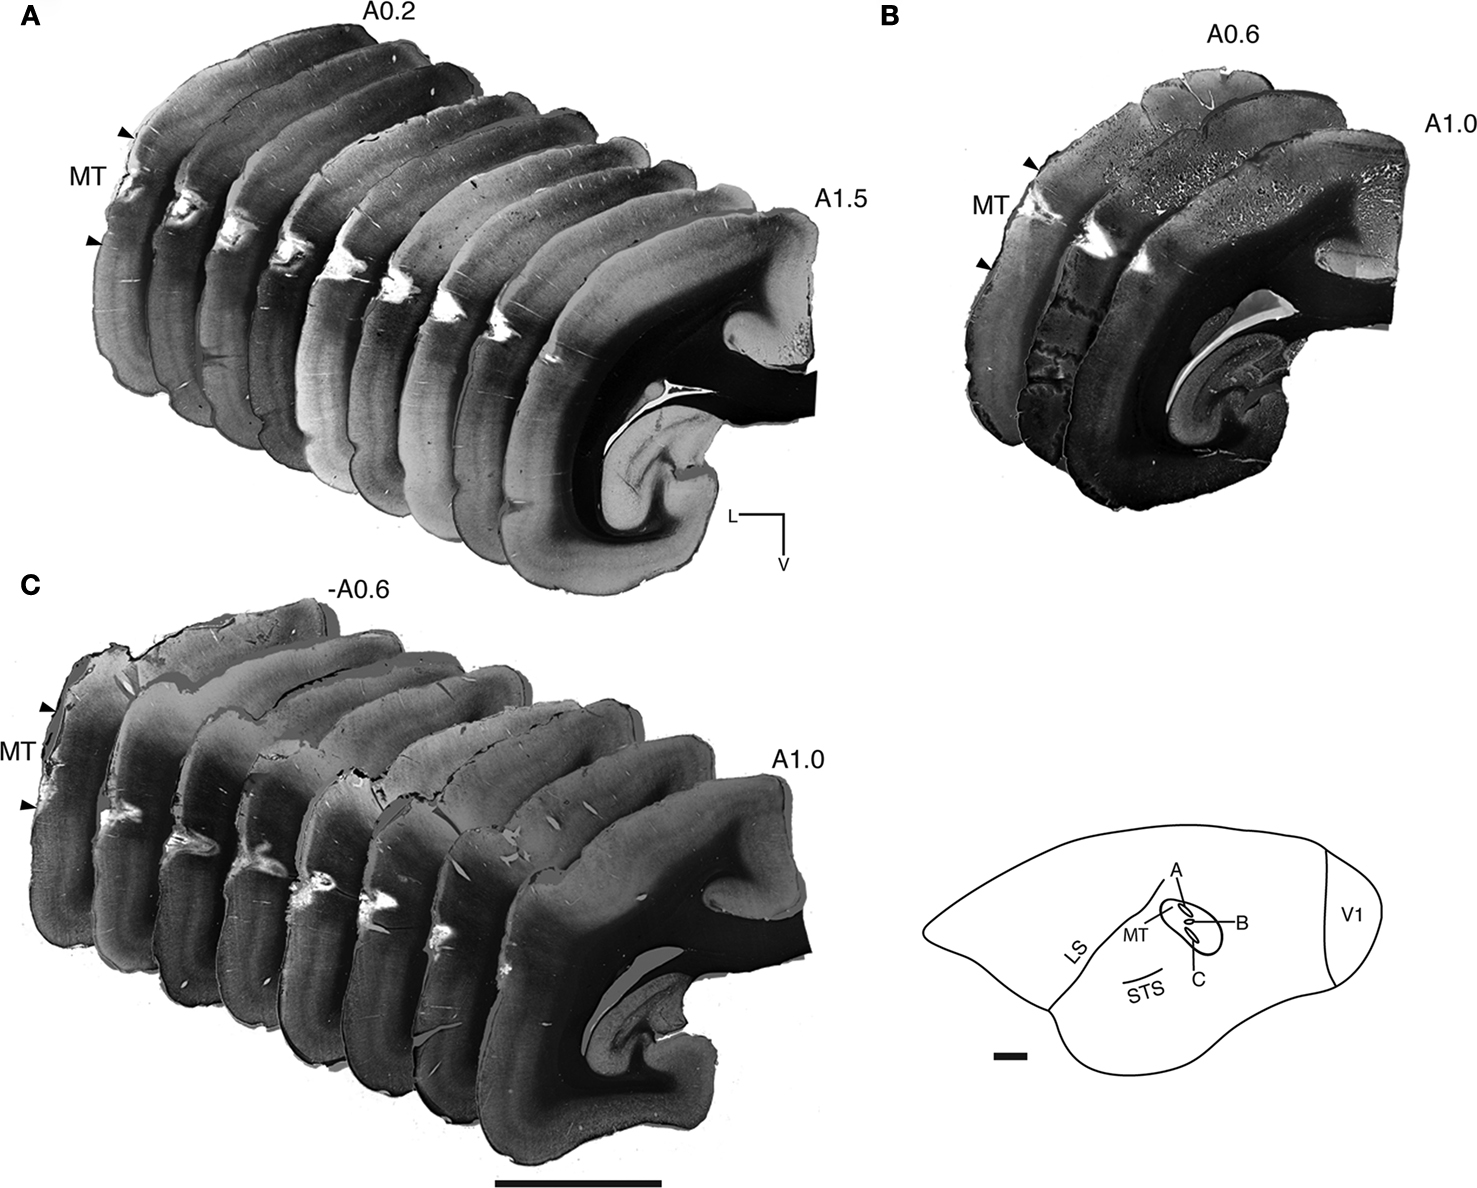
Figure 3. Myelin-stained coronal sections enables identification of area MT and ensures accurate placement of Fast Blue injections. (A) NM53 A0.2–1.5 mm, crystal insertion. (B) NM55 A0.6–1.0 mm, micropipette injection. (C) NM58 A0.6–1.0 mm, crystal insertion. These montages confirm the correct placement of the Fast Blue in cortical area MT in all three cases, and also confirm that the injection/crystal placement has not impeded upon the white matter. The location of injection sites mapped out on the lateral surface of area MT for each case studied can be seen in the inset, revealing the varied topographical placement of each. LS, lateral sulcus; STS, superior temporal sulcus; L, lateral; V, ventral. Scale bar = 3 mm.
Retinal Projections and Area MT Relay Cells in the Pulvinar Nucleus and LGN
To identify the retinofugal pathways to the thalamic nuclei, animals were given injections of the antero-/retrograde neuronal tracer CTb into the eyes, with the retinal terminals being identified within subregions of the pulvinar nucleus and the LGN. Each eye was injected with CTb conjugated to a different fluorophore (right eye, Alexa Fluor 488; left eye, Alexa Fluor 594). To establish the thalamo-MT projections from the LGN and pulvinar nucleus, the same animals received an injection of the retrograde tracer Fast Blue in area MT.
Pulvinar nucleus
Retinal input to the pulvinar nucleus was sparse and primarily restricted to the PIm coinciding with relay cells projecting to area MT. Retinal terminal fields associated with labeled area MT relay cells had thin axons and small varicosities along their length, resembling beads on a string (Case NM53; Figure 4
A).
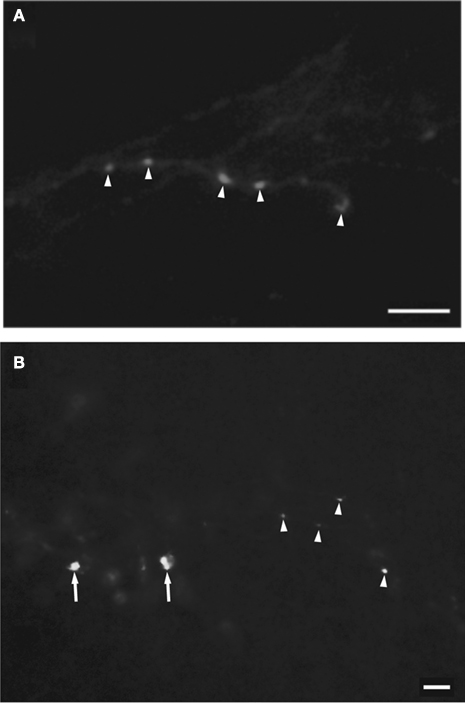
Figure 4. Representative examples of the morphology of target-specific retinal terminal fields from the contralateral eye seen in the medial portion of the inferior pulvinar nucleus (PIm) (A) and LGN (K1 layer) (B) of the left hemisphere. Retinal terminal fields seen in the PIm have thin axons with small sized varicosities (arrow heads) resembling beads on a string. In the K1 layer of the LGN the terminal fields are seen to have thick axons with large varicosities (arrows) as well as medium caliber axons with well-spaced medium varicosities (arrow heads). Scale bar = 5 μm in (A) and scale bar = 10 μm in (B).
Figure 5
summarizes the pattern of labeling for contralateral retinal input (Case NM55; Figure 5
, green dots) and area MT relay cells in the pulvinar nucleus (Figure 5
, blue triangles). In Figures 5 and 6
, green dots represents the existence of putative CTb labeled terminals which were identified by the presence of varicosities along and/or at extremities of labeled fibers. Contralateral retinal input was seen along the entire dorsoventral axis of PIm. Centrally along the anteroposterior axis, retinal terminals were observed to split into dorsal and ventral divisions, the dorsal group close to PIm’s juxtaposition with the more medial pulvinar nucleus subdivision, PIp (A2.1 mm). At this anterior–posterior level, and more anteriorly, terminals were also observed in the surrounding subdivisions PIp, PIcm and the centrolateral portion of the PI (PIcl). Only the contralateral input is shown in Figure 5
, but very little ipsilateral input was observed. Area MT relay cells, retrogradely labeled with Fast Blue (Figure 5
; blue triangles), were observed within the pulvinar nucleus where they were restricted primarily to the PIm. In case NM58, a total of 211 Fast Blue-labeled cell bodies were found in the pulvinar nucleus, with 93% of these cells being located in the PIm (Table 2
) and the remaining 7% being divided between PIcm and PL (Table 2
) towards the anterior extent of the nucleus. The main cluster of area MT relay cells in the PIm remained clear of the ventral border of the PIm and was located closer to the border of the PIcm. Figure 6
shows the 3D reconstruction of the pulvinar nucleus (orange) and the position of both contralateral retinal afferents (green dots) and area MT relay cells (colored red for increased visibility) within the PIm (gray) viewed through four different planes.
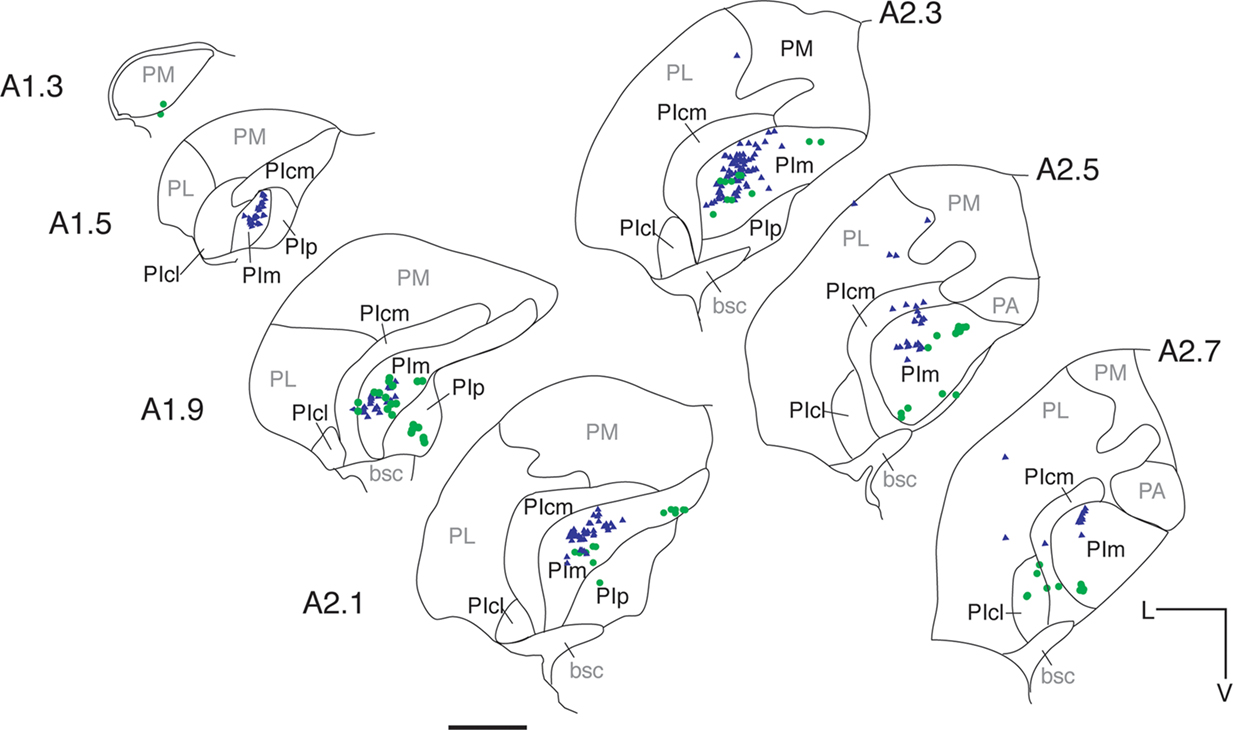
Figure 5. Distribution of retinal afferent terminals and labeled area MT relay cells in the pulvinar nucleus of the left hemisphere. Digitized line drawings of the pulvinar nucleus and its subdivisions in coronal sections (Case NM55; 200 μm interval) demonstrating the distribution of area MT retrogradely labeled cell bodies (blue triangles) and contralateral retinal terminals (green dots) identified as varicosities along labeled axons. Area MT relay cells are mainly clustered in the PIm away from its ventral border and closer to the PIcm. Retinal input, although sparse, was also restricted principally to the PIm, with two separate zones of terminals being observed in the dorsal and ventral region of the PIm. Sections are presented in sequence along the anteroposterior axis, starting at the most posterior end (A 1.3 mm) to the most anterior section (A 2.7 mm). Adjacent sections immunostained for calbindin-D28k were used to delimit pulvinar subnuclei. L, lateral; V, ventral; scale bar = 1 mm.
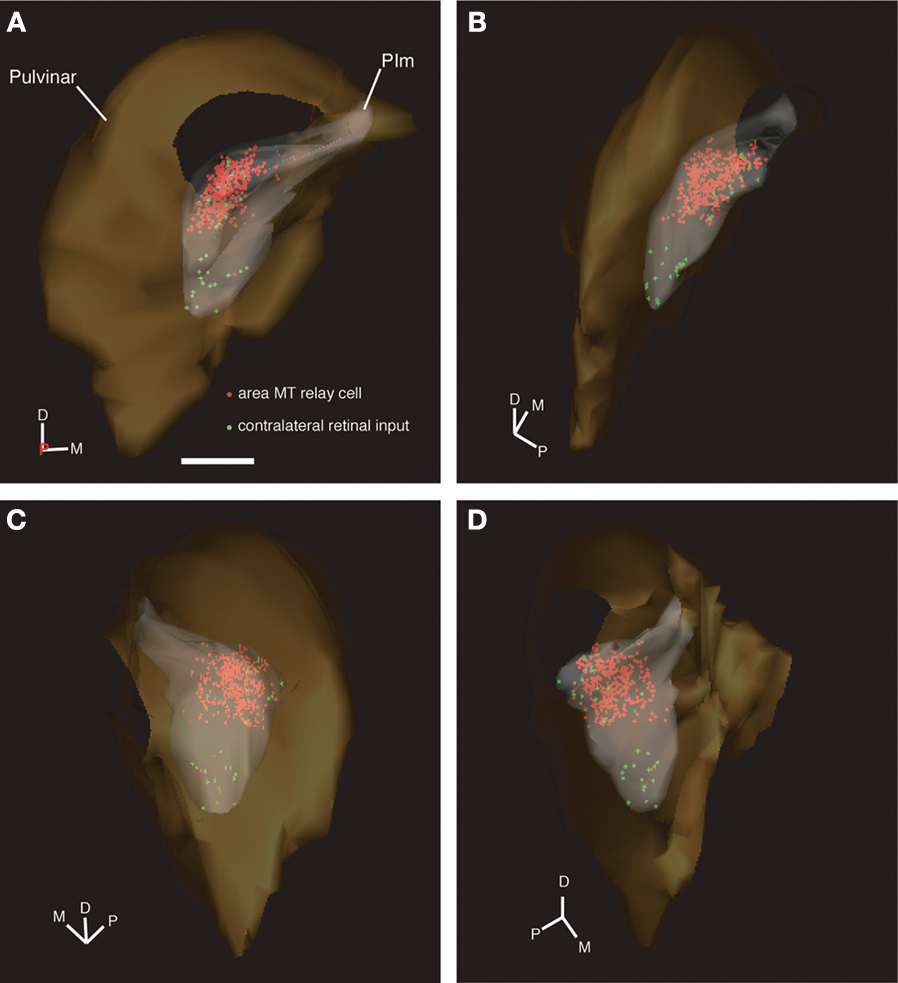
Figure 6. 3D model of the pulvinar nucleus (left hemisphere) constructed from digitized line drawings (Case NM55; 200 μm interval) demonstrating the holistic distribution of retinal afferent terminals and area MT relay cells. In the PIm subnucleus (gray) of the pulvinar nucleus (orange), the distribution of retrograde labeled area MT relay cells (red) and contralateral retinal terminals (identified as varicosities along labeled axons, green), are easily observed. The 3D perspective enables enhanced identification of the sparse retinal input and colocalization with the area MT relay cells, especially in the dorsomedial portion of the PIm. 3D model is rotated anticlockwise in the horizontal plane, i.e. looking from above down onto the model. (A) zero degrees, posterior coming out of screen, (B) 60 degrees, (C) 135 degrees and (D) 300 degrees. D, dorsal; M, medial; P, posterior; scale bar = 1 mm. A movie of the pulvinar nucleus model can be found in Supplementary Material.
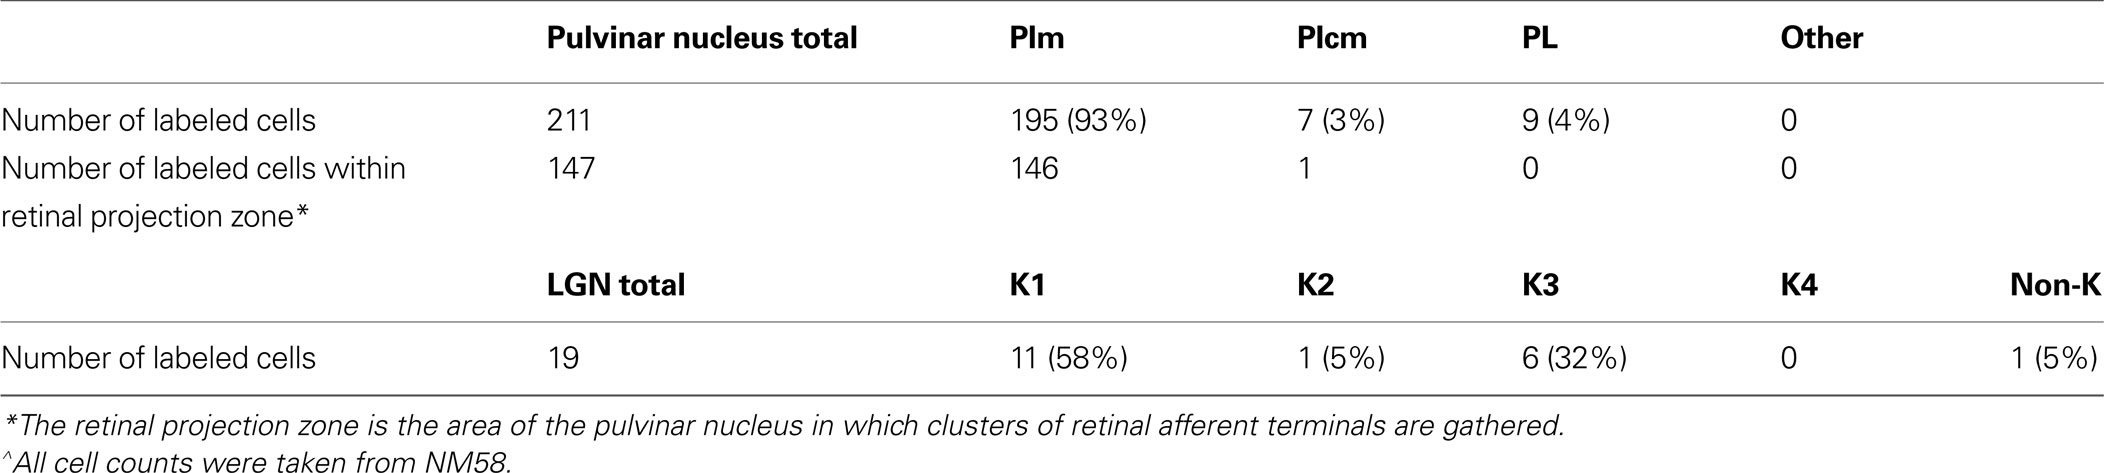
Table 2. Distribution of fast blue labeled cells in the pulvinar nucleus and LGN^.
This reconstruction from serial sections allowed morphometric features of the pulvinar nucleus, specific nuclei and regions of connectivity to be determined. The rendered movie enabled a holistic view of the pulvinar nucleus and clearly demonstrated the clustering of retinopulvino-MT projections within the PIm in relation to the dimensions of the PIm and pulvinar nucleus (see Supplementary Material). Some CTb-labeled puncta did not appear to colocalize with synaptophysin (Figure 9
) which we interpret as reflecting the presence of CTb-labeled retinal axons in cross-section and not at the level of the terminal field.
Lateral geniculate nucleus
Within the LGN the retinal afferents were restricted to specific layers according to their ipsi- or contralateral connectivity. Both the parvocellular and magnocellular internal layers were the recipients of ipsilateral retinal input, where CTb-Alexa Fluor 594-labeled retinal terminals were observed (Case NM58; Figure 7
, red), whereas in the parvocellular and magnocellular external layers CTb-Alexa Fluor 488-labeled retinal terminals were apparent (Figure 7
, green). Binocular labeling was found in koniocellular layers K3 and K1 (Figure 7
, white). Typical retinal terminal fields seen in the koniocellular layers (Case NM53; Figure 4
B) had large boutons studded close together along thick axons, as well as medium caliber axons with well spaced medium-sized varicosities. In each of the four cases, CTb labeling was seen throughout the entire retinotopic extent of the LGN (White et al., 1998
), suggestive of tracer uptake by a large portion of the retinal ganglion cells following intraocular injection. Area MT relay cells within the LGN (Figure 7
, blue triangles) were observed primarily in the K1 layer (58%, Table 2
), mostly in the posterior portion of the nucleus. A few cells were also observed in the K3 layer (32%, Table 2
), as well as an occasional cell in the internal magnocellular and parvocellular layers. It is interesting to note that from a single injection into area MT there was over 10 times more retrograde labeling in the PIm compared to all the layers of the LGN combined (Table 2
).
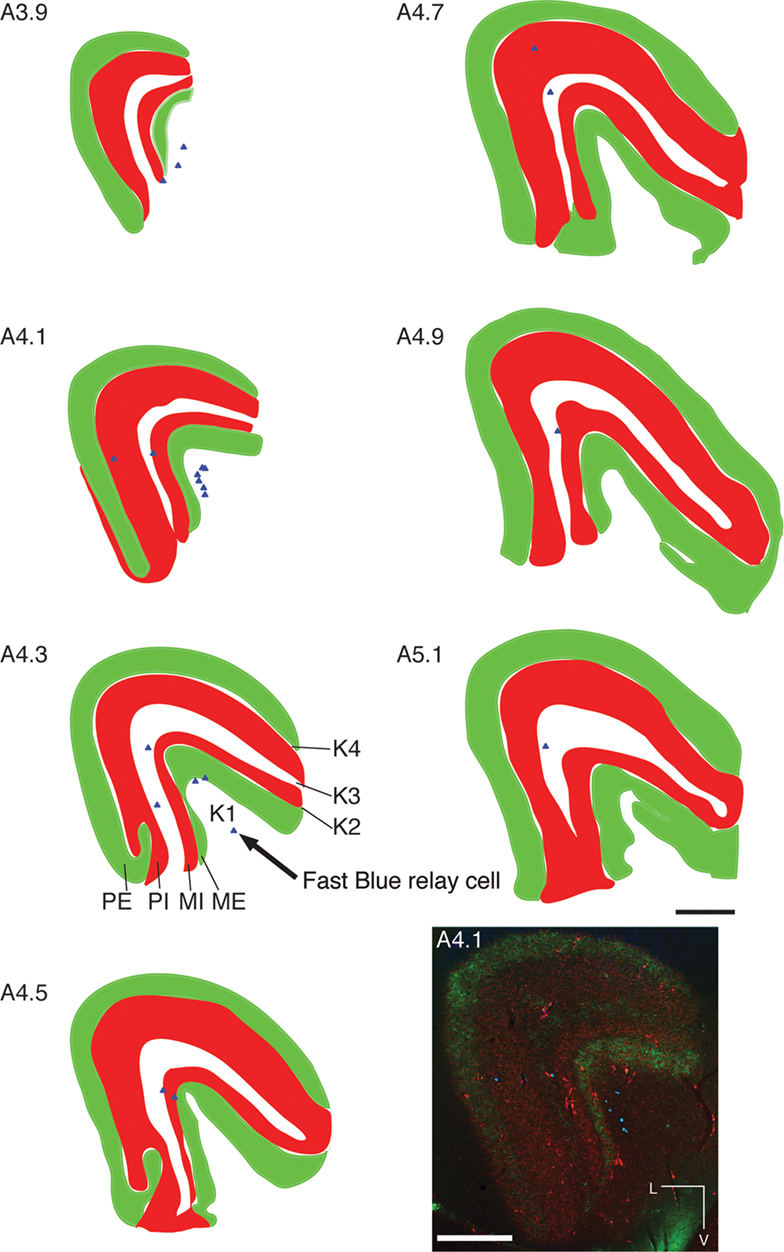
Figure 7. Distribution of labeled area MT relay cells throughout the layers of the left LGN. Digitized line drawings of the LGN and its layers in coronal sections (Case NM58; 200 μm interval), demonstrating the distribution of ipsilateral (dark red) and contralateral (light green) terminal fields in the magnocellular and parvocellular and koniocellular layers (white) in addition to the area MT relay cells (blue triangles), seen primarily in the medial sections of the LGN and in the koniocellular layers (K1 and K3). Sections are presented in sequence along the anteroposterior axis from at the most posterior (A 3.9 mm) to the most anterior section (A 5.1 mm). Anteroposterior level 4.1 is reproduced at the bottom right to illustrate the pattern of labeling seen in the LGN used to create the line drawings. Adjacent sections reacted for calbindin-D28k, NNF and Nissl substance were used to delimit the LGN laminae. L, lateral; V, ventral; scale bar = 500 μm.
Synapsing of Retinal Afferents and area MT Relay Cells
The Fast Blue tracer profile (Figure 8
, Cell 1 and Cell 2) was confirmed to involve retrogradely labeled neuronal cell bodies with the neuronal nuclear antibody, NeuN. In the same section, we observed colocalization with bouton-like terminals from the contralateral retina, which surrounded the area MT relay cells. Overlaying the separate images confirmed that bouton-like terminals of the retinal afferents formed a ring around the periphery of the area MT relay cell. In addition, we verified that there were no other neuronal cells in the vicinity of the labeled retinal terminals by immunolabeling with NeuN in all cases examined (see Figure 8
). Using confocal microscopy we were able to further demonstrate the colocalization of contralateral retinal terminals with an area MT-projecting cell (see Figure 8
, Cell 3). From the confocal image it can be seen that the contralateral retinal terminals are in contact with and are in the same plane as the area MT relay cell.
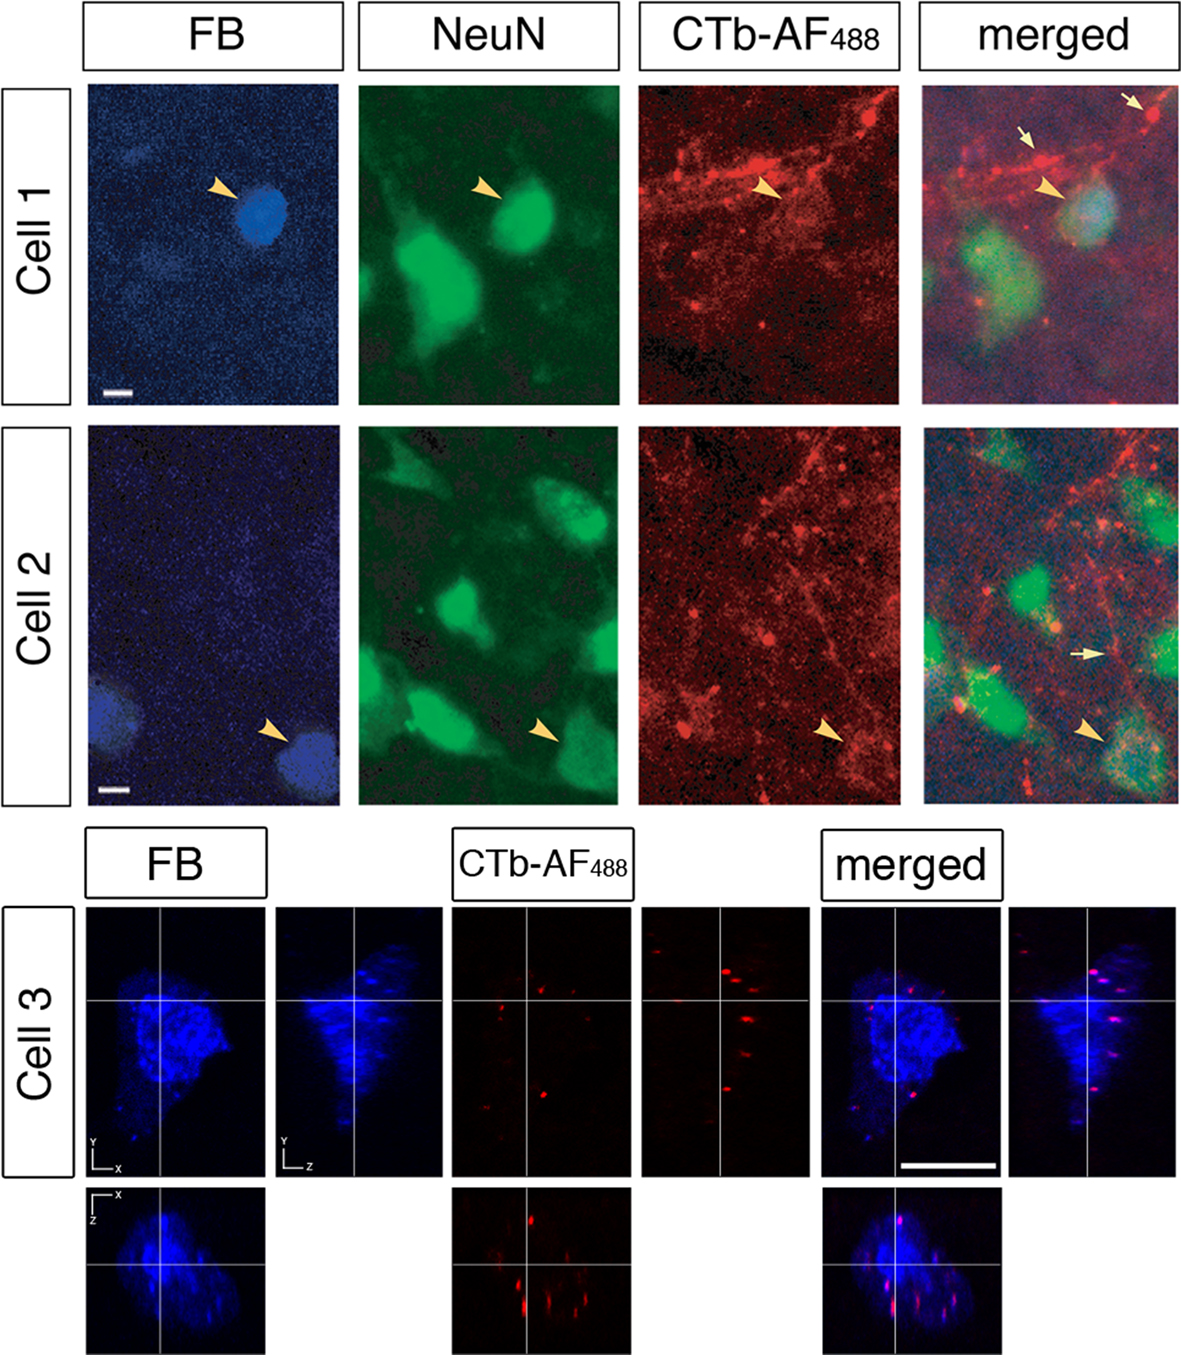
Figure 8. Evidence of contralateral retinal afferent terminals surrounding area MT relay cells in the medial portion of the inferior pulvinar nucleus (PIm). Using standard epifluorescence microscopy, we demonstrate two representative cells (Cell 1 and Cell 2) from different sections to reveal the existence of area MT relay cells in the PIm of the pulvinar nucleus, which are confirmed as cell bodies by colabeling with the neuron-specific nuclear stain NeuN [pseudocolored green for better visibility of overlap with Fast Blue (FB) labeling]. These cell bodies were then observed to be colocalized with terminals of the contralateral retinal afferents labeled with CTb-AF488 (pseudocolored red) surrounding the periphery of the cell bodies. Large arrowheads point to an area MT relay cell surrounded by ‘bouton-like’ terminals. Small arrows indicate en passage retinal axons proximal to area MT relay cells, representative of the type of axonal fiber observed in the PIm (thin axon with small varicosities). Using confocal microscopy we are able to further demonstrate the colocalization of contralateral retinal terminals with an area MT-projecting cell (Cell 3). Cell 1 and 2 scale bar = 5 μm, cell3 scale bar = 10 μm.
Using this paradigm, we could ensure that the retinal terminals were indeed synapsing on the MT relay cells and not adjacent cells. To confirm that the surrounding retinal afferents were forming synapses onto area MT relay cells in the PIm and the koniocellular layers of the LGN we used the presynaptic marker synaptophysin (Figures 9 and 10
). A number of studies have used this antibody as a marker of axonal terminals in the central nervous system as well as for identification and quantification of synapses (Calhoun et al., 1996
; Silver and Stryker, 2000
; Dessem et al., 2007
; Hohensee et al., 2008
). Synapsing of a retinal afferent onto an area MT relay cell in the koniocellular layers of the LGN and the PIm was determined by corresponding voxels in the red and green channels having a Pearson’s coefficient greater than 0.60 as determined by Costes’ method with a P-value greater than 95% (see Materials and Methods). This indicates that the overlap (yellow) seen in Figures 9 and 10
is in fact true colocalization and represents a synapse formed by the retinal terminal. A number of examples of area MT relay cells surrounded by contralateral retinal input with synaptophysin-immunoreactive boutons were observed, especially in the ventral portion of PIm (Figure 9
) where both retinal afferents and area MT relay cells were most numerous (Figure 5
), and in koniocellular layers of the LGN (Figure 10
). Retinal input to area MT relay cells in the PIm was more closely associated with the area MT relay cell body whereas retinal terminal fields of the koniocellular K1 and K3 layers seemed to be on the proximal part of the CTb-labeled axon near the cell body (arrowheads Figure 10
).
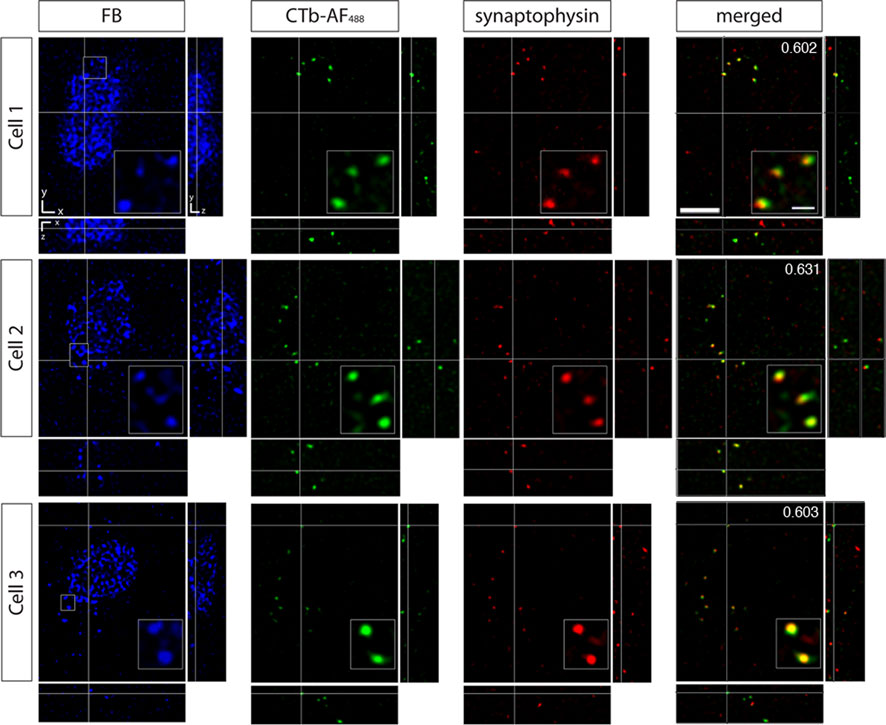
Figure 9. Confocal micrographs of three area MT relay cells in the left hemisphere pulvinar nucleus (PIm) surrounded by retinal terminals from contralateral retinal afferents colocalized with synaptophysin. In PIm, contralateral retinal terminals (green) synapse onto the cell bodies of Fast Blue-labeled area MT relay cells as confirmed by colocalization with synaptophysin (red) resulting in overlapping (yellow) puncta. Overlapping puncta was seen to be concentrated at one end of the cell (Cell 1) and surrounding the cell body. In this example, area MT of the left hemisphere was labeled with Fast Blue and the right eye was labeled with CTb-AF488. Values in the top right hand corner of the merged images indicate Pearson’s coefficient for synaptophysin and contralateral retina input as calculated by Costes’ method (see Materials and Methods). The merged image only shows the overlay of the anterograde label and the synaptophysin immunofluorescence to better visualize their colocalization. Scale bar = 5 μm. Insets: 3× magnification of selected area outlined by small box in the FB image of each cell. Scale bar = 2 μm.
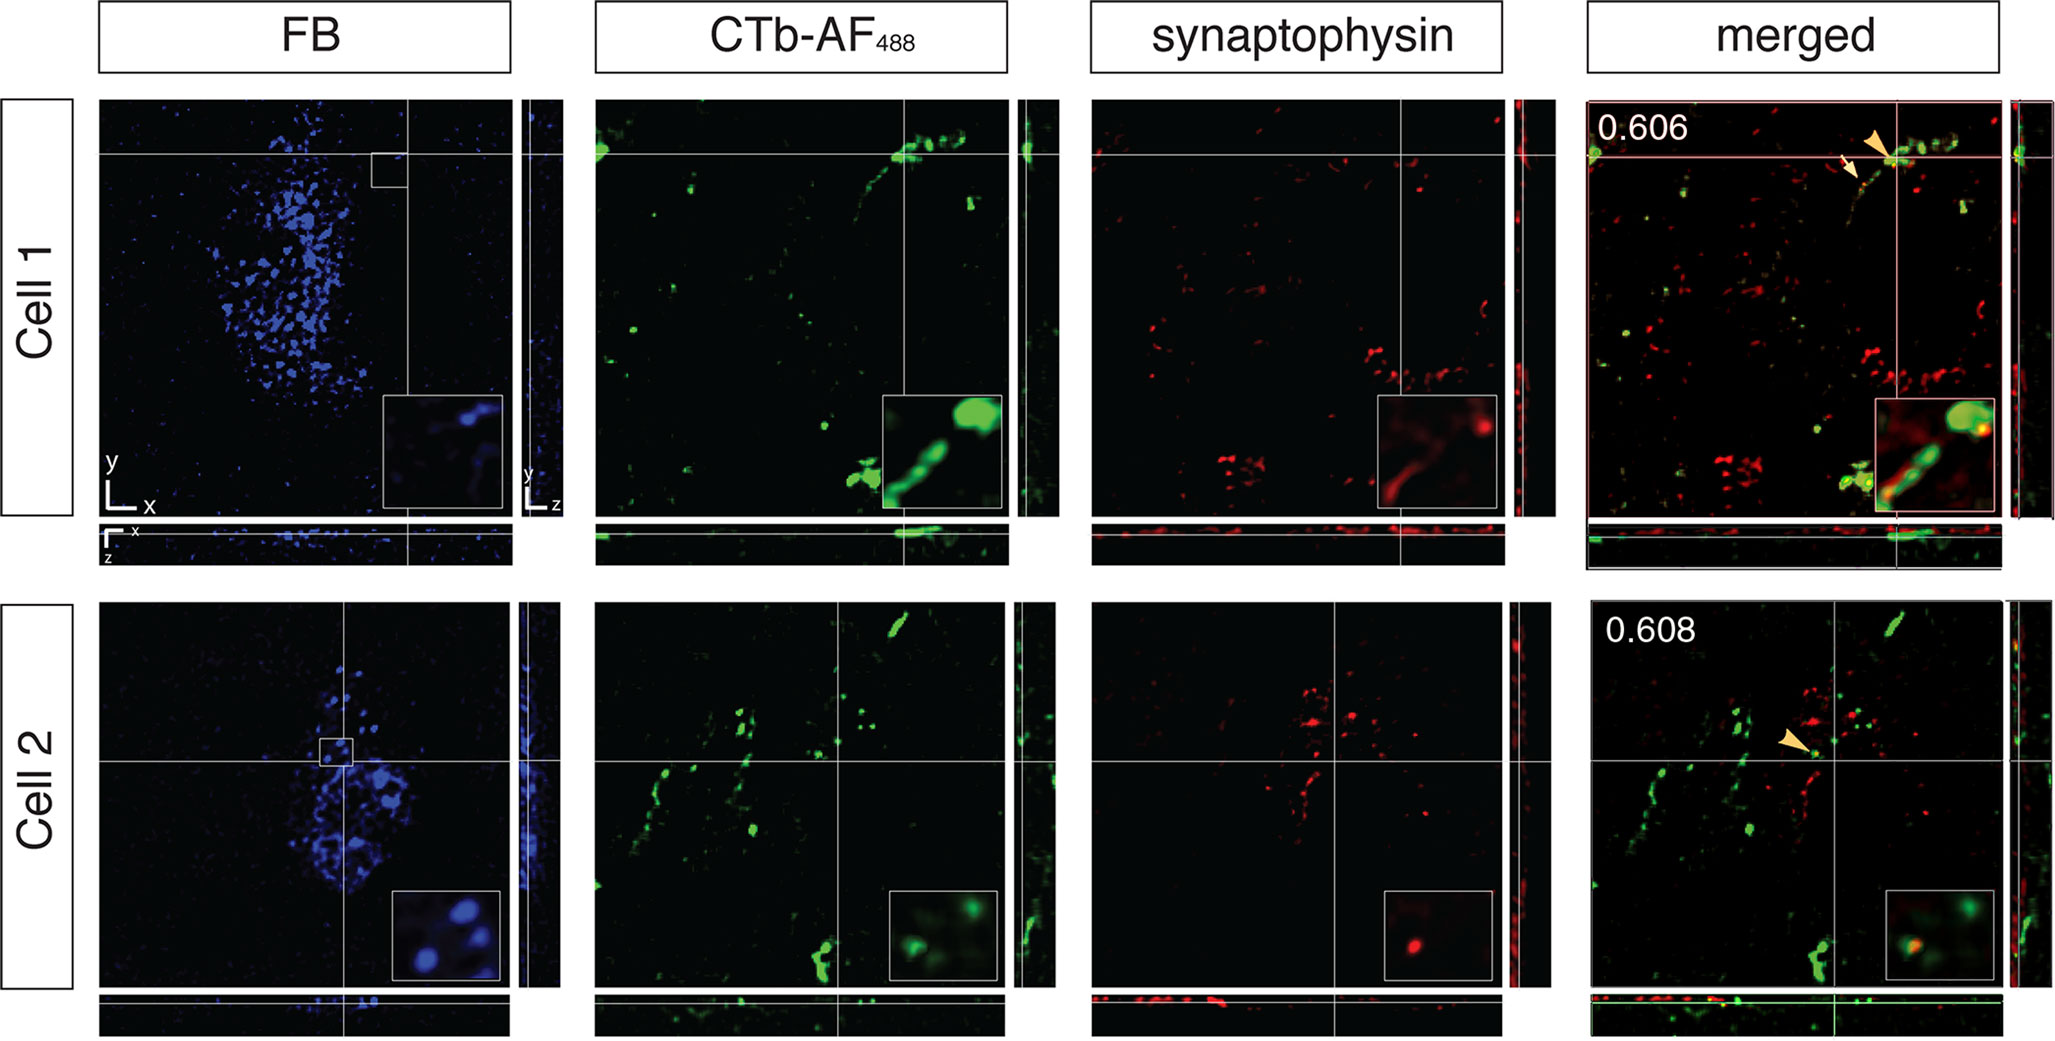
Figure 10. Confocal micrographs of two area MT relay cells from layers K1 and K3 of the left hemisphere LGN associated with contralateral retinal input colocalized with synaptophysin. Blue images correspond to Fast Blue (FB)-labeled area MT relay cells, retinal input from the right eye labeled with CTb-AF488 and red images to synaptophysin. Right panels are merged images (FB + CTb-AF488 + synaptophysin). Large and medium sized boutons are colocalized (arrowheads) with synaptophysin proximal to FB-labeled cells. Cell 1 has a large bouton sending a fine axon (small arrow) to the cell body. From the top right hand corner of Cell 2, axons are seen to travel towards the area MT relay cell body where they synapse. Values in the top right hand corner of the merged image indicate Pearson’s coefficient for synaptophysin and contralateral retina input as calculated by Costes’ method (see Materials and Methods). The merged image only shows the overlay of the anterograde label and the synaptophysin immunofluorescence to better visualize their colocalization. Scale bar = 5 μm. Insets: 3× magnification of selected area outlined by small box in the FB image of each cell. Scale bar = 2 μm.
Despite continued research, confirmation of the existence of disynaptic retinothalamic pathways to area MT is independent of the geniculostriate pathway has been thwarted by the inability to demonstrate synapses between cells of the specific component pathways. The concept of two parallel visual systems was originally developed by Diamond and colleagues (Snyder and Diamond, 1968
) who ablated the striate cortex of the tree shrew and subsequently implied that a pathway to the visual temporal cortex parallel to the geniculostriate path capable of mediating visual discrimination in the absence of striate cortex must exist. Later they identified a pathway from the superficial layers of the superior colliculus to the pulvinar nucleus and from there to the extrastriate cortex (Harting et al., 1973a
,b
). This pathway was later to be found in the gray squirrel (Robson and Hall, 1977
), galago monkey (Glendenning et al., 1975
), squirrel monkey (Mathers, 1971
; Cusick et al., 1993
; Stepniewska et al., 2000
), marmoset monkey (Dick et al., 1991
; Stepniewska et al., 2000
), owl monkey (Lin and Kaas, 1979
, 1980
) and macaque monkey (Benevento and Fallon, 1975
; Benevento and Standage, 1983
; Stepniewska et al., 2000
). We would like to add to this concept that there also exists two other pathways; the retinopulvinar-MT and the retinogeniculate-MT pathways. Previous studies have established the presence of monosynaptic pathways either from the retina to the pulvinar nucleus in the squirrel (Major et al., 2003
), tree shrew (Hubel, 1975
; Ohno et al., 1975
; Somogyi et al., 1981
), cat (Berman and Jones, 1977
), Matteau et al., 2003
), macaque (O’Brien et al., 2001
) and human (Sadun et al., 1986
) or from the pulvinar nucleus/LGN to area MT (e.g. Dick et al., 1991
; Sincich et al., 2004
). However, in the absence of direct evidence for synapses, the role of these putative pathways has remained speculative. Rather than using the traditional methodology of electron microscopy, this study has employed the use of confocal microscopy coupled with a presynaptic marker and statistical image analysis to verify the presence of synaptic connectivity. Unlike electron microscopy, this method allows a large number of axon terminals and the overall population of retrogradely labeled area MT relay cells throughout the PIm to be analysed as a whole. Furthermore, it enables the three-dimensional analysis of synaptic connections with retinal relay cells, a feature that has been vital in the distinction between contacting and passing labeled fibers and the elimination of false positive contacts in this present study. In a correlative study between electron and confocal microscopy, Hohensee et al. (2008)
found that 83% of presumptive synapses in confocal images were in fact real synapses. Therefore, we now provide the first evidence for the existence of synapses between retinal afferents and area MT relay cells in the marmoset monkey. Moreover, we identify the specific subnuclei and zones within the pulvinar nucleus (PIm) and the LGN (K1 and K3 lamina) where the retinal afferents and area MT relay cells synapse.
Retinopulvino-MT Pathway
The existence of a retino-recipient zone in the PIm of the adult marmoset is in agreement with evidence of direct retinal input to PIm in the baboon (Campos-Ortega et al., 1970
) and macaque (Campos-Ortega et al., 1970
; Mizuno et al., 1982
; Itaya and Van Hoesen, 1983
; Cowey et al., 1994
; O’Brien et al., 2001
), and to the lateral posterior-pulvinar complex of the cat (Itoh et al., 1983
; Boire et al., 2004
), although ventral and dorsal retino-recipient zones in anterior PIm were not specifically defined in these studies. However, this does suggest that there are many similarities within the mammalian species. There have been no previous descriptions of retinal projections to the marmoset pulvinar nucleus, although retinal inputs have been described in the intralaminar and suprachiasmatic nuclei (Costa et al., 1999
; Cavalcante et al., 2005
). The majority of retinal inputs in PIm were contralateral, which agrees with previous findings in the macaque (Campos-Ortega et al., 1970
; Mizuno et al., 1982
; Itaya and Van Hoesen, 1983
; Cowey et al., 1994
) and cat (Itoh et al., 1983
; Boire et al., 2004
). However, the morphology of retinal afferent terminals have only been described in the cat pulvinar nucleus (Matteau et al., 2003
; Boire et al., 2004
) and were of similar morphology (small varicosities on thin axons) to those observed in the present study.
Area MT labeled relay cells were predominantly restricted to the calbindin-D28k-poor PIm, with only a few cells in surrounding subnuclei of the PI, such as the PIcm and PIp. Dense projections from PIm to area MT and a few from the surrounding subnuclei, PIcm and PIp, have also been described in the macaque (Standage and Benevento, 1983
; Cusick et al., 1993
; Adams et al., 2000
), squirrel (Cusick et al., 1993
; Stepniewska et al., 2000
), owl (Lin and Kaas, 1980
) and marmoset monkeys (Spatz, 1975
; Dick et al., 1991
; Kaas and Lyon, 2007
). Until now there has been no evidence of a retino-recipient zone coincident with area MT relay cells in the PIm.
Retinogeniculo-MT Pathway
The majority of area MT relay cells labeled in the LGN were localized in the K1 and K3 koniocellular layers, with K1 possessing the majority. A previous study in the marmoset by Dick et al. (1991)
reported a few cells only in layer K3 following area MT injections. Cells from the koniocellular layers projecting to area MT have also been observed in the macaque monkey (Horton, 1984
; Stepniewska et al., 1999
; Sincich et al., 2004
; Nassi and Callaway, 2006
), although not by all groups (Yoshida and Benevento, 1981
; Benevento and Standage, 1982
; Sorenson and Rodman, 1999
). This disparity between studies is likely to be due to the paradigm and tracer used. In the marmoset, Szmajda et al. (2008)
recently observed that ganglion cells with relatively large receptive fields project preferentially to the koniocellular layers and that the dominant wide-field input to layer K3 consists of short wavelength-sensitive or ‘blue’ cone signal ganglion cells. Our finding of sparse input from K3 to area MT is consistent with the fact that short wavelength sensitivity cone inputs to area MT are feeble (Saito et al., 1989
; Seidemann et al., 1999
; Riecanskú et al., 2005
). Area MT projections from the koniocellular layers of the LGN have also been found in other primates where it was demonstrated that the koniocellular neurons projecting to area MT are not a bifurcation of V1-projecting axons (Sincich et al., 2004
). Furthermore, it has been postulated that these neurons are likely to provide information needed to direct area MT in the absence of V1 (Hendry and Reid, 2000
; Sincich et al., 2004
; Vakalopoulos, 2005
; Bridge et al., 2008
). Retinal terminals (see Results) were, however poorly branched, especially around the area MT relay cells as was previously described in the macaque (Conley and Fitzpatrick, 1989
), which was distinct from the retinal terminals in the PIm.
Thalamic Relay Organizational Hierarchy
Sherman and Guillery (1996)
suggested that the LGN acts as a first-order relay and the pulvinar nucleus as a higher-order relay. The order of the relay is defined by the source of driver input that establishes the receptive fields of the relay cells, with all other kinds of input being considered modulatory. The LGN relay cells receive driver input from subcortical afferents (retina) and then relay the first visual input to the cortex (V1), whereas the pulvinar nucleus receives driver input from layer 5 of the cortex. In the current case the retinal inputs to the pulvinar nucleus would be considered modulators. However, the retina is a subcortical source of sensory afferents and, from the evidence provided in this study, the input via the PIm would also represent a first-order relay sending specific information to the cortex (area MT). It might be that the pulvinar nucleus is a combination of first- and higher-order relay circuits (Sherman, 2007
), with the PIm acting more like a first-order relay and the surrounding subdivisions as higher-order relay centers. Supporting evidence for this includes, for example, the similarity of the neurochemical architecture of PIm to other ‘primary’ thalamic relay nuclei such as the ventroposterior nucleus and LGN (Cusick et al., 1993
). The fact that the pulvinar subnuclei adjacent to the PIm (PIp and PIcm) receive indirect retinal input via the superior colliculus suggests different functional roles (Stepniewska et al., 2000
; Stepniewska, 2004
). However, the fact remains that it is likely that these secondary pathways are less dominant than the retinogeniculostriate pathway, at least in adult animals.
Relative Contribution from the Pulvinar Nucleus and LGN to Area MT
What is interesting is that the synapses of retinal afferents on the PIm area MT relay neurons can be found on cell bodies whereas they could only be found on proximal dendrites in the LGN. Although generally excitatory synapses form on postsynaptic dendrites, axosomatic synapses from retinal ganglion cells have been found to exist in the rat intergeniculate leaflet (Juhl et al., 2007
). Considering a proximal synapse will be far more effective at influencing a postsynaptic neuron to produce an action potential than a distal synapse, the presence of axosomatic synapses could indicate a greater importance of the PIm to area MT projection compared to the LGN to area MT projection. Although the Fast Blue labeled cells in the pulvinar nucleus and LGN was only quantified in one animal, there was greater than 10 times more retrograde labeling in the PIm compared to all the layers of the LGN combined from a single injection into area MT. This may further indicate the pulvinar nucleus could have a higher degree of influence than the LGN on area MT.
Evidence for a Role for Disynaptic Pathways to Area MT that Bypass V1
Removal of V1 disrupts the orderly projections that propagate from the striate cortex to area MT silencing all cortical areas relying on striate input and, consequently, driver input from layer 5 to the pulvinar nucleus. Persistence of motion perception in humans with ‘blindsight’ (Barbur et al., 1993
; Stoerig and Cowey, 1997
; Zeki and Ffytche, 1998
; Bridge et al., 2008
) implicates area MT as a cortical substrate for residual vision after removal of V1, which has also been demonstrated in animals. In fact, studies in a number of adult nonhuman primates have demonstrated that some cells in area MT continue to respond (albeit often with weaker responses and increased latency) to moving stimuli following removal of V1 input (Rodman et al., 1989
; Girard et al., 1992
; Rosa et al., 2000
; Azzopardi et al., 2003
). It has therefore been suggested that alternate thalamocortical projections that bypass V1 are responsible for the residual capacity of area MT to respond following inactivation of area V1 (e.g. macaque, Rodman et al., 1989
; Girard et al., 1992
; marmoset, Rosa et al., 2000
; human, Bridge et al., 2008
). Studies of short- and long-term lesions of V1 in anesthetized owl and marmoset monkeys have suggested a complete lack of responsiveness in the corresponding retinotopic zone in area MT (Kaas and Krubitzer, 1992
; Collins et al., 2003
, 2005
). However, our direct demonstration of the existence of these pathways in the adult marmoset provides a likely neural substrate for the electrophysiological responses in area MT following a V1 ablation, which has previously been demonstrated in the marmoset by Rosa et al. (2000)
. Furthermore, removal of V1 at an early age is accompanied by relative sparing of visual loss compared to the same lesion in adults (Moore et al., 1996
; Gross et al., 2004
). It is possible that this phenomenon is due to presentation of a comparatively more robust retinal input to the pulvinar nucleus, as previously observed in kittens following ablation of area 17/18 (Labar et al., 1981
; Payne et al., 1993
), and sparing of specific cell subpopulations (calbindin-D28k-immunopositive) in the degenerated zone of LGN that may project to area MT (Rodman et al., 2001
). This evidence could be indicative of driver input to area MT from the pulvinar nucleus and the LGN during early life which is altered following the critical period.
The authors declare that the research was conducted in the absence of any commercial or financial relationships that could be construed as a potential conflict of interest.
The authors would like to thank Prof. Paul Martin, Dr Tobias Merson and Rowan Tweedale for making many suggestions that improved this manuscript, Robert Bryson-Richardson for assistance with confocal microscopy and the facilities, scientific and technical assistance of Monash Micro Imaging, Monash University, Victoria, Australia. This work was supported by the National Health and Medical Research Council [436620]; and RD Wright Fellowship (NHMRC) to JAB.
The Supplementary Material for this article can be found online at http://www.frontiersin.org/neuroanatomy/paper/10.3389/neuro.05/008.2010/
Bourne, J. A., Warner, C. E., Upton, D. J., and Rosa, M. G. P. (2007). Chemoarchitecture of the middle temporal visual area in the marmoset monkey (Callithrix jacchus): laminar distribution of calcium-binding proteins (calbindin, parvalbumin) and nonphosphorylated neurofilament. J. Comp. Neurol. 500, 832–849.
Rosa, M. G. P., and Elston, G. N. (1998). Visuotopic organisation and neuronal response selectivity for direction of motion in visual areas of the caudal temporal lobe of the marmoset monkey (Callithrix jacchus): middle temporal area, middle temporal crescent, and surrounding cortex. J. Comp. Neurol. 393, 505–527.
Wouterlood, F. G., van Haeften, T., Blijleven, N., Pérez-Templado, P., and Pérez-Templado, H. (2002a). Double-label confocal laser-scanning microscopy, image restoration, and real-time three-dimensional reconstruction to study axons in the central nervous system and their contacts with target neurons. Appl. Immunohistochem. Mol. Morphol. 10, 85–95.