A rapid and reliable method of counting neurons and other cells in brain tissue: a comparison of flow cytometry and manual counting methods
1
Department of Psychology, Vanderbilt University School of Medicine, Nashville, TN, USA
2
Flow Cytometry Shared Resource, Vanderbilt University Medical Center, Nashville, TN, USA
3
Department of Pharmacology, Vanderbilt University Medical Center, Nashville, TN, USA
It is of critical importance to understand the numbers and distributions of neurons and non-neurons in the cerebral cortex because cell numbers are reduced with normal aging and by diseases of the CNS. The isotropic fractionator method provides a faster way of estimating numbers of total cells and neurons in whole brains and dissected brain parts. Several comparative studies have illustrated the accuracy and utility of the isotropic fractionator method, yet it is a relatively new methodology, and there is opportunity to adjust procedures to optimize its efficiency and minimize error. In the present study, we use 142 samples from a dissected baboon cortical hemisphere to evaluate if isotropic fractionator counts using a Neubauer counting chamber and fluorescence microscopy could be accurately reproduced using flow cytometry methods. We find greater repeatability in flow cytometry counts, and no evidence of constant or proportional bias when comparing microscopy to flow cytometry counts. We conclude that cell number estimation using a flow cytometer is more efficient and more precise than comparable counts using a Neubauer chamber on a fluorescence microscope. This method for higher throughput, precise estimation of cell numbers has the potential to rapidly advance research in post-mortem human brains and vastly improve our understanding of cortical and subcortical structures in normal, injured, aged, and diseased brains.
In the cerebral cortex changes in numbers of neurons accompany normal aging as well as a variety of neurological disorders including Alzheimer’s disease and Parkinson’s disease and developmental disorders such as autism. Therefore, it is of critical importance to understand the numbers and distributions of neurons and non-neurons in the cerebral cortex. Until recently, methods for counting cells have been tailored toward evaluating cell numbers on a small scale in well-defined structures in the brain. With the recent development of the isotropic fractionator method (Herculano-Houzel and Lent, 2005
), it has become possible to accurately and rapidly evaluate a larger number of samples from a wider variety of structures, provided they are accurately dissectable.
The isotropic fractionator method (Herculano-Houzel and Lent, 2005
) provides a faster way of estimating numbers of total cells and neurons of whole brains and dissected brain parts. The isotropic fractionator is based on the stereological optical fractionator method, which attempts to apply stereological counting to heterogeneous brain structures by subdividing the structure into smaller, more homogeneous components. The isotropic fractionator circumvents the complexity of summing multiple, small, more uniform samples of brain structures by converting any heterogeneous structure into a homogeneous one by completely dissociating the cells into a uniform nuclear suspension. The suspension is subsequently stained to allow for counts of total cell and neuron number under fluorescence microscopy using a precision glass Neubauer counting chamber and matched coverslip. The isotropic fractionator is not a replacement method for the versatile toolbox of stereological approaches than can be used to quantify number, size, shape, or volume in sectioned and stained tissue (e.g. Schmitz and Hof, 2005
), but rather is a viable alternative approach allowing the rapid and accurate estimation of cell numbers. We have been using the isotropic fractionator to count neurons and other cells in brain tissue in a number of comparative studies in which the focus is on species differences in numbers of cells (e.g. Herculano-Houzel et al., 2007
, 2008
). While most of these studies are still ongoing, progress is rapid. The speed and practicality of the isotropic fractionator make our studies achievable in a relatively short span of time.
Despite the established utility and future promise of the isotropic fractionator method for cell counts in vertebrate brain material, it is a relatively new methodology, and there is opportunity to adjust procedures to optimize its efficiency and minimize error. Two main areas for improvement can be considered. First, new nuclear markers for neuronal and glial subtypes need to be explored to increase the ability to quantify specific classes of neurons and non-neurons. These experiments are ongoing and we do not consider this issue further here. Second, counts made on dissociated cell nuclei using the isotropic fractionator method could be automated to make the data collection process more high-throughput without sacrificing accuracy. In the present study, we evaluate if isotropic fractionator neuron counts using the Neubauer counting chamber and fluorescence microscopy can be accurately reproduced using flow cytometry methods. Flow cytometry has traditionally been used in diagnostic settings to evaluate cellular components of blood or other tissue samples. In other fields of neuroscience research, flow cytometry has primarily been used on dissociated neurons from cell cultures. Here, we have optimized the dissociation and processing steps to produce suspensions of cell nuclei from fixed brain tissue. From these main suspension volumes, sub-samples have been evaluated to determine the percentage of neurons in the suspension using the isotropic fractionator method and fluorescence microscopy as previously described, and flow cytometry methods as detailed below.
The brain of a Yellow baboon (Papio cynocephalus anubis) was obtained from the tissue distribution program at the University of Washington National Primate Research Center
1
. The baboon was a 12.6-year-old adult female weighing 17.8 kg. Lifespan in female yellow baboon ranges from 14 to as high as 27 years in the wild (Rhine et al., 2000
). The brain was perfused with 0.9% phosphate buffered saline (PBS) and shipped overnight in the same solution. Upon arrival, the brain was weighed (173.4 g) and the right cortical hemisphere was separated from subcortical structures, the pia was removed, and the sulci were opened to manually flatten the cortex. A photograph was taken of the flattened cortex and the identifiable cortical areas were drawn onto the photograph. The hemisphere was then dissected into 268 pieces that were about 5 mm × 5 mm in size. The exact surface area of each piece was measured using NIH Image J
2
. Each piece was weighed and assigned to a cortical area or region. The total cortical surface area comprised approximately 18,577 mm2. Following dissection, flattening, photographing and weighing, each tissue piece was immersion fixed in 4% buffered paraformaldehyde solution for at least 4 weeks. Tissue pieces were processed in pairs or in small groups (2–5), combining pieces located adjacent to one another. As a result of combining tissue pieces, a total of 142 samples were processed for cell counts.
Sample Preparation and Cell Counting
The isotropic fractionator method (Herculano-Houzel and Lent, 2005
) was used to determine numbers of total cells, neurons and non-neurons in each sample. First, tissue pieces were homogenized in a glass Pyrex Tenbroeck tissue grinder (Fisher Scientific) with a dissociation solution of triton X-100 and sodium citrate in distilled water. The resulting suspensions consisted of cellular nuclei, with very few cell membranes remaining intact. Samples were spun down and re-suspended in a mixture of PBS and DAPI (4’,6-diamidino-2-phenylindole). The total suspension volume was diluted based on the sample density, resulting in suspension volumes between 3 ml and 15 ml. DAPI binds strongly to DNA, thus labeling all of the nuclei in the suspension, regardless of the cell type. DAPI fluoresces bright blue with ultraviolet excitation (∼460-nm emission), allowing estimates of total nuclei from counts on a Neubauer counting chamber using a fluorescence microscope. After the total cell count was obtained on a fluorescence microscope, a sub-sample of the main sample suspension was stained for neuronal nuclei using immunocytochemical techniques with the anti-NeuN antibody (Millipore, Inc.) to determine the percentage of the total nuclei that are NeuN positive, i.e. the proportion of nuclei in the suspension that are from neurons. If the tissue sample had been sitting in a fixative solution for more than 1 month, an epitope retrieval step was added prior to processing for immunocytochemistry. All samples in the present experiment were immersion fixed for at least 4 weeks, so all went through epitope retrieval, which consisted of 30–60 min in 0.2 M boric acid solution in an oven set at 70°C. After epitope retrieval, samples were washed once with PBS, and then re-suspended in PBS with primary antibody against NeuN added.
Determination of the Neuronal Fraction
Method 1: Neubauer chamber counts
Alexa Fluor 594 (AF594) goat anti-mouse IgG secondary antibody (Invitrogen, Inc.) was used to fluorescently tag NeuN labeled nuclei for counting on the fluorescence microscope. The microscopist that counted the NeuN + nuclei was blind to the position of the sample in the cortex and also did not have access to the flow cytometry data. The same microscopist did all of the microscope counts to avoid inter-counter variation. First, DAPI+ nuclei were identified, and then each nucleus was checked for NeuN/AF594 label. For each sample, a minimum of 500 DAPI-positive nuclei were assessed for labeling with anti-NeuN/AF594. The proportion of AF594+ cells was determined for all 142 samples. Some samples were counted several times to assess the reliability of counts taken from the same sub-sample and different sub-samples, and any variation associated with loading the Neubauer chamber. Several samples were evaluated multiple times from different sub-samples from the same main suspension to assess experimenter error in sampling from the main suspension. All suspensions were well vortexed prior to sampling.
Method 2: flow cytometry
For flow cytometry, we used a different Alexa Fluor secondary antibody that was ideally tuned to the 635-nm HeNe laser on the flow cytometer. Alexa Fluor 700 (AF700) goat anti-mouse IgG secondary antibody (Invitrogen, Inc.) was used to estimate the proportion of NeuN + nuclei to the total population of DAPI + nuclei on the flow cytometer. To quantify the neuron population, we used a Becton Dickinson (BD) 5-laser LSRII flow cytometer equipped with 355 nm, 405 nm, 488 nm, 532 nm and 635 nm lasers. The Alexa Fluor 700 secondary antibody is excited by the 635-nm laser and its emission is captured using a 680-nm dichroic long pass (DCLP) mirror and a 720/20 bandpass (BP) filter. For all samples at least 5000–10,000 total DAPI+ cells were evaluated for AF700+ label. Flow cytometry experiments were conducted in the Vanderbilt University Medical Center Flow Cytometry core.
Samples run on the flow cytometer were forced through a 35 μm mesh filter beforehand to remove any debris in the sample. In some cases samples were forced through a 20-μm filter and a 35-μm filter or sequentially through two different 35-μm filters, to assess the effects, if any, of filtering on the AF700+ estimate. All samples were vortexed prior to running on the LSRII, and samples 1–32 were evaluated two times to assess reliability between measures within a single sample. To assess the inter-sample variability introduced by sampling procedures when removing a sub-sample from the main suspension for immunocytochemistry, 12 other samples were evaluated multiple times using a different sub-sample from the main suspension each time. For example, sub-samples of sample number 100 were evaluated on eight separate occasions and run through immunocytochemical procedures, filtered and evaluated for NeuN/AF700+ label on the flow cytometer. These measures also provide an estimate of how the AF700+ ratio may be affected by the many steps in processing for immunocytochemistry.
Distributions of the forward light scatter and side light scatter produced by each nucleus as it passes through the 488 Argon laser, were used to place a selection gate around the neuronal nuclei for quantification. Because the forward and side scatter attributes are associated with nuclei size and internal complexity, gates were positioned around the particles of interest on the scatterplot that represented a subset of nuclei approximately 5 μm–15 μm in size. The AF700+ fraction was estimated from the gated population. Every attempt was made to include as many nuclei as possible in the nuclei gate, while avoiding the small (<5 μm-sized) debris in the samples. The flow cytometry expert (DKF) making decisions about gating was blind to the sample attributes and to the data collected on the microscope (For additional details about gating procedures, see Supplementary Material).
Myelin Removal
Because of the considerable amount of small debris in many of the samples, much of which we suspected to be myelin, we attempted to clean the samples using myelin removal beads (Miltenyi Biotec, Inc.), to assess the positions of our gates on the scatterplots and to determine the effect of the debris on our estimates of the neuronal population. Sub-samples of the main suspension were labeled with NeuN/AF700 according to our immunocytochemistry protocol. Before myelin removal, samples were filtered through a 35-μm filter. Samples were spun down and the PBS was removed. Samples were re-suspended in PBS with EDTA and BSA (running buffer, Miltenyi Biotec, Inc.). Approximately 17 μl of myelin beads were added to each sample, followed by a 15–min incubation on a shaker at 20°C. Samples were spun down and washed with a large volume of the running buffer, then re-suspended to their original volume in the same buffer. Samples were then run on an Automacs Magnetic Cell Sorter in the Vanderbilt Flow Cytometry Core. The myelin depleted samples were then run on the BD 5-laser LSR II to evaluate the proportion of NeuN/AF700+ nuclei.
Statistical Analyses
We used commonplace statistical tools for comparing methods. For a rapid introduction to the methods of comparison studies, see Magari (2004)
. For a more comprehensive treatment, see Dunn (2004)
.
To estimate the variance components from repeated counts on the same samples using the same method, we use Stata software (v. 11)
3
and the commands “loneway” and “xtmixed” that allow random effects ANOVA and mixed models respectively. Either command allows estimation of within-sample and between-sample variances when multiple samples are repeatedly measured. The within-sample standard deviation has been called the standard deviation of repeatability. A measure of the relative amounts of the within- and between-sample variances is the intraclass correlation that varies between 0 and 1. The intraclass correlation quantifies similarity (resemblance, repeatability) of grouped measures, where ICC = 1 reflects identical measures within a group.
To assess the correspondence between two methods measuring the same samples, we used the Stata software commands “regress” and “concord”. “Regress” is the Stata command for linear regression. “Concord” is a user-written command that computes Lin’s concordance correlation (CC) (Lin, 1989
, 2000
) as well as the limits of agreement (LOA) for a Bland-Altman plot (Bland and Altman, 1986
). When comparing methods, Lin’s CC is preferred over the standard Pearson correlation coefficient because a Pearson correlation will give a perfect correlation to methods that differ dramatically by a constant bias whereas the condordance correlation takes constant bias into account.
In addition to statistics, we provide graphs for each main point of our comparison. For repeated measures on the same samples, the variance components and intraclass correlations are easily visualized using index or dot plots. To see correspondence between methods, a scatterplot and a Bland-Altman plot clearly illustrate spread across the observed range and any bias between methods.
We estimated numbers of neurons and non-neurons across the cortical sheet in a baboon cortical hemisphere using the isotropic fractionator method combined with flow cytometry (flow fractionator), and compared those results with the isotropic fractionator method and microscope counts using a Neubauer chamber. The flow fractionator method resulted in repeatable neuronal fraction estimates that were in close agreement with data collected on the microscope. The average absolute percent difference between the flow cytometry counts of the NeuN+ cell fraction and the counts on the microscope using a Neubauer chamber was 5.3% (Range = 0.0–14.7%).
We sought to identify potential sources of error related to our sample preparation that may contribute to the variance of counts between repetitions within a method and also may produce differences in counts between the two methods. In our evaluations, no significant sources of error were identified. We expect error produced by processing, if any, to be the same or very similar between microscope-counted samples and flow cytometry-counted samples because all samples were treated identically, with the exception of using a goat anti-mouse secondary antibody tagged with a different Alexa Fluor color [AF 594 (microscope) vs. AF 700 (flow cytometer)]. We tested the effect of myelin removal on the AF700+ neuronal fraction for the flow cytometry counts. The reduction in the amount of sample debris was striking (Figure 1 in Supplementary Material), but the estimate of the AF700+ population was unchanged (78.3% neurons vs. 77.9% neurons) (Figure 1 in Supplementary Material). The position and size of the flow cytometry (P1) gate was adjusted slightly, yet the percent neurons measured remained stable.
Other evaluated sources of error were counting error, and sampling error at the point of removing a sub-sample of suspension from the main sample suspension for anti-NeuN immunocytochemistry. To address these issues, we recounted samples from the same processed sub-samples, and also tested multiple sub-samples from the same main suspensions to assess how much error is introduced when removing a sub-sample of suspension from a well-mixed main suspension.
Repeated Measures for Neubauer Chamber Counts on the Microscope
A single expert human performed repeated counts on replicate processed NeuN stained suspensions using a Neubauer counting chamber with a fluorescence microscope to determine the percent neuronal fraction. Thirty-two samples were counted at least twice (mean 2.2 counts, range 2–4, 92 total observations). Figure 1
A plots the neuronal percentages on the Y-axis against sample number on the X-axis, showing the recount spread for each sample. Samples have been ordered on the X-axis by sample means. A random effects linear model showed that the counts captured significant variation between samples [F(30,32) = 11.92, p < 0.0001]. The standard deviation of repeatability of replicate counts within samples was 6.11 (CI 4.78, 7.80). The standard deviation between samples was 14.09 (CI 10.68, 18.60). The intraclass correlation, which reflects the consistency between measures, was 0.84 (CI 0.74, 0.94).
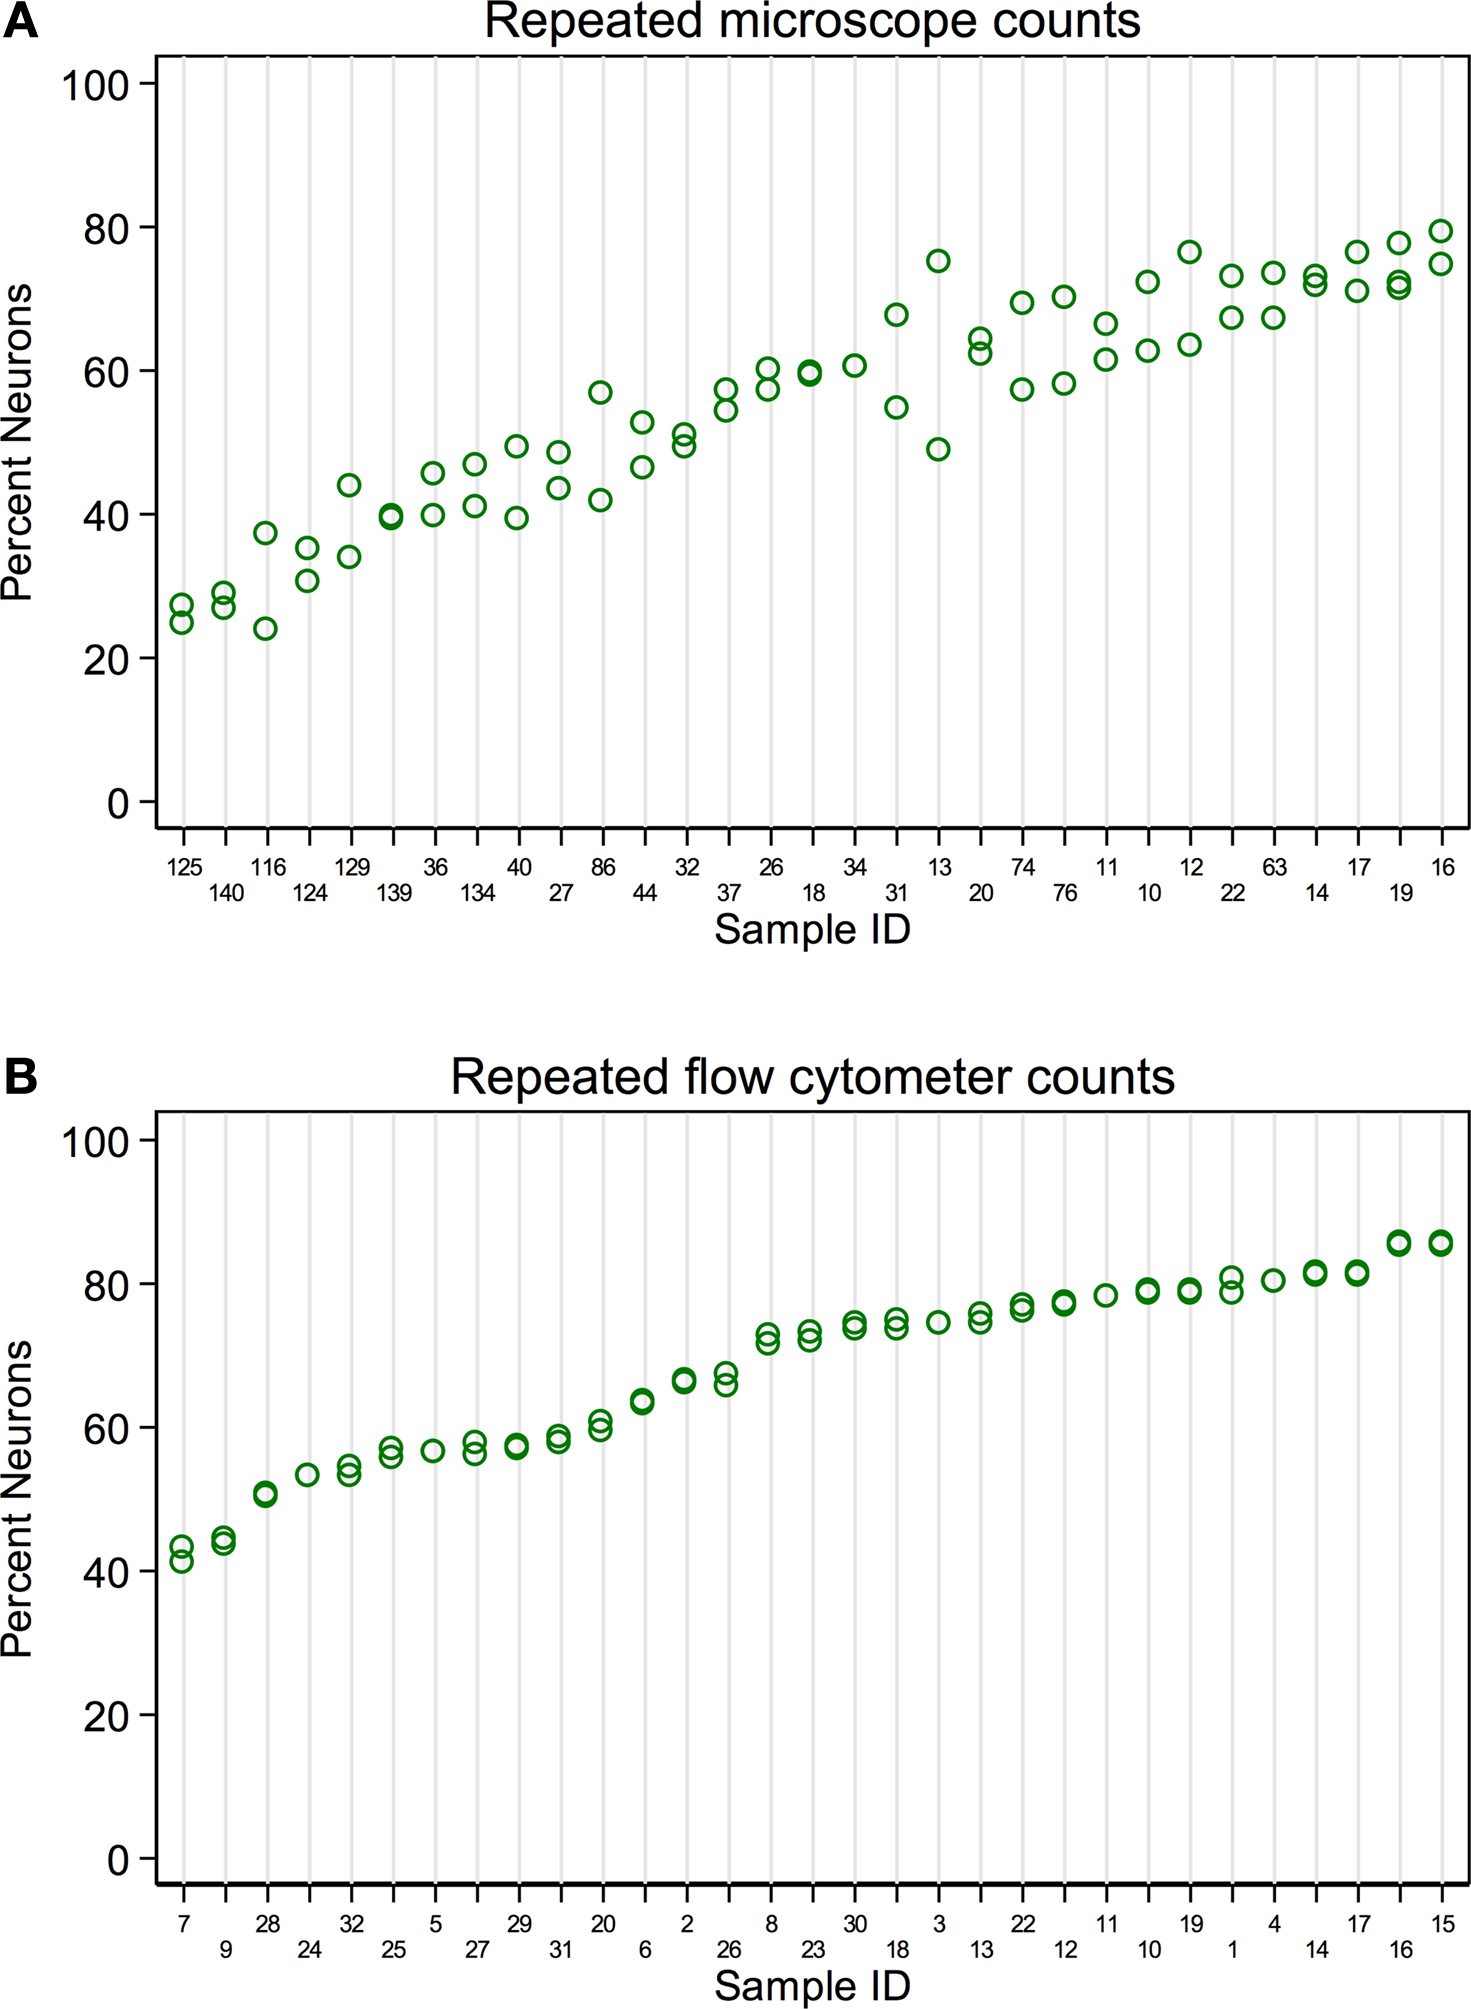
Figure 1. Comparison of repeatability measures from the two different counting methods. (A) Microscope repeatability index plot. An index plot is shown, illustrating repeated counts on a fluorescence microscope by a single human expert. The samples are ordered along the x-axis by ascending sample means. Each plot point is one count. Replicate counts are measures from the same sub-sample, thus each replicate count isolates the measurement error introduced at counting from any error that may be introduced in processing, but not staining. Thirty-one samples were counted, each at least 2 times (mean 2.2, range 2–4, 92 total observations). A random effects linear model estimated the standard deviation of repeatability as 6.11 (CI 4.78, 7.80). The standard deviation between samples was 14.09 (CI 10.68, 18.60). The intraclass correlation was 0.84 (CI 0.74, 0.94). (B) Flow cytometer repeatability index plot. The corresponding index plot for repeated counts by a flow cytometer is illustrated. Each replicate includes counting error only. Thirty-one samples were counted each two times (62 total observations). The standard deviation of repeatability was estimated, by a random effects linear model, to be 0.65 (CI 0.50, 0.83). The standard deviation between samples was 12.38 (CI 9.61, 15.95). The intraclass correlation was 0.99 (CI 0.995, 0.999).
Repeated Measures for Flow Fractionator Counts
A flow cytometer was also used to perform repeated counts on a different set of replicate processed NeuN stained suspensions to determine the percent neuronal fraction. Thirty-one samples were each counted twice (62 total observations). Figure 1
B illustrates the consistency of the data for repeats processed on the flow cytometer. A random effects linear model showed significant variation between samples [F(30,31) = 736.53, p < 0.0001)]. The standard deviation of repeatability was 0.65 (CI 0.50, 0.83) and the standard deviation between samples was 12.38 (CI 9.61, 15.95). The intraclass correlation was 0.99 (CI 0.995, 0.999). One of our samples, number 100, was evaluated 8 times on the flow cytometer using 8 independent sub-samples from the main sample suspension. Each time the sample was processed for anti-NeuN immunocytochemistry and run on the flow cytometer to assess possible measurement differences in AF700+ cells. All samples were also filtered through either a 20-μm mesh filter and a 35-μm mesh filter, two different 35-μm mesh filters or a single 35-μm mesh filter prior to flow cytometry. The range of values for 8 measures of sample 100 were 30.60% to 33.20% AF700+, with a mean of 31.6% ± 0.0082 (mean ± SD). Variance between different sub-samples from the same main suspension was. 007% for flow cytometry measures. No variation was introduced by filtering procedures.
Comparison between Repeatability Counts
Although both microscope- and flow cytometer-based neuronal fraction counts captured a significant and roughly equivalent amount of variation between samples (microscope SD of 14.09 versus flow cytometer SD of 12.38), the lower variation between replicate counts from the same samples is clearly visible when comparing Figures 1
A,B (microscope SD of 6.11 vs flow cytometer SD of 0.65). The standard deviation of repeated counts by the flow cytometer is more than 10 times less than the standard deviation of repeated counts by a human expert using a microscope (6.11 vs. 0.65). This difference in repeatability arises from the different neuron counting procedures, and not by procedures at earlier stages of the protocols, which were the same. Figure 1
shows the repeatability of recounts on the same NeuN stained sub-sample. This isolates the error associated with the counting procedures following staining for NeuN.
We also investigated the combined errors from staining and counting procedures using replicate sub-samples from the same dissociated main suspension (data not shown). The results were very similar to those in Figure 1
, with measures of consistency between replicate counts within each method reported as intraclass correlations of 0.99 for flow cytometer counts and 0.57 for microscope counts. The difference in repeatability between counting methods is not due to the different NeuN staining protocols used for each counting method, and appears to occur after staining. Candidate sources for the differences in error include (1) evaluating a total of 500–600 DAPI+ nuclei by microscope versus 5,000–10,000 by flow cytometer; (2) Neubauer counting chamber use versus flow cytometer technology; and (3) human neuron judgment error versus flow cytometer neuron specification error and the higher sensitivity of the flow cytometer in detecting NeuN labeled nuclei compared to a human observer on the microscope.
Methods Comparison
To directly compare the microscope and flow cytometer methods of estimating the neuronal fraction, we used both approaches on 142 brain samples. Summary statistics for each assay method are comparable and show a range in percent neuronal fraction of approximately 20–80% (Table 1
).
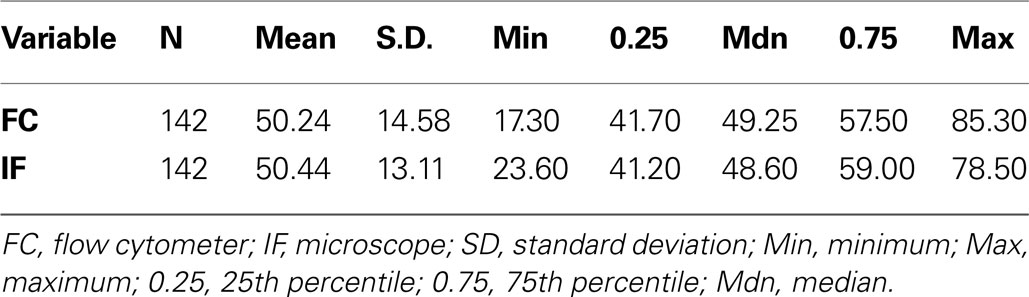
Table 1. Summary statistics for neuronal percent measures from flow cytometry and manual microscope counts.
Figures 2 and 3
are traditional methods comparison plots. In Figure 2
, counts using the newer approach (flow cytometer) are plotted on the Y-axis, and counts using the established isotropic fractionator approach (microscope) are plotted on the X-axis. If the methods were in complete agreement (100% concordant), the counts would lie along the line of perfect concordance Y = X (shown in black in Figure 2
). The observed data form a fairly homoscedastic point cloud across the data range, with the exception of the highest neuronal percentages. The fit of the data by linear regression (in red) closely follows the line of concordance, with very little constant or proportional bias. Constant bias would have been indicated by constant distance between the two lines. Proportional bias would have been indicated by the regression line having a different slope than that of the concordance line. The linear regression line of the data was Y = 0.965 × X + 1.57. The 95% CI for the slope is from 0.873 to 1.057, inclusive of the slope of the line of concordance (=1). Another statistic commonly used for methods comparison is the Lin CC. The CC is preferable to the standard Pearson correlation when methods are compared because it is not just a measure of the distribution of data points around a straight line, but also a measure of the distance of each of those points from the line of concordance (Y = X). For the data in Figure 2
, the CC is 0.86 (CI 0.82, 0.90).
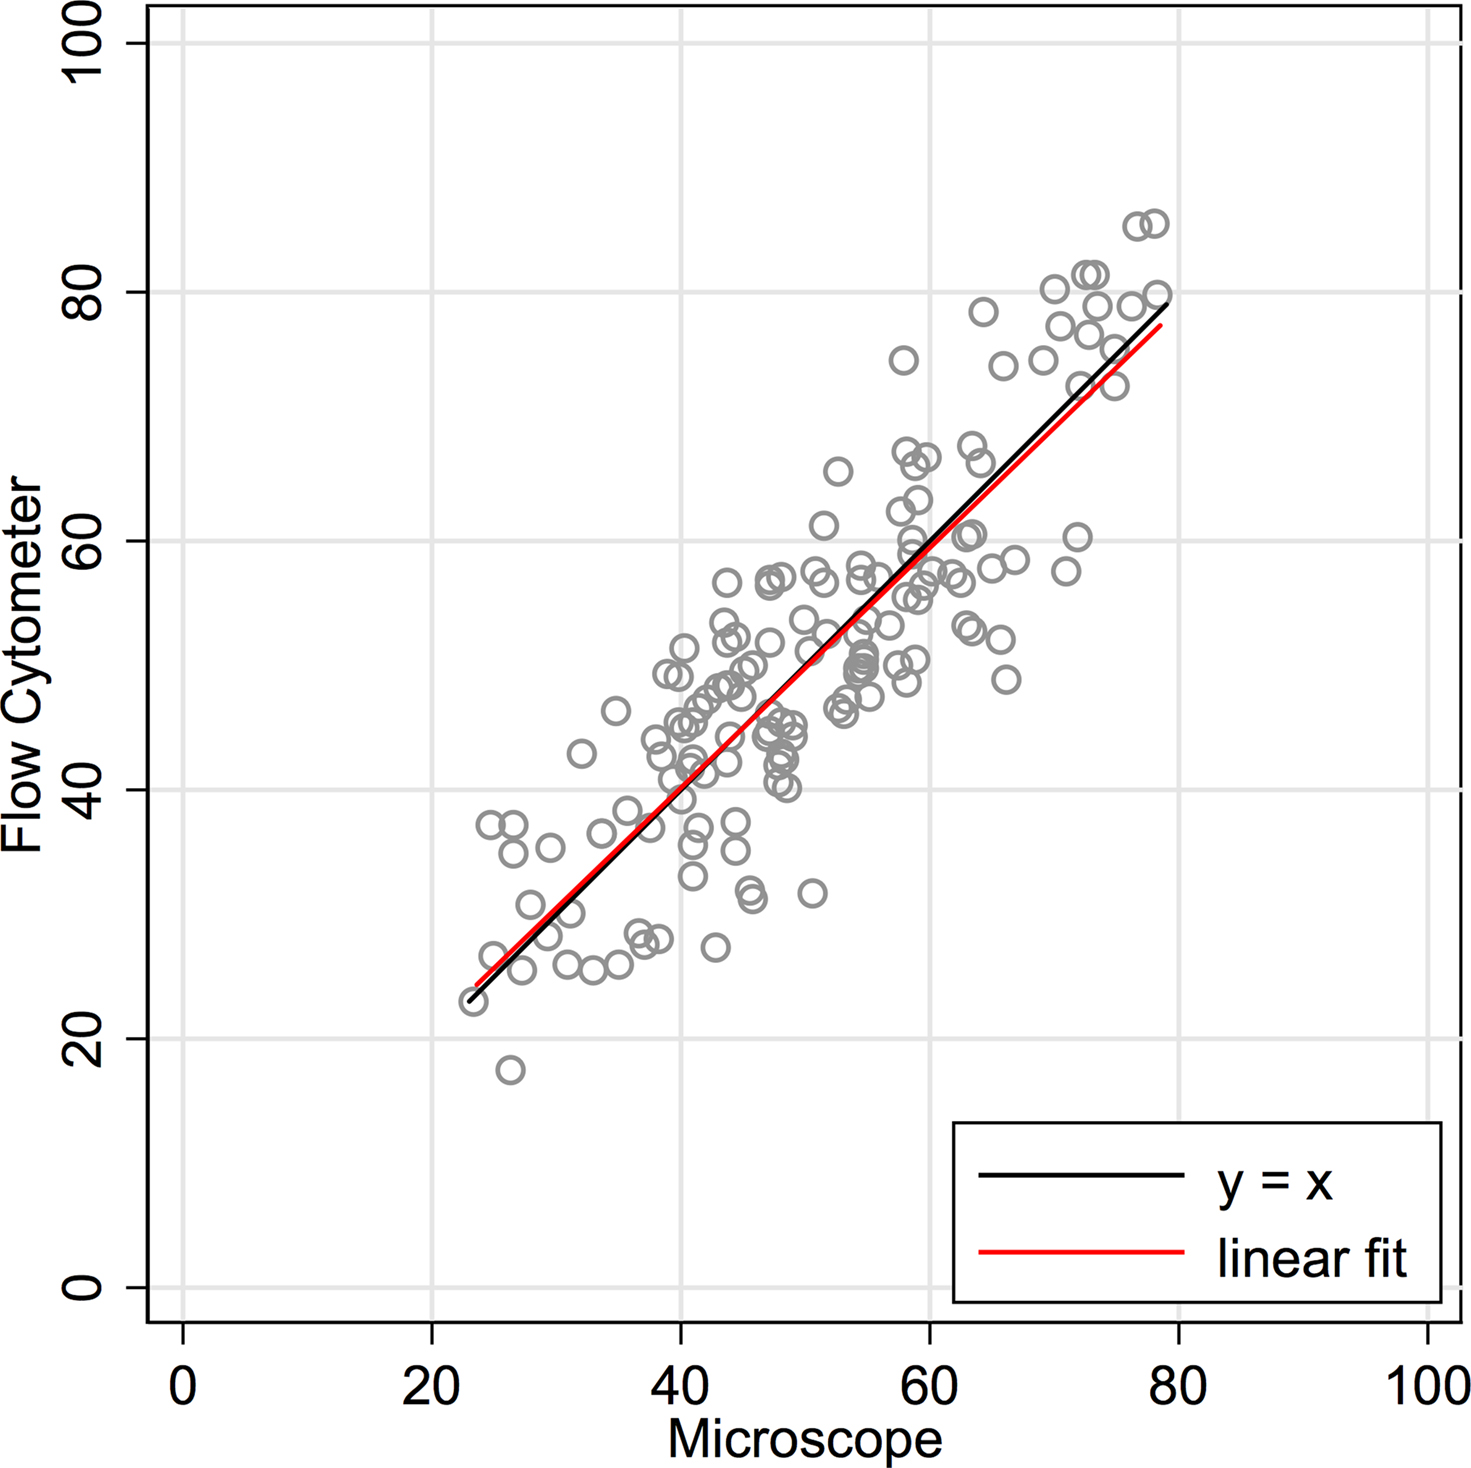
Figure 2. Concordance scatter plot of machine flow cytometer neuron percent counts (Y-axis, “Flow”) against microscope counts by a human (X-axis, “Scope”) for the same 142 brain samples. Two lines are overlayed on the plot. The black line is the line of perfect concordance, Y = 1 × X + 0, or Y = X. The red line is the linear regression line, Y = 0.965 × X + 1.57. The 95% CI for the slope is from 0.873 to 1.057. The Lin concordance correlation is 0.86 (CI 0.82, 0.90).
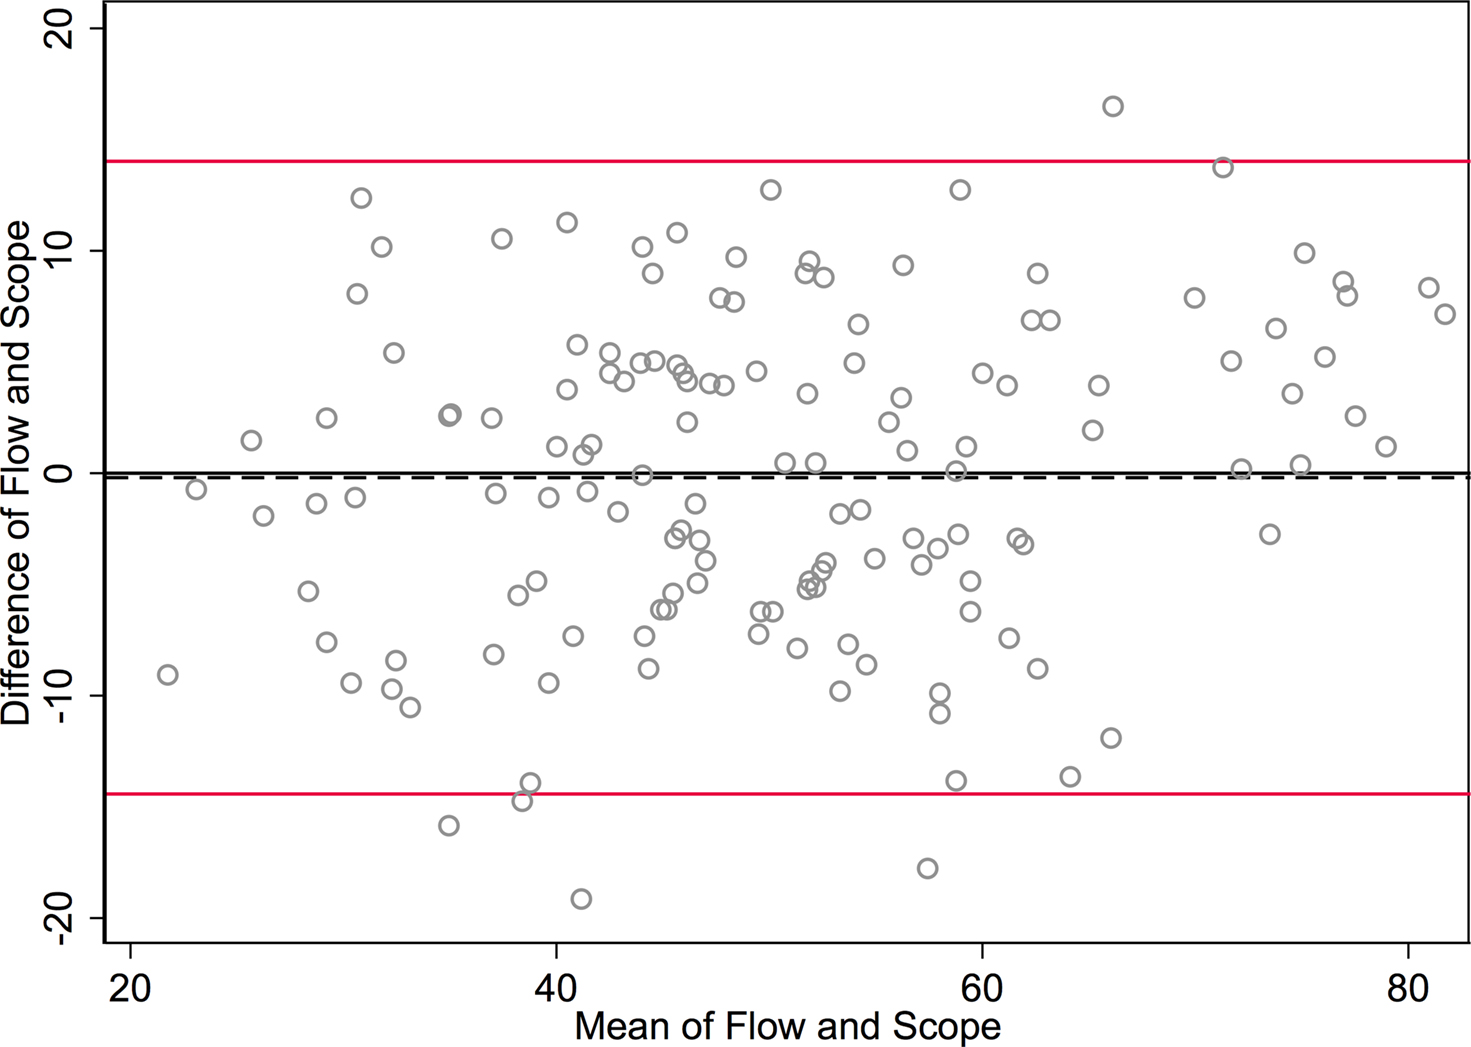
Figure 3. Bland-Altman plot graphs the difference of the two methods’ measurements against their means. The 95% limits of agreement (LOA) are shown (red lines) at −14.422 and 14.024. The line of perfect agreement at 0 is also shown (solid black line) along with the average of the observed differences (=average bias) at −0.199 (dashed black line).
In Figure 3
, the differences between methods for each sample are plotted against the mean of the counts for each sample. This is sometimes called a Bland-Altman plot (Bland and Altman, 1986
).
The SD of the differences is used to calculate 95% LOA. These limits are shown in red lines in Figure 3
at (−14.4 and 14.0). Just 5/142 (3.5%) of the observations exceed the LOAs, and the variation was fairly uniform across the data range, without any large change in differences as means increased. An exception is observed at the highest neuronal percentages, where machine flow cytometer measures give higher neuronal percentages than human counts by microscope. The line of average perfect agreement at 0 is also shown in Figure 3
(solid black line) along with the average of the observed differences (the average bias) at −0.20 (dashed black line).
Here we have demonstrated the comparability of manual versus machine counting methods using a Neubauer chamber and flow cytometry to quantify the proportion of neuronal nuclei contained in 142 suspensions of cellular nuclei produced from the baboon cortex. Our results indicate no significant bias between the two methods (see Figures 2 and 3
). Manual counts are not typically higher or lower than machine counts. However there is a clear improvement in precision when using flow cytometry. Thus, machine counts produce faster, more consistent results.
Practical differences in the application of the two methods are likely to increase the variance of measures conducted on the microscope. Aside from human errors in judgment when counting cells, measurement bias was reduced as much as possible by ensuring the microscope counts were done blind to the location of the tissue sample in the cortex, and blind to the flow cytometry data. Also, the numbers of DAPI + nuclei evaluated were at least ten times greater on the flow cytometer than on the microscope (Microscope counts evaluate 500–600 nuclei for NeuN label; Flow Cytometer counts evaluate 5000–10000 nuclei for NeuN label), increasing the precision of the flow cytometer measurements. The higher percentages of neurons measured by the flow cytometer in the highest density samples is likely to be due to practical methodological differences. Whereas the human expert using the microscope has to discern the proportion of AF 594-labeled nuclei on a slide preparation where a higher density of labeled nuclei may obscure some nuclei and contribute error, resulting in lower overall percentages in the highest density samples, the machine counting procedure is equally efficient in a sparse and a dense sample. At the highest neuronal densities, the flow cytometer is more likely than the human observer to detect the most dimly labeled nuclei. Because of the sensitivity of the flow cytometer it was necessary for us to reduce the concentration of our secondary antibody in solution almost four fold.
In general, we have found the isotropic fractionator method, combined with microscope counting using a Neubauer chamber, to be an accurate method for estimating cell and neuron numbers when compared to similar estimates determined using other methodologies. Our present dataset, when neuron numbers from all 142 samples are summed, estimates 2.4 billion neurons in a single cortical hemisphere from an adult female baboon. This estimate is in line with published estimates from a prior investigation, reporting 2.90 and 2.84 billion neurons in one young female and one young male baboon cortical hemisphere, respectively (Herculano-Houzel et al., 2008
). Our additional (unpublished) data collected from Rhesus macaque monkey cortex estimates total neurons in the cortex to be 1.36 × 10⁹, and replicates cortical neuron number estimates from the stereological optical fractionator method, 1.35 × 10⁹ (Christensen et al., 2007
). Also, numbers of neurons in the mouse cerebellum reported using the isotropic fractionator (Surchev et al., 2007
) do not differ from neuron number estimates using the isotropic fractionator in other laboratories (Herculano-Houzel and Lent, 2005
). Hence, the isotropic fractionator method appears to produce accurate estimates of neuron numbers when compared to estimates from other methods, or when comparing estimates using the same methodology across laboratories. When combined with flow cytometry, the isotropic fractionator provides a means to obtain accurate estimates of cell and neuron numbers much more rapidly.
The authors declare that the research was conducted in the absence of any commercial or financial relationships that could be construed as a potential conflict of interest.
This work was supported by a grant from the Mathers Foundation to Jon H. Kaas. Flow Cytometry experiments were performed in the VMC Flow Cytometry Shared Resource. The VMC Flow Cytometry Shared Resource is supported by the Vanderbilt Ingram Cancer Center (P30 CA68485) and the Vanderbilt Digestive Disease Research Center (DK058404).
The Supplementary Material for this article can be found online at http://www.frontiersin.org/neuroanatomy/paper/10.3389/neuro.05/005.2010/