Development of micro-electrode array based tests for neurotoxicity: assessment of interlaboratory reproducibility with neuroactive chemicals
- 1 Institute for Health and Consumer Protection, European Commission – Joint Research Centre, Ispra, Italy
- 2 ETT S.r.l., Genoa, Italy
- 3 European Chemical Agency, Helsinki, Finland
- 4 Neurotoxicology Division, U. S. Environmental Protection Agency, Research Triangle Park, NC, USA
- 5 Department of Biological Sciences, Center for Network Neuroscience, University of North Texas, Denton, TX, USA
- 6 Institute of Biological Sciences, University of Rostock, Rostock, Germany
- 7 NeuroProof GbmH, Rostock, Germany
- 8 Department of Experimental Medicine, University of Genoa, Genoa, Italy
- 9 NeuroTech Lab, Italian Institute of Technology, Genoa, Italy
- 10 Department of Biophysical Engineering and Electronics, Neuroengineering and Bio-nano Technology Group, University of Genoa, Genoa, Italy
Neuronal assemblies within the nervous system produce electrical activity that can be recorded in terms of action potential patterns. Such patterns provide a sensitive endpoint to detect effects of a variety of chemical and physical perturbations. They are a function of synaptic changes and do not necessarily involve structural alterations. In vitro neuronal networks (NNs) grown on micro-electrode arrays (MEAs) respond to neuroactive substances as well as the in vivo brain. As such, they constitute a valuable tool for investigating changes in the electrophysiological activity of the neurons in response to chemical exposures. However, the reproducibility of NN responses to chemical exposure has not been systematically documented. To this purpose six independent laboratories (in Europe and in USA) evaluated the response to the same pharmacological compounds (Fluoxetine, Muscimol, and Verapamil) in primary neuronal cultures. Common standardization principles and acceptance criteria for the quality of the cultures have been established to compare the obtained results. These studies involved more than 100 experiments before the final conclusions have been drawn that MEA technology has a potential for standard in vitro neurotoxicity/neuropharmacology evaluation. The obtained results show good intra- and inter-laboratory reproducibility of the responses. The consistent inhibitory effects of the compounds were observed in all the laboratories with the 50% Inhibiting Concentrations (IC50s) ranging from: (mean ± SEM, in μM) 1.53 ± 0.17 to 5.4 ± 0.7 (n = 35) for Fluoxetine, 0.16 ± 0.03 to 0.38 ± 0.16 μM (n = 35) for Muscimol, and 2.68 ± 0.32 to 5.23 ± 1.7 (n = 32) for Verapamil. The outcome of this study indicates that the MEA approach is a robust tool leading to reproducible results. The future direction will be to extend the set of testing compounds and to propose the MEA approach as a standard screen for identification and prioritization of chemicals with neurotoxicity potential.
Introduction
Neuronal activity is the primary functional output of the nervous system and deviations from its physiological level often result in adverse behavioral or physiological function. Neurotoxicity occurs following exposure to a wide variety of xenobiotics that interfere with the function of the nervous system and can be produced by endogenous substances (mainly excitatory neurotransmitters) under a variety of circumstances (Obrenovitch et al., 2000; Vincent and Mulle, 2009). There are numerous mechanisms of action that ultimately result in neurotoxic outcomes. However, compounds are considered to be potentially neurotoxic when they affect a neurospecific endpoint at concentrations that do not affect general viability1 (Costa, 1998).
Detection and characterization of chemical-induced toxic effects in the central and peripheral nervous system represent a major challenge for registration and assessment of chemicals (e.g., REACH directive) for two main reasons: (a) neurotoxic effects can only be identified during in vivo studies for systemic toxicity evaluation, (b) no in vitro methods for evaluating the neurotoxic hazard of a chemical have yet been validated (Bal-Price et al., 2008).
Regulatory testing guidelines for the assessment of neurotoxicity rely exclusively upon in vivo observations (see U.S. EPA Guidelines for Neurotoxicity Risk Assessment: FRL 6011-3 and OECD TG481, TG419, TG424, and TG426). These include a number of behavioral tests, specific neurophysiological measurements and neuropathological examinations. The neurophysiological assessments comprise methods based on the electrophysiological activity of neurons such as somatosensory, visual, and/or auditory evoked potentials and electroencephalograms (EEGs). All of these approaches exploit the fact that neuronal activity is the functional output of the processes in the central and peripheral nervous system. Thus, these measures can provide a sensitive endpoint to detect early effects of chemicals before morphological changes occur (Costa, 1998).
While animal models have been the gold standard in toxicity testing for hazard identification over the last five decades, this approach is costly and time-consuming, and is not practical for hazard identification of thousands of chemicals such as under the REACH directive or in the high production volume program. Thus, alternative approaches to hazard identification are needed that have higher throughput capability and are predictive of in vivo effects (Coecke et al., 2007; Lilienblum et al., 2008).
When neurons are grown in vitro, they retain the basic processes underlying the in vivo physiological behavior. Their electrophysiological activity can be measured by a variety of approaches. Thus, in vitro assessment of neurophysiological function could be used to screen chemicals for potential neuroactivity/neurotoxicity. Furthermore while the seeding during the culture procedure leads to a random distribution of neurons, the connectivity maps derived from cultured neural assemblies are similar to other biological networks and display non-trivial structure in clustering network diameter, and assortative mixing (Bettencourt et al., 2007). One of the most widely utilized approaches, patch-clamp recordings, can provide exquisite mechanistic information about how a chemical interacts with membrane-bound ion channels and membrane reuptake transporters that ultimately control and modulate electrical excitability of neurons. High-throughput platforms for conducting patch-clamp electrophysiology are available, and have been utilized by the pharmaceutical industry for drug development. However, these platforms have some significant drawbacks from the standpoint of toxicity testing; they allow assessment of only one channel type at a time, assess changes only in individual cells rather than interconnected networks, and often require the use of transfected (often non-neuronal) cell types. When screening chemicals for potential neuroactivity, specific targets will not be known a priori, thus it would be impractical to screen multiple ion channel types. Furthermore, assessment of how a chemical affects communication between neurons in a network would identify actions that may be missed using measurements in individual, transfected cells.
Novel methods like electrophysiological recordings from in vitro neuronal networks (NNs) coupled to micro-electrode array (MEA) chips provide a valuable alternative to conventional techniques (Pancrazio et al., 2003; Köhling et al., 2005). The MEA is a planar substrate with an embedded array of microelectrodes that are capable of measuring extracellular electrophysiology (spikes and bursts, i.e., packages of spikes) from electrically active tissues (Thomas et al., 1972; Gross et al., 1977; Pine, 1980; Egert et al., 1998).
Micro-electrode arrays are non-invasive, do not require external manipulations and provide simpler approach and higher content (up to hundreds of recording points) than conventional electrophysiological techniques. Since the 1990s, MEAs have been utilized for monitoring both acute and chronic effects of drugs and toxins (Streit, 1993; Gross et al., 1997; Gramowski et al., 2000; Shafer et al., 2008; Hogberg et al., 2011). In addition, MEA approaches with increasingly higher throughput are becoming available, which will facilitate rapid characterization of chemical actions on electrical activity in NNs. A recent review article by Johnstone et al. (2010) has proposed the MEAs as a high throughput, rapid screening method for toxicity testing.
Although MEAs have been used to study the actions of a variety of pharmacological and toxicological chemicals, to date there have been no multi laboratory studies that have evaluated the potential of this approach for formalized toxicity testing. Toward this goal, the aim of the present project was to verify intra-laboratory reproducibility and assess the interlaboratory variability of in vitro electrophysiology from NNs coupled to MEA-based system as an endpoint for an in vitro neurotoxicity test. Three reference chemicals: Fluoxetine2; Muscimol3; and Verapamil4 were studied in six independent laboratories and the effects of these compounds on eight classical descriptors of neuronal electrophysiology (the number of spikes and bursts, the mean network spike rate and mean burst rate (MBR), the number of spikes in a burst, burst duration, interburst interval, and percent of spikes occurring in a burst) have been assessed. Among these parameters, the mean network spike rate was uniformly among the most sensitive parameters to reflect the neurotoxic effects of the applied test compounds. Thus the within- and inter-laboratory reproducibility, accuracy and robustness of the compounds’ effect on the mean firing rate (MFR) has been assessed. In addition, this study has also identified recommendations on how the test system can be further improved in terms of reliability, reproducibility, and throughput performance.
Materials and Methods
Chemicals
Three chemicals were selected for the project:
1. R-(–)-Fluoxetine hydrochloride (FLU, Sigma Aldrich – F1678), CAS: 114247-09-5. FLU is a serotonin reuptake inhibitor. In both vertebrates and invertebrates, serotonin functions as a neuromodulator to either facilitate or inhibit synaptic activity mediated by neurotransmitters (Fink and Göthert, 2007).
2. Muscimol hydrobromide (MUS, Sigma Aldrich – G019), CAS: 18174-72-6. MUS is a psychoactive alkaloid and it is a selective agonist of the GABAA receptor, thus enhancing the inhibitory neurotransmission and suppressing spontaneous activity. GABAergic agonists, like muscimol, are employed mainly as antiepileptic drugs or in conjunction with antipsychotics (Bartholini, 1985)
3. (±)-Verapamil hydrochloride (VER, Sigma Aldrich – V4629), CAS: 152-11-4. VER is an L-type voltage-dependent calcium channel antagonist. It blocks slow activating calcium channels modulating the neuronal excitability and reducing electrical activity (Rüschenschmidt et al., 2004).
Chemicals were purchased from the same stock from STU – IHCP – JRC and distributed to the other partners. Mention of trade names or commercial products does not constitute endorsement or recommendation for use.
Study Design
Six independent laboratories: HTS lab – Systems Toxicology Unit, Institute for Health and Consumer Protection, Joint Research Centre, Italy (IHCP); Department of Biological Sciences and Center for Network Neuroscience (CNNS), University of North Texas, Denton TX, USA; Neuroproof and Institute of Biological Sciences, University of Rostock, Rostock (UR + NP), Germany; Integrated Systems Toxicology Division., U. S. Environmental Protection Agency (EPA), RTP, NC, USA; NeuroTech Lab – NBT, Italian Institute of Technology (IIT), Genoa, Italy; KBTLab – DIBE and ETT joint lab (KBT), University of Genoa, Genoa, Italy participated in the project. In each laboratory, each chemical was tested at least three times with two different in vitro preparations from different cultures.
During the study each participating laboratory adopted operating procedures and good laboratory practices for cell culture and data processing. A priori defined common acceptance criteria on NN morphology and spontaneous electrophysiology were used to select more than 100 independent experiments (about 700 h of recordings) that were included in the analysis of reproducibility between the laboratories (see Acceptance Criteria).
Each participating laboratory had its own well established cortical neuronal model. Since this was an initial assessment of interlaboratory reproducibility, attempts to standardize preparations were not made. Four different experimental models, namely mouse cortex (E14–17), cryopreserved mouse cortex (E14–15), rat cortex (E16–18), and new born (0–24 h) rat cortex, were used for NN preparation (see Table 1).
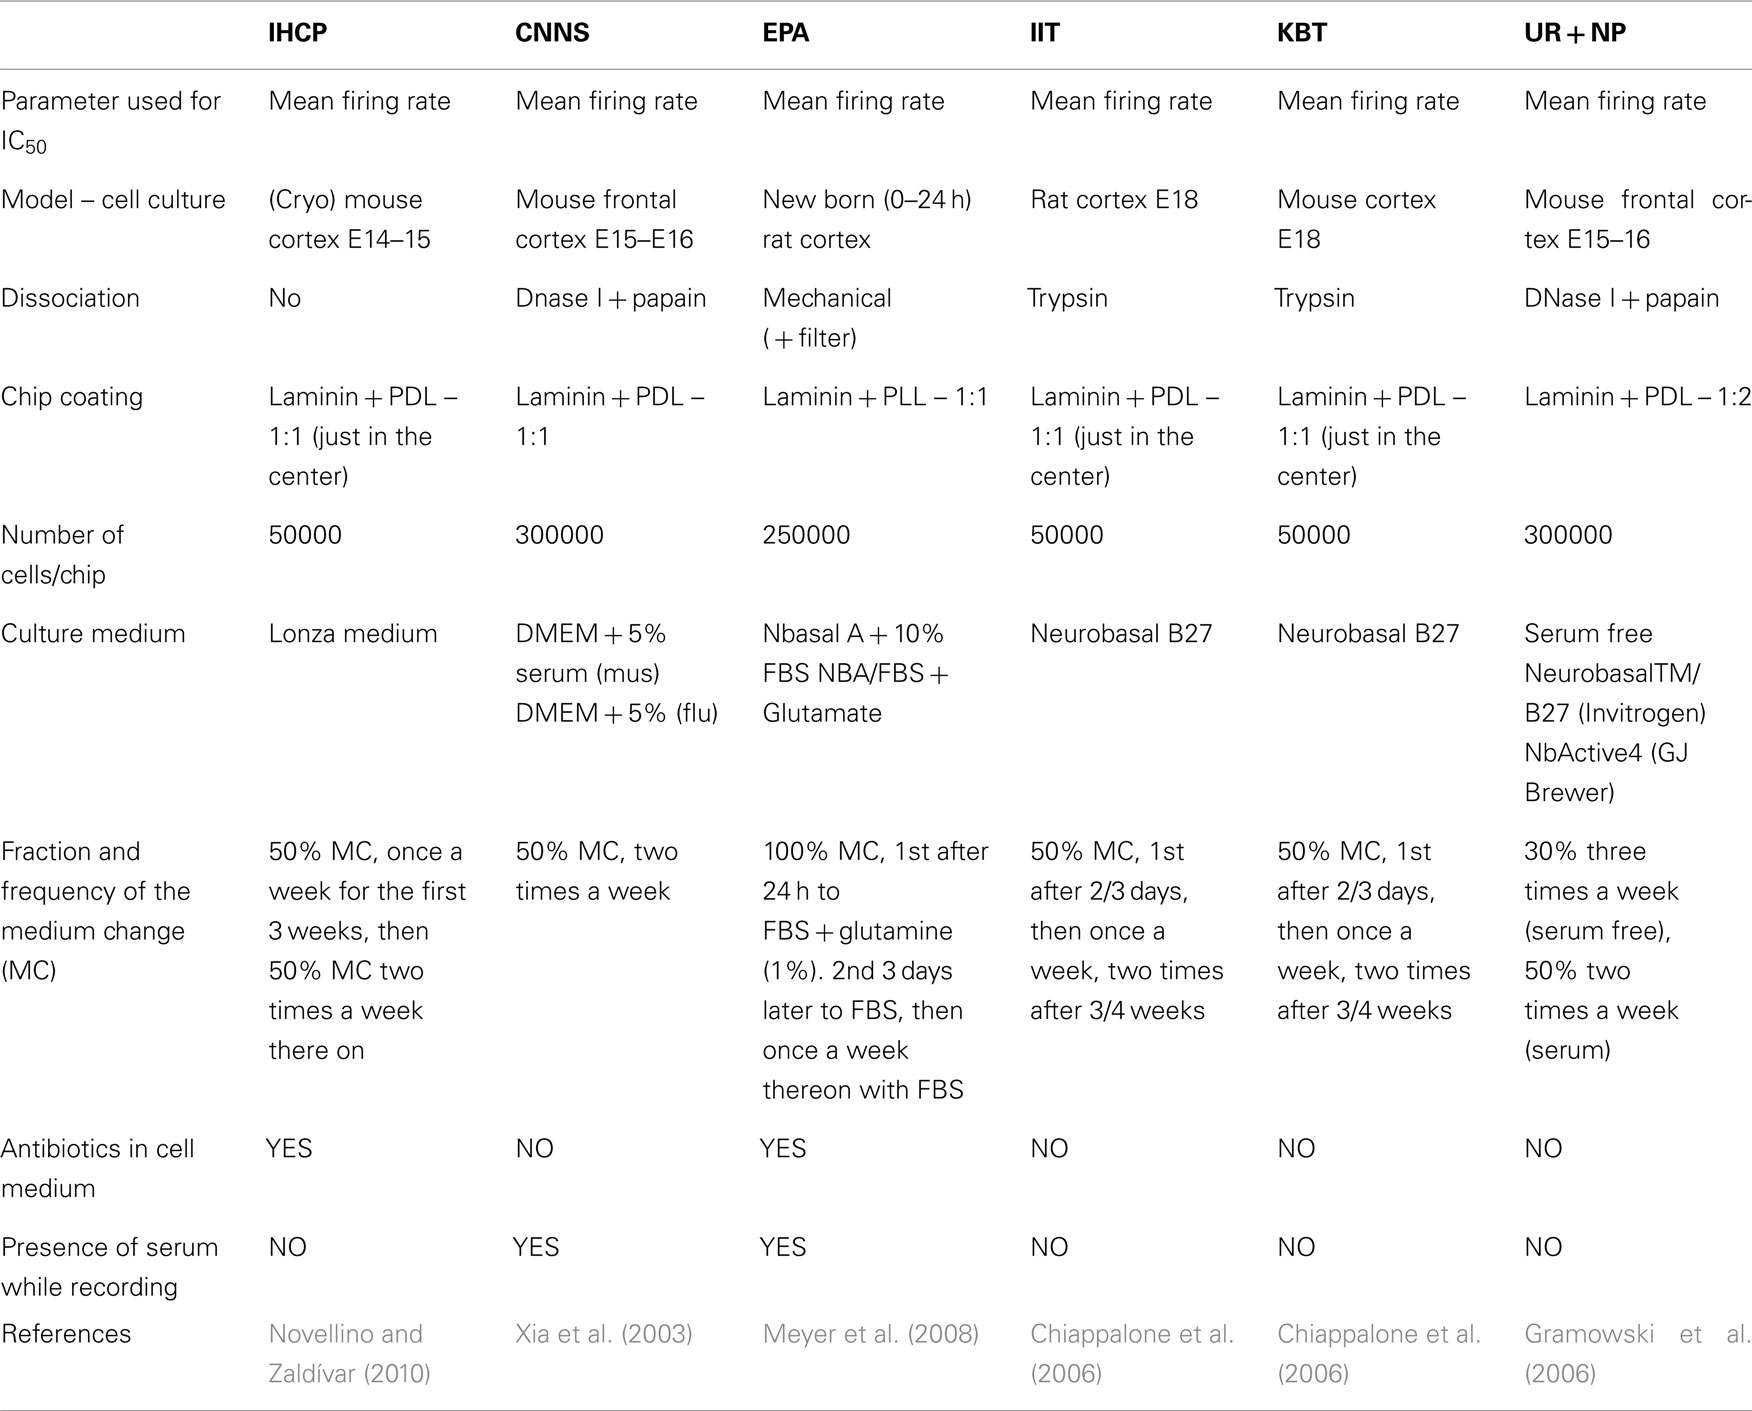
Table 1. Methods for neuronal culture and recordings among different laboratories.
Cell culture
Different cell densities have been used according to each laboratory’s good practice protocols following previously published methods. The number of seeded cells per chip was optimized by each group to reach a final density of 1500–2500 viable cells/mm2. The viability of the cells was assessed with trypan blue test prior to seeding and the appropriate volume of suspension was calculated to cover either the central part of the chip (with a 50-μl droplet) or the whole surface depending on each laboratory protocol (see Table 1). Regardless of the cell source, once extracted the cell suspension was added to the MEA device, medium was added and the MEA chip was kept in a Petri dish (100 mm) and placed in a humidified incubator at 37°C and 5% CO2 or 10% CO2 (depending on the specific laboratory) in order to let the NN reach maturation usually at 3–4 weeks.
Once or twice a week the medium was changed until the beginning of the experiment. Details on this aspect are given in Table 1.
All procedures of the participating laboratories involving animals have been approved by the respective National Committees on animal care and use for scientific research.
Chip handling and preparation
Standard 59–64 electrode MEA chips with 30 μm diameter electrodes, 150–200 μm inter-electrode spacing (Multichannel Systems GmbH, Reutlingen, Germany; Center for Network Neuroscience (CNNS) at the University of North Texas – MEA chip) were employed. The MEA chips contained either an integrated ground electrode, or an additional electrode was connected by the user to the ground signal.
Prior to plating cells, the MEA chip was sterilized by heating for 2 h in oven at 122°C, or autoclaving. Subsequently, to promote adhesion and neurite outgrowth, the chip was coated with Laminin (Sigma L2020) and Poly D-Lysine (PDL, Sigma P6407) or Poly L-Lysine (PLL, Sigma 2636). The order and amount of substrate deposition varied among laboratories (Table 1).
Recording system
The recording system consisted of (a) MEA amplifier, (b) personal computer equipped with A/D acquisition board, (c) recording software, (d) heating system and temperature controller, (e) CO2 atmosphere-maintaining and evaporation-preventing systems. Specific details regarding the MEA-based recording systems, electrophysiological activity sampling frequency, applied filtering and recording software are found in Table 2.
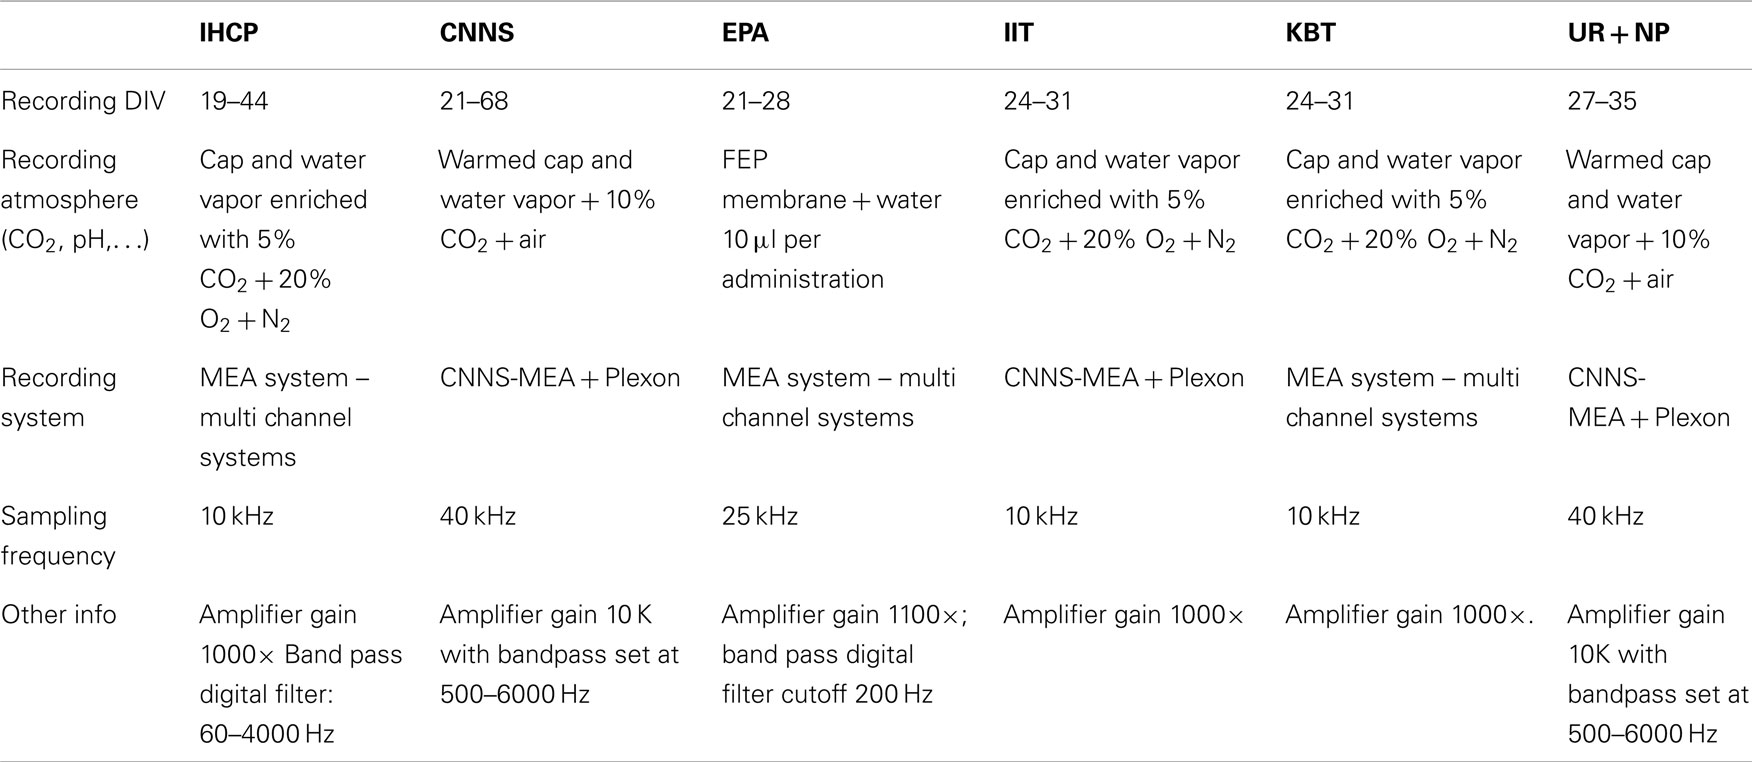
Table 2. Recording conditions across participating laboratories.
Figure 1 shows an example of a NN coupled to the MEA chip and representative electrophysiological signal.
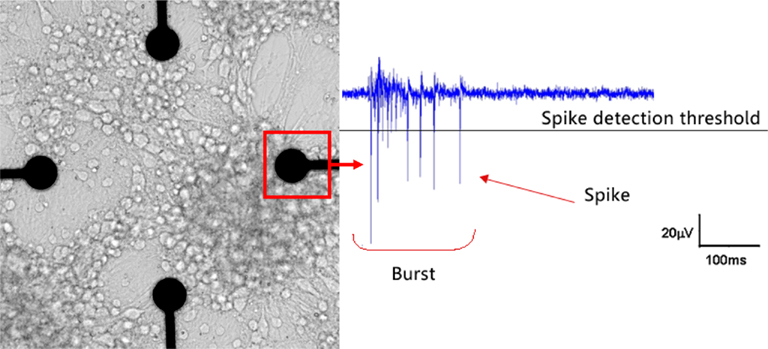
Figure 1. An in vitro neuronal network (NN) at DIV 21 coupled to a microelectrode array (MEA) chip (left) and an example of typical electrophysiological activity (right). This NN randomly self re-assembled from cryopreserved cortical neurons of rat. The microelectrode is 30 mm in diameter and the inter-electrode distance is 200 μm. After few weeks of in vitro culture it is possible to record both spikes and bursts (the culture and the recording are from the ST Unit laboratory at JRC).
Signal Processing
Characterization of neuronal network electrophysiology
Raw electrophysiological signals consist of meaningful information (spikes and bursts) superimposed on background noise. Table 3 reports details about spike and burst detection methods. In general the detection method is applied to each single MEA channel: when the electrophysiological signal exceeds a threshold an action potential (spike) is detected. The Plexon system has the additional feature of allowing real-time spike identification based on wave shape (template matching) and discrimination of up to four such shapes on each recording electrode (signal channel). When a spike is detected the system stores the time point of detection within the recording as a unit time stamp (see Figure 2).
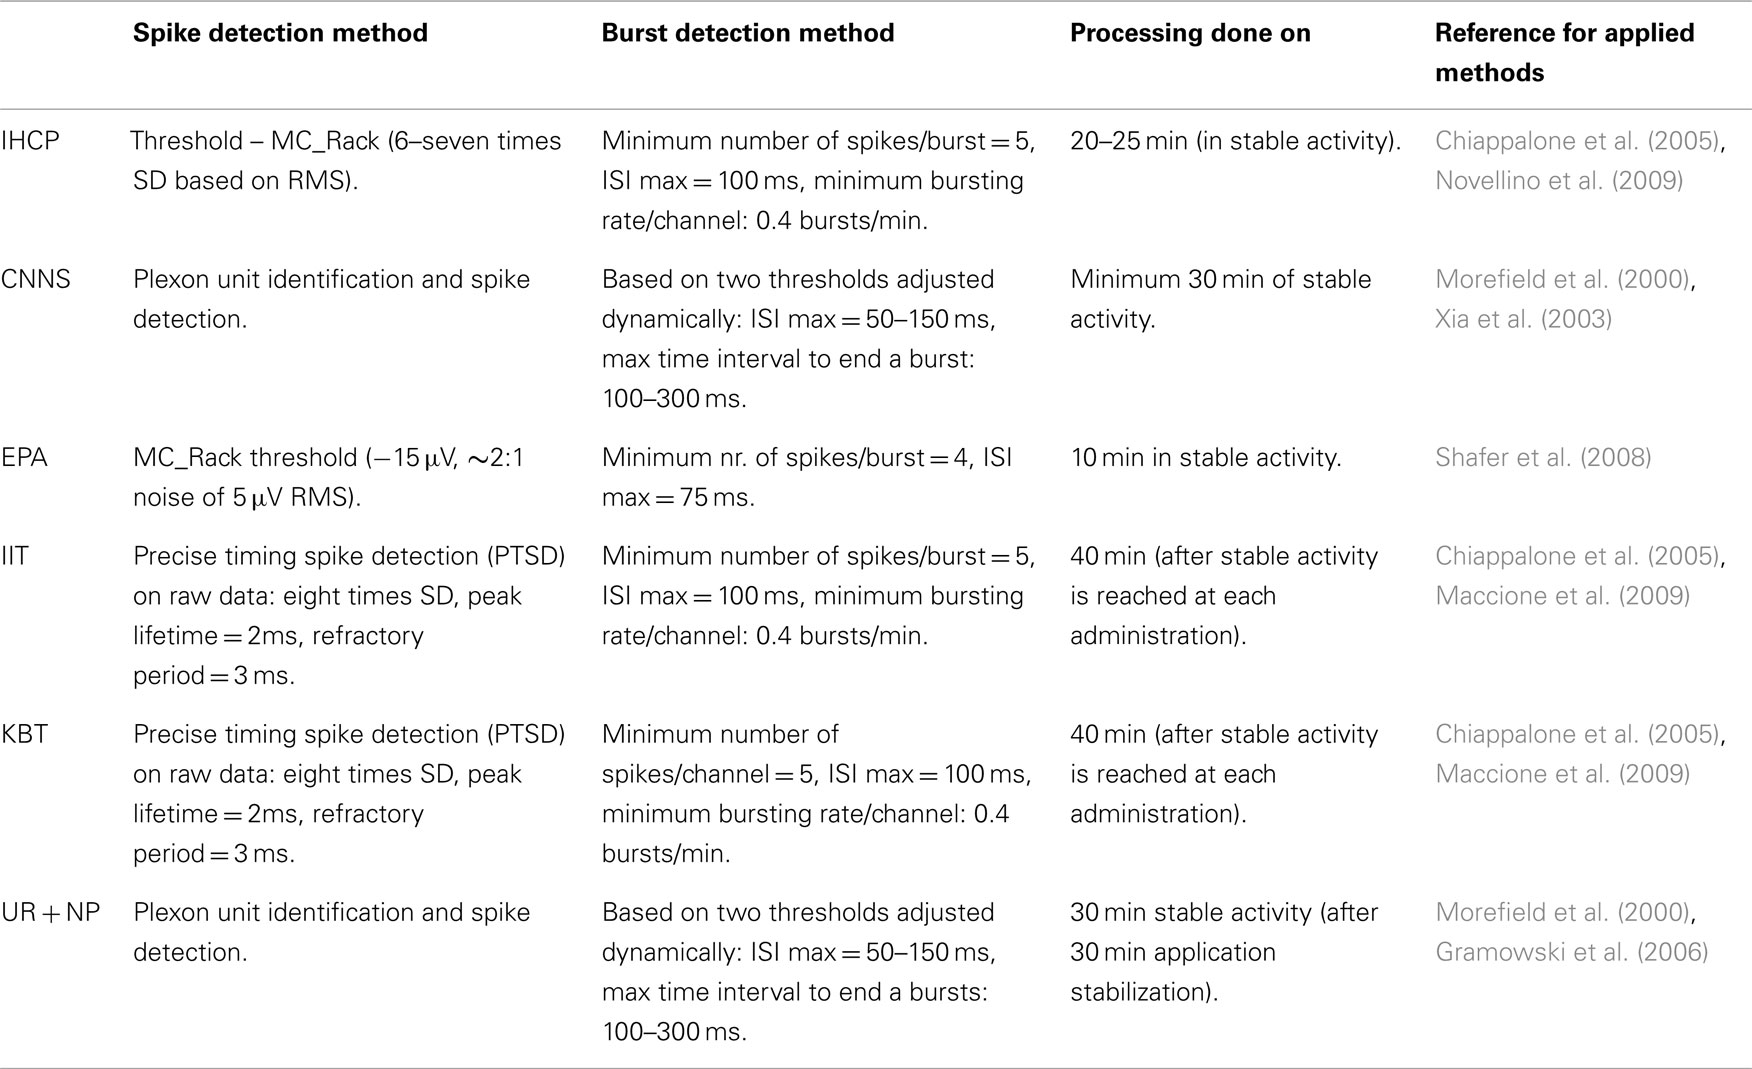
Table 3. Signal processing methods.
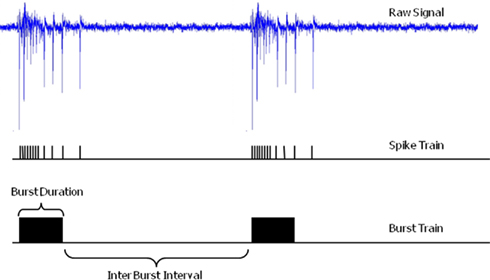
Figure 2. Extracellular raw electrophysiological signal, the extracted spike and burst train. Burst duration and inter burst interval are illustrated (electrophysiological trace recorded at the ST Unit laboratory of the JRC).
A burst is a dense sequence of spikes which can be recognized by a burst detection method. Table 3 reports also details about the methods utilized by each laboratory for both spike and burst detection.
Spike trains were processed from the raw signals recorded from each channel to extract descriptors of the spontaneous electrophysiology at both spike and burst level, namely:
1. Number of spikes (summed over all the active channels in a 1-min bin),
2. Network MFR (spikes/s, summed over all the active channels),
3. Number of bursts (detected in the whole network in a 1-min bin),
4. Network MBR (bursts/min),
5. Number of spikes in burst,
6. Mean Burst duration (ms),
7. Inter burst interval (IBI) (s),
8. Spikes in burst/total spikes (%SB/TS).
All the parameters were extracted at single channel level and integrated over all the active channels in order to have descriptors at network level.
Figure 3 displays an example of how these eight parameters are distributed and affected by the application of muscimol.
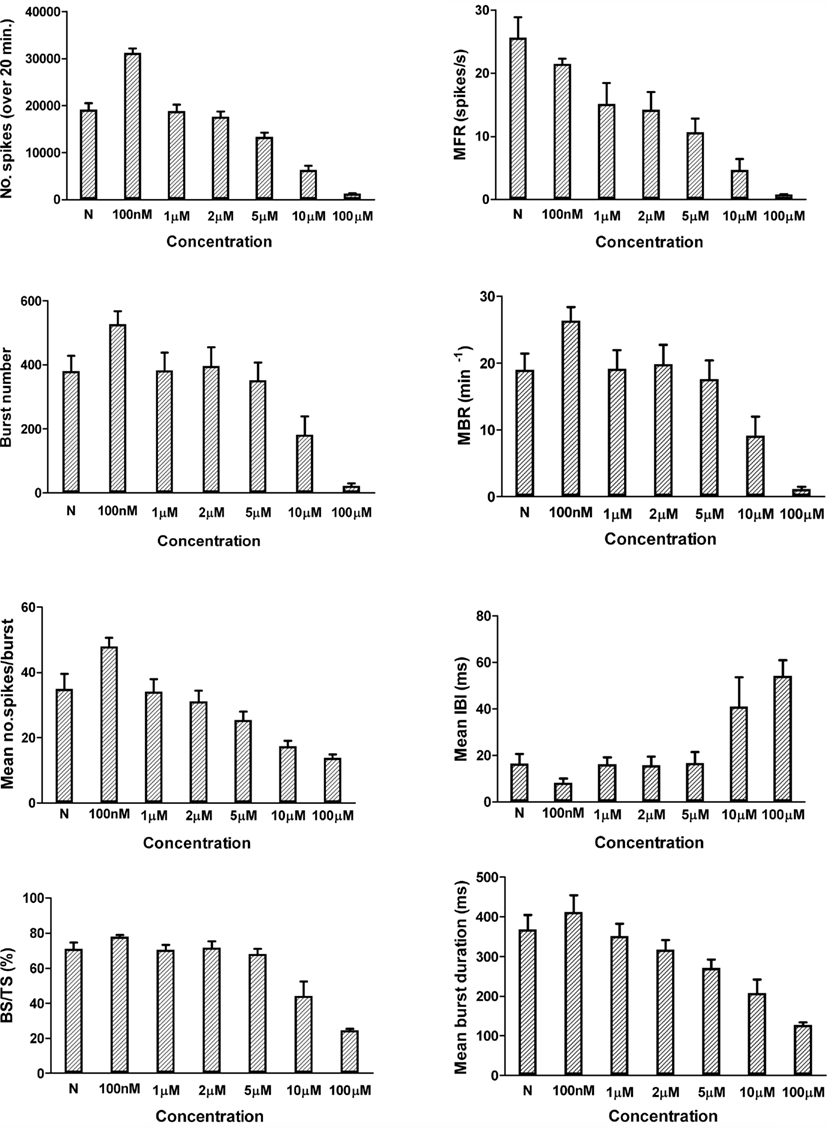
Figure 3. Graphical representation (mean ± SEM) of the eight electrophysiological descriptors and their change upon application of FLU at different concentrations compared to the reference value (N). Data from JRC, N = 8 from three different cultures.
Experimental procedure: from electrophysiology to concentration–response curves
Experiments were carried from the third to the ninth week in vitro (WIV). The recordings were performed on different days and using cultures from a minimum of two different isolations (see Table 2 for details).
In some laboratories a 50% change of the medium was conducted prior to initiating the experiment (see Table 1 for details), 15–30 min were allowed for the activity to stabilize before recording. In all laboratories, reference activity recorded 30–60 min before the first administration was used as the control condition. Reagents were then introduced by the following pipetting procedure to ensure proper mixing: 100–300 μl of medium was removed from the medium bath covering the networks, mixed with a small volume (2–20 μl) of the reagent dilution and carefully returned to the medium bath in order to minimize any osmotic or hydrodynamic stress. Typically concentration–response relationships were determined in a cumulative manner, in which the concentration of drug present in the medium was increased in a stepwise manner in log or half-log units.
All analyses were conducted on binned data with bin size of 60 s. Data from experimental episodes were averaged for the last 20 min over the 30- to 40-min time window of recording for each concentration (see Table 3 for details). Each time point of the experiment was the average of the firing rate over a 60-s time period. A stable level of spontaneous activity was required in order to start the experiment and was considered as the reference. In general, there is a transition period until equilibrium is achieved which has been established by each laboratory with post hoc analysis in previous experiments. The response during this transition time window has not been considered for the concentration–response analysis. The percent change in firing rate at each concentration was then determined relative to the reference spontaneous activity period.
To determine the changes of network activity with time, mean network spike rate, and burst rate of all active channels over the course of the whole experiment were considered. For the purpose of obtaining the IC50 values from the dose–response curve only the changes in MFR were considered. Plots were also used to determine the concentration that stopped all activity.
Bursts were recognized and detected as trains of action potentials based on a set of parameters defined a priori and reported in Table 3. The analysis on bursts was performed on 1-min bins as well as for the MFR.
All the laboratories tested, in a subset of the experiments, the viability of cells at the end of the recordings to assess that the lack of activity was due to the neurotoxic but not to the cytotoxic effect of each compound. This was done with a washout procedure in two steps performed within 10 min usually involving a 50% medium change (i.e., 500 μl) followed by a 100% medium change (1000 μl). In all the cases full recovery of the activity was observed (example shown in Figure 4).
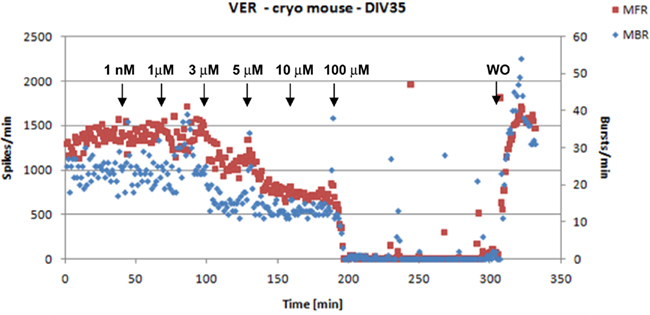
Figure 4. An example of activity inhibition and recovery following washout (WO) with VER. The arrows indicate the time points of compound’s application and the corresponding concentrations (data from JRC).
In one laboratory (JRC) also a test based on the measurement of lactate dehydrogenase (LDH) activity (Roche, Basel, Switzerland) was performed to have further evidence of the lack of cytotoxicity of these three compounds. Samples of the medium (150 μl) were taken from the MEA chips at different times during the experiment namely: (i) before starting the recordings; (ii) at the end of the experiment during the first step of the wash out made with 50% change of the medium; and (iii) during the second step of the wash out made with 100% change of the medium. A negative control, 150 μl of medium which was not in contact with the cells was also submitted to LDH measurement and a positive control with total LDH release by neurons in the chip was determined after lysis by addition of 1% Triton X-100 (Sigma, T8787). as previously done on neuronal cells (Calderón et al., 1999).
Acceptance criteria
In a pre-study meeting the consortium defined some simple rules for considering the NN and its activity acceptable. The first criterion was based on the network morphology and growth evaluation done by a trained and experienced operator. On a regular basis during the culture time and prior to MEA recording each chip was inspected under an optical microscope to exclude the presence of bacterial/fungal contamination. Furthermore before starting an experiment each culture was evaluated for neuronal morphology and network’s growth basing on the presence of a dense and uniform distribution of neuronal cells and the presence of neuronal connections on the recording area as previously described (Hogberg et al., 2011 and see Figure 1). The second step in the quality check was based on the electrophysiological activity analysis. The network was considered acceptable for the study if the following conditions were present:
• activity recorded from at least 15 electrodes
• synchronized burst patterns
• bursting frequency ≥6 burst/min (over the whole network)
• mean spiking frequency ≥6/s (for each channel)
• Number of spikes in bursts/all spikes ≥0.6
• signal-to-Noise (S/N) ratio: larger than 2 × RMS of the recorded signal noise.
• SD of the IC50 obtained from single concentration–response curves < 20% (see Statistical Analysis)
Statistical analysis
For each experiment, the changing spike rate as a function of the concentration was fitted with the Hill equation which has long been proposed as a model to analyze non-linear drug concentration–response relationships (Wagner, 1968):
y = (ySTART +(yEND − ySTART)/(1 + 10[log(IC50) − log(x)]*HC)
Where y is the observed value, ySTART is the highest observed value, yEND is the lowest observed value (usually at the highest concentration), and HC the Hill coefficient which gives the largest absolute value of the slope of the curve.
From this model the IC50 values were determined (using the fitting tool from Igor Pro 6.1, Wavemetrics Inc., USA) for each compound and for each experiment.
The Hill equation was applied to single experiments where 20 points, each representing the MFR over a 1-min bin, were plotted against the corresponding compound’s concentration. The IC50 was obtained with its own SD. If the SD was exceeding 20% of the IC50 value the experiment was discarded from the dataset. When in each lab the set of experiments related to the same compound was completed, the mean values (with SEM) of the MFR at each concentration were plotted and fitted together and the IC50 ± SEM for the compound was obtained.
For direct comparability all parameters were normalized in each experiment with regard to the corresponding values of the reference activity (native or after treatment, respectively).
The distribution of the calculated IC50 values for each compound was tested by applying the one-way analysis of variance (ANOVA). In this approach the calculated variable F, which reflects both the variability within each dataset (intralaboratory variability) and among the different datasets (interlaboratory variability), is submitted to test. The result allows to assess whether the expected values of a quantitative variable (i.e., the IC50) within several pre-defined groups differ from each other and to compare the variability within each dataset and among different datasets. Where significant differences were detected a post hoc analysis with pairwise multiple comparisons was applied to determine which of the means differed. The one-way ANOVA and post hoc analysis were performed with GraphPad Prism (GraphPad Software Inc., La Jolla, CA, USA) and the levels of significance were p = 0.05 for the F and p = 0.01 for the post hoc tests.
Results
One hundred six cortical cultures were recorded in this interlaboratory study. The age of the cultures ranged from DIV19 to DIV68. The cultures exhibited spontaneous activity in their respective media, consistent with previously reported effects (Xia et al., 2003; Gramowski et al., 2004; Chiappalone et al., 2006; Shafer et al., 2008; Pasquale et al., 2010).
Network spike rates ranged from (mean ± SEM) 3.2 ± 0.6 spikes/s (n = 25; cultures from new born rat) to 60.10 ± 7.04 spikes/s (n = 71; cultures from embryonic rat freshly dissociated and embryonic mouse from cryopreserved vials). In spite of these differences in the basal activity the results in terms of IC50 were very homogeneous among the groups and for each compound (see Table 4).
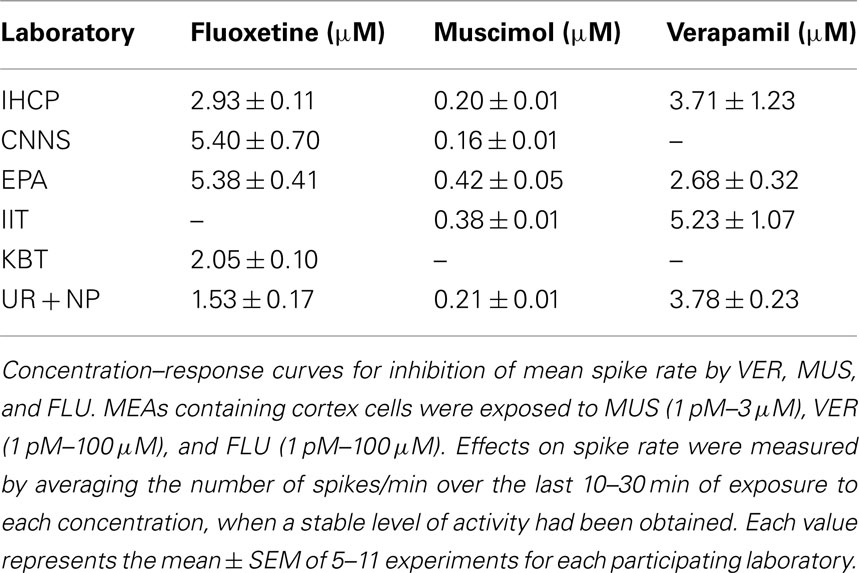
Table 4. IC50 values determined in participating laboratories.
Addition of VER (1 pM–100 μM), MUS (1 pM–3 μM), and FLU (1 pM–100 μM) resulted in concentration-dependent decreases in the rates of spontaneous spiking and bursting activity, and affected also the percentage of spikes in the bursts although with less efficacy (Figure 5). In some experiments, increases in the spike and/or burst rate at low concentrations were observed prior to decreases at higher concentrations (Figure 6) but this effect was not consistently observed and was not statistically significant (paired t-test of the MFR and MBR compared with the values at lower concentrations, p = 0.05). There were clear differences in the inhibitory strength of the three compounds, but for each of them every laboratory recorded the same order of magnitude of the IC50 value (see Table 4; Figure 7). The one-way ANOVA showed that for both MUS and VER the differences among all the laboratories were not significant (p > 0.05) and that the intralaboratory and interlaboratory variabilities were comparable (see Table 5). This indicates that independently from the neuronal source (cryopreserved/embryonic cortical neurons or newborn cortex) and from the differences in the basal activity and the culture age the effects of these two compounds were uniformly detected and reproducible in all the laboratories (see Table 4).
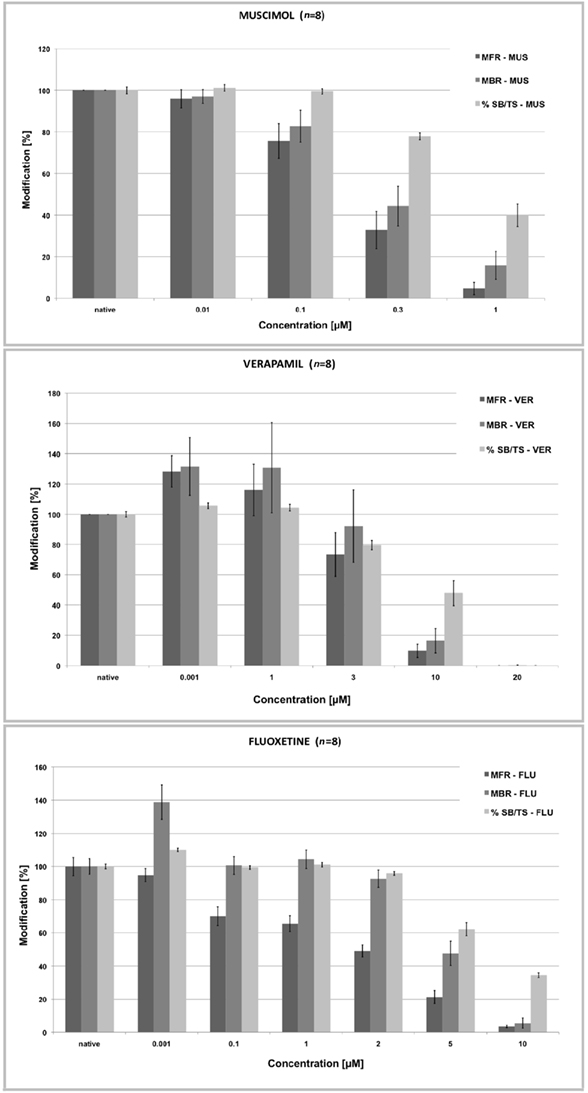
Figure 5. Normalized concentration–response curves for MUS, VER, and FLU of the rates of spontaneous spiking (MFR), bursting activity (MBR), and percent of spikes in the burst relative to the total number of spikes (% SB/ST). As the firing activity drops the bursting activity decreases and so the %SB/TS. (data from the ST Unit laboratory at JRC).
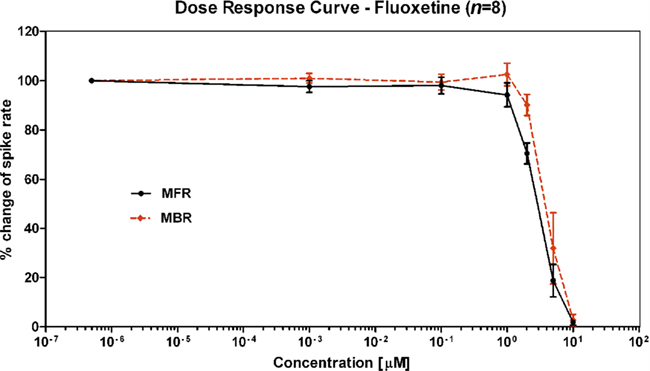
Figure 6. Example of activity inhibition in terms of spike rate (dashed black) and burst rate (dotted red) in response to FLU serial administrations (data from the ST Unit laboratory at JRC).
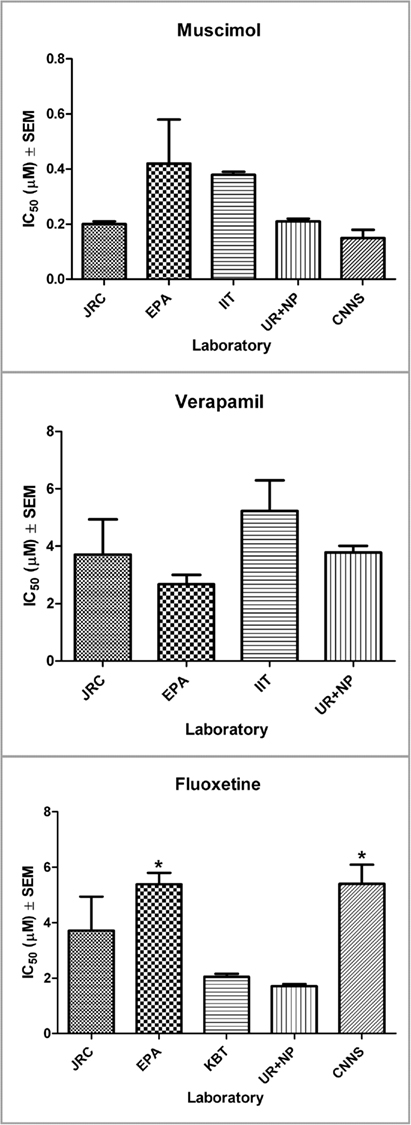
Figure 7. Graphical representation of the IC50 for each compound and for all the participating laboratories (mean ± SEM). For FLU significant differences (*) were detected from two labs (EPA and CNNS). Further analysis revealed a possible influence of the culture age on the effects measured.
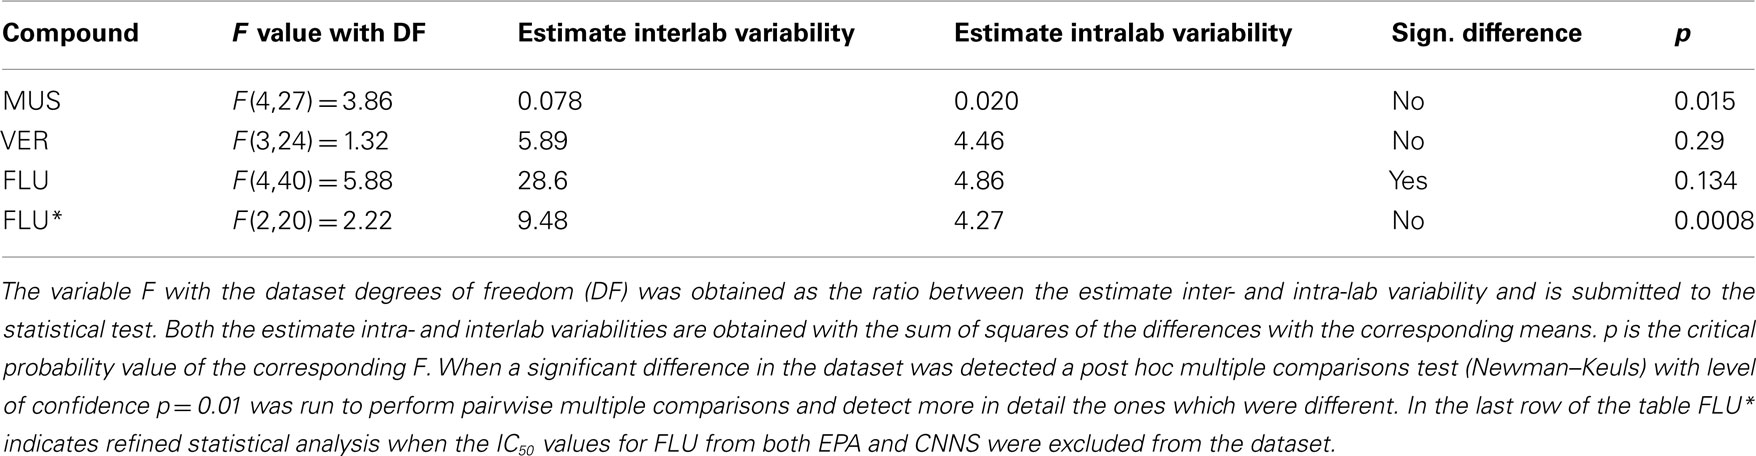
Table 5. Analysis of variance with one-way ANOVA on the IC50s from each compound in the different labs.
The ANOVA on the FLU data has shown that there were significant differences among different laboratories. Thus we run a post hoc (Newman–Keuls) test for multiple comparisons and we found that both EPA and CNNS obtained a significantly greater value of the IC50 compared to the UR + NP laboratory (Figure 7; Table 5). In spite of this the two of them were not significantly different as they were further tested with an unpaired t-test (p > 0.05). CNNS and UR + NP were using the same cell model and same cell culture and signal analysis procedures. The source of this difference is most probably related to the age of the cultures which, in the case of FLU, may play a role (see Discussion). Both UR + NP and the CNNS labs utilized cultures from embryonic mouse frontal cortex with CNNS performing experiments up to 9 weeks in vitro, while EPA performed its experiments on neurons obtained from new born rat cortex when the developmental state of the neurons is ahead compared to the embryonic stage. Yet there were no differences compared to the other labs so this is an effect which can be controlled by a better definition of the optimal culture age for the recordings.
Among the three studied compounds MUS was the most potent, while VER was the least potent (see Table 4).
The three compounds also inhibited the MBR, and burst related parameters, in a concentration-dependent manner that was nearly identical to effects on spike rate. Figure 3 reports an example with Flu but a similar effect was observed also with the other compounds.
Among the parameters used to quantify the effect of the three compounds, the network MFR was identified as the best representing parameter because it was sensitive to the compound’s application, robust, simple to extract, and the effectiveness of the detection was independent from the method applied by each laboratory. Moreover the other parameters are derived from an analysis (i.e., burst detection) of the firing rate so we decided to concentrate on the IC50 derived from MFR as the endpoint to assess the reliability and the reproducibility of the effects on neuronal activity.
All participants observed that the decrease in network activity was not the result of cytotoxicity of MUS, VER or FLU to the cultures since in a subset of experiments the washout of the compound led to full recovery of the initial spike rate (see Figure 4 as an example). Even after spiking and bursting activity was inhibited by >90%, events were still recorded. Furthermore in one lab (JRC), an LDH release test was performed to have further evidence of the lack of cytotoxicity of these three compounds and the results are summarized in Table 6 (see Experimental Procedure: From Electrophysiology to Concentration–Response Curves).
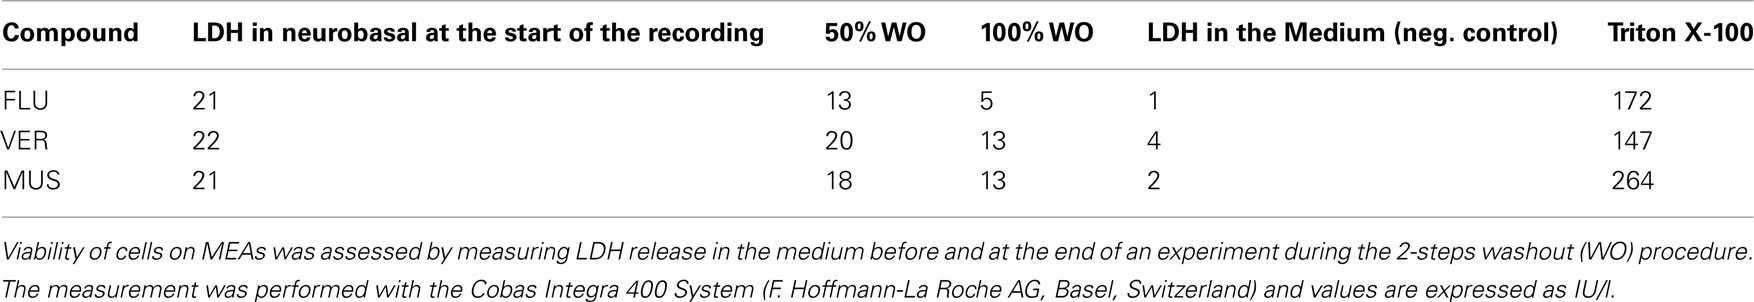
Table 6. Cell Viability with LDH release following exposure to test compounds.
Discussion
The present study examined the robustness and reproducibility of in vitro NNs coupled to MEA-based systems as a first step in demonstrating the utility of this approach for neurotoxicity screening. The results of this study demonstrate consistency across different laboratories in determining the magnitude of the effects for three pharmaceutical agents. Indeed for both MUS and VER, the variability of the IC50 values determined across all the participating laboratories were comparable to the variability detected within each laboratory independently from the culture source and age. The same occurs for FLU when analyzing the data from all laboratories except for CNNS (older cultures age) and EPA (postnatal cortex neurons).
FLU deserves particular consideration because the age of the culture may influence the effect of the compound on the electrical activity. FLU acts on the serotonergic system by inhibiting the serotonin (5-HT) reuptake thus enhancing its the effect. Several published data provide evidence that the serotonergic system undergoes a dramatic change within the late embryonic phase and the first weeks of postnatal life and that the effects of 5-HT on neuronal excitability (and thus activity) may vary a lot within this time window (Hedner and Lundborg, 1980; Aitken and Törk, 1988; Béïqueet al., 2004). Thus experiments performed on cell cultures which span widely through this time period may be affected by the variability of the response related to the rapid changes occurring in the serotonergic pathway.
Still the reproducibility observed in the two subgroups (all laboratories except EPA and CNNS and EPA + CNNS) demonstrates the robustness of MEA approaches. Data derived from MEAs were already shown to be reproducible within an individual laboratory (e.g., Gramowski et al., 2004, 2006; Parviz and Gross, 2007). The present results extend this reproducibility across multiple laboratories and recording platforms. This reproducibility was evident despite the fact that different experimental models (see Table 1), as well as culture practices, and commercially available recording systems (i.e., MultiChannel Systems GmbH, and Plexon Inc.) were used across the different participating laboratories.
In vitro networks of neurons are spontaneously active and express patterns of electrical activity as part of their normal function (Gross et al., 1997; van Pelt et al., 2005; Wagenaar et al., 2006). While there have been limited studies of effects of neurotoxicants using MEAs (see Johnstone et al., 2010), to date these studies have focused on understanding actions of individual chemicals. These studies have established that effects of compounds at the cellular level recorded with MEAs produce histiotypic responses that correlate with their characteristic signs and symptoms of intoxication (e.g., Xia and Gross, 2003; Meyer et al., 2008; Shafer et al., 2008). Furthermore, the alterations of electrical activity induced by a compound’s application (functional neurotoxicity), is often not to the result of cell death (cytotoxicity). This is consistent with the acute neurotoxicity of many xenobiotics (e.g., ethanol, pyrethroids, and tetrodotoxin) that cause the organism death prior to the onset of significant cytotoxicity/pathology in the nervous system. While not systematically examined in the present experiments, the measurements of LDH release indicate that the compounds assessed in the present study also exerted changes in network activity in the absence of cytotoxicity. This ability of MEAs to detect changes in network function that either precede or occur in the absence of significant cytotoxicity make them a useful and sensitive approach for screening chemicals for neurotoxicity potential.
Compared to patch-clamp and other single electrode recording techniques, MEA approaches measure responses of a whole network, integrating global information on the interaction of all receptors, synapses and neuronal types which are present in the network. Furthermore, recently developed new technology of the MEA devices allows to increase the throughput. Already available 12-wells chips with up to 64 electrodes per well allow to simultaneously record neuronal activity in 12 different experimental conditions and very soon platforms which accommodate up to 96-chips in a plate with up to 798 recording channels will be available making the MEA a potential candidate for standard screening of neurotoxic compounds. In addition, because of the integrated nature of function in MEA recordings, they are closer to the whole animal situation than data from single cell or single ion channel studies, and allow for feedback and compensation to take place within the network. While the present studies utilized primary cultures from dissociated tissue, it is possible to measure activity in slices from several CNS regions, thereby preserving the three dimensional structure of the CNS, if desired.
As a first result, the present study demonstrates that MUS, FLU, and VER effects on network activity are characterized by an overall decrease in spiking and bursting activity in a potent and concentration-dependent manner. These results are consistent with patch-clamp and MEA recordings from previous studies (Xia et al., 2003) where FLU decreased the number of spikes and bursts, decreased the percentage of spikes occurring in a burst, and increased both the ISI and IBI or indirectly inhibited electrical activity by enhancing GABAergic transmission (Ye et al., 2008).
The effects that we observed with FLU on dissociated neuronal cultures are in agreement with published data on primary cultures (frontal and auditory cortices) showing that 10–20 μM FLU, similar to the range that we used, induced complete inhibition of electrical activity (Xia et al., 2003).
The present experiments demonstrate that in vitro NNs retain electrical responses which resemble those from their original brain tissue. In fact our results gave evidence that the three compounds exerted inhibition of spontaneous activity at a similar magnitude compared to what previously observed in vivo and on primary cultures (Wada et al., 1995; Heinke et al., 2004; Darbin and Wichmann, 2008).
These effects are consistent across:
– four different cortex sources, namely mouse cortex (E14–15), cryopreserved mouse cortex (E14–15), rat cortex (E16–18), and new born (0–24 h) rat cortex;
– six culture cell-chip practice protocols;
– two different recording platforms (Multi Channel Systems and Plexon);
– three different spike detection methods (two commercial and provided with recording system and one method developed “in house”).
Basing on the differences detected with FLU one recommendation is to narrow the time window for recording in relation to the culture age. In fact when considering only the experiments on embryonic neuronal cultures at younger age the results obtained were consistent and the intralaboratory and interlaboratory variabilities were also comparable.
During drug development and pharmacological evaluation, an efficient and reliable experimental platform is needed for drug screening prior to in vivo whole animal testing. The multi-unit recording of cultured NNs represents a valuable advance with many advantages, including better control of compound concentrations, moderate throughput rates (it is possible to record from different systems in parallel), and easy data interpretation.
The present study has demonstrated the reproducibility of the MEA approach for three pharmaceutical compounds. The reproducibility and the sensitivity of this method make it an eligible candidate tool for systematic analysis and priority ranking of chemical compounds for hazard assessment.
However, to gain acceptance as a potential approach for screening and prioritizing chemicals for potential neurotoxicity, additional studies need to be conducted that examine broader classes of neuroactive/neurotoxic chemicals, and approaches for compound classification (Gross et al., 1997; Chiappalone et al., 2003; Gramowski et al., 2004) must be extended to also include well known classes of neurotoxicants. Future studies are planned to examine effects of neurotoxic and non-neurotoxic compounds and describe further relative potency and structure–activity relationships. The results of such studies will provide further proof of principle that MEA recordings will be useful for neurotoxicity testing.
Conflict of Interest Statement
The authors declare that the research was conducted in the absence of any commercial or financial relationships that could be construed as a potential conflict of interest.
Acknowledgments
The research in this article was partially supported by: (i) The European Commission – Joint Research Centre, Systems Toxicology Work Programme 2009–2010. (ii) The United States Environmental Protection Agency (U.S. EPA). This document has been reviewed by the U.S. EPA National Health and Environmental Effects Research Laboratory and approved for publication. Approval does not signify that the contents reflect the views of the Agency. (iii) The ESSENCE project (EUROTRANS BIO programme 4th call).
Footnotes
- ^These studies are generally carried out using cytotoxicity assays such as Neutral Red (3-amino-7-di-methylamino-2-methylphenazine hydrochloride) uptake (NRU), Alamar Blue or 3-(4,5-dimethylthiazol-2-yl)-2,5-diphenyltetrazoliumbromide (MTT) reduction.
- ^http://www.chemspider.com/Chemical-Structure.3269.html
- ^http://http://www.chemspider.com/RecordView.aspx?rid=a969e9d6-172a-40ff-8a47-fca9acc581db
- ^http://www.chemspider.com/Chemical-Structure.59223.html
References
Aitken, A. R., and Törk, I. (1988). Early development of serotonin-containing neurons and pathways as seen in wholemount preparations of the fetal rat brain. J. Comp. Neurol. 274, 32–47.
Béïque, J. C., Campbell, B., Perring, P., Hamblin, M. W., Walker, P., Mladenovic, L., and Andrade, R. (2004). Serotonergic regulation of membrane potential in developing rat prefrontal cortex: coordinated expression of 5-hydroxytryptamine (5-HT)1A, 5-HT2A, and 5-HT7 receptors. J. Neurosci. 24, 4807–4817.
Bal-Price, A. K., Suñol, C., Weiss, D. G., van Vliet, E., Westerink, R. H., and Costa, L. G. (2008). Application of in vitro neurotoxicity testing for regulatory purposes: symposium III summary and research needs. Neurotoxicology 29, 520–531.
Bartholini, G. (1985). GABA receptor agonists: pharmacological spectrum and therapeutic actions. Med. Res. Rev. 5, 55–75.
Bettencourt, L. M., Stephens, G. J., Ham, M. I., and Gross, G. W. (2007). Functional structure of cortical neuronal networks grown in vitro. Phys. Rev. E. Stat. Nonlin. Soft Matter Phys. 75, 021915.
Calderón, F. H., Bonnefont, A., Muñoz, F. J., Fernández, V., Videla, L. A., and Inestrosa, N. C. (1999). PC12 and neuro 2a cells have different susceptibilities to acetylcholinesterase-amyloid complexes, amyloid25-35 fragment, glutamate, and hydrogen peroxide. J. Neurosci. Res. 56, 620–631.
Chiappalone, M., Bove, M., Vato, A., Tedesco, M., and Martinoia, S. (2006). Dissociated cortical networks show spontaneously correlated activity patterns during in vitro development. Brain Res. 1093, 41–53.
Chiappalone, M., Novellino, A., Vadja, I., Vato, A., Martinoia, S., and van Pelt, J. (2005). Burst detection algorithms for the analysis of spatio-temporal patterns in cortical networks of neurons. Neurocomputing 65–66, 653–662.
Chiappalone, M., Vato, A., Tedesco, M. B., Marcoli, M., Davide, F., and Martinoia, S. (2003). Networks of neurons coupled to microelectrode arrays: a neuronal sensory system for pharmacological applications. Biosens. Bioelectron. 18, 627–634.
Coecke, S., Goldberg, A. M., Allen, S., Buzanska, L., Calamandrei, G., Crofton, K., Hareng, L., Hartung, T., Knaut, H., Honegger, P., Jacobs, M., Lein, P., Li, A., Mundy, W., Owen, D., Schneider, S., Silbergeld, E., Reum, T., Trnovec, T., Monnet-Tschudi, F., and Bal-Price, A. (2007). Workgroup report: incorporating in vitro alternative methods for developmental neurotoxicity into international hazard and risk assessment strategies. Environ. Health Perspect. 115, 924–931.
Costa, L. G. (1998). Biochemical and molecular neurotoxicology: relevance to biomarker development, neurotoxicity testing and risk assessment. Toxicol. Lett. 102–103, 417–421.
Darbin, O., and Wichmann, T. (2008). Effects of striatal GABA A-receptor blockade on striatal and cortical activity in monkeys. J. Neurophysiol. 99, 1294–1305.
Egert, U., Schlosshauer, B., Fennrich, S., Nisch, W., Fejtl, M., Knott, T., Müller, T., and Hämmerle, H. (1998). A novel organotypic long-term culture of the rat hippocampus on substrate-integrated multielectrode arrays. Brain Res. Brain Res. Protoc. 2, 229–242.
Fink, K. B., and Göthert, M. (2007). 5-HT receptor regulation of neurotransmitter release. Pharmacol. Rev. 59, 360–417.
Gramowski, A., Jügelt, K., Stüwe, S., Schulze, R., McGregor, G. P., Wartenberg-Demand, A., Loock, J., Schröder, O., and Weiss, D. G. (2006). Functional screening of traditional antidepressants with primary cortical neuronal networks grown on multielectrode neurochips. Eur. J. Neurosci. 24, 455–465.
Gramowski, A., Jügelt, K., Weiss, D. G., and Gross, G. W. (2004). Substance identification by quantitative characterization of oscillatory activity in murine spinal cord networks on microelectrode arrays. Eur. J. Neurosci. 10, 2815–2825.
Gramowski, A., Schiffmann, D., and Gross, G. W. (2000). Quantification of acute neurotoxic effects of trimethyltin using neuronal networks cultured on microelectrode arrays. Neurotoxicology 21, 331–342.
Gross, G. W., Harsch, A., Rhoades, B. K., and Göpel, W. (1997). Odor, drug and toxin analysis with neuronal networks in vitro: extracellular array recording of network responses. Biosens. Bioelectron. 12, 373–393.
Gross, G. W., Rieske, E., Kreutzberg, G. W., and Meyer, A. (1977). A new fixed-array multi-microelectrode system designed for long-term monitoring of extracellular single unit neuronal activity in vitro. Neurosci. Lett. 6, 101–105.
Hedner, T., and Lundborg, P. (1980) Serotoninergic development in the postnatal rat brain. J. Neural. Transm. 49, 257–279.
Heinke, B., Balzer, E., and Sandkühler, J. (2004). Pre- and postsynaptic contributions of voltage-dependent Ca2( channels to nociceptive transmission in rat spinal lamina I neurons. Eur. J. Neurosci. 1, 103–111.
Hogberg, H. T., Sobanski, T., Novellino, A., Whelan, M., Weiss, D. G., and Bal-Price, A. K. (2011). Application of micro-electrode arrays (MEAs) as an emerging technology for developmental neurotoxicity: evaluation of domoic acid-induced effects in primary cultures of rat cortical neurons. Neurotoxicology 32, 158–168.
Johnstone, A. F., Gross, G. W., Weiss, D. G., Schroeder, O. H., Gramowski, A., and Shafer, T. J. (2010). Microelectrode arrays: a physiologically based neurotoxicity testing platform for the 21st century. Neurotoxicology 31, 331–350.
Köhling, R., Melani, R., Koch, U., Speckmann, E. J., Koudelka-Hep, M., Thiébaud, P., and Balestrino, M. (2005). Detection of electrophysiological indicators of neurotoxicity in human and rat brain slices by a three-dimensional microelectrode array. Altern. Lab. Anim. 33, 579–589.
Lilienblum, W., Dekant, W., Foth, H., Gebel, T., Hengstler, J. G., Kahl, R., Kramer, P. J., Schweinfurth, H., and Wollin, K. M. (2008). Alternative methods to safety studies in experimental animals: role in the risk assessment of chemicals under the new European Chemicals Legislation (REACH). Arch. Toxicol. 82, 211–236.
Maccione, A., Gandolfo, M., Massobrio, P., Novellino, A., Martinoia, S., and Chiappalone, M. (2009). A novel algorithm for precise identification of spikes in extracellularly recorded neuronal signals. J. Neurosci. Methods 177, 241–249.
Morefield, S. I., Keefer, E. W., Chapman, K. D., and Gross, G. W. (2000). Drug evaluations using neuronal networks cultured on microelectrode arrays. Biosens. Bioelectron. 15, 383–396.
Meyer, D. A., Carter, J. M, Johnstone, A. F., and Shafer, T. J. (2008). Pyrethroid modulation of spontaneous neuronal excitability and neurotransmission in hippocampal neurons in culture. Neurotoxicology 29, 213–225.
Novellino, A., Chiappalone, M., Maccione, A., and Martinoia, S. (2009). Neural signal manager: a collection of classical and innovative tools for multi-channel spike train analysis. Int. J. Adapt. Control Signal Process. 23, 999–1013.
Novellino, A., and Zaldívar, J. M. (2010). Recurrence quantification analysis of spontaneous electrophysiological activity during development: characterization of in vitro neuronal networks cultured on multi electrode array chips. Adv. Artif. Intell. 2010, 10.
Obrenovitch, T. P., Urenjak, J., Zilkha, E., and Jay, T. M. (2000). Excitotoxicity in neurological disorders – the glutamate paradox. Int. J. Dev. Neurosci. 18, 281–287.
Pancrazio, J. J., Gray, S. A., Shubin, Y. S., Kulagina, N., Cuttino, D. S., Shaffer, K. M., Eisemann, K., Curran, A., Zim, B., Gross, G. W., and O’Shaughnessy, T. J. (2003). A portable microelectrode array recording system incorporating cultured neuronal networks for neurotoxin detection. Biosens. Bioelectron. 18, 1339–1347.
Parviz, M., and Gross, G. W. (2007). Quantification of zinc toxicity using neuronal networks on microelectrode arrays. Neurotoxicology 3, 520–531.
Pasquale, V., Martinoia, S., and Chiappalone, M. (2010). A self-adapting approach for the detection of bursts and network bursts in neuronal cultures. J. Comput. Neurosci. 1–2, 213–229.
Pine, J. (1980). Recording action potentials from cultured neurons with extracellular microcircuit electrodes. J. Neurosci. Methods 2, 19–31.
Rüschenschmidt, C., Straub, H., Köhling, R., Siep, E., Gorji, A., and Speckmann, E. J. (2004). Reduction of human neocortical and guinea pig CA1-neuron A-type currents by organic calcium channel blockers. Neurosci. Lett. 368, 57–62.
Shafer, T. J., Rijal, S. O., and Gross, G. W. (2008). Complete inhibition of spontaneous activity in neuronal networks in vitro by deltamethrin and permethrin. Neurotoxicology 29, 203–212.
Streit, J. (1993). Regular oscillations of synaptic activity in spinal networks in vitro. J. Neurophysiol. 70, 871–878.
Thomas, C. A. Jr., Springer, P. A., Loeb, G. E., Berwald-Netter, Y., and Okun, L. M. (1972). A miniature microelectrode array to monitor the bioelectric activity of cultured cells. Exp. Cell Res. 74, 61–66.
van Pelt, J., Vajda, I., Wolters, P. S., Corner, M. A., and Ramakers, G. J. (2005). Dynamics and plasticity in developing neuronal networks in vitro. Prog. Brain Res. 147, 173–188.
Vincent, P., and Mulle, C. (2009). Kainate receptors in epilepsy and excitotoxicity. Neuroscience 158, 309–323.
Wada, Y., Shiraishi, J., Nakamura, M., and Hasegawa, H. (1995). Prolonged but not acute fluoxetine administration produces its inhibitory effect on hippocampal seizures in rats. Psychopharmacology (Berl.) 118, 305–309.
Wagenaar, D. A., Pine, J., and Potter, S. M. (2006). An extremely rich repertoire of bursting patterns during the development of cortical cultures. BMC Neurosci. 7, 7–11.
Wagner, J. G. (1968). Kinetics of pharmacologic response. I. Proposed relationships between response and drug concentration in the intact animal and man. J. Theor. Biol. 20, 173–201.
Xia, Y., Gopal, K. V., and Gross, G. W. (2003). Differential acute effects of fluoxetine on frontal and auditory cortex networks in vitro. Brain Res. 973, 151–160.
Xia, Y., and Gross, G. W. (2003). Histiotypic electrophysiological responses of cultured neuronal networks to ethanol. Alcohol 30, 167–174.
Keywords: micro-electrode arrays, electrophysiology, neurotoxicology, primary neuronal culture
Citation: Novellino A, Scelfo B, Palosaari T, Price A, Sobanski T, Shafer TJ, Johnstone AFM, Gross GW, Gramowski A, Schroeder O, Jügelt K, Chiappalone M, Benfenati F, Martinoia S, Tedesco MT, Defranchi E, D’Angelo P and Whelan M (2011) Development of micro-electrode array based tests for neurotoxicity: assessment of interlaboratory reproducibility with neuroactive chemicals. Front. Neuroeng. 4:4. doi: 10.3389/fneng.2011.00004
Received: 29 November 2010;
Paper pending published: 17 January 2011;
Accepted: 28 March 2011;
Published online: 27 April 2011.
Edited by:
Michele Giugliano, University of Antwerpen, BelgiumReviewed by:
Pascal Darbon, University of Strasbourg, FranceStephan Theiss, University of Dusseldorf, Germany
Sandro Carrara, École Polytechnique Fédérale de Lausanne, Switzerland
Copyright: © 2011 Novellino, Scelfo, Palosaari, Price, Sobanski, Shafer, Johnstone, Gross, Gramowski, Schroeder, Jügelt, Chiappalone, Benfenati, Martinoia, Tedesco, Defranchi, D’Angelo and Whelan. This is an open-access article subject to a non-exclusive license between the authors and Frontiers Media SA, which permits use, distribution and reproduction in other forums, provided the original authors and source are credited and other Frontiers conditions are complied with.
*Correspondence: Bibiana Scelfo, European Commission – Joint Research Centre, Institute for Health and Consumer Protection, Via Enrico Fermi 1, Ispra 21027, Italy. e-mail: bibiana.scelfo@jrc.ec.europa.eu