1
Universidade de São Paulo, Instituto de Física de São Carlos, São Carlos, São Paulo, Brazil
2
National Institute of Science and Technology for Complex Systems, Brazil
This work reports a digital signal processing approach to representing and modeling transmission and combination of signals in cortical networks. The signal dynamics is modeled in terms of diffusion, which allows the information processing undergone between any pair of nodes to be fully characterized in terms of a finite impulse response (FIR) filter. Diffusion without and with time decay are investigated. All filters underlying the cat and macaque cortical organization are found to be of low-pass nature, allowing the cortical signal processing to be summarized in terms of the respective cutoff frequencies (a high cutoff frequency meaning little alteration of signals through their intermixing). Several findings are reported and discussed, including the fact that the incorporation of temporal activity decay tends to provide more diversified cutoff frequencies. Different filtering intensity is observed for each community in those networks. In addition, the brain regions involved in object recognition tend to present the highest cutoff frequencies for both the cat and macaque networks.
Brains are modular, interconnected structures optimized for transmission and processing of information at a level compatible with the survival and reproduction of each particular species (Hilgetag and Kaiser, 2004
; Koch and Laurent, 1999
; Sporns, 2002
; Sporns et al., 2004
). Information is progressively altered as it flows through the brain as a consequence of: (i) the processing performed by each individual neuron; (ii) the interconnection between the neurons along the path of the information flow, which implements the mixture of different signals; and (iii) interferences at the neurons or interconnection links (e.g. noise and cross-talk). While great attention has been focused on information processing in the brain, specially at the neuronal level, relatively fewer investigations have addressed the equally important issue of how signals are disseminated, while being integrated, through the several brain areas. Indeed, a great deal of the brain hardware (Sporns and Kötter, 2004
), especially the white matter, is responsible for conveying signals along considerable distances from their origin, typically to several destinations, where they are modified, blended, and transmitted further.
Brain connectivity can be effectively represented, modeled and simulated in terms of graphs (e.g. Barabási and Albert, 2002
). More specifically, each neuron or cortical region can be mapped as a node of a graph, while the synaptic or inter-regional connections are represented as directed links. Though a more complete understanding of information processing in the brain ultimately requires the integration of the non-linear processing taking place at each neuron, valuable insights can be nevertheless obtained by adopting some simpler (e.g. linear) dynamics and focusing on the interconnectivity and signal modification between neurons or cortical areas, as represented by graphs and networks (Watts and Strogatz, 1998
).
Several linear approximations to non-linear problems have been reported in the literature, most of which related to linear synchronization dynamics (e.g. Zemanova et al., 2008
; Zhou et al., 2006
, 2007
) and active media (e.g. Biktasheva et al., 2009
; Ermentrout and Edelstein-Keshet, 1993
; Hramov et al., 2005
), yielding valuable insights about information transmission and processing. One element of particular importance in such investigations regards the interplay between structure and function. For instance, it has been established that the neural systems seem to form networks whose structures lie at the critical regime between local and global synchrony (Percha et al., 2005
). In this way, the appearance of connections in damaged regions may lead to the onset of epileptic seizures (Nadkarni and Jung, 2003
). It should be also observed that, as in the present work, linear approaches can be applied to model the collective dynamics of whole cortical regions, defining a more macroscopic investigation. In such cases, the explicit non-linearity of individual neuronal firing are averaged among several cells, yielding signals which are more graded and more propitious to being represented by linear approximations, especially during short periods of time. This property is ultimately one of the main justifications for the relatively large number of works in the literature in which brain activity is approached in terms of linear synchronization. It is also possible that the macroscopic propagation of cortical activation amongst different cortical regions could exhibit dynamics similar to traditional diffusion. Nevertheless, it should always be borne in mind that linear models of cortical activations may not reflect all the important dynamical features, especially those involving longer time intervals.
While synchronization is inherently important in the sense of being related to the brain workings, other linear approaches can be equally applied in order to reveal complementary aspects of the relationship between structure and function in the brain. One particularly interesting possibility which has been mostly overlooked is the investigation of signal transmission and processing in terms of signal processing approaches. Founded on a well-established, sound mathematical framework, signal processing research (e.g. McClellan et al., 2002
; Proakis and Manolakis, 2006
) focuses on the representation and analysis of signals and systems in terms of frequencies and filters. The generality of such an approach stems from the fact that any real-world signal can be represented in terms of its respective Fourier series, namely a linear combination of basic harmonic components (sines and cosines) with different, well-defined frequencies. Linear systems typically modify such signals by changing the intensity of each component, such as in filters. For instance, a low-pass filter will attenuate the high-frequency harmonic components, while allowing the lower frequency components to pass with little or no alteration. The application of such an approach to signal transmission and processing in the brain paves the way to a series of promising possibilities. For instance, the alterations undergone by information as it proceeds from a specific origin neuron or cortical region to a specific target can be approximated as a kind of filter. Provided the properties of such a filter can be obtained, this approach allows modeling of the alterations undergone by the information while going from origin to destination. In other words, such a filter would replicate the functionality of the whole portion of brain hardware comprised between the origin and destination. In addition to its simplicity and elegance, such a filter modeling approach would also clearly characterize the way in which the information is altered in an intuitive and meaningful way, i.e. in terms of the alterations of the magnitudes of specific harmonic components. For instance, in case a specific portion of the brain is found to correspond to a low-pass filter, it becomes immediately clear that the high-frequency content of the signal is being attenuated, which corresponds to a smoothing operation implying loss of its details, therefore suggesting that that particular processing is focusing on the slower variations of the signal. In addition, low-pass filters are immediately related to the operation of integrating signals along time. In this respect, the smoothing could be a consequence of too intense mixing of several delayed versions of the signal, therefore providing valuable information about the level of blending of the signals as they passed through the network topology. Interestingly, the dynamical effect of low- and high-pass filters can be to a large extent summarized in terms of their respective cutoff frequency, namely the frequency where the attenuation reaches  of the amplitude of the largest harmonic component. Such an approach allows the function of the whole portion of brain in question to be effectively summarized in terms of a single real value. In the case of a low-pass filter, the higher the cutoff frequency, the smaller the alteration and intermixing undergone by the signal.
of the amplitude of the largest harmonic component. Such an approach allows the function of the whole portion of brain in question to be effectively summarized in terms of a single real value. In the case of a low-pass filter, the higher the cutoff frequency, the smaller the alteration and intermixing undergone by the signal.The current work describes a signal processing approach to the integration of brain structure and functionality which relies on the adoption of linear dynamics, namely diffusion. This type of dynamics underlies several natural systems and also participates in a large variety of non-linear dynamics (e.g. reaction-diffusion Giordano and Nakanishi, 2005
). More specifically, at each time step, the signals arriving at each cortical region are added and redistributed among the respective outgoing links. The specific way in which such alterations take place are intrinsically related to the specific topology of the portion of the network comprised between the origin and destination nodes. In this way, the signals are blended as they are propagated along the brain in a way that is analogue to several sources of sound going through an environment as the sound signals reverberate and intermix, giving rise to constructive and destructive interferences. As such, this approach provides a nice complementation of other linear approximations to brain functionality, such as synchronization, by emphasizing the intermixing of signals as they progress through specific pathways along the intricate brain topology. Though we focus on cortical networks, this approach is immediately extensible to neuronal networks.
As reported recently (Rodrigues and da Fontoura Costa, 2009
), non-conservative diffusion dynamics, more specifically the situation where each outgoing edge produces unit activation, in cortical networks can be effectively modeled in terms of finite impulse response digital filters (FIR). Interestingly, the coefficients of the FIR associated to a given network undergoing that type of dynamics are completely defined by the number of walks between the origin and destination areas, therefore establishing a clear-cut relationship between network structure and dynamics. The present work extends and explores these possibilities much further by assuming conservative diffusion with and without time decay in the cat and macaque cortical networks.
The manuscript starts by presenting the concepts of complex networks and digital signal processing, as well as the adopted cortical databases. Next, results obtained with respect to macaque and cat cortical networks are presented and discussed. The text concludes by reviewing the main contributions and identifying possibilities for further investigations.
Networks and Diffusion
A directed complex network, composed by a set of N nodes connected by E edges, can be represented by its adjacency matrix A, whose elements aij are equal to unity if the node j sends a connection to node i, and equal to zero otherwise. Two nodes i and j are said to be adjacent or neighbors if  . Two non-adjacent nodes i and j can be connected through a sequence of m edges
  Such a set of edges between i and j is called a walk of length m. The special case of a walk where no nodes are repeated is called a path.
. Two non-adjacent nodes i and j can be connected through a sequence of m edges Such a set of edges between i and j is called a walk of length m. The special case of a walk where no nodes are repeated is called a path.A particular property of most complex networks is their community or modular structure. Communities are modules of densely interconnected nodes (Girvan and Newman, 2002
). There are many methods for community identification and their choice depends on specific needs, e.g. accuracy against fast execution (da Fontoura Costa et al., 2007
). In the current work, we considered the method based in random walks called Walktrap (Pons and Latapy, 2005
), because such approach is intrinsically related to diffusion dynamics, which also underlies our modeling approach.
The characterization of the properties of a given network can be performed in terms of structural (e.g. da Fontoura Costa et al., 2007
) and dynamical measurements (e.g. da Fontoura Costa and Rodrigues, 2008
). Structural measurements includes, for instance, the node degree, clustering coefficient, average shortest path length and assortativity coefficient (da Fontoura Costa et al., 2007
). On the other hand, dynamical measurements depend on the specific dynamic process that is being executed in the network, such as synchronization (e.g. Pikovsky et al., 2002
), random walks (e.g da Fontoura Costa and Sporns, 2006
; da Fontoura Costa and Travieso, 2003
), opinion formation (e.g Rodrigues and da Fontoura Costa, 2005
) and epidemic spreading (e.g Newman, 2002
). The structure and dynamics of complex networks are intrinsically inter-related (Boccaletti et al., 2006
).
As shown in the current work, the relationship between structure and function of networks can also be addressed by using signal processing approaches. Signals are assumed to spread throughout the network by random walks initiating from a given source node (e.g. Barber and Ninham, 1970
; Giordano and Nakanishi, 2005
). Such a dynamical process, which is inherently related to diffusion (Barber and Ninham, 1970
), involves the progressive dissemination and intermixing of the signals along time and network space, closely reflecting the specific topology of the network. Therefore, the signal arriving at a given destination node depends strongly on the structure of the portion of the network comprised between the source and destination nodes (da Fontoura Costa and Rodrigues, 2008
). It has been shown recently (Rodrigues and da Fontoura Costa, 2009
), with respect to a specific non-conservative diffusion dynamics, that such a strong interplay between network structure and dynamics can be fully modeled in terms of finite impulse response filters (FIRs). More specifically, the coefficients of such digital filters are given by the number of walks between the source and destination nodes.
The diffusion of activations in complex networks can be obtained by considering the transition matrix S, which can be calculated from the adjacency matrix A as
Each element S(i,j) gives the probability of moving from the node i to node j. In this way, if a given signal is injected into a network, we can determine its diffusive propagation by repeatedly applying the transition matrix. More specifically, the probability of transition between the source and a destination at n edges of distance can be immediately obtained from the matrix

Similarly, the number of walks of length n between two nodes can be determined by the elements of the matrix Dn = An. The above dynamics is conservative, as there is no loss in the activations (all signals in the present work are formed by zeroes and ones). On the other hand, it is also possible to adopt a decay parameter that reduces the amplitude of the received activation along time. In this case, the matrix Hn, which gives the probability of transition between the source and destination nodes separated by walks of length n, is given as

where  ,
,  and
and  . The coefficient α can be understood as the rate of decay according to the distance from the source of signal propagation. Such a dynamics, which is no longer conservative, has biological backing in the sense that sensory brain activations tend to diminish with time. In the current work, we show that the FIR approach to modeling the cortical networks can easily incorporate time decay, allowing the investigation of the diffusion dynamics without and with decay.
, and . The coefficient α can be understood as the rate of decay according to the distance from the source of signal propagation. Such a dynamics, which is no longer conservative, has biological backing in the sense that sensory brain activations tend to diminish with time. In the current work, we show that the FIR approach to modeling the cortical networks can easily incorporate time decay, allowing the investigation of the diffusion dynamics without and with decay.Discrete Signals and their Processing
A discrete-time signal is a time series consisting of a sequence of discrete values. The process of converting a continuous-valued discrete-time signal into a digital (discrete-valued discrete-time) signal is known as quantization (Orfanidis, 1996
). A time-invariant system is a system that remains unchanged along time. This implies that if a given input is inserted into the system and causes a definite output, if we repeat the same process at another time, an equally delayed version of the previous output will be obtained. A linear, time-invariant system (LTI) can be fully classified in terms of its finite impulse response (FIR) and infinite impulse response (IIR), depending on whether the inserting signal has finite or infinite duration. More specifically, given the impulse response, the output produce for any input signal can be immediately calculated in terms of the convolution between the input signal and the impulse response.
A filter can be defined as any medium that can modify the signal in some way (Smith, 2007
). A digital filter operates on discrete-time signals by taking a sequence of values (the input signal) and producing a new discrete-time signal (the filtered output signal). The main objective underlying the current work is to model the dynamics of signal transmission and integration between pairs of nodes in terms of digital signal processing concepts (McClellan et al., 2002
; Orfanidis, 1996
; Proakis and Manolakis, 2006
). More specifically, the signal processing between pairs of nodes (source and destination of signal) is modeled as a FIR digital filter structure whose coefficients correspond to the total probability of transition of walks of different lengths between the source and destination (see Figure 1
). This approach extends and complements a preliminary investigation assuming non-conservative diffusion dynamics, where the signals were propagated by using the adjacency, instead of transition, matrix (Rodrigues and da Fontoura Costa, 2009
).
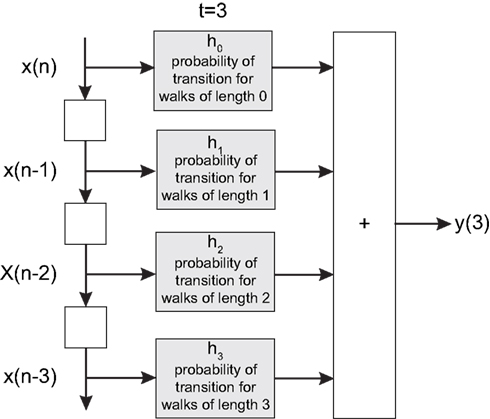
Figure 1. The FIR model of the dynamics between a pair of nodes in a given network. The signal  is injected into the network until t = 3. The signal at each time instant in the destination
  corresponds to a linear combination of the input signal and the coefficients h(n) given by the probability of transition for walks of varying lengths between the source and destination.
is injected into the network until t = 3. The signal at each time instant in the destination corresponds to a linear combination of the input signal and the coefficients h(n) given by the probability of transition for walks of varying lengths between the source and destination.If a signal is injected into a network from a given source node i, the activation of each node at time t implied by the diffusion dynamics can be represented in terms of the system state vector (da Fontoura Costa, 2008
)

where yj(t) represents the state of the node j at the time t. Given the state of a network at time t, the subsequent state can be calculated by

where  is the vector representing the forcing signal injected at each node i. Note that in the case where only one node i receives activation at each time t, we have si(t) = 1, while all the other elements of
  are equal to zero. The forcing signal
  injected into the network is assumed to have length L and be composed of elements which are equal to zero or one. At each time step, one element of this vector is injected into the source node i, i.e. si(t) = x(t). Thus, by considering this dynamics, signals are diffused, distributed and intermixed along the network. More specifically, the signal arriving at a node j after t time steps is a linear combination of the original signal values after undergoing all possible delays (smaller or equal to t) and combinations along the portion of the network comprised between the source and destination nodes, i.e.
is the vector representing the forcing signal injected at each node i. Note that in the case where only one node i receives activation at each time t, we have si(t) = 1, while all the other elements of are equal to zero. The forcing signal injected into the network is assumed to have length L and be composed of elements which are equal to zero or one. At each time step, one element of this vector is injected into the source node i, i.e. si(t) = x(t). Thus, by considering this dynamics, signals are diffused, distributed and intermixed along the network. More specifically, the signal arriving at a node j after t time steps is a linear combination of the original signal values after undergoing all possible delays (smaller or equal to t) and combinations along the portion of the network comprised between the source and destination nodes, i.e.
where yj(t) is the activation of the node j at the time t and the elements h(n) represent the probability of transition between the source i and the destination j, considering all random walks of length t between the source and destination.
It can be easily verified that Eq. 6 corresponds to a FIR filtering structure, such as that illustrated in Figure 1
. Indeed, this equation is equivalent to the convolution between the injected signal and the finite impulse response sequence  of a digital filter considering some initial period of time. Therefore, the dynamic of signal transmission between each pair of nodes i and j is effectively summarized, for a given finite period of time, by the respective FIR structure, which is completely specified in terms of the coefficients of
  , respectively given by Eq. 2. Thus, the coefficients defining the FIR structure are fully specified by the transition matrix describing the diffusion dynamics for each specific network topology.
of a digital filter considering some initial period of time. Therefore, the dynamic of signal transmission between each pair of nodes i and j is effectively summarized, for a given finite period of time, by the respective FIR structure, which is completely specified in terms of the coefficients of , respectively given by Eq. 2. Thus, the coefficients defining the FIR structure are fully specified by the transition matrix describing the diffusion dynamics for each specific network topology.The convolution above can be conveniently evaluated in terms of the z-transform. The z-transform converts a discrete time-domain signal, which is a sequence of real or complex numbers, into a complex domain representation. The z-transform is closely related to the Laplace transform, from which it can be obtained through the variable change z = est (McClellan et al., 2002
). As a consequence, the z-transform is also related to the Fourier transform. Given a discrete time signal  , its z-transform is defined as corresponding to the following series (Sirovich, 1988
),
, its z-transform is defined as corresponding to the following series (Sirovich, 1988
),
, its z-transform is defined as corresponding to the following series (Sirovich, 1988
),
We can recover  from X(z) by extracting the coefficient of the n-th power of z−1 and placing that coefficient in the t-th position in the sequence x(t). Note that the inverse z-transform may not be unique unless its region of convergence is specified. The inverse z-transform can be computed using the contour integral (McClellan et al., 2002
)
from X(z) by extracting the coefficient of the n-th power of z−1 and placing that coefficient in the t-th position in the sequence x(t). Note that the inverse z-transform may not be unique unless its region of convergence is specified. The inverse z-transform can be computed using the contour integral (McClellan et al., 2002
)
Among the main features of the z-transform that facilitate the analysis of linear systems we have: (i) linearity, (ii) delay representation, and (iii) the convolution property. In the case of the cortical networks, the FIR representation makes it clear how the existence of several paths of different lengths between the source and destination nodes, by defining distinct transition probabilities, completely specifies the functionality of the FIR as well as of the respective cortical network (Rodrigues and da Fontoura Costa, 2009
). The convolution property is fundamental in FIR analysis, since it can be easily calculated by a simple multiplication in the transformed space, i.e.

where h(t) is the impulse response sequence of a digital filter.
As the z-transform of a time-delay function δ(t − p) is known to be z−p, we have that the system function H(z) (i.e. the z-transform of the finite impulse response) for the network modeled as a FIR structure is given as

where Γ is the FIR size and h(n) represents the probability of transition between the source and the destination for walks of length n, i.e. the elements of Hn = Sn. Figure 2
illustrates the dynamics in a network as modeled by the FIR approach.
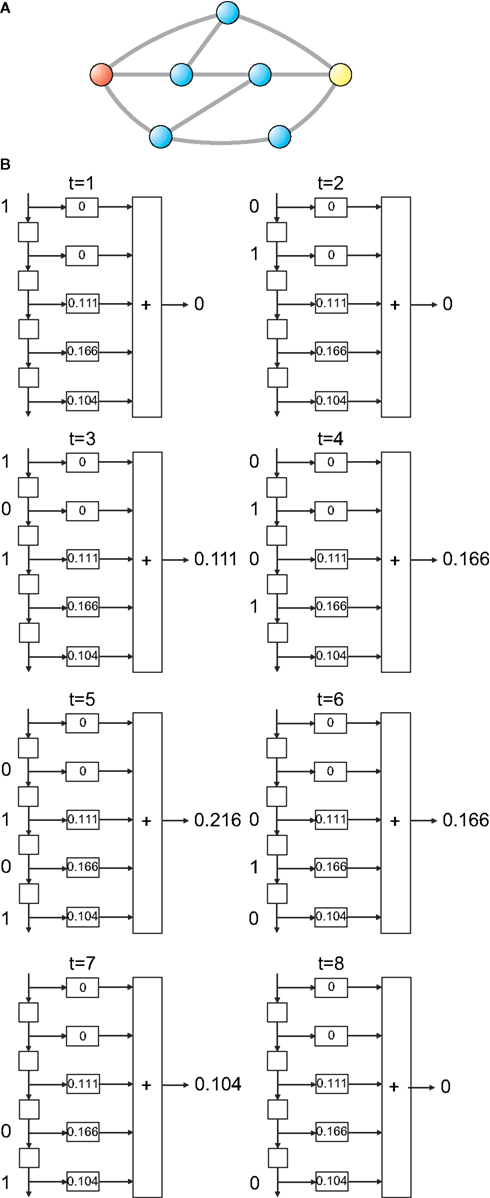
Figure 2. Example of FIR modeling of the dynamics between a pair of nodes in the network (A). The signal  is injected into the red node and the output is observed at the yellow node along the first 8 time steps. The output,
  , can be obtained by considering the FIR structure, as illustrated in (B).
is injected into the red node and the output is observed at the yellow node along the first 8 time steps. The output, , can be obtained by considering the FIR structure, as illustrated in (B).Mathematically, the numerator of H(z) has M roots (corresponding to the zeros of H) and the denominator has Q roots (corresponding to poles). The roots and poles of the system function H(z) determine it to within a constant. In particular, as the FIR always have multiple poles at zero, the system is always stable (McClellan et al., 2002
). The poles are the values of z at which H(z) is undefined (infinite). The transfer function can be written in terms of poles and zeros
where qn is the n-th zero and pn is the n-th pole. The zeros and poles are commonly complex and, when plotted on the complex plane (z-plane), they define the so-called pole-zero plot (see Figure 5
, for instance).
It follows from the above results that all the intricacies of the diffuse dynamics in complex networks can be summarized in terms of the respective poles and zeroes of the system function. Moreover, the frequency response of the system, as well as the respective cutoff frequencies, can be immediately obtained from the pole-zero representation. The cutoff frequency, summarizes to a great extent the overall function of the respective low- or high-pass filter. The frequency response is highly dependent of the network structure, as shown in Figure 3
. Indeed, the mixture of signals tends to reduce the amplitude of the frequency response and therefore the cutoff frequency. The frequency response is defined as the spectrum of the output signal divided by the spectrum of the input signal (Orfanidis, 1996
; Smith, 2007
). Observe that such formulations refer to the stationary state of the system, which is henceforth approximated by using several periods of a given input signal. The frequency response is typically characterized by the magnitude and phase of the system’s response in terms of frequency. The frequency response magnitude is given by the transfer function H(z) evaluated along the unit circle in the z-plane. In other words, the frequency response of a linear time-invariant system is equal to the Fourier transform of the impulse response (Smith, 2007
).
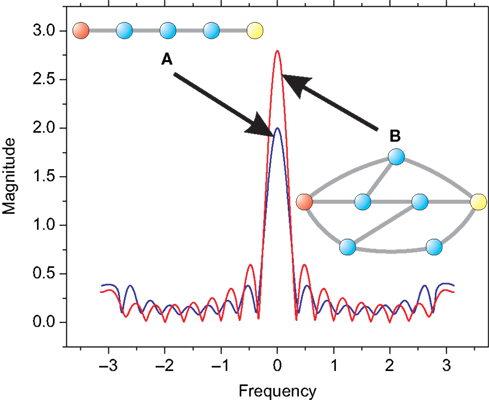
Figure 3. Two different topologies that result in specific frequency responses. The input and output nodes are represented in red and yellow, respectively. In case (A), the sequence of nodes defining a chain present a low-pass filter with cutoff frequency value equal to fc = 0.18. In the case (B), the low-pass filter presents fc = 0.13. Therefore, the first case leads to less intermixing of differently delayed versions of the signal, and consequently a less intense alteration of the original signal.
We investigate the cortical networks of macaque and cat, which contain predominantly isocortical brain regions (Sporns et al., 2007
). All data sets consist of binary matrices describing the interconnectivity between the brain regions given by inter-regional pathways. The macaque network, including 47 nodes connected by 505 links, incorporates the visual, somatosensory and motor cortical regions (Felleman and Van Essen, 1991
). The cat cortical network is derived from the matrix published by Scannell et al. (1999)
, and excludes the hippocampus, all thalamic regions and the thalamo-cortical pathways (Sporns et al., 2007
). This network contains 52 nodes and 818 links. All connections in these networks are directed.
The communities were identified by using the Walktrap method (Pons and Latapy, 2005
), which is founded on random walk dynamics. Both cat and macaque cortical networks were split into four communities characterized by modularity (e.g Newman and Girvan, 2004
) equal to Q = 0.25 for the cat, and Q = 0.28 for the macaque. The adjacency matrices of cat and macaque with the highlighted community connections are shown in Figure 4
. We named the communities in terms of their main functions. In the case of the cat, the identified communities are formed by the following cortical regions:
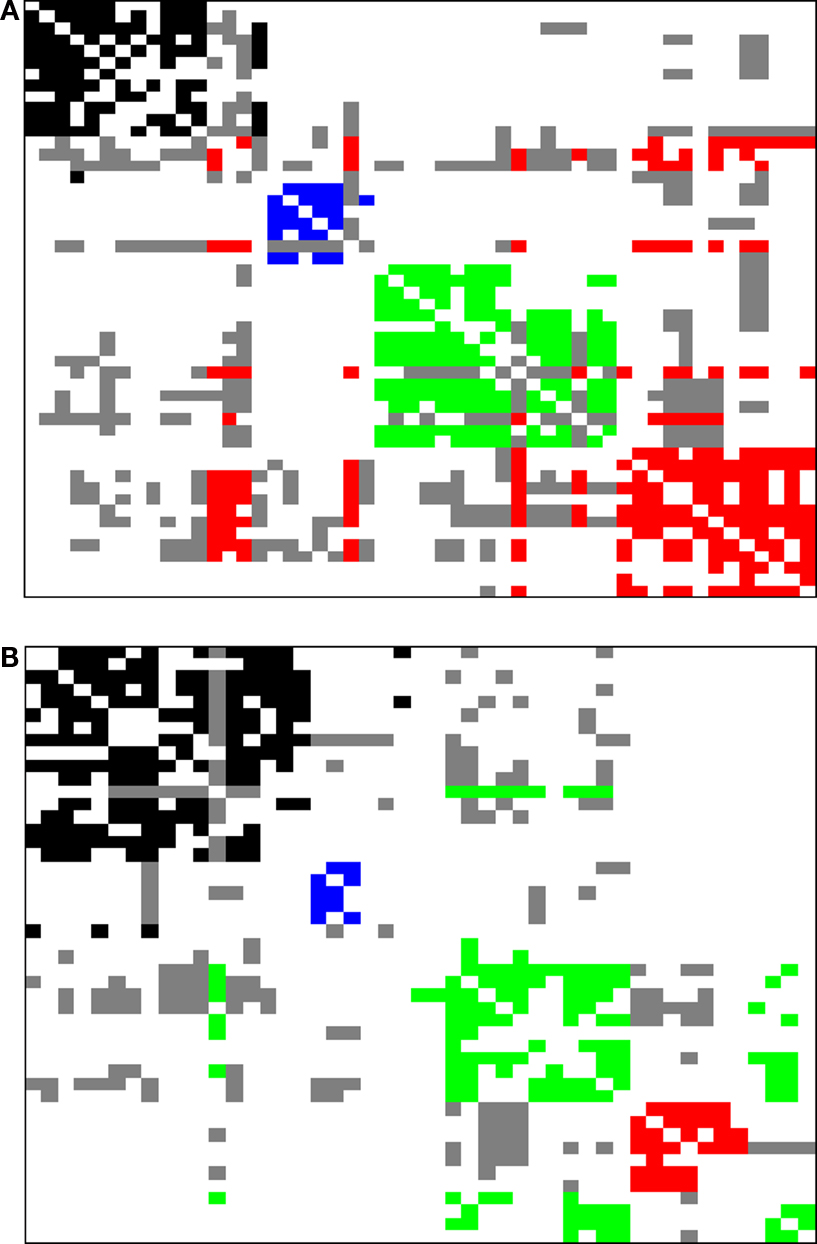
Figure 4. The adjacency matrix of (A) cat and (B) macaque. For the cat cortical network, the colors represent the following communities: (i) black: cognitive, (ii) blue: visual, (iii) green: auditory, and (iv) red: sensory system. For the macaque, (i) black: memory, (ii) blue: visual, (iii) green: motor, and (iv) red: detection of movement. Connections between communities are shown in gray.
• Cognitive: area 20b, area 7, anterior ectosylvian sulcus, posterior part of the posterior ectosylvian gyrus, medial area 6, lateral area 5B, infralimbic medial prefrontal cortex, dorsal medial prefrontal cortex, lateral prefrontal cortex, agranular insula, granular insula, anterior cingulate cortex, posterior cingulate cortex, retrosplenial cortex, area 35 of the perirhinal cortex, area 36 of the perirhinal cortex, presubiculum, parasubiculum and postsubicular cortex, subiculum, and entorhinal cortex;
• Visual: area 17, area 18, area 19, posterolateral lateral suprasylvian area, posteromedial lateral suprasylvian area, anteromedial lateral, surpasylvian area, anterolateral lateral suprasylvian area, ventrolateral suprasylvian area, dorsolateral suprasylvian area, area 21a, area 21b, area 20a, and posterior suprasylvian area;
• Auditory: primary auditory field, secondary auditory field, anterior auditory field, posterior auditory field, ventroposterior auditory field, and temporal auditory field;
• Sensory system: area 3a, area 3b, area 1, area 2, second somatosensory area, fourth somatosensory area, area 4γ, areas 4f, 4sf and 4d; lateral area 6, medial area 5A, lateral area 5A, medial area 5B, inner (deep) suprasylvian sulcal region of area 5, outer suprasylvian sulcal region of area 5.
The communities identified in the macaque cortical network are:
• Memory: area 35, area 36, area 46, area 5, insular cortex, area 6, area 7a, area 7b, anterior inferotemporal (dorsal), frontal eye field, insular cortex (granular), medial dorsal parietal, medial intraparietal, retroinsular cortex, superior temporal polysensory (anterior), superior temporal polysensory (posterior), TF, and TH;
• Visual: anterior inferotemporal (ventral), central inferotemporal (dorsal), central inferotemporal (ventral), posterior inferotemporal (dorsal), posterior inferotemporal (ventral), visual area 4, and ventral occipitotemporal;
• Motor: area 1, area 2, area 3a, area 3b, area 4, secondary somatosensory area, and supplemental motor area;
• Detection of movement: dorsal preluneate, floor of superior temporal, lateral intraparietal, medial superior temporal (dorsal), medial superior temporal (lateral), middle temporal, posterior intraparietal, parieto-occipital, visual area 1, visual area 2, visual area 3, visual area V3A, v4 transitional, and ventral intraparietal.
We start by illustrating the several concepts of the digital signal processing approach to the cortical networks. A signal of length 20 was injected into the largest hub of the cat (posterior cingulate cortex, CGp) and macaque (Visual area 4, V4) networks. Such hubs were chosen for this first experiment because they tend to act as connectors between different cortical regions (Sporns et al., 2007
). The length of the signal was chosen so as to be larger than the diameter of the cortical networks, which is equal to four in both cat and macaque. Figure 5
presents the zeros and poles obtained with respect to having the destination at each of the nodes in the cat and macaque, given this specific signal length, without time decay. The nodes in Figure 5
are color-coded according to the respective community to which they belong. Recall that the values of the zeros and poles depend only of the FIR size and the network topology between the source and destination, and not of the specific content of the injected signal. Though the positions of the zeroes are similar in both cat and macaque, a wider dispersion is observed for the latter case. Interestingly, the zeroes found for each community tend to have similar positions in the complex plan, implying that those regions receive versions of the original signal modified in similar ways.
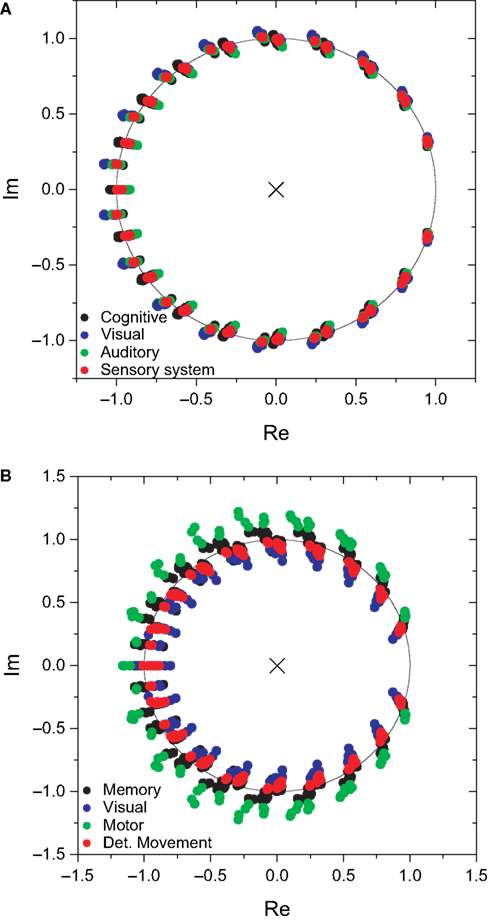
Figure 5. The zeroes and poles obtained for the cat (A) and macaque (B) cortical networks. The colors identify the communities respective to each zero. The poles is represented by ×. The unit radius circle is shown by the continuum line.
Figure 6
shows the frequency response curve (magnitude) obtained for one of the pairs of nodes of the macaque network, together with the respective zeroes, which are internal to the unit radius circle. The fact that such curves are determined by the zeroes and poles is clear from this figure, where each low valley along the frequency response is associated to a respective zero in the complex plan (Im, Re). After all, by definition the zeroes are the values of z for which the system function H(z) becomes zero. The maximum magnitude along the unit circle is obtained between the two most spatially separated zeroes, at the lowest frequencies.
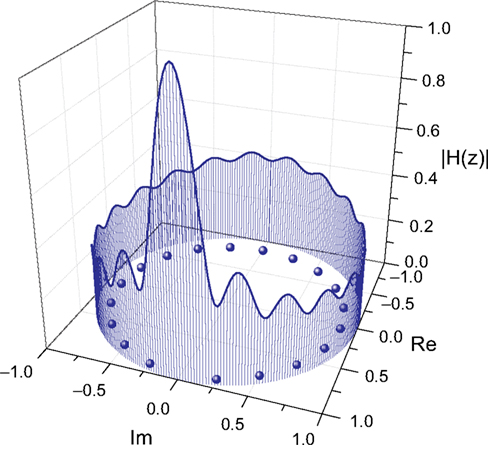
Figure 6. Relationship between the zeroes of the system function and the frequency response (magnitude). The balls represent the zeroes of the system function obtained from a signal transmitted between the region v4 and central inferotemporal regions, in the macaque cortical network. The continuum line represents the z-transform evaluated over the unit radius circle.
Figure 7
shows the frequency response curves (magnitude) obtained for the previous configuration, i.e. with the signal injected at the largest hubs of each network. The frequency responses obtained for the cat (Figure 7
A) are remarkably similar to one another. This is to a great extent a consequence of the intense uniformity and high density of the connections characterizing this specific network. A much more varied set of curves is observed for the macaque (Figure 7
B), suggesting a greater diversity of cortical organization and functioning. The curves obtained for each community tend to appear clustered, reflecting their similar zeroes positions. Both networks are characterized by intense low-pass filtering, revealing strong smoothing and mixing of the original signal.
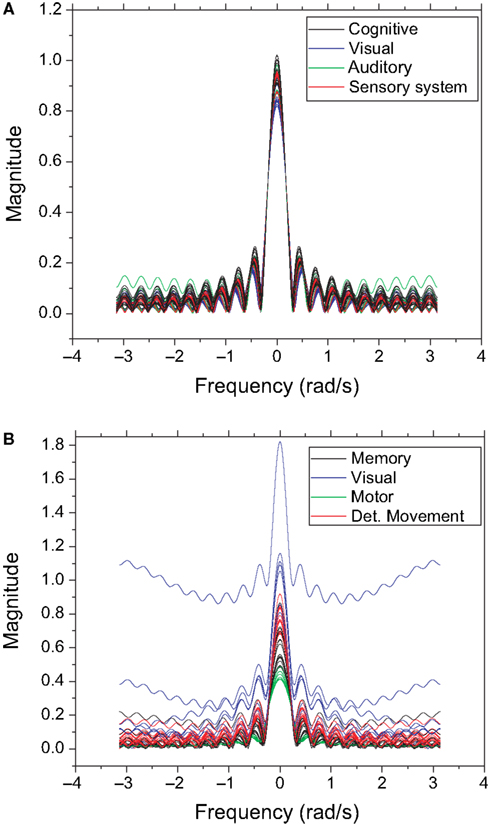
Figure 7. The frequency response without cutoff for the cat (A) and macaque (B). Each line represents the frequency response of a destination node, and each color represents a different community.
In order to analyze a more realistic situation, we considered a decay parameter that reduces the amplitude of the system state along time. In this case, the matrix Hn, which gives the probability of transition between the source and destination separated by walks of length n, and therefore defines the coefficient of the system function H(z), is given by Eq. 3. The parameter α specifies the intensity of the decay. It is henceforth adopted that α = 0.25. Figure 8
presents the zeroes and poles obtained for the cat and macaque after injecting a signal of length 20 into the CGp and V4 regions of cat and macaque, respectively. Observe that this corresponds to the same situation as above, but now with time decay. The obtained results are similar to those obtained previously (e.g. Figure 5
), except that the zeroes were displaced towards the center of the complex plan. Figure 9
shows the obtained frequency response curves (magnitude) for the cat and macaque cortical networks. It is clear from these curves that the time decay promotes diversity of filter action, as revealed by the more diverse curve shapes. Note that the time decay makes the zeroes to move away from the unit circle towards the origin in the zero-pole plot (compare Figures 5 and 8
), therefore changing the respective gain magnitude.
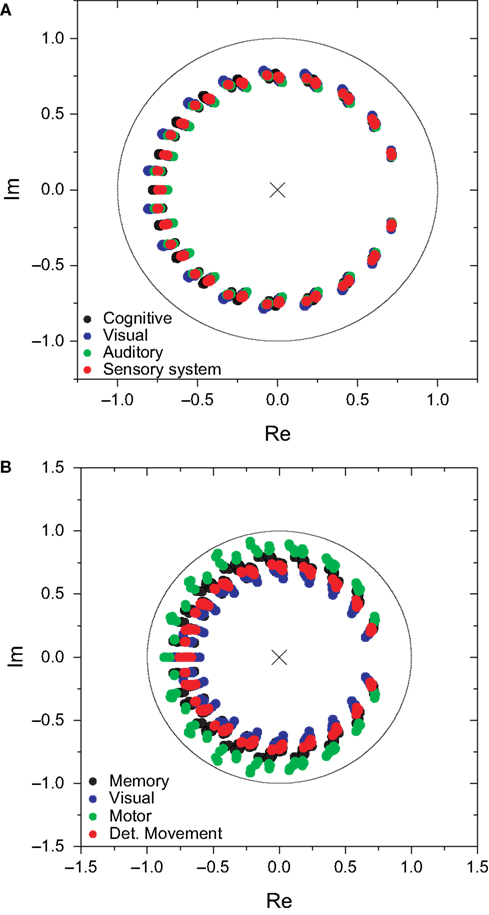
Figure 8. The zeroes and poles obtained for the cat (A) and macaque (B) cortical networks considering time decay α = 0.25. The communities are identified by different colors.
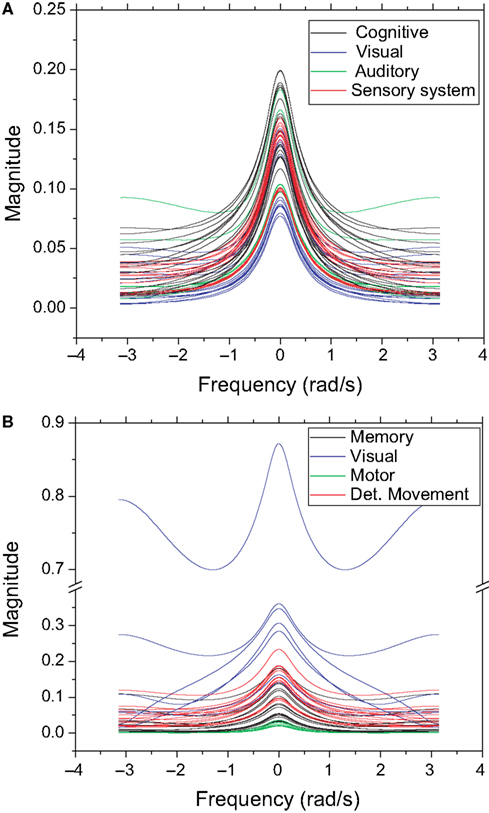
Figure 9. The frequency response considering cutoff α = 0.25 for the cat (A) and macaque (B). Each curve represents the frequency response (magnitude) of a node, while each color identifies the respective community.
The outlier in Figure 9
B, which presents the highest magnitudes, corresponds to the central inferotemporal (dorsal) region, which happens to be connected to the input region (v4) and two other hubs, i.e. posterior inferotemporal (ventral) and anterior inferotemporal (dorsal).
From each of the frequency response (magnitude) curves, we can determine the respective cutoff frequency. For generality’s sake, we assume signals being injected from all vertices of the networks (one at each simulation), instead of only from the largest hubs. Figures 10 and 11
present the distribution of the cutoff frequencies without and with decay, respectively. The cutoff frequencies obtained for both the cat and macaque networks without decay are rather similar, agreeing with the similar zeroes positions identified previously. However, the cutoff frequencies obtained in presence of time decay exhibit greater diversity, which is a consequence of the displacement of the zeros inwards the unit circle. As shown in the insets of Figure 11
, although the shape of the cutoff distributions obtained for the cat and macaque are visually similar, only a clear power-law degree distribution has been verified only for the cat. This result was obtained by applying the method proposed by Clauset et al. (2009)
, which combines maximum-likelihood fitting methods with goodness-of-fit tests based on the Kolmogorov–Smirnov statistic and likelihood ratios. In this way, we used a maximum likelihood estimators for fitting the power-law distribution of the cutoff frequencies obtained for the cat and macaque networks and calculated the p-value through the Kolmogorov–Smirnov test. The obtained p-value for the cat was equal to p = 0.2 and for the macaque, p = 0 (values larger than 0.05 indicates a power-law distribution). Thus, while the cat cortical networks present cutoff frequencies that follows a power law ( ) with coefficient γ = 3.72), the macaque does not present such feature. In fact, we tested other distributions, including exponential, log-normal, stretched exponential, and power law with cutoff, and none of the revealed to be a suitable fitting to the distribution of the cutoff frequencies of the macaque. Though the macaque and cortical networks differ with respect to the distribution of the cutoff frequencies, both networks present a high variability in the cutoff frequency values. More specifically, most nodes present small cutoffs, while a few of the present high cutoffs. Therefore, the majority of the cortical areas receive signals with a high degree of modification.
) with coefficient γ = 3.72), the macaque does not present such feature. In fact, we tested other distributions, including exponential, log-normal, stretched exponential, and power law with cutoff, and none of the revealed to be a suitable fitting to the distribution of the cutoff frequencies of the macaque. Though the macaque and cortical networks differ with respect to the distribution of the cutoff frequencies, both networks present a high variability in the cutoff frequency values. More specifically, most nodes present small cutoffs, while a few of the present high cutoffs. Therefore, the majority of the cortical areas receive signals with a high degree of modification.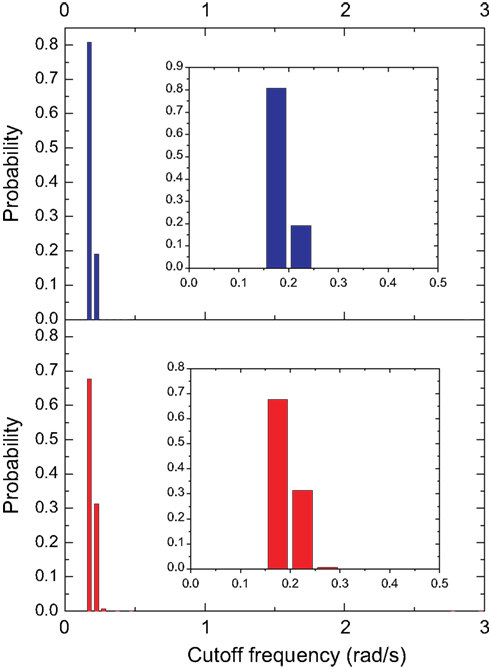
Figure 10. The distribution of the cutoff frequencies for the cat and macaque networks without decay. The inset represents the zoom of the region that concentrates the greatest part of the distribution.
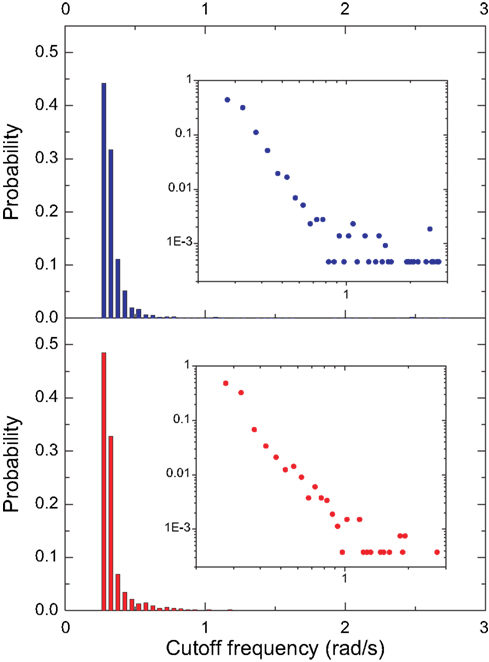
Figure 11. The distribution of the cutoff frequencies for the cat and macaque in presence of decay with α = 0.25. The insets show the respective log–log curves.
In order to perform a more detailed analysis of the cutoff frequencies characterizing each community, we determined their cumulative distribution in the macaque and cat networks. Several simulations were performed while injecting signals from all nodes in the network and monitoring the response for nodes inside each community. Figure 12
A shows the cumulative distributions of cutoff frequencies obtained for the cat cortical network with respect to each community, considering time decay (the situation without decay is not discussed here because of its uniform response). The signals arriving at the sensory system, which include the somatosensory areas, are heavily filtered, indicating greater respective modifications and blending of differently delayed versions of the original signal. This suggests that signals coming from sensory modalities such as touch, temperature, proprioception (body position), and nociception (pain) are strongly intermixed, eliminating higher frequencies. The community involved in cognition, which includes the ectosylvian gyrus, prefrontal cortex, insula, cingulate cortex, perirhinal cortex and entorhinal cortex also presents small cutoff frequency and therefore receives strongly mixed versions of the original signal. On the other hand, communities 2 and 3, involved in perception of complex motion (Rudolph and Pasternak, 1996
) and representing the auditory field, respectively, tend to receive signals with the overall smallest modifications, and therefore smallest degrees of modifications and blending.
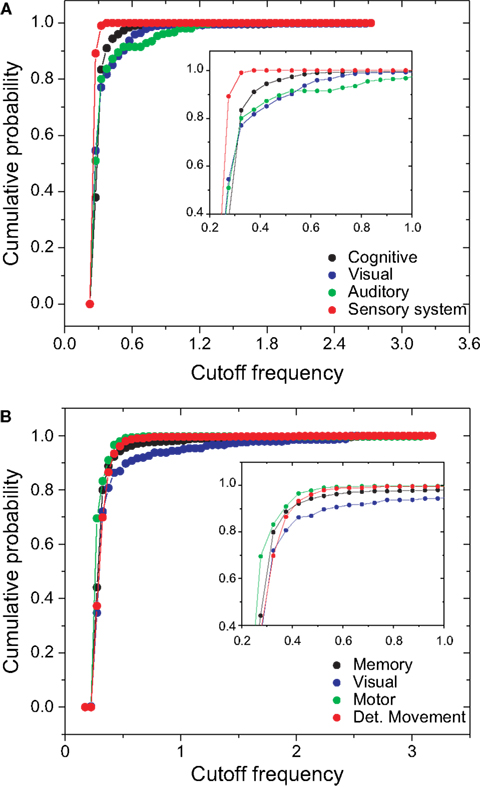
Figure 12. The cumulative distribution of the cutoff frequencies for the cat (A) and macaque (B) communities considering time decay with α = 0.25.
In the case of the macaque cortical network, shown in Figure 12
B, the visual community, representing the inferotemporal and ventral occipitotemporal areas, receives signals with the lowest level of changes, with the highest cutoff frequencies. The inferotemporal area is thought to be the final visual area in the ventral stream of cortical areas responsible for object recognition (Tanaka, 1996
). The same effect is observed in the occipitotemporal cortical areas of the macaque, which are known to be important for normal object recognition and for selective attention (Walsh and Perrett, 1994
). On the other hand, the motor area community, i.e. motor and somatosensory areas, which are highly integrated one another (Kaas, 2004
), tends to receive highly modified versions of the original signal. The movement detection community, which incorporates the somatosensory cortex, perirhinal cortex, insular cortex, parietal cortex, intraparietal cortex, polysensory and frontal eye field, also receives signals with high levels of alterations and intermixing.
In addition to the analysis of signal transmissions and intermixing with respect to communities, we can also systematically investigate the transmission of signals between different cortical areas. The cutoff frequencies were determine between all pairs of nodes in the cat and macaque networks. We determined the 20 connections that result in the highest cutoff frequencies for the cat and macaque cortical networks, therefore corresponding to the smallest levels of signal alternations and intermixing. Table 1
presents the input and output nodes, as well as the respective communities that they are included, yielding the highest cutoff frequencies among all combinations of nodes for the cat cortical network. The suprasylvian area (localized in the visual community) is the dominant motion-processing region of the parietal cortex (Shen et al., 2006
), being sensitive to texture and the distance between edges defined by motion (Robitaille et al., 2008
). Areas in the cognitive community are involved in cognitive performance (infralimbic medial prefrontal cortex (van Aerde et al., 2008
)), specific roles in the cognitive functions and pathological deficits of the hippocampal formation (subiculum area de la Prida et al., 2006
), as well as spatial memory which helps to reduce errors when navigating in the dark (retrosplenial cortex Cooper et al., 2001
). The highest cutoffs are therefore observed for transmissions between regions involved mainly in visual, cognitive and audio processing.
Table 2
shows the 20 connections that result in the highest cutoff frequencies for the macaque cortical network. These regions are mainly related to object recognition and movement detection. Areas in communities 1 and 2, which include the visual, occipitotemporal and inferotemporal areas, are involved in image processing and object detection and recognition (DiCarlo and Maunsell, 2003
; Felleman et al., 1997
). The areas in the movement detection community are also related to visual tasks. For instance, the posterior intraparietal area is involved in visually guided, object-related and hand movements (Shikata et al., 2003
). The ventral posterior areas are also related to visual processing. At the same time, areas in memory community participate in object recognition and memory (e.g. the insular cortex (Bermudez-Rattoni et al., 2005
)). Therefore, interconnections between visual processing-related regions in the macaque cortex tend be characterized by the smallest low-pass filtering modifications. This fact is related to a relatively small mixture of signals between the source and visual reals. A given cortical region presents a high cutoff frequency because there are little alterations of signals going from the source to such region. The alterations are mainly caused by dependent walks, where signals tend to mix. Therefore, the more independent the walks between the source and destination, higher the frequency cutoff.
The relationship between brain organization and function corresponds to one of the most fundamental and challenging issues in neuroscience currently. Linear dynamics approaches, such as synchronization (e.g. Zemanova et al., 2008
; Zhou et al., 2006
, 2007
), have been extensively considered in order to investigate the structure-function paradigm in the brain. For instance, it has been observed that the onset of epileptic seizures can be induced by addition of random connections that tend to decrease the small-world character of the brain (e.g. Nadkarni and Jung, 2003
; Percha et al., 2005
).
In the current work, we described a methodology to investigate diffusive signal propagation and blending between pairs of areas in cortical networks in terms of digital signal processing concepts and methods. Under these assumptions, the whole dynamics of brain propagation between each pair of nodes (source and destination) can be described by the convolution between the input signal and the probabilities of transition for walks of different lengths between the respective source and destination, a processing which can be neatly summarized in terms of finite-impulse-response filters (FIRs). We applied the z-transform in order to effectively perform these convolutions in terms of products. This approach also paves the way to the recovery, under certain conditions, of the original signal given the respective FIR structure. In addition, the z-transform approach allows the identification of the zeroes and poles of the system function (the z-transform of the finite impulse response). This is important because the zeroes and poles define completely the system response, and therefore can be used for the characterization of the functionalities implemented by the diffusion in the respective cortical topologies.
The obtained dynamics for the cat and macaque cortical networks was found to correspond to low-pass filtering, which tends to attenuate high-frequency harmonic components and allow the lower frequency components to pass with little or no alteration. In this way, the signal alterations undergone between the source and destination node can be summarized in terms of their respective FIR cutoff frequency. By analyzing signals received at each community, it was found that the areas involved in object recognition tended to suffer the smallest modifications in both the cat and macaque networks. In addition, in the cat, the areas related to sound processing were also verified to receive signals with smaller modifications than the other regions.
The extension of the current work to other cortical networks, such as human and rat, is immediate. In addition, it would be interesting to investigate how failures and attacks to the original networks induce changes in the respective filtering. The validation of the proposed approach involves monitoring several specific brain regions while a known input is fed into a giver region. For instance, a known stimulus can be applied in the auditory system of a macaque and be measured at different brain regions by electrode insertion. A comparison between the input and output signals in such experiments could be used to validate our theory.
The authors declare that the research was conducted in the absence of any commercial or financial relationships that could be construed as a potential conflict of interest.
Luciano da Fontoura Costa is grateful to FAPESP (05/00587-5) and CNPq (301303/06-1 and 573583/2008-0) for financial support. Francisco A. Rodrigues acknowledges FAPESP sponsorship (07/50633-9).