Rasch-built measure of pleasant touch through active fingertip exploration
- 1 Institute of Neuroscience, Université Catholique de Louvain, Brussels, Belgium
- 2 Department of Occupational Therapy, Paramedical Category, Haute Ecole Louvain en Hainaut, Montignies-sur-Sambre, Belgium
Background: Evidence suggests that somatic sensation has a modality for pleasant touch. Objective: To investigate pleasant touch at the fingertip level (i.e., glabrous skin site) through the elaboration of a linear unidimensional scale that measures (i) various materials according to the level of pleasantness they elicit through active fingertip explorations and (ii) subjects according to their pleasantness leniency levels. Subjects: We enrolled 198 healthy subjects without any neurological disease. Methods: Blindfolded subjects actively explored 48 materials with their index fingertips and reported the perceived pleasantness of each on a 4-level scale. The fingertip moisture levels on each subject were measured before the experimental session. Data were analyzed using the Rasch model. Results: We elaborated unidimensional linear scale that included 37 materials according to their pleasantness of touch. The pleasantness level of 21 materials was perceived differently, depending on the fingertip moisture levels of the subjects. Conclusion: Based on our findings, we formulated a Pleasant Touch Scale. Fingertip moisture levels appeared to be a major factor for (un)pleasant feelings during active exploration.
Introduction
The hand is the key organ of the sense of touch (Lundborg, 2005), making sensation fundamental to hand function. Four major modalities of somatic sensation have been described: (i) discriminative touch, (ii) proprioception, (iii) nociception, and (iv) temperature sense (Lundborg, 2005), although studies over the last decade have suggested the existence of a supplementary modality, namely pleasant touch (Johansson et al., 1988; Nordin, 1990; McGlone et al., 2007; McGlone and Reilly, 2010).
Studies investigating pleasant touch at hairy skin sites have suggested that C-tactile nerve fibers (CT-fibers) play a fundamental role in the detection and transmission of pleasant stimuli applied to the skin (Olausson et al., 2002, 2010; McGlone et al., 2007; Essick et al., 2010; Morrison et al., 2011). These CT-fibers were identified during microneurography recordings from infra- and supraorbital nerves (Johansson et al., 1988; Nordin, 1990). CT-fibers were later observed in other hairy skin areas, such as the arm (Vallbo et al., 1999). However, they seem to be missing from glabrous skin sites, such as the fingertips (McGlone and Reilly, 2010; Olausson et al., 2010). Studies investigating pleasant touch at glabrous skin sites frequently used either magnitude estimation (ME) or categorical rating procedures. The results of such studies suggested that soft and smooth materials were perceived as more pleasant than rough materials (Major, 1895; Ripin and Lazarsfeld, 1937; Ekman et al., 1965; Verrillo et al., 1999).
Pleasant touch may be described as a positive sensation induced by cutaneous stimulation. Hence, pleasant touch cannot be directly observed or measured and may be regarded as a latent variable rather than an observable variable. Observable variables can be directly quantified and typically generate linear measures (e.g., the grain size of sandpapers can be measured in micrometers). Latent variables can only be measured indirectly (e.g., pain, intelligence, or pleasant touch), generally by using a questionnaire or a set of stimuli (Thurstone, 1928; Rasch, 1960; Tesio et al., 2007). Questionnaires usually provide ordinal scores, rather than linear scores, with no constant unit. For example, pleasant touch could be assessed by presenting various stimuli to a subject and asking the subject to rate these stimuli on the basis of a 4-level response scale, e.g., “very unpleasant” (scored 0), “unpleasant” (scored 1), “pleasant” (scored 2), and “very pleasant” (scored 3). Two major issues would, however, prevent the widespread uniform use of numbers resulting from such a response scale. First, the scores would be ordinal, meaning that equal differences (e.g., from scores of 0–1 and 2–3) would not necessarily represent the same change/quantity of pleasant touch. Second, the scores attributed to the stimuli would not necessarily be unidimensional; thus, adding these individual scores may result in a total score that conceals numerous unrelated dimensions (e.g., color, hardness, roughness, temperature, mental representation). As a consequence, quantitative comparisons of these ordinal scores are not possible (Merbitz et al., 1989; Wright and Linacre, 1989). Nevertheless, probabilistic measurement models can be used to determine linear and unidimensional measures from ordinal scores, the most promising being the Rasch model (Rasch, 1960). The Rasch model is a prescriptive model, rather than a descriptive one, requiring that solely the location of the item (e.g., the amount of pleasantness elicited by a stimulus) and the ability of a subject (e.g., the “satisfaction level” induced by perception of a stimulus) determine the probabilities of category choices on the response scale. When applied to pleasant touch, this measurement framework can be used to construct a linear and unidimensional Pleasant Touch Scale assessing (i) each stimulus according to its level of pleasantness and (ii) each subject according to his/her leniency level, defined as a subject’s “satisfaction level” induced by perception of the stimulus.
The aim of this study was to investigate pleasant touch at a glabrous skin site through the elaboration of a gradual hierarchy of stimuli eliciting pleasant touch (i.e., the Pleasant Touch Scale). This unidimensional linear scale was designed (i) to quantify the pleasantness level elicited by various materials during direct active fingertip explorations and to grade these materials by pleasantness level and (ii) to quantify the pleasantness leniency level of subjects and to grade them by pleasantness leniency level. The elaboration of such a Pleasant Touch Scale may contribute to knowledge of pleasant touch at glabrous skin sites. Indeed, the quantitative information obtained by this scale may provide objective insight of the characteristics (of subjects and/or materials) that influence pleasant touch. Consequently, future research on pleasant touch may refer to such scale and specifically examine the characteristics that influence pleasantness or unpleasantness.
Materials and Methods
The present study was approved by the Biomedical Ethical Commission of the Faculty of Medicine of the Université catholique de Louvain.
Subjects
We enrolled 198 healthy subjects, 74 males and 124 females, aged between 20 and 70 (mean age, 39.5 ± 13.4 years).
Instrument
To elaborate the Pleasant Touch Scale, we selected 48 materials, encountered in everyday life, based on three perceptual tactile dimensions (i.e., hard vs. soft, rough vs. smooth, and sticky vs. slippery; Hollins et al., 1993, 2000; Yoshioka et al., 2007). Of these 48 stimuli, 26 had been used in studies dealing with the discriminative aspect of touch (Major, 1895; Hollins et al., 1993, 2000; Bergmann Tiest and Kappers, 2006; Yoshioka et al., 2007; Yoshioka and Zhou, 2009). The remaining 22 materials included everyday life materials such as baking paper, cast, cling film, and tights. Each selected material was glued onto an aluminum plate, 77 mm long and 32 mm wide.
Procedure
Before each experiment, the index fingertip moisture level of each subject was measured using the Corneometer® CM 825. The subjects were blindfolded, and each of the 48 materials was placed in random order in front of the subjects. The subjects were instructed to place the pulp of their dominant index finger on the selected material and to explore its surface through slow lateral sliding movements. No specific instructions on the normal force to apply to each material or on the speed of sliding were provided. Exploration of each material could be repeated as many times as required, after which each subject was asked to rate the material’s pleasantness level on a 4-level scale: (0) very pleasant, (1) pleasant, (2) unpleasant, or (3) very unpleasant (Figure 1). Subjects hesitating between categories (1) pleasant and (2) unpleasant were instructed to choose “unpleasant” as soon as the material was not perceived as being pleasant or “pleasant” as soon as the material was not perceived as unpleasant. Each subject’s total score could range from 0 (i.e., all materials rated as very pleasant, 48 × 0) to 144 (i.e., all materials rated as very unpleasant, 48 × 3). Similarly, the total score of each material could range from 0 (i.e., all subjects rated it as very pleasant, 198 × 0) to 594 (i.e., all subjects rated it as very unpleasant, 198 × 3).

Figure 1. Illustration of the experimental procedure. The subject was seated in front of the material fixation device, and 48 materials were successively explored with the pulp of the index finger.
Data Analysis
Data were analyzed using the Rasch Unidimensional Measurement Models software (RUMM2020). The rating scale model was preferred to the partial credit model, since it yields better fit of the data to the model (Wright, 1999).
The Rasch model is a probabilistic model elaborated by the Danish mathematician Rasch (1960). The Rasch model allows the elaboration of unidimensional and linear scales for latent variables (e.g., pain, intelligence, or pleasant touch) by locating subjects and items along a single underlying linear scale (Rasch, 1960; Wright and Stone, 1979; Tennant et al., 2004; Tennant and Conaghan, 2007). This model was originally elaborated to analyze dichotomous data (i.e., two response categories per item such as “yes/no” or “pass/fail”). The model formulates the probability of success of a subject with a given ability on an item with a given difficulty. No other parameter besides the subject’s ability (i.e., his/her location) and the item’s difficulty (i.e., its location) is needed to determine the expected response. In this sense the model is unidimensional as it involves only one latent dimension of the subjects. Later on, the model was expanded to accommodate polytomous response formats (i.e., more than two response categories per item such as “very low/low/moderate/high/very high”; Wright and Masters, 1982; Andrich, 1988). For polytomous response formats, the model prescribes that the probability of endorsing any response to an item depends solely on the subject’s ability, the item’s difficulty, and the threshold difficulties, where thresholds (i.e., “boundaries” between successive categories) are the locations on the underlying scale at which successive responses become the most probable if subjects of increasing ability answer a given item (Andrich, 1978a,b; Wright and Masters, 1982; Tennant et al., 2004; Tennant and Conaghan, 2007).
When applied to touch related pleasantness perception, the Rasch model prescribes that the probability that a subject selects a given response category (i.e., pleasantness category) for a given item (i.e., material) depends solely on (i) the subject’s pleasantness leniency level, (ii) the material’s pleasantness level, and (iii) the threshold locations. Based on the estimated subject leniency and the material pleasantness, the expected response of a subject to an item can be computed by the model. The similarity between the observed and expected responses to any item is reported by the software, through a χ2 fit statistic (Andrich et al., 2004). Materials with a significant χ2 value indicate that the difference between the observed and expected responses was too high to be random; they do not fit the unidimensional scale defined by the other materials and can be eliminated. In addition, the hypothesized order of the response categories (i.e., “very pleasant,” “pleasant,” “unpleasant,” and “very unpleasant”) must be empirically verified. Items presenting disordered thresholds between successive response categories indicate that the subjects were unable to discriminate the four response categories, allowing these items to be eliminated (Andrich, 1996). The resulting scale is defined in logits (log-odds-units), a unit defined as the natural logarithm of the odds of success (i.e., the pass/fail probability ratio) of a subject to an item and which is constant throughout the measurement scale. Consequently, at any level of the measurement scale, a 1-logit difference in an item’s pleasantness level indicates a constant ratio of its odds of being pleasant (e1 = 2.71) for any subject, whereas a 2-logit difference indicates the odds of being pleasant at a ratio of e2 = 7.39, etc. The origin of the scale is conventionally set at the average material pleasantness level.
Material Selection
Based on the 48 original materials, successive analyses were performed to select materials (i) presenting ordered response categories and (ii) fitting a unidimensional scale.
Ordered response scale
The subjects were asked to report their pleasantness perception on a 4-level scale: (0) very pleasant, (1) pleasant, (2) unpleasant, or (3) very unpleasant. To control the order of response categories, whether successive categories represent decreasing pleasantness levels was verified for each material. If the response categories were ordered, the thresholds were located in the anticipated order. Provided that the anticipated order of response categories was verified, less lenient subjects should have selected a higher response for any given material, whereas subjects selecting a higher response to a given material should be less lenient. However, a reversed order of the thresholds between successive response categories indicated that the response scale was not used as expected (Tennant, 2004). If the categories were not distinguished by the sample, the concerned categories were collapsed into a single category (Tennant and Conaghan, 2007).
Unidimensional scale
Different statistic methods are available to test the fit of the data to the model requirements. This study used item χ2 fit statistics. In this statistical method, the squared standardized residuals (i.e., the difference between the response expected by the model and the observed response by the subject) of all subjects are summed, leading to a χ2 value for each material. Subsequently, a significance test was used to evaluate whether the χ2 was too high to be attributed to random variation. A p-value of the item fit statistics of <0.05 indicated a misfitting item that may threaten the concept of unidimensional (Tennant and Conaghan, 2007). There are two types of misfits, underfit and overfit. Underfitted items violate the unidimensionality concept as the subjects’ answers to these items are influenced by variables other than the measured one (Penta et al., 2005). An overfitted item does not necessarily represent a threat to the unidmensionality concept (Penta et al., 2005). Indeed, the response patterns of overfitted items are more deterministic than those predicted by the Rasch model. However, in contrast to underfitted items, the pleasantness levels of overfitted items can be predicted from each subject’s pleasantness leniency level (Penta et al., 2005). As a consequence, only underfitted items (i.e., materials) were eliminated from this study.
Differential Item Functioning
Once satisfactory metric properties were achieved for the whole sample, the invariance of the pleasantness hierarchy of items within the sample was tested through a differential item functioning (DIF) analysis. DIF occurs if subjects of distinct subgroups (e.g., males vs. females) with the same leniency level perceive any given material differently (Tennant et al., 2004). In this study, DIF was investigated according to (i) gender, (ii) age (≤37 vs. >37 years, the median age of the subjects), and (iii) fingertip moisture level (≤70 vs. >70 arbitrary units, or “a.u.,” the median moisture level). To investigate DIF, each subgroup was divided into five class intervals (CI) of decreasing pleasantness leniency levels, and two-way analysis of variance (ANOVA) was computed on the standardized residuals of the different CIs (Andrich et al., 2004). Factors analyzed in two-way ANOVA included (i) subject subgroups (e.g., males vs. females) and (ii) CIs of decreasing pleasantness leniency. A significant subgroup’s main effect indicated a uniform DIF, occurring if the standardized residuals change significantly from one subgroup to another and evolve in parallel. In such a case, the relative difficulty of the item would differ between these subgroups (Smith, 1992). An item displaying a uniform DIF may be deleted or split into as many specific items as there are subject subgroups; each specific item would therefore have a difficulty peculiar to the corresponding subject’s subgroup (Tennant et al., 2004).
Reliability of the Pleasant Touch Scale
To assess the reliability of the Pleasant Touch Scale, a separation reliability index was computed for the items and subjects (Wright and Masters, 1982). The Item Separation Index enables the number of material pleasantness levels that may statistically be distinguished within the sample to be calculated. The Person Separation Index enables the number of statistically distinguished subject pleasantness leniency levels using the selected materials to be calculated. A higher item/person separation index indicates better separation of the measures (Wright and Masters, 1982).
Results
Successive Rasch analyses were performed to construct the final Pleasant Touch Scale. Of the 48 original materials (hereafter items), 11 showed disordered thresholds, indicating that our 198 subjects were unable to discriminate among the four levels of pleasantness for these items. As the subjects were unable to discriminate between “unpleasant” and “very unpleasant,” these categories were merged into one category, “unpleasant,” and the entire data set was reanalyzed using a 3-level scale: (0) very pleasant, (1) pleasant, and (2) unpleasant. Two items, however, adhesive UHU® Patafix and microfiber dust cloth, still presented disordered thresholds and were deleted from further consideration. Rasch analysis showed that six items (i.e., tissue carpet, thermal isolation, sponge, antislide carpet, velcro, and plastic door mat) did not fit a unidimensional scale and were therefore also eliminated, which resulted in a 40-item scale. No significant DIF based on age and gender was observed for any item, but invariance investigation of the items according to the subjects’ levels of fingertip moisture showed that 17 items shared a common location for low and high moisture level subgroups, whereas the other 23 items presented a DIF. These 23 items elicited different levels of pleasantness when touched by subjects with dry (i.e., ≤70 a.u.) and wet (i.e., >70 a.u.) skin. Each of these 23 items was therefore split into two different items with locations specific to fingertip moisture level, one each for subjects with dry and wet skin. After the splitting procedure, four split items and one common item showed underfitting (i.e., teflon high moisture, teflon low moisture, crepe paper high moisture, crepe paper low moisture, and corduroy), and were therefore removed. Consequently, the final Pleasant Touch Scale includes 58 items, of which (i) 16 items share a common location in low and high moisture level subgroups and (ii) 42 items have locations specific to the fingertip moisture level.
Metric Properties of the Pleasant Touch Scale
The calibration of the 58 items of the Pleasant Touch Scale is presented in Table 1, in which the items were ordered from the most unpleasant at the top (“sandpaper_LM”) to the most pleasant at the bottom (“paper_160 g/m2”). Items followed by “_LM” and “_HM” are split items with pleasantness locations specific to subjects with low and high fingertip moisture levels, respectively. The pleasantness levels of the 58 materials covered a range of 6.91 logits (range: −4.47 to 2.44 logits), indicating that the odds of pleasing any particular subject was in a ratio higher than 1000:1 (i.e., e6.91:1) between the most and least pleasant items. This pleasantness range was arbitrarily centered at 0 logits. Table 1 also shows the pleasantness level of each material expressed in percent, with 0 and 100% indicating the least and most pleasant materials, respectively. Furthermore, the table presents the standard errors (SE) associated with the estimations of the pleasant levels of the different items (mean: 0.18 logits; range: 0.36 logits). The item fit statistics (χ2 with associated p-values) indicate that all 58 items contribute to the definition of a unidimensional scale. Finally, Table 1 also shows the perceptual tactile dimension of each material.
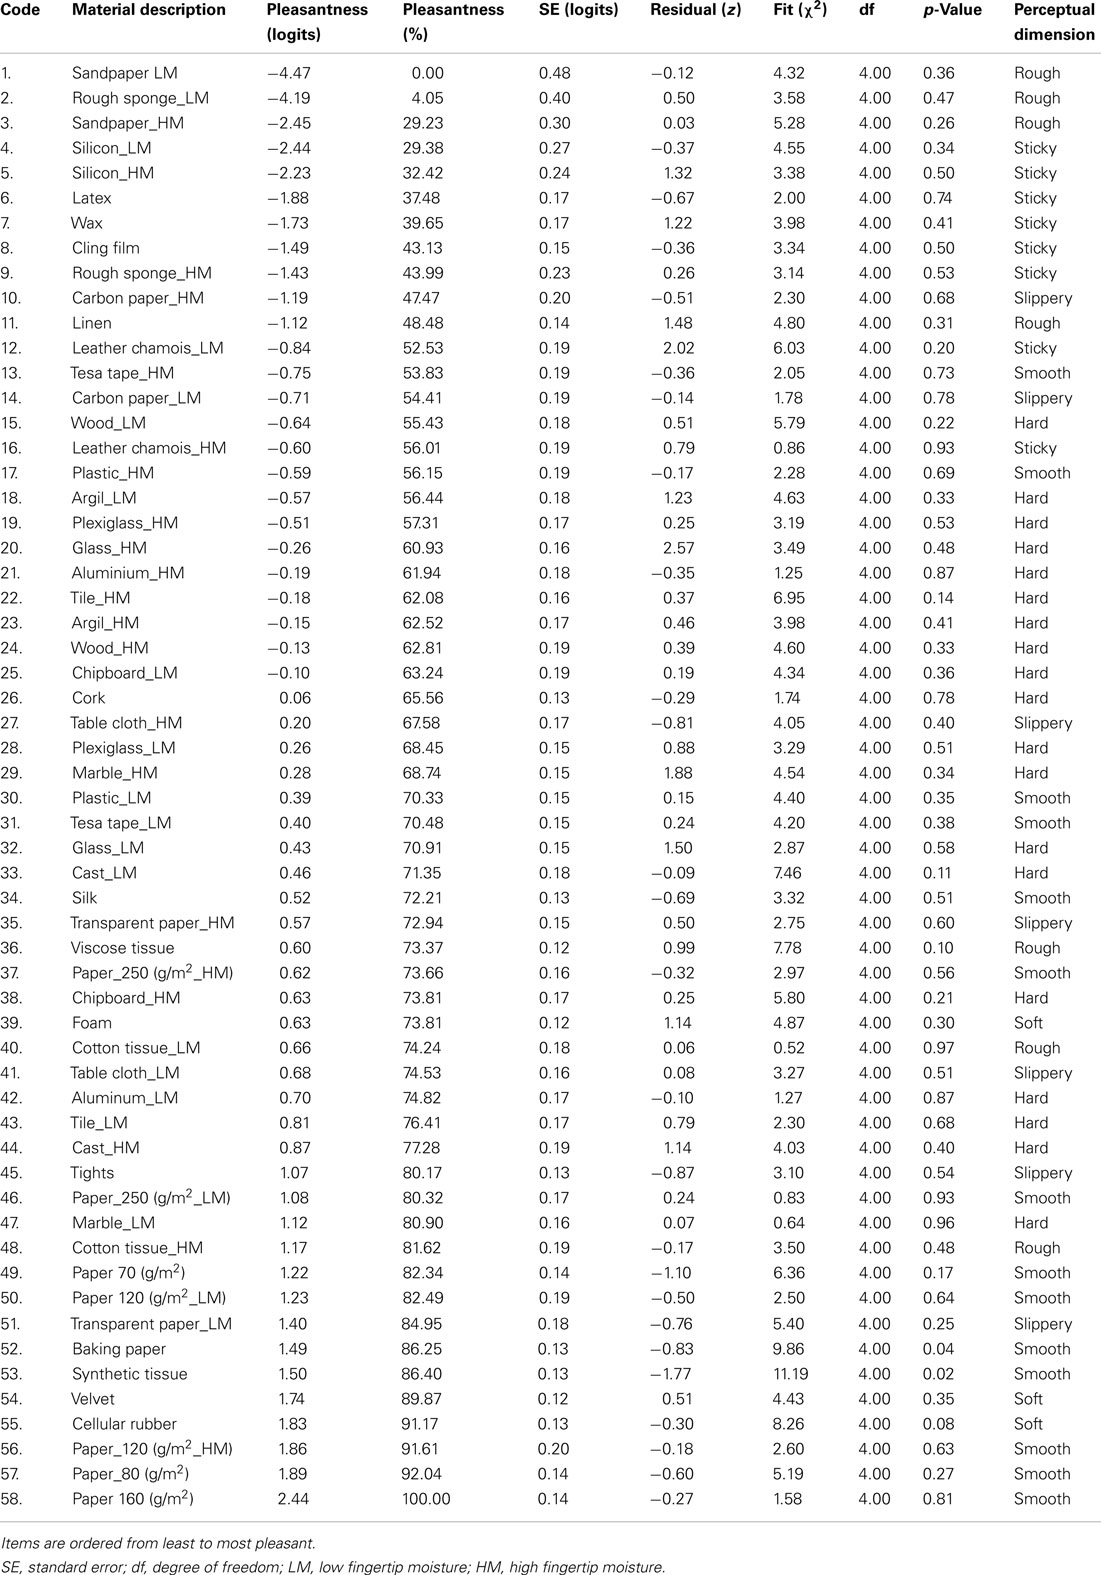
Table 1. Description of materials of the pleasant touch scale.
Description of the Pleasant Touch Scale
Figure 2 illustrates the structure of the final Pleasant Touch Scale. The lower part shows the relationship between the total ordinal raw score and the subjects’ linear pleasantness leniency levels. As the data were analyzed using a 3-level scale, the subjects’ ordinal raw scores ranged from 0 (i.e., subjects finding all 58 materials very pleasant, 0 × 58) to 116 (i.e., subjects finding all 58 materials unpleasant, 2 × 58). The relationship between total score and pleasantness leniency levels was roughly linear for total scores between 25 and 90. In this area, an increase of 1 point in total raw score represents always the same progression in pleasantness measures. For example, increases from 40 to 41 and from 60 to 61 correspond to increases in pleasantness leniency of 0.05 logits. Outside this central range, a 1 point increase in total ordinal raw score did not correspond to the same progression in linear pleasantness measures. Indeed, an increase in total raw score from 114 to 115 corresponded to 0.55 logits, whereas an increase from 5 to 6 corresponded to 0.28 logits. This large difference in the progression of the pleasantness leniency levels for a same increase in total ordinal raw score illustrates the non-linearity of the raw scores (Wright and Stone, 1979; Arnould et al., 2004).
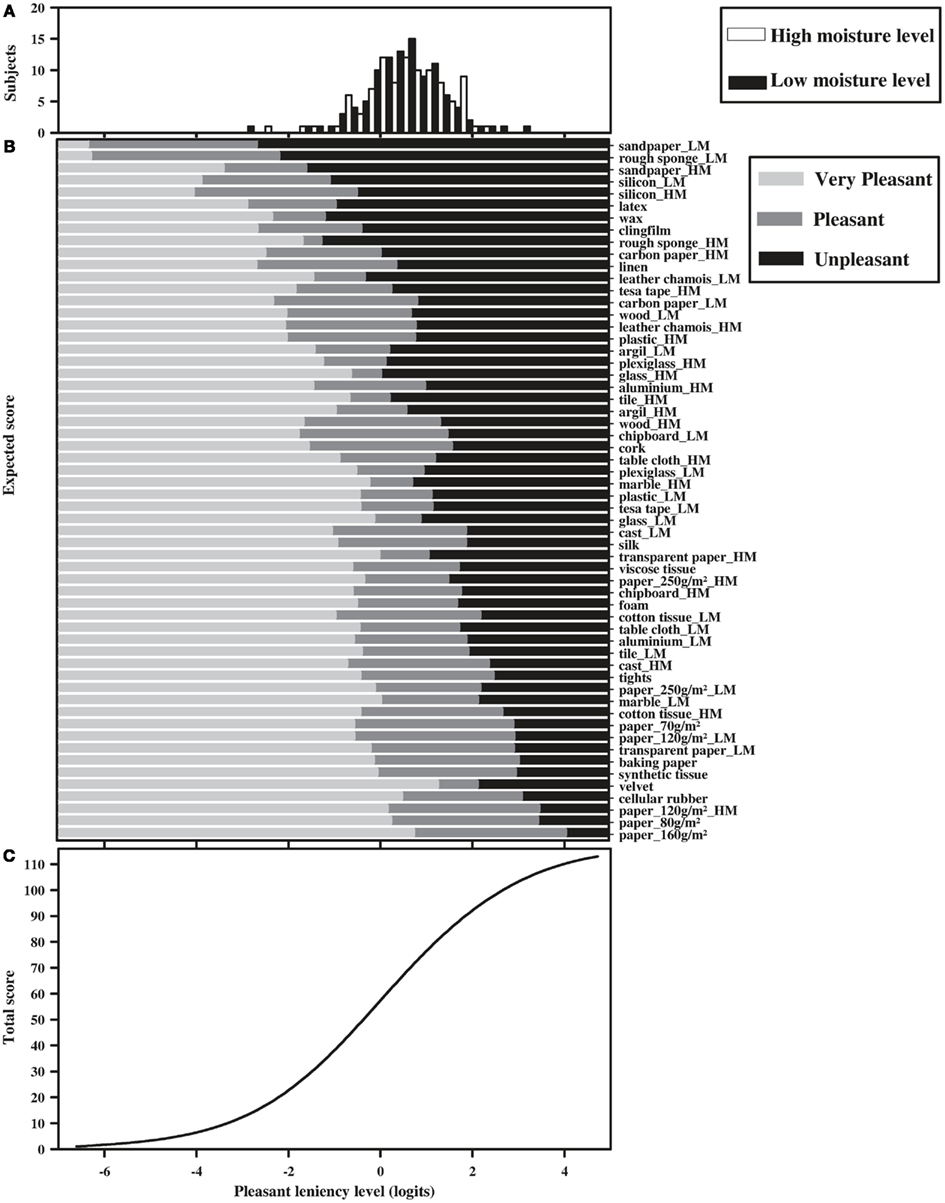
Figure 2. (A) Subject distribution according to pleasantness leniency levels (expressed in logits). The blank bars correspond to subjects with high fingertip moisture and the black bars to subjects with “low fingertip moisture. (B) Classification of materials by pleasantness, increasing from top to bottom. Items followed by “_LM” and “_HM” are split items with pleasantness locations specific to subjects with low and high fingertip moisture levels, respectively. (C) Relationship between the total ordinal raw score and linear pleasantness measures.
The upper part of Figure 2 shows that the distribution of pleasantness leniency levels in subjects ranged from −2.62 to 3.42 logits, indicating that their odds of leniency levels are in a ratio over 400:1 (i.e., e6.04:1) between the most and the least lenient subject. Subjects on the left represent the most lenient (i.e., “the most easy to please”) and those on the right represent the least lenient (i.e., “the least easy to please”). The average subject location was 0.68 logits (SD: 0.88 logits), indicating that overall, the subjects found the materials more unpleasant than pleasant. In addition, the distribution shows that the pleasantness leniency of subjects with wet fingers (blank bars in Figure 2) and dry fingers (black bars in Figure 2) alternate on the Pleasant Touch Scale. This indicates a lack of relationship between fingertip moisture and pleasantness leniency [t-test, t = −0.849; p (two-tailed) = 0.397].
The middle part of Figure 2 shows items of the Pleasant Touch Scale, representing the most unpleasant at the top to the most pleasant at the bottom. Each line presents the most probable response of the subjects to the different items of the Pleasant Touch Scale as a function of their pleasantness leniency levels. For example, to find the material “tights” very pleasant, a subject would have to have a leniency level of ≤−0.378 logits. A subject with a leniency level ≥2.516 logits would be expected to find this same material unpleasant. Subjects with leniency levels between −0.378 and 2.516 logits would be expected to find “tights” pleasant.
The expected responses of the subjects to each item are obtained by comparing the pleasantness leniency levels of the subjects to the pleasantness level of each item. For example, a subject with a total raw score of 58, corresponding to a pleasantness leniency level of 0 logit, has the highest probability of finding (i) items 1 (“sandpaper_LM”) through 9 (“rough sponge_HM”) and 12 (“leather chamois”) unpleasant, (ii) items 10 (“carbon paper_HM”) through 11 (“linen”), 13 (“tesa tape_HM”) through 46 (“paper 250 g/m2_LM”), and 48 (“cotton tissue_HM”) through 53 (“synthetic tissue”) pleasant, and (iii)items 47 (“marble_LM”) and 54 (“velvet”) through 58 (“paper_160 g/m2”) very pleasant (see middle part of Figure 2).
Reliability of the Pleasant Touch Scale
The material separation coefficient was equal to 0.98, indicating that 10.14 material pleasantness levels could be statistically distinguished by the sample. The reliability subject separation coefficient was equal to 0.88, indicating that 3.97 subject pleasantness leniency levels could be statistically distinguished using the selected materials (Wright and Masters, 1982).
Discussion
We have described here the construction of a linear, unidimensional Pleasant Touch Scale, which quantifies (i) the level of pleasantness elicited in subjects by various materials during direct active fingertip explorations and (ii) the pleasantness leniency level of subjects. To construct this scale, 198 healthy subjects successively explored 48 different materials and reported their perception of pleasantness using a 4-level pleasantness scale. The collected data were analyzed using Rasch model. The initial analysis indicated that subjects did not discriminate between “unpleasant” and “very unpleasant.” Consequently, these two categories were merged, and the data were analyzed using three response levels. In addition, several materials had to be eliminated because they did not fit the unidimensional scale defined by the other items. This indicates that the pleasantness levels of these materials were influenced by dimensions other than pleasantness, suggesting that subjects associated the sensation of these materials with, for example, positive or negative events in their lives. The investigation of the invariance of the scale showed that the levels of pleasantness of more than half of the items differed according to the moisture levels on the subjects’ fingertips. Indeed, each of these DIF items was perceived differently, depending on whether subjects had dry or wet skin, and could therefore be split into two items with different locations specific to fingertip moisture level. The final Pleasant Touch Scale orders 58 items – 16 with a common location in subjects with low and high moisture levels and 42 with locations specific to the fingertip moisture level – arranged according to their levels of pleasantness and 198 subjects arranged according to their levels of pleasantness leniency.
In this study, the data were collected using a category rating (CR) scale. Indeed, each stimulus was initially rated on a 3-level scale, yielding ordinal scores. An alternative data collection procedure would be ME. In contrast to CR, ME is an unlimited rating scale method, allowing subjects to freely choose a number reflecting their perception of a (set of) stimulus (stimuli), without pre-setting rating categories (Stevens, 1975). ME was initially designed, i.a. to yield ratio level scales, although this remains unclear (Wills and Moore, 1994). Indeed, both ME and CR have been found to yield ordinal scores (Wills and Moore, 1994), with both methods generating data/scores lacking essential psychometric properties (i.e., linearity and unidimensionality), precluding the objective and quantitative comparison of the measured variable. Therefore, in order to allow objective comparisons of the measured variable (e.g., pleasantness leniency level), the data/scores obtained through both scaling methods must be transformed into linear and unidimensional measures. Furthermore, compared with CR scale procedures, it has been suggested that the ME methods increase response variability, lowering the power of a test (Mellers, 1983). We therefore collected data using a CR scale, followed by transformation into linear unidimensional measures through Rasch model analysis.
The hierarchy of items sharing the same pleasantness level regardless of the fingertip moisture levels of the subjects indicates that rough and sticky items are more unpleasant to explore than smooth, slippery, or soft items. Indeed, the most unpleasant materials were “latex,” “wax,” “cling film,” and “linen,” while the most pleasant ones are “silk,” “viscose tissue,” “foam,” “tights,” “paper (70 g/m2),” “baking paper,” “synthetic tissue,” “velvet,” “cellular rubber,” “paper (80 g/m2),” and “paper (1690 g/m2).” Similarly, other studies have found that soft and smooth materials were rated as most pleasant to touch, whereas rough materials were perceived as unpleasant (Major, 1895; Ekman et al., 1965; Essick et al., 1999, 2010; Verrillo et al., 1999).
Subjects with high fingertip moisture levels perceived rough and sticky materials as more pleasant than subjects with low fingertip moisture levels. Increased fingertip moisture was found to increase the dynamic coefficient of friction (i.e., the ratio between friction and normal force during slippage; André et al., 2011) until a certain moisture threshold (Nacht et al., 1981; Tomlinson et al., 2007; Gerhardt et al., 2008). Similarly, skin hydration can increase finger’s adhesion to a contacting surface, decreasing the probability of occurrence of slippage (André et al., 2011). Above the before mentioned moisture threshold, however, a further increase of skin hydration decreases the coefficient of friction (Tomlinson et al., 2007), due to the accumulation of a thin layer of moisture between the explored surface and the skin. Consequently, it may be hypothesized that rough and sticky materials, perceived as more pleasant if fingertip moisture was high, were materials that allowed fingertip moisture to accumulate to a very high level on their surfaces, resulting in the formation of a thin layer of moisture between the explored material and the skin of the fingertip. This may decrease the dynamic coefficient of friction of sticky materials and the roughness perception of rough materials, increasing the perceived pleasantness. This last assumption is strengthened by studies highlighting that the rough nature of rough materials are less perceived with higher skin hydration (Verrillo et al., 1998, 1999).
Conversely, subjects with high fingertip moisture levels perceived smooth materials as less pleasant than subjects with low fingertip moisture levels. It may be hypothesized that these smooth materials assimilated lower levels of moisture on their surfaces and failed to reach the moisture threshold above which the coefficient of friction decreases. The accumulated moisture may increase the dynamic coefficient of friction, leading to a less pleasant perception of the explored materials, which are perceived as stickier.
Finally, hardness was found to be unrelated to the perception of pleasantness, with some (e.g., tile_LM, cast_HM, marble_LM) perceived as pleasant and others (e.g., wood_LM, argil_LM, plexiglass_HM) as unpleasant. Rather, pleasantness was more dependent on roughness and stickiness than on hardness.
The aim of this study was to investigate pleasant touch of glabrous skin. Results suggest that a subject’s pleasantness leniency level, elicited by active touch, may be defined as a latent trait common among subjects. The Pleasant Touch Scale is a unidimensional and linear scale, ordering materials according to their level of pleasantness and healthy subjects according to their level of pleasantness leniency. Consequently, our findings provide objective insights into the characteristics of materials and subjects that influence pleasant touch. Indeed, we found that (i) smooth and soft materials are perceived as more pleasant than rough and sticky materials and (ii) the level of fingertip moisture influences the perception of pleasantness. Furthermore, this scale may be useful in future studies, aimed, for example, at determining correlations between the pleasantness levels of materials and the dynamics of active touch.
Conflict of Interest Statement
The authors declare that the research was conducted in the absence of any commercial or financial relationships that could be construed as a potential conflict of interest.
Acknowledgments
We are grateful for the kind participation of all subjects. This work was supported by a grant from the Commission of the European Union under Contract No. EU-FP7-NMP4-SL-2009-228844, NanoBioTouch.
References
André, T., Levesque, V., Hayward, V., Lefevre, P., and Thonnard, J. L. (2011). Effect of skin hydration on the dynamics of fingertip gripping contact. J. R. Soc. Interface 103, 402–408.
Andrich, D. (1978a). Application of a psychometric rating model to ordered categories which are scored with successive integers. Appl. Psychol. Meas. 2, 581–594.
Andrich, D., Sheridan, B. E., and Luo, G. (2004). Rasch Unidimensional Measurement Models (RUMM): A Windows Based Computer Program. Perth: Murdoch University.
Arnould, C., Penta, M., Renders, A., and Thonnard, J. L. (2004). ABILHAND-Kids: a measure of manual ability in children with cerebral palsy. Neurology 63, 1045–1052.
Bergmann Tiest, W. M., and Kappers, A. M. (2006). Analysis of haptic perception of materials by multidimensional scaling and physical measurements of roughness and compressibility. Acta Psychol. (Amst.) 121, 1–20.
Ekman, G., Hosman, J., and Lindstroem, B. (1965). Roughness, smoothness, and preference: a study of quantitative relations in individual subjects. J. Exp. Psychol. 70, 18–26.
Essick, G. K., James, A., and McGlone, F. P. (1999). Psychophysical assessment of the affective components of non-painful touch. Neuroreport 10, 2083–2087.
Essick, G. K., McGlone, F., Dancer, C., Fabricant, D., Ragin, Y., Phillips, N., Jones, T., and Guest, S. (2010). Quantitative assessment of pleasant touch. Neurosci. Biobehav. Rev. 34, 192–203.
Gerhardt, L. C., Strassle, V., Lenz, A., Spencer, N. D., and Derler, S. (2008). Influence of epidermal hydration on the friction of human skin against textiles. J. R. Soc. Interface 5, 1317–1328.
Hollins, M., Bensmaia, S., Karlof, K., and Young, F. (2000). Individual differences in perceptual space for tactile textures: evidence from multidimensional scaling. Percept. Psychophys. 62, 1534–1544.
Hollins, M., Faldowski, R., Rao, S., and Young, F. (1993). Perceptual dimensions of tactile surface texture: a multidimensional scaling analysis. Percept. Psychophys. 54, 697–705.
Johansson, R. S., Trulsson, M., Olsson, K. A., and Westberg, K. G. (1988). Mechanoreceptor activity from the human face and oral mucosa. Exp. Brain Res. 72, 204–208.
Lundborg, G. (2005). “Sensation and Sensorimotor Integration in Hand Function,” in Nerve Injury and Repair: Regeneration, Reconstruction, and Cortical Remodelling. Elsevier.
McGlone, F., and Reilly, D. (2010). The cutaneous sensory system. Neurosci. Biobehav. Rev. 34, 148–159.
McGlone, F., Vallbo, A. B., Olausson, H., Loken, L., and Wessberg, J. (2007). Discriminative touch and emotional touch. Can. J. Exp. Psychol. 61, 173–183.
Merbitz, C., Morris, J., and Grip, J. C. (1989). Ordinal scales and foundations of misinference. Arch. Phys. Med. Rehabil. 70, 308–312.
Morrison, I., Loken, L. S., Minde, J., Wessberg, J., Perini, I., Nennesmo, I., and Olausson, H. (2011). Reduced C-afferent fibre density affects perceived pleasantness and empathy for touch. Brain 134, 1116–1126.
Nacht, S., Close, J. A., Yeung, D., and Gans, E. H. (1981). Skin friction coefficient – changes induced by skin hydration and emollient application and correlation with perceived skin feel. J. Soc. Cosmet. Chem. 32, 55–65.
Nordin, M. (1990). Low-threshold mechanoreceptive and nociceptive units with unmyelinated (C) fibres in the human supraorbital nerve. J. Physiol. (Lond.) 426, 229–240.
Olausson, H., Lamarre, Y., Backlund, H., Morin, C., Wallin, B. G., Starck, G., Ekholm, S., Strigo, I., Worsley, K., Vallbo, A. B., and Bushnell, M. C. (2002). Unmyelinated tactile afferents signal touch and project to insular cortex. Nat. Neurosci. 5, 900–904.
Olausson, H., Wessberg, J., Morrison, I., McGlone, F., and Vallbo, A. (2010). The neurophysiology of unmyelinated tactile afferents. Neurosci. Biobehav. Rev. 34, 185–191.
Penta, M., Arnould, C., and Decruynaere, C. (2005). Développer et interpréter une échelle de mesure. Applications du modèle de Rasch. Belgium: Mardaga.
Rasch, G. (1960). Probabilistic Models for Some Intelligence and Attainment Tests. Chicago: Mesa Press.
Ripin, R., and Lazarsfeld, P. F. (1937). The tactile-kinaesthetic perception of fabrics with emphasis on their relative pleasantness. J. Appl. Psychol. 21, 198–224.
Stevens, S. S. (1975). Psychophysics: Introduction to its Perceptual, Neural, and Social Prospects. New York: John Wiley & Sons.
Tennant, A. (2004). Disordered thresholds: an example from the functional independence measure. Rasch Meas. Trans. 17, 945–948.
Tennant, A., and Conaghan, P. G. (2007). The Rasch measurement model in rheumatology: what is it and why use it? When should it be applied, and what should one look for in a Rasch paper. Arthritis Rheum. 57, 1358–1362.
Tennant, A., Penta, M., Tesio, L., Grimby, G., Thonnard, J. L., Slade, A., Lawton, G., Simone, A., Carter, J., Lundgren-Nilsson, A., Tripolski, M., Ring, H., Biering-Sorensen, F., Marincek, C., Burger, H., and Phillips, S. (2004). Assessing and adjusting for cross-cultural validity of impairment and activity limitation scales through differential item functioning within the framework of the Rasch model: the PRO-ESOR project. Med. Care 42(Suppl. 1), 137–148.
Tesio, L., Simone, A., and Bernardinello, M. (2007). Rehabilitation and outcome measurement: where is Rasch analysis-going. Eura. Medicophys. 43, 417–426.
Tomlinson, S. E., Lewis, R., and Carré, M. J. (2007). Review of the frictional properties of finger-object contact when gripping. J. Eng. Tribol. 221, 841–850.
Vallbo, A. B., Olausson, H., and Wessberg, J. (1999). Unmyelinated afferents constitute a second system coding tactile stimuli of the human hairy skin. J. Neurophysiol. 81, 2753–2763.
Verrillo, R. T., Bolanowski, S. J., Checkosky, C. M., and McGlone, F. P. (1998). Effects of hydration on tactile sensation. Somatosens. Mot. Res. 15, 93–108.
Verrillo, R. T., Bolanowski, S. J., and McGlone, F. P. (1999). Subjective magnitude of tactile roughness. Somatosens. Mot. Res. 16, 352–360.
Wills, C. E., and Moore, C. F. (1994). A controversy in scaling of subjective states: magnitude estimation versus category rating methods. Res. Nurs. Health 17, 231–237.
Wright, B. D. (1999). Model selection: rating scale or partial credit. Rasch Meas. Trans. 12, 641–642.
Wright, B. D., and Linacre, J. M. (1989). Observations are always ordinal; measurements, however, must be interval. Arch. Phys. Med. Rehabil. 70, 857–860.
Wright, B. D., and Masters, G. N. (1982). Rating Scale Analysis. Rasch Measurement. Chicago: Mesa Press.
Wright, B. D., and Stone, M. H. (1979). The Measurement Model. In Best Test Design. Rasch Measurement. Chicago: Mesa Press.
Yoshioka, T., Bensmaia, S. J., Craig, J. C., and Hsiao, S. S. (2007). Texture perception through direct and indirect touch: an analysis of perceptual space for tactile textures in two modes of exploration. Somatosens. Mot. Res. 24, 53–70.
Keywords: active touch, pleasantness, Rasch model, latent variable measurement, friction, moisture
Citation: Klöcker A, Arnould C, Penta M and Thonnard J-L (2012) Rasch-built measure of pleasant touch through active fingertip exploration. Front. Neurorobot. 6:5. doi: 10.3389/fnbot.2012.00005
Received: 13 March 2012; Paper pending published: 30 April 2012;
Accepted: 30 May 2012; Published online: 21 June 2012.
Edited by:
Pavel M. Itskov, Champalimaud Foundation, PortugalReviewed by:
Helena Backlund Wasling, Gothenburg University, SwedenEkaterina Vinnik, Champalimaud Foundation, Portugal
Copyright: © 2012 Klöcker, Arnould, Penta and Thonnard. This is an open-access article distributed under the terms of the Creative Commons Attribution Non Commercial License, which permits non-commercial use, distribution, and reproduction in other forums, provided the original authors and source are credited.
*Correspondence: Jean-Louis Thonnard, Institute of Neuroscience, Université Catholique de Louvain, Tour Pasteur, 53 Avenue Mounier (B1.53.04), 1200 Brussels, Belgium. e-mail: jean-louis.thonnard@uclouvain.be