 Eugenio Azpeitia1,2 Mariana Benítez2,3,4 Pablo Padilla-Longoria2,5 Carlos Espinosa-Soto2,6 Elena R. Alvarez-Buylla1,2*
- 1 Instituto de Ecología, Universidad Nacional Autónoma de Mexico, Mexico D.F., Mexico
- 2 Centro de Ciencias de la Complejidad, Universidad Nacional Autónoma de Mexico, Mexico D.F., Mexico
- 3 Department of Functional Genomics and Proteomics, Masaryk University, Brno, Czech Republic
- 4 Central European Institute of Technology, Masaryk University, Brno, Czech Republic
- 5 Instituto de Investigaciones en Matemáticas Aplicadas y en Sistemas, Mexico D.F., Mexico
- 6 Cinvestav-IPN, Irapuato, Mexico
In this article we focus on how the hierarchical and single-path assumptions of epistasis analysis can bias the inference of gene regulatory networks. Here we emphasize the critical importance of dynamic analyses, and specifically illustrate the use of Boolean network models. Epistasis in a broad sense refers to gene interactions, however, as originally proposed by Bateson, epistasis is defined as the blocking of a particular allelic effect due to the effect of another allele at a different locus (herein, classical epistasis). Classical epistasis analysis has proven powerful and useful, allowing researchers to infer and assign directionality to gene interactions. As larger data sets are becoming available, the analysis of classical epistasis is being complemented with computer science tools and system biology approaches. We show that when the hierarchical and single-path assumptions are not met in classical epistasis analysis, the access to relevant information and the correct inference of gene interaction topologies is hindered, and it becomes necessary to consider the temporal dynamics of gene interactions. The use of dynamical networks can overcome these limitations. We particularly focus on the use of Boolean networks that, like classical epistasis analysis, relies on logical formalisms, and hence can complement classical epistasis analysis and relax its assumptions. We develop a couple of theoretical examples and analyze them from a dynamic Boolean network model perspective. Boolean networks could help to guide additional experiments and discern among alternative regulatory schemes that would be impossible or difficult to infer without the elimination of these assumption from the classical epistasis analysis. We also use examples from the literature to show how a Boolean network-based approach has resolved ambiguities and guided epistasis analysis. Our article complements previous accounts, not only by focusing on the implications of the hierarchical and single-path assumption, but also by demonstrating the importance of considering temporal dynamics, and specifically introducing the usefulness of Boolean network models and also reviewing some key properties of network approaches.
Introduction
Most of the commonly used approaches to analyze gene regulatory interactions, such as epistasis analysis, rely on some implicit assumptions. As we will show, one common of such implicit assumptions is that genes are arranged in a hierarchical pattern of interactions in which each gene can either be upstream or downstream, but not both, as it occurs in feedback loops (Figures 1A,B). Another commonly implicit assumption is that gene interactions are part of a single-path, in contrast to cases in which a given gene can regulate another gene via two different pathways at the same time, as it occurs in feed-forward loops (Figures 1C,D). The notion of hierarchical and single-path gene regulation is consistent with the search of pathways or cascades rather than networks (Greenspan, 2001; Aylor and Zeng, 2008). However, experimental and theoretical work has demonstrated that biological molecular mechanisms contain regulatory feedback and feed-forward loops that do not fulfill the hierarchical and single-path assumptions, but are rather consistent with a network-based perspective. Such traits of gene regulation are key for understanding gene regulatory dynamics of almost any biological process (Mangan and Alon, 2003; Brandman and Meyer, 2008; Jaeger et al., 2008; Kaplan et al., 2008; Mitrophanov and Groisman, 2008). Hence, methods that consider regulatory feedback loops, feed-forward loops, and temporal dynamics at the same time will likely improve previous approaches. In this article we use epistasis analysis as an example, to explore the effect of these three aspects of gene regulation on the results and interpretation of gene interaction analyses.
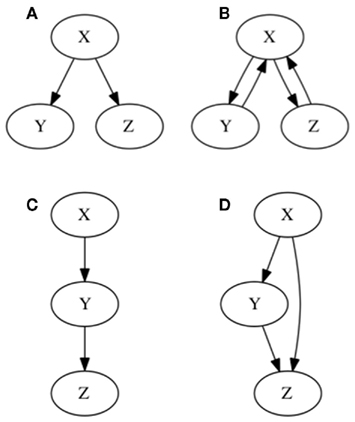
Figure 1. Graphical representation of hierarchical and single-path notions of gene regulation. In (A) hierarchical gene regulation is represented. As observed all nodes are either “upstream,” “downstream,” or at the same level. Consequently X regulates Y and Z, but X is not regulated by either Y or Z. No gene can by upstream and downstream at the same time. In (B) two feedback loops are included, by assuming that Y and Z regulate X. Hence, it is not possible to establish a hierarchy on gene regulation, since all genes can by upstream and downstream at the same time. In (C) a single-path gene regulation pattern is represented. In (D) a feed-forward loop is incorporated yielding two alternative pathways starting at X: one is a direct regulation of Z, and the other one implies an indirect regulation of Z, via Y.
Epistasis is ubiquitous within gene regulatory networks in living organisms (Tyler et al., 2009). As acknowledged by many authors, epistasis has important implications in a broad range of biological issues, from biomedicine to evolutionary studies (see Phillips, 2008 and references therein). Is important to note that there are different notions of the term epistasis: the original one proposed by Bateson in 1907 (herein called classical epistasis) that refers to the masking of the effect of one allele by another allele in a different locus, and a broader definition referring to gene interactions in general.
We focus here on classical epistasis, but it is important to note that the different notions of epistasis are related. Hence, some works have aimed to bring together these different notions of the term epistasis (e.g., Moore and Williams, 2005), allowing elegant and improved analyses of classical epistasis for quantitative traits as well as qualitative discrete ones (e.g., Aylor and Zeng, 2008; Phenix et al., 2011). In any case, the original analysis proposed for classical epistasis (herein called classical epistasis analysis) as described by Avery and Wasserman (1992) is still one of the most powerful and widely used tools in molecular biology to infer biological pathways and regulatory interactions among genes and to validate predictions derived from high-throughput experimental analysis. It is simple, very powerful, and relies on some explicit and implicit assumptions that, when met, allow this analysis to be taken almost as a recipe to order genes along control pathways (Avery and Wasserman, 1992; Huang and Sternberg, 2006; Roth et al., 2009; Figure 2).
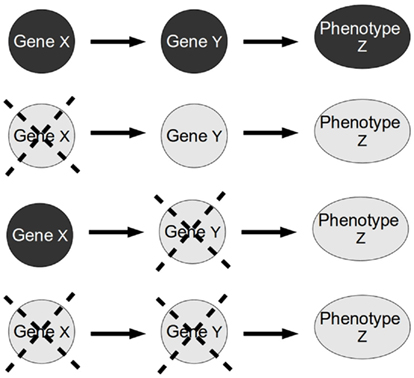
Figure 2. Standard epistasis analysis. In epistasis analysis one compares the effect of each single mutant (X and Y single gene mutants) against the double mutant (XY double mutant) of the genes under study on the phenotype of a trait (in this paper, the trait represents a gene). The masking of the effect of one gene mutation in the double mutant is called epistasis. The gene whose phenotype persists is called epistatic gene.
The explicit assumptions of the classical epistasis analysis are: (1) there is a signal or input that determines the state of the phenotype under analysis, (2) the signal also determines the state of the upstream gene, (3) the signal and the two genes are the only determinants of the phenotype, at least in the context of an experimental model, and finally, (4) the mutants analyzed are null or complete loss-of-function mutants (based on Avery and Wasserman, 1992; Huang and Sternberg, 2006). However, classical epistasis analysis also relies on the implicit assumptions of hierarchical and single-path gene regulation. As we will show, the accomplishment of the implicit assumptions is fundamental for the validity of the classical epistasis analysis.
Many authors have focused on diverse assumptions of classical epistasis analysis and discussed the implications of violating some of them (e.g., Avery and Wasserman, 1992; Huang and Sternberg, 2006; Phenix et al., 2011). This has motivated efforts to attain better interpretations, relax the assumption of epistasis analyses and expand its applicability (see an excellent review in Phillips, 2008). Anyhow, to our knowledge, no previous work has explored the joint effect of the hierarchical and single-path aspects of gene regulatory interactions on classical epistasis analysis.
Network-based approaches can almost naturally overcome many of the limitations of classical epistasis analysis and gene interaction analyses in general. Partly because of this, most of the improvements of the epistasis analyses have relied on the use of networks. For example, systems biology is creating epistatic networks that take into account many gene interactions (e.g., Tong et al., 2004; St Onge et al., 2007; Battle et al., 2010). These studies propose the use of network-based approaches applying modifications to the standard methods, with the incorporation of graph theory, Bayesian networks, as well as statistical or probabilistic properties, among others, for the study of epistasis (Phillips, 2008; Tyler et al., 2009; Battle et al., 2010; Jiang et al., 2011; Phenix et al., 2011). Such approaches have allowed inferences of gene interactions with high statistical confidence levels, but the validation of the predicted gene interactions with such methods usually requires further confirmations with more detailed experiments because false interactions or wrong gene order can sometimes be inferred (e.g., Battle et al., 2010). Only a few of these reports have addressed the improvement of classical epistasis analysis in particular. However, improved classical epistasis analysis approaches are also available (Aylor and Zeng, 2008; Phenix et al., 2011). Aylor and Zeng (2008) present a method for experimentally estimating and interpreting classical epistasis that combines the approaches of classical and quantitative genetics, while Phenix et al. (2011) present a quantitative method for interpreting classical epistasis and inferring pathways from vast sets of data. These previous publications have mainly explored how to overcome the single-path assumption or assumptions 2, 3, and the problem of how to use huge amounts of data to infer precise gene interactions.
We specially focus on the use of Boolean network formalism as an improvement of classical epistasis analysis. Boolean networks have been shown to be useful tools to analyze discrete dynamic systems that rely on a pure logical formalism (Bornholdt, 2008). They can incorporate feedback loops, feed-forward loops, and are dynamic. Interestingly, integration of experimental gene interaction data into Boolean networks may be particularly useful for classical epistasis analysis because the latter also relies on a pure logical, discrete formalism. However, the Boolean network approach does not imply the limiting assumptions that the classical epistasis analysis does; indeed, a Boolean approach is useful for analyzing and integrating much more information than classical epistasis analysis alone.
Importantly, Boolean networks can be modified for more detailed analysis when noise (Bornholdt, 2008) or multivalued genes (genes that can perform different activities depending on their level of expression; Didier et al., 2011) are considered. Furthermore, once a Boolean network is validated it can be transformed into an equivalent continuous system (Wittmann et al., 2009), which can be amenable to further formal analyses. Given that the Boolean network formalism is very intuitive and there are a handful of freely available tools for its analysis (e.g., SQUAD, Di Cara et al., 2007; Atalia, Alvarez-Buylla et al., 2010; BoolNet, Müssel et al., 2010; SimBoolNet, Zheng et al., 2010), this formalism can be easily integrated into classical epistasis analysis. We therefore propose here the use of Boolean networks for an easy, but more powerful analysis of classical epistasis experiments.
After providing a historical perspective of hierarchical and single-path gene regulation, we will provide a detailed explanation of how classical epistasis analysis works, explore some of the implications of violating the hierarchical and single-path assumptions and discuss the importance of considering the temporal dynamics of gene interactions. We will show that classical epistasis analysis can be useful and precise, but that it can also conceal relevant information concerning the nature of gene interactions underlying biological processes. Next, we will argue that complementary experiments can uncover the information that is “hidden” to epistasis analysis, namely, unknown non-hierarchical and non-single-path genetic interactions. Then we will show that the use of a dynamical network-based approach can facilitate the access to this information. Finally, we will review how Boolean networks work and use experimental and theoretical examples to illustrate ways in which Boolean networks can be used to complement and improve classical epistasis analysis.
The Hierarchical Notion of Gene Regulation
The single-path and hierarchical notions of gene regulation are not assumptions that were incorporated in classical epistasis analysis just for simplicity. These views are historically rooted and hence, they are not exclusive of classical epistasis analysis, but have permeated almost all of biological research. In fact, these assumptions affect the way biologists still design, analyze, and interpret experimental data in many areas of research. Hence, we briefly review some of the historical roots of the single-path and hierarchical notions of gene regulation.
At the beginning of the twentieth century, during the so-called “eclipse of Darwinism” (Bowler, 1983), genes were conceptualized as functional units of recombination (here referred to as the functional gene, similar to Longo and Tendero, 2007), and their phenotypic effects were inferred from hybridization experiments. DNA structure was discovered many decades afterward (Watson and Crick, 1953) revealing that genes were encoded in the double helix DNA sequence (here we refer to the coding DNA as the structural gene), and thus provided an apparently clear material basis for the action of functional genes. Before this, in the framework of the modern synthesis of evolutionary biology, it was suggested that inheritable phenotypic traits with modifications guided evolution and that all or most inheritable variable traits were encoded almost exclusively in the genes, without making a distinction between the functional and the structural gene (Mayr and Provine, 1980). Based on this and other and historical issues (for instance, experiments regarding the role of the homeotic genes showing a key control of genes over phenotypes; Morata and Lawrence, 1977), an apparently logical and immediate direct link between the functional and the structural conception of genes was made (Longo and Tendero, 2007). All such events led the way to a “genocentric” approach that assumed that phenotypic traits are almost completely determined by the information, or blueprint, contained in genes (Lorenz, 1965; Nijouth, 1990). Consequently, during the decades that followed the modern synthesis, the research of many biological fields has focused almost exclusively on genetics and molecular research. However, all of this was done without a distinction between the functional and structural notions of genes, although in reality these could represent different units.
Little was known at that time about gene interactions or epigenetic mechanisms, and according to an extreme genocentric view, development and organismal organization could be explained through pivotal genes that regulate the activity of other downstream genes, which in turn regulate other further downstream genes, and so on (i.e., a single-path and hierarchical view; e.g., Davidson and Erwin, 2006). Under such a perspective, one could understand the order of gene action using straightforward genetic analyses, such as the classical epistasis analysis. However, as pervasive and useful as it has been, the extreme genocentric approach has been severely criticized (e.g., Oyama, 1985; Alberch, 1989; Nijouth, 1990; Griffiths and Gray, 1994; Goodwin, 2001; Greenspan, 2001; Gould, 2002; Jablonka and Lamb, 2005; Salazar-Ciudad, 2006; Pigliucci and Müller, 2010). It has become evident that most phenotypes depend on highly non-linear regulatory interactions among multiple elements and therefore that single and direct causes are rare (Wagner, 1999; Lewontin, 2000; Robert, 2004; Longo and Tendero, 2007). Studies on the gene interactions underlying transcriptional regulatory networks (e.g., Albert and Othmer, 2003; Espinosa-Soto et al., 2004; Davidich and Bornholdt, 2008) support this idea and show that many phenotypic traits depend on the distributed (non-hierarchical) action of many interacting genes and also on environmental and developmental factors (e.g., Lewontin, 2000; Greenspan, 2001; Salazar-Ciudad, 2006; Gordon et al., 2009). Hence, the assumption of single-path and hierarchical gene interactions often leads to oversimplified models, which are instrumental starting points for exploratory purposes, but that need to be improved later on.
Confronted with these kinds of criticism and the growing set of experimental evidence that challenges the genocentric view, the modern synthesis seems to be ready for at least an extension (Griffiths and Gray, 1994; Jablonka and Lamb, 2005; Pigliucci, 2007, 2009; Pigliucci and Müller, 2010). Indeed, it is becoming generally accepted that we need to embrace an “interactionist” view and accept that development unfolds and emerges as a consequence of complex interactions among several genetic, organismal, and environmental factors (Oyama, 1985; Robert, 2004). Yet, a closer inspection of the literature and some recent data show that, in practice, many experimental setups and analyses assume a single-pathway and hierarchical idea of gene regulation. This could be due to the persistence of the genocentric view, the assumption that the hierarchical action of genes is a necessary first step in tackling complex biological systems, and that the methods, techniques, and conceptual frameworks that enable going beyond a hierarchical view of development and evolution are still under construction.
Before we try to explore the effect of ubiquitous complex, non-hierarchical gene interactions, let us briefly explain how classical epistasis analysis is traditionally done (see more detail in Avery and Wasserman, 1992; Huang and Sternberg, 2006; Roth et al., 2009 and references therein) to use it as an example to illustrate the type of problems we can encounter if hierarchical and single-path interactions are assumed.
Classical Epistasis Analysis
Classical epistasis analysis states that in a double mutant experiment, the two genes act in the same pathway if the phenotype of the double mutant is the same as that of organisms carrying a single mutation for one of the genes. The gene with the allele whose phenotype persists in the double mutant is called epistatic gene, while the other is the hypostatic gene. As mentioned above, if some assumptions regarding the nature of gene regulation are met, few simple rules allow the use of this information to order genes in a hierarchical way (Avery and Wasserman, 1992; Roth et al., 2009). The rules are as follows:
1. In the double mutant, the epistatic gene is upstream and positively regulates the downstream gene when the two genes used in the double mutant display a characteristic single mutant phenotype under the same condition (e.g., both genes have certain mutant phenotype only when a signaling pathway is active or only when the pathway is inactive).
2. In the double mutant, the epistatic gene is downstream and is negatively regulated by the upstream gene when the two genes display a characteristic single mutant phenotype under different conditions (e.g., one gene has a mutant phenotype when a signaling pathway is active and the other when the pathway is inactive).
These simple rules are useful and applicable for many cases (Avery and Wasserman, 1992; Huang and Sternberg, 2006; Roth et al., 2009). But, what happens when the single-path and hierarchical assumptions are not met or if temporal dynamics are considered? We use some examples to illustrate these cases.
Consider generic nodes X, Y, and Z to represent genes (although they can represent other entities, see Huang and Sternberg, 2006). If X positively controls the expression of Y and Y positively controls the expression of Z (Figure 3A), then the single and double loss-of-function mutants yield the results shown in Table 1. Applying the rules of the classical epistasis analysis to these results we correctly conclude that X is upstream in relation to Y.
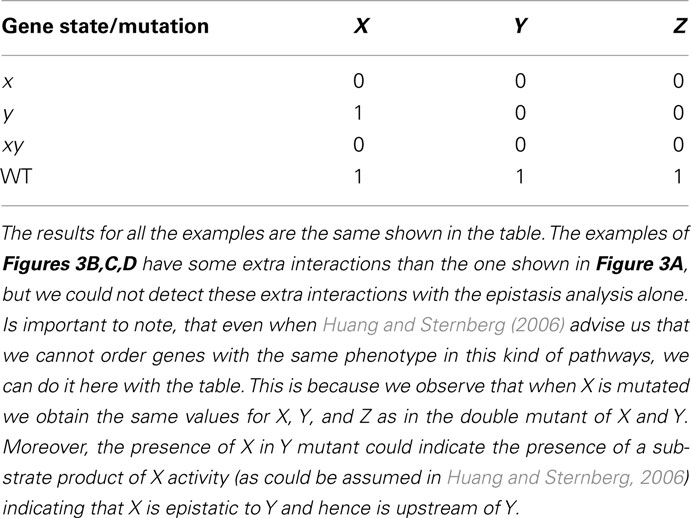
Table 1. Results obtained from epistasis analysis of examples in Figure 3.
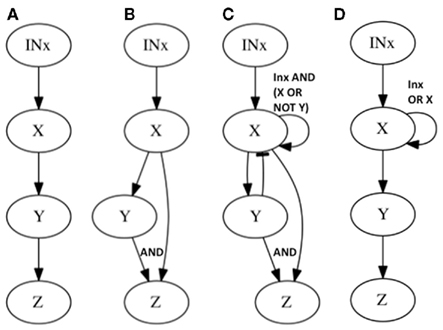
Figure 3. Subgraphs to be inferred with epistasis analysis. The graphs of the examples explained in the main text are shown. All these subgraphs yield the same results with a classical epistasis analysis. INx (Input of X) is included to meet assumptions 1, 2, and 3 of epistasis analysis, but it could be obviated, as it is commonly done. According to Huang and Sternberg (2006) we can call such cases to be “substrate dependent pathways,” and we can only order genes in this kind of pathways through epistasis when they do not display the same mutant phenotype. The logical rules for each motif are: (A) x = IN, y = x, z = y, (B) x = INx, y = x, z = x ∧ y, z = y, (C) x = INx ∧ (x∨ ¬ y), y = x, z = x ∧ y, and (D) x = INx ∨ x, y = x, z = y.
Now let us see what happens in the same example if we add one more interaction. Let us assume that X positively and directly regulates Z as well (feed-forward case, Figure 3B). If we proceed to generate all loss-of-function mutant combinations we recover exactly the same results as in the previous case (without X → Z). This simple example shows that there are categories of gene regulatory networks that render the same set of results in the single and double loss-of-function mutant analyses but that, nevertheless, have different regulatory interactions or architectures.
It is important to note that the graph just described is well known and widely distributed in real gene networks (Milo et al., 2002; Shen-Orr et al., 2002). This subgraph is usually referred to as a coherent feed-forward loop (Mangan and Alon, 2003; Mangan et al., 2003). This subgraph has also been reported in experimental research. For instance, in the gene regulatory network of the radial root pattern of Arabidopsis thaliana the transcription factor SHORTROOT (SHR) has been shown to positively regulate SCARECROW (SCR) gene transcription in the endodermis, and both SHR and SCR together regulate the expression of many other genes, including SCR itself (Levesque et al., 2006).
The feed-forward loop is not the only subgraph that can mimic the results of the subgraph in Figure 3A, there are many others, and as larger gene networks are considered, more cases would render the same inference. Let us consider one more example. If X positively regulates Y, and both X and Y positively regulate Z, but at the same time Y negatively regulates X (creating a feedback loop between X and Y) and finally X positively self-regulates (a second feedback loop; Figure 3C), the same inference as in the two previous examples is reached from the single and double loss-of-function mutants. In all of these cases, classical epistasis analysis would not be completely misleading, as it would suggest that X positively regulates Y and Y positively regulates Z, which is true for all three examples, but it would not be able to yield information concerning the additional regulatory interactions included in Figures 3B,C. Indeed, such interactions can rarely be detected if we are not looking for them or if we assume that genes act in a hierarchical and single-path way.
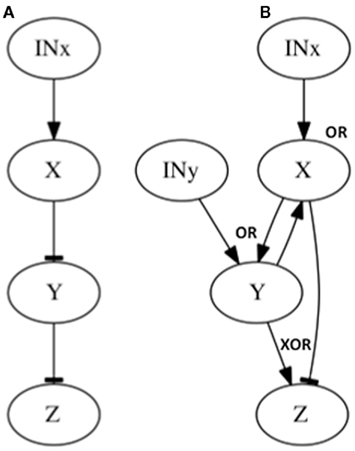
Figure 4. Subgraphs to be inferred with epistasis analysis. The graphs of the examples explained in the main text are shown. All these subgraphs yield the same results with a classical epistasis analysis. INx (Input of X) is included to meet assumptions 1, 2 and 3 of epistasis analysis, but it could be obviated, as it is commonly done (see Figure 2). The logical rules for each motif are: (A) x = INx, y = x, z = y, (B) x = INx ∧ y, y = INy ∧ x, z = xXOR ¬ y.
In fact, in the last example, the notion of upstream and downstream gene does not make any sense. In most real systems the genes feed back to each other creating not a pathway, but a complex circuit or a subgraph that, in Figure 3C corresponds to a very well studied – and seemingly ubiquitous – system known as activator–inhibitor system (Gierer and Meinhardt, 1972; Meinhardt and Gierer, 2000; Kondo and Miura, 2010). Actually, this system has been found to underlie developmental processes of several structures in many organisms (Meinhardt and Gierer, 2000). For instance, it is found in the regulation of stem cell pools in A. thaliana shoot apical meristem by CLAVATA3 (CLV3) and WUSCHEL (WUS) genes where CLV3 represses WUS transcription while WUS self-activates and activates CLV3 (Schoof et al., 2000; Fujita et al., 2011). The activator–inhibitor system has also been used as an example to challenge the linear causality often attributed to gene action (Goodwin, 2001).
In conclusion, classical epistasis analysis could not discern the topologies shown in Figures 3A–C. However if additional combinations of loss and gain-of-function lines, as well as all the gene expression patterns were available, these three topologies could be distinguished. This requires a considerable experimental effort that, as we will show, could be optimized by adopting a network approach. Moreover, there are some topologies that even if the whole set of individual and combined loss-of-function and gain-of-function mutants were available, would still be indiscernible under a classical epistasis analysis. Such an example is provided in Figure 3D, which depicts a topology that cannot be discerned from Figure 3A even with an exhaustive set of mutants of the genes conforming the graph under analysis. However, if one could manipulate the input (or inputs), one could, in principle, perform nested classical epistasis analysis based on complete sets of single and combined loss and gain-of-function mutants, in order to infer the correct topology. The fact that one cannot distinguish the topologies in Figures 3A,D with classical epistasis analysis is due to the presence of an input and a positive feedback loop acting on X. Importantly, this appears to be a relatively common situation in real data sets (see Examples From the Literature for examples below).
We now consider a few additional graphs in which a classical epistasis analysis may be insufficient and could be somewhat misleading. Let us assume that X negatively regulates Y, and Y negatively regulates Z (Figure 4A). Now assume another subgraph where X positively regulates Y and negatively regulates Z (generating a feed-forward loop from X to Z), while Y positively regulates X and Z (generating a feedback loop between X and Y), and both X and Y nodes, have an input (Figure 4B; since no gene is upstream or downstream, and since the input should be over the upstream gene, in this case both X and Y have inputs). The results from the classical epistasis analysis of these two subgraphs are shown in Table 2. Following the classical epistasis analysis rules to order gene interactions, we can conclude that gene Y negatively regulates gene Z, which is not true for both subgraphs. It can be argued that our assumption that Y and X regulate Z in the subgraph of Figure 4B (through an exclusive OR (XOR) rule, see below) is a rare situation (Davidson, 2001). However, this kind of examples, where we can be misguided without the XOR rule, become frequent as the regulation of Z becomes more complex, for instance, having several inputs.
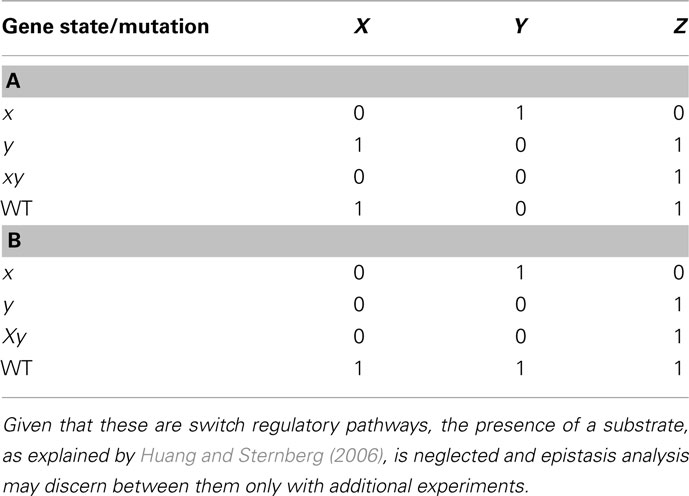
Table 2. Results of epistasis analysis for regulatory motifs in Figures 4A,B, respectively.
In addition to feedback and feed-forward loops, it is important to acknowledge the time it takes for genes to interact with other genes in the analysis (i.e., temporal dynamics). In classical epistasis analysis it is implicitly assumed that gene interactions are synchronous. This is an unrealistic assumption (Fauré et al., 2006). In cases where the single-path and hierarchical assumptions are not met, if temporal dynamics are not considered, classical epistasis analysis can also reach wrong inferences (e.g., Fauré et al., 2006). Consider, for example, that X activates itself (feedback loop) and at the same time inhibits Y and Z (feed-forward loop). Correspondingly, Y also activates itself (second feedback loop) and Z, and it inhibits X (third feedback loop; Figure 5A). Additionally, all inhibitions are stronger than any activation. We analyze two cases. In the first one, the network is updated synchronously. That is, the states of all genes in the subgraph at time t + 1 are updated at the same time and are determined by the gene states at time t. It is straightforward to check that if the network is initialized with X off and Y on, the system will remain there, with X off, and Y and Z on (Figure 5B). On the other hand, if the updating is not synchronous, and for example, the state of X and Y at time t are determined by the gene states at time t − 1 and the state of Z is determined by the gene states at time t (i.e., Z regulation is faster than the expression of X and Y), the same condition can lead to a periodic expression of genes (Figure 5B). Here, a classical epistasis analysis would correctly infer that X inhibits Y and Y activates Z, but would not render any useful information about the other subgraph interactions nor its behavior.
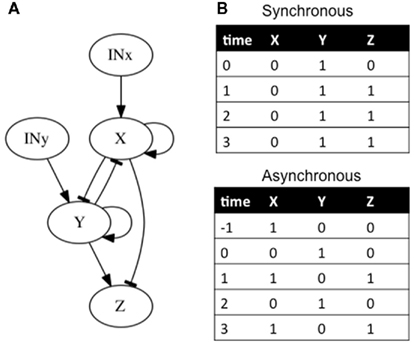
Figure 5. Subgraphs to be inferred with epistasis analysis. As explained in the main text, these networks yield different results if we add a temporal dynamic analysis. (B) The possible attractors reached from the same condition are shown. If a synchronous updating of the gene states is assumed, the system reaches a fix-point attractor, while with an asynchronous updating the system reaches a periodic attractor. The logical rules of the motif are: (A) x = (INx ∨ x)∧ ¬ y, y = (INy ∨ y)∧ ¬ x, and z = ¬ x ∧ y.
The above examples illustrate how if we do not consider the possible presence of feedback loops, feed-forward loops, and temporal dynamics, analysis like classical epistasis may help to infer some gene interactions and the order in which they occur, but can “hide” or even be misleading in other aspects of the regulatory system under consideration. Network-based approaches can improve gene interaction inferences.
Epistasis and (Boolean) Networks
Network theory has been fruitfully applied to ask and address novel questions in the fields of evolution, development, and behavior (see for examples von Dassow et al., 2000; Newman et al., 2006; Aldana et al., 2007; Balleza et al., 2008; Wagner, 2009). Importantly, network-based approaches have been already applied for the study of epistasis (e.g., Tyler et al., 2009; Battle et al., 2010; Jiang et al., 2011; Phenix et al., 2011). Network models provide a formal framework for integrating detailed and high-quality experiments that, although extremely valuable, often remain isolated. The integration of such experimental data into dynamic network models can help discern among possible topologies among which classical epistasis analysis is unable to distinguish. Furthermore, dynamic network models may be used to make novel predictions and provide integrative system-level explanations for the behavior of large data sets.
In the last section we provided several examples in which certain sets of gene interactions involving the same elements (genes) may render the same phenotypes for single and double mutations, but that nevertheless may have different gene interaction topologies. Dynamical network models provide a formal framework for integrating experiments that can help discriminate among alternative topologies yielding the same results when subject to a classical epistasis analysis. Furthermore, this integration enables the specification of larger dynamic models that may feedback independent experiments and are helpful to validate a whole set of data.
There are many ways in which we could use dynamical network models to improve classical epistasis analysis. For instance, we could keep a catalog of possible regulatory graphs that render the same results, as for the cases shown above. This would help us to bear in mind some of the possible topologies that are consistent with a set of genetic data, as well as to design experiments and crosses in order to discern among them. It is also possible to perform exhaustive (if our network is finite, discrete, and deterministic) computational simulations of the dynamic consequences of alternative regulatory graphs, enabling to test and compare their dynamics with available evidence. This has already been done for other purposes and in different ways (e.g., Nochomovitz and Li, 2006; Giacomantonio and Goodhill, 2010), and its applicability is being studied now in the specific context of classical epistasis (E. Azpeitia and E. R. Alvarez-Buylla, unpublished data). Also, using networks to predict experimental results or to systematically explore the perturbations that may affect a system can be very helpful (e.g., Espinosa-Soto et al., 2004; Azpeitia et al., 2010).
Gathering data from additional related loss and gain-of-function lines, as well as from other types of molecular genetic experiments, and building larger network models can also help to discern among possible network topologies. Stable networks states or configurations (attractors) can be obtained for a network grounded on several classical epistasis analyses and systematically test the different topological possibilities. In order to avoid circular explanations, the networks under study should reproduce the data with which they were built, as well as expression patterns or other results that were not fed into the model. Ideally, the network being challenged should also lead to novel and testable predictions. However, such approach is limited because the number of possible network topologies and configurations greatly increase as a function of the number of nodes considered. Nonetheless, it is possible to focus on relatively small subnetworks or modules that are relatively isolated from the rest of the network.
All the above suggestions can be achieved with any kind of dynamic network approach, but we contend that Boolean networks are particularly useful and easily applicable in the context of classical epistasis analysis because they use exactly the same logical formalism. Several programs are available for Boolean network analysis (e.g., Atalia, Alvarez-Buylla et al., 2010; SQUAD, Di Cara et al., 2007; GNA, de Jong et al., 2003; BoolNet, Müssel et al., 2010; BIOCHAM, Calzone et al., 2006; Antelope, Arellano et al., accepted; among many others), and Boolean networks have been successfully applied and validated in many systems, such as cell type determination in A. thaliana (Espinosa-Soto et al., 2004; Benítez et al., 2008; Savage et al., 2008), body segmentation in Drosophila melanogaster (von Dassow et al., 2000; Albert and Othmer, 2003), and yeast cell-cycle (Li et al., 2004), among others. Now, let us explain how the logical analysis approach using Boolean networks works.
Kauffman first proposed gene regulatory Boolean network models in 1969. These are discrete networks where nodes (commonly representing genes) can only attain two values, 1 when the gene is active and 0 when it is non-active. The dynamics of node activity depends on the interactions among nodes in the network. Thus, a node’s activation state changes according to the function:

where xn represents the state of node n at the time (t + τ) (τ representing a positive integer) and  represents all of the k regulators of node xn at time t, and the set of states of all the nodes included in the network at a given time is referred to as the system configuration. Since these are discrete and deterministic systems, the number of possible configurations is finite and configurations at posterior time steps can be assessed from previous ones. Some network configurations (represented as a vector of zeros and ones) do not change once they are reached. These configurations are known as fixed-point attractors. Other network configurations oscillate among them and are known as cyclic or periodic attractors. Kauffman (1969) proposed that attractors represent the experimentally observed stable configurations of gene activity that occur, for example, in an already determined cell type or that characterize a cell-fate.
Defining the logical function of each of the possible interaction sets according to available experimental evidence and following the dynamics of such sets can be very useful when analyzing experimental data. For example, consider one of the networks depicted in the previous section (Figure 3C). It is possible to derive transition tables for all genes, as shown in Table 3 for X, Y, and Z, with the use of Boolean equations. The Boolean equations use the logical operators AND, OR, and NOT to formalize biological data regarding gene interactions. For instance, if a logical operator AND is placed in a Boolean equation it could represent that X and Y form a dimer. This can be represented as the Boolean function: Z = X AND Y. In a similar way, the OR and NOT operators can represent different kinds of gene interactions. Once we have the complete set of Boolean equations, a transition table that integrates all the Boolean equations of the system, gives the system state that will follow at time (t + t), given a system state at time t. Then, it is possible to obtain attractors for each tested network and compare them with the expected equilibrium states for the system under study (see methodological details in Kauffman, 1969; de Jong, 2002; Alvarez-Buylla et al., 2007, 2008; Bornholdt, 2008).
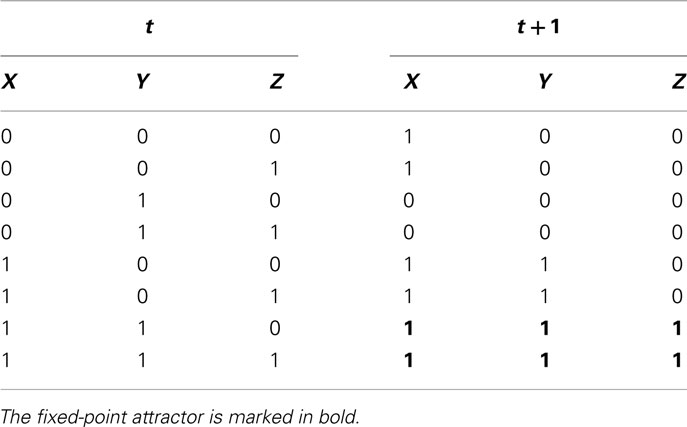
Table 3. Transition table for all the possible configurations of the subgraph shown in Figure 3C.
This approach may seem insufficient for some instances, but almost all limitations can be resolved by introducing certain modifications. If, for example, experimental evidence suggests the existence of more than two gene activity states, nodes taking additional activity states could be used (e.g., Espinosa-Soto et al., 2004; Benítez et al., 2008; Didier et al., 2011). If non-determinism is not important for the system under study, probabilistic networks can be used (e.g., Shmulevich and Kauffman, 2004; Bornholdt, 2008). On the other hand, if quantitative data is available, continuous networks described by ordinary differential equations could be approximated, and so on (Wittmann et al., 2009). For the purposes of classical epistasis analysis discussed here, Boolean networks are generally sufficient.
Conveniently, one only requires basic notions of logic to improve classical epistasis analysis with the use of Boolean networks. Suppose we want to explore the interactions between two genes for which we do not have any previous information. In order to find how they interact, we perform a classical epistasis analysis. Yet, as an extension of the classical epistasis analysis we assume a non-hierarchical and multi-path organization of gene interactions.
If we think that the genes under study may not be hierarchically organized, but all other epistasis assumptions are met, five new interactions are possible: (1) there can be an input for both genes, (2) feedback circuits where both genes regulate each other’s expression, (3 and 4) either or both genes can self-regulate, and finally, (5) both genes can control the output (Figure 6). All these interactions can be positive or negative. All the possible ways in which X and Y can control the output value based on a Boolean approach are shown in Table 4, including the case in which neither X nor Y are regulators of Z. Some topologies can be represented with different logical rules, and different logical rules can display the same behavior, which are then dynamically equivalent topologies.
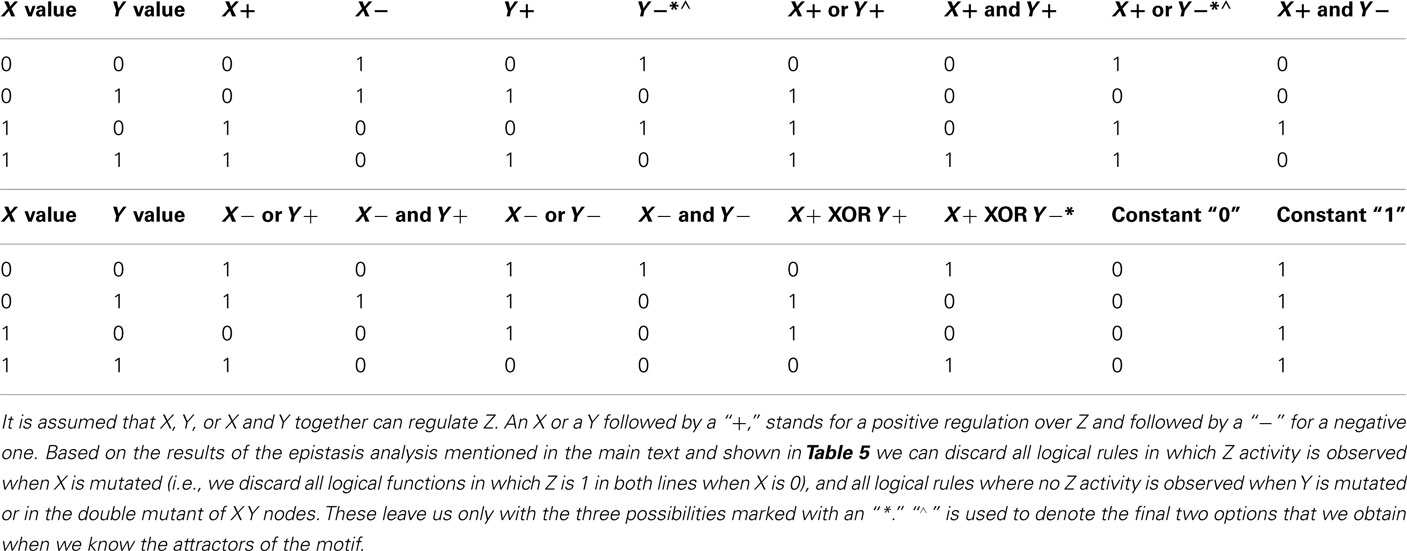
Table 4. Logical rules for Z.
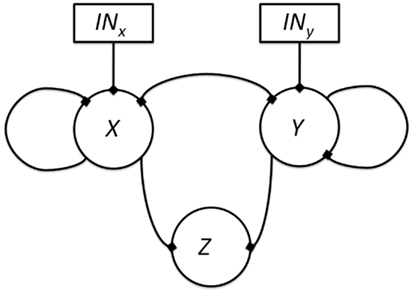
Figure 6. All possible topologies in a motif where gene X and gene Y regulate the state of a gene Z. The edges represent possible regulatory interactions. These interactions can be positive, negative or null (i.e., inexistent). The inclusion of an input over genes X and Y is assumed because it is not clear which gene is upstream and which one is downstream.
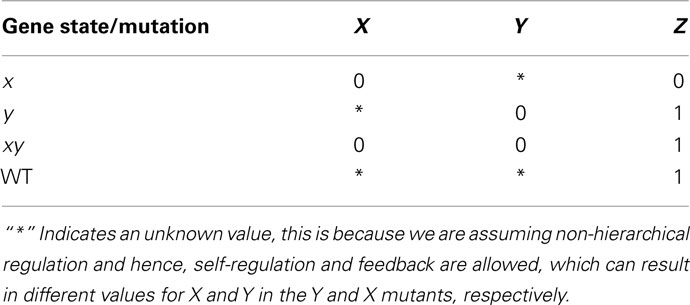
Table 5. Results obtained through epistasis analysis of the theoretical example described in the main text.
Suppose that classical epistasis analysis yields the results observed in Table 5. There are several observations we can draw from Tables 4 and 5. First, if we use the rules of classical epistasis analysis we can conclude that X is upstream of Y, and that X negatively regulates Y, which negatively regulates Z. Nevertheless, based on Table 4 we can observe that not only Y negatively regulating Z can explain the results obtained from the epistasis analysis. Using a discrete Boolean formalism there are three different networks that could explain these results assuming that only X and Y regulate Z. The question that arises then, is how can we distinguish which of the possible explanations is the correct one and, equally important, how do X and Y interact? Are they hierarchically organized? How can we use networks to infer the correct regulatory graph of Z?
A further step would involve identifying the attractors needed in order to explain the results obtained in the classical epistasis analysis. If we do this we observe that depending on how Z is regulated, different attractors are expected. Hence, if the expression patterns of X and Y are obtained, the possibilities are constrained. Suppose that when the input is active, X is expressed and Y is not expressed, and vice versa when the input is inactive. This will leave only two possibilities (Table 4) from which we can easily distinguish the correct one with one additional experiment.
Finally we want to know how X and Y interact with each other. First we want to know how Y can be regulated. Then again, we only need to know if the expression of Y is stable or not under the possible regulatory graphs, both in a wild-type and mutant cases. Then, we can compare the stability of Y expression in each graph with that expected from available evidence (e.g., Y activity is expected to be stable if its expression is observed in wild-type lines). If we do this we will find that there are nine possible ways to explain the observed gene Y behavior. Two of these possibilities are negligible since no regulation of gene X over Y is inferred and the observed results in the classical epistasis analysis cannot be explained this way. Now, two experiments (one to see if gene X positively or negatively regulates Y, and another one to verify if gene Y can self-regulate) will be enough to distinguish the correct graph.
The kind of dynamic analysis proposed here is doable even without a computer and it will only render non-trivial information if there are multiple-path or non-hierarchical interactions in the network architectures under analysis. However, as mentioned above, there are now several computational tools that are available to analyze the dynamics of larger networks.
It would seem like networks could grow indefinitely before they can tell us something about a process. Is it possible to learn something about a particular biological process, for instance, cell type determination during flower organ specification, or body segmentation, without considering every genetic and epigenetic regulatory interaction in the organism? To answer this question one must turn to one of the central concepts in current biology and network studies, that of modularity.
Modules are characterized by their greater internal than external integration (Müller, 2007). In the context of networks, modules are often defined as highly connected subsets (Wagner et al., 2007) or as sets of nodes with more interactions among them than with the rest of the elements of the network. Modular organization seems to permeate biological systems at all levels: molecular, metabolical, structural, functional, developmental, etc. (Wagner et al., 2007; Callebaut and Rasskin-Gutman, 2009).
Modularity is central to our discussion because the modular organization of networks and biological processes allows us to focus on a limited set of interacting elements that are relatively isolated from the rest. Thus, modules have a relatively autonomous behavior with respect to the rest of the network. Of course, the definition of modules does not precede the inference of networks, but one can aim to uncover networks that are necessary and sufficient for processes to take place and that, therefore, constitute a functional module.
Examples from the Literature
We have already discussed what kind of information could be hidden or even misinterpreted with classical epistasis analysis in several cases of non-hierarchical and non-single-path gene regulatory theoretical subgraphs. Now we will describe some of the results, and the kinds of interactions found when complex discrete networks have been used to integrate available molecular information in particular experimental systems. First, we will briefly discuss a case in which one of the gene interactions was predicted by a network model, and it was later corroborated experimentally. Importantly, this case involves a feedback loop or gene regulatory circuit, such as those likely overlooked in classical epistasis analyses.
In the flower organ specification network proposed for A. thaliana (Espinosa-Soto et al., 2004) a positive feedback loop was predicted for the gene AGAMOUS (AG; Espinosa-Soto et al., 2004). This seemed unlikely to occur given that in the ag-1 mutant plants, which produce a non-functional AG mRNA, the pattern of AG mRNA expression is as in wild-type Arabidopsis lines (Gustafson-Brown et al., 1994). However, these data could still be compatible with an AG positive feedback loop because in the ag-1 background the non-active mutant AG protein is unable to downregulate AG’s activator WUSCHEL (WUS). Thus WUS, in the ag-1 background, would permanently upregulate transcription of the non-functional AG mRNA.
To test the dynamic consequences of the AG positive feedback loop, a gene regulatory network model was used to simulate a network lacking the loop for AG. The results showed that in this case, some of the expected network features were lost. Here, the whole set of data (including many classical epistasis analyses) helped to build a dynamic network and to predict a gene regulatory subgraph that had been overlooked and that was later verified by independent experiments in another laboratory (Gómez-Mena et al., 2005). Other experiments to test this were also suggested from the network analyses and included ectopic GUS staining in an AG:GUS × 35S::AG cross.
A similar case was found in the network underlying Arabidopsis root epidermis cellular sub-differentiation. This system has been relatively well studied from experimental and theoretical perspectives and there are two non-exclusive models that aim to provide a dynamic account of said patterning process. One of these models is the “Mutual Support” model put forward by Savage et al. (2008) and the other one is the so-called “WER self-activation” model put forward by Benítez et al. (2008). As its name suggests, the latter relies on the self-activation of the gene WER (see recent review in Benítez et al., 2011).
In order to help discern between these two models, Savage and coworkers assessed the activity of the WER promoter in a wer loss-of-function line. In this line, WER is still present. If this gene were located on a linear regulatory pathway, this experiment would have sufficed to rule out the “WER self-activation” model, as some authors have suggested (Savage et al., 2008; Roeder et al., 2011a), but since this gene is immersed in a complex network, this experiment is not conclusive. It is possible to picture a scenario in which WER has more than one possible input and therefore sustains its expression even when one of these inputs is lacking. A network-based study of this patterning system suggests that these two models act in a partially redundant manner during root development, conferring robustness to the overall system when both are considered (see a more detailed discussion in Alvarez-Buylla et al., 2011; Roeder et al., 2011b; Benítez et al., 2011). Further theoretical and empirical work will be required in order to establish how common the reinforcing action of partially redundant subgraphs is, in which types of regulatory networks they arise, and which experimental setups can help uncover them.
There are other examples like the two reviewed here among the gene regulatory network literature (Li et al., 2006; Chickarmane and Peterson, 2008; Azpeitia et al., 2010; Faculty of 1000, 20101). They show that Boolean network models are useful tools in integrating the reported experimental molecular data, as well as to detect missing interactions, postulate novel ones and design new crosses and experiments.
Concluding Remarks
In this article we have focused on the assumptions of hierarchical and single-path notions of gene regulation, as well as on the importance of considering temporal dynamics of gene regulation when performing a classical epistasis analysis. With the use of simple examples, we have shown how if we assume non-synchronous dynamics and complex non-hierarchical, multi-path gene interactions, more precise inferences of gene interactions can be reached. A network-based perspective not only complements classical epistasis analysis, but it also challenges the notion of a blueprint contained in genes, a linear relationship between genotype and phenotype, and the atomization of an organism’s traits and cell types based on the premise that genes are particulate, stable, and separable and hence can be studied in isolation of other regulatory elements (Greenspan, 2001; Newman et al., 2006; Alvarez-Buylla et al., 2008).
Besides the use of network modeling to address how genes map onto phenotypical traits and such developmental processes evolve (Albert and Othmer, 2003; Espinosa-Soto et al., 2004; Batten et al., 2008; Kwon and Cho, 2008; Wagner, 2009), some authors have addressed the use of such models specifically for epistasis analyses (e.g., Phillips, 2008; Tyler et al., 2009; Battle et al., 2010; Jiang et al., 2011; Phenix et al., 2011) in order to relax some of its assumptions, expand its applicability, and improve its inference capacity. We specifically argued that Boolean network approaches, which like classical epistasis analysis use a logical approach, naturally complement it and provide more accurate inferences of gene interactions. We provided several theoretical and real examples. Boolean network modeling is intuitive and practical and has been validated for several biological systems.
Network approaches are contributing to the integration of complex interactions at the genetic and other levels of organization, creating a formal language to build up rigorous databases, and the creation of a novel set of terms and concepts for understanding biological research. We think that the use of network-based approaches is a promising field and its application in order to understand a wide range of biological systems is underway.
Conflict of Interest Statement
The authors declare that the research was conducted in the absence of any commercial or financial relationships that could be construed as a potential conflict of interest.
Acknowledgments
Financial support for Eugenio Azpeitia was provided by the Ph.D. grant program of CONACyT; financial support for Mariana Benítez was provided by C3, Centro de Ciencias de la Complejidad (Torre de Ingeniería, UNAM) and by the Czech Ministry of Eduction, youth and sports (grant LC06034). Elena R. Alvarez-Buylla thanks financial support from Conacyt (81433, 81542, 90565) and PAPIIT (IN210408, IN229009-3, IN223607-3). Carlos Espinosa-Soto is supported by a CONACyT postdoctoral fellowship. We thank Rigoberto V. Perez-Ruiz and Diana Romo for technical and logistical assistance. We thank Lynna Kiere for a thoughtful revision of the manuscript. We also thank two anonymous reviewers for their thoughtful comments.
Footnote
- ^Faculty of 1000 evaluations, dissents, and comments for [Hassan, H. et al. (2010). JACKDAW controls epidermal patterning in the Arabidopsis root meristem through a non-cell-autonomous mechanism. Development 137, 1523–1529]. Faculty of 1000, 03 Jun 2010. F1000.com/3432957.
References
Alberch, P. (1989). The logic of monsters: evidence for internal constraint in development and evolution. Geobios Mem. Spec. 12, 21–57.
Albert, R., and Othmer, H. G. (2003). The topology of the regulatory interactions predicts the expression pattern of the segment polarity genes in Drosophila melanogaster. J. Theor. Biol. 223, 1–18.
Aldana, M., Balleza, E., Kauffman, S., and Resendiz, O. (2007). Robustness and evolvability in genetic regulatory networks. J. Theor. Biol. 245, 433–448.
Alvarez-Buylla, E. R., Balleza, E., Benítez, M., Espinosa-Soto, C., and Padilla-Longoria, P. (2008). “Gene regulatory network models: a dynamic and integrative approach to development,” in Practical Systems Biology, eds A. Hetherington and C. Grierson (New York, NY: Taylor and Francis).
Alvarez-Buylla, E. R., Benítez, M., Corvera-Poiré, A., Candor, A. C., de Folter, S., de Buen, A. G., Garay-Arroyo, A., García-Ponce, B., Jaimes-Miranda, F., Pérez-Ruiz, R. V., neiro Nelson, A. P., and Sánchez-Corrales, Y. E. (2010). Flower development. Arabidopsis Book 8, e0999.
Alvarez-Buylla, E. R., Benítez, M., Dávila, E. B., Chaos, A., Espinosa-Soto, C., and Padilla-Longoria, P. (2007). Gene regulatory network models for plant development. Curr. Opin. Plant Biol. 10, 83–91.
Alvarez-Buylla, E. R., Benítez, M., and Espinosa-Soto, C. (2011). Mutually reinforcing patterning mechanisms. Nat. Rev. Mol. Cell. Biol. 12, 533.
Avery, L., and Wasserman, S. (1992). Ordering gene function: the interpretation of epistasis in regulatory hierarchies. Trends Genet. 8, 312–316.
Aylor, D. L., and Zeng, Z. B. (2008). From classical genetics to quantitative genetics to systems biology: modeling epistasis. PLoS Genet. 4, e1000029. doi:10.1371/journal.pgen.1000029
Azpeitia, E., Benítez, M., Vega, I., Villarreal, C., and Alvarez-Buylla, E. R. (2010). Single-cell and coupled GRN models of cell patterning in the Arabidopsis thaliana root stem cell niche. BMC Syst. Biol. 4, 134. doi:10.1186/1752-0509-4-134
Balleza, E., Alvarez-Buylla, E. R., Chaos, A., Kauffman, S., Shmulevich, I., and Aldana, M. (2008). Critical dynamics in genetic regulatory networks: examples from four kingdoms. PLoS ONE 3, e2456. doi:10.1371/journal.pone.0002456
Batten, D., Salthe, S., and Boschetti, F. (2008). Visions of evolution: self-organization proposes what natural selection disposes. Biol. Theory 3, 17–29.
Battle, A. l., Jonikas, M. C., Walter, P., Weissman, J. S., and Koller, D. (2010). Automated identification of pathways from quantitative genetic interaction data. Mol. Syst. Biol. 8, 379.
Benítez, M., Espinosa-Soto, C., Padilla-Longoria, P., and Alvarez-Buylla, E. R. (2008). Interlinked nonlinear subnetworks underlie the formation of robust cellular patterns in Arabidopsis epidermis: a dynamic spatial model. BMC Syst. Biol. 2, 98. doi:10.1186/1752-0509-2-98
Benítez, M., Monk, N. A., and Alvarez-Buylla, E. R. (2011). Epidermal patterning in Arabidopsis: models make a difference. J. Exp. Zool. B Mol. Dev. Evol. 316, 241–253.
Bornholdt, S. (2008). Boolean network models of cellular regulation: prospects and limitations. J. R. Soc. Interface 5(Suppl. 1), S85–S94.
Bowler, P. J. (1983). The Eclipse of Darwinism: Anti-Darwinian Evolution Theories in the Decades Around 1900. Baltimore: Johns Hopkins University Press.
Brandman, O., and Meyer, T. (2008). Feedback loops shape cellular signals in space and time. Science 322, 390–395.
Callebaut, W., and Rasskin-Gutman, D. (2009). Modularity: Understanding the Development and Evolution of Natural Complex Systems. Cambridge: MIT Press.
Calzone, L., Fages, F., and Soliman, S. (2006). BIOCHAM: an environment for modeling biological systems and formalizing experimental knowledge. Bioinformatics 22, 1805–1807.
Chickarmane, V., and Peterson, C. (2008). A computational model for understanding stem cell, trophectoderm and endoderm lineage determination. PLoS ONE 3, e3478.
Davidich, M. I., and Bornholdt, S. (2008). Boolean network model predicts cell cycle sequence of fission yeast. PLoS ONE 3, e1672.
Davidson, E. (2001). Genomic Regulatory Systems. Development and Evolution. New York: Academic Press.
Davidson, E. H., and Erwin, D. H. (2006). Gene regulatory networks and the evolution of animal body plans. Science 311, 796–800.
de Jong, H. (2002). Modeling and simulation of genetic regulatory systems: a literature review. J. Comput. Biol. 9, 67–103.
de Jong, H., Geiselmann, J., Hernández, C., and Page, M. (2003). Genetic network analyzer: qualitative simulation of genetic regulatory networks. Bioinformatics 19, 336–344.
Di Cara, A., Garg, A., De Micheli, G., Xenarios, I., and Mendoza, L. (2007). Dynamic simulation of regulatory networks using SQUAD. BMC Bioinformatics 8, 462.
Didier, G., Remy, E., and Chaouiya, C. (2011). Mapping multivalued onto Boolean dynamics. J. Theor. Biol. 270, 177–184.
Espinosa-Soto, C., Padilla-Longoria, P., and Alvarez-Buylla, E. R. (2004). A gene regulatory network model for cell-fate determination during Arabidopsis thaliana flower development that is robust and recovers experimental gene expression profiles. Plant Cell 16, 2923–2939.
Fauré, A., Naldi, A., Chaouiya, C., and Thieffry, D. (2006). Dynamical analysis of a genetic Boolean model for the control of the mammalian cell cycle. Bioinformatics 22, e124–e131.
Fujita, H., Toyokura, K., Okada, K., and Kawaguchi, M. (2011). Reaction-diffusion pattern in shoot apical meristem of plants. PLoS ONE 6, e18243.
Giacomantonio, C. E., and Goodhill, G. J. (2010). A Boolean model of the gene regulatory network underlying Mammalian cortical area development. PLoS Comput. Biol. 6, e1000936.
Gierer, A., and Meinhardt, H. (1972). A theory of biological pattern formation. Kybernetik 12, 30–39.
Gómez-Mena, C., de Folter, S., Costa, M. M., Angenent, G. C., and Sablowski, R. (2005). Transcriptional program controlled by the floral homeotic gene AGAMOUS during early organogenesis. Development 132, 429–438.
Goodwin, B. (2001). How the Leopard Changed Its Spots: The Evolution of Complexity. New Jersey: Princeton University Press.
Gordon, S. P., Chickarmane, V. S., Ohno, C., and Meyerowitz, E. M. (2009). Multiple feedback loops through cytokinin signaling control stem cell number within the Arabidopsis shoot meristem. Proc. Natl. Acad. Sci. U.S.A. 106, 16529–16534.
Gould, S. J. (2002). The Structure of Evolutionary Theory. Cambridge: Belknap Press of Harvard University Press.
Griffiths, P. E., and Gray, R. D. (1994). Developmental systems and evolutionary explanation. J. Philos. XCI, 277–304.
Gustafson-Brown, C., Savidge, B., and Yanofsky, M. F. (1994). Regulation of the Arabidopsis floral homeotic gene AP1. Cell 76, 131–143.
Huang, L. S., and Sternberg, P. W. (2006). Genetic dissection of developmental pathways. WormBook 14, 1–19.
Jablonka, E., and Lamb, M. J. (2005). Evolution in Four Dimensions. Genetic, Epigenetic, Behavioral, and Symbolic Variation in the History of Life. Cambridge: MIT Press.
Jaeger, J., Irons, D., and Monk, N. (2008). Regulative feedback in pattern formation: towards a general relativistic theory of positional information. Development 135, 3175–3183.
Jiang, X., Neapolitan, R. E., Barmada, M. M., and Visweswaran, S. (2011). Learning genetic epistasis using Bayesian network scoring criteria. BMC Bioinformatics 12, 89.
Kaplan, S., Bren, A., Dekel, E., and Alon, U. (2008). The incoherent feed-forward loop can generate non-monotonic input functions for genes. Mol. Syst. Biol. 4, 203.
Kauffman, S. (1969). Homeostasis and differentiation in random genetic control networks. Nature 224, 177–178.
Kondo, S., and Miura, T. (2010). Reaction-diffusion model as a framework for understanding biological pattern formation. Science 329, 1616–1620.
Kwon, Y. K., and Cho, K. H. (2008). Coherent coupling of feedback loops: a design principle of cell signaling networks. Bioinformatics 24, 1926–1932.
Levesque, M. P., Vernoux, T., Busch, W., Cui, H., Wang, J. Y., Blilou, I., Hassan, H., Nakajima, K., Matsumoto, N., Lohmann, J. U., Scheres, B., and Benfey, P. N. (2006). Whole-genome analysis of the SHORT-ROOT developmental pathway in Arabidopsis. PLoS Biol. 4, e143.
Lewontin, R. (2000). “Foreword,” in The Ontogeny of Information: Developmental Systems and Evolution, ed. S. Oyama (Durham: Duke University Press), vii–xv.
Li, F., Long, T., Lu, Y., Ouyang, Q., and Tang, C. (2004). The yeast cell-cycle network is robustly designed. Proc. Natl. Acad. Sci. U.S.A. 101, 4781–4786.
Li, S., Assmann, S. M., and Albert, R. (2006). Predicting essential components of signal transduction networks: a dynamic model of guard cell abscisic acid signaling. PLoS Biol. 4, e312.
Longo, G., and Tendero, P.-E. (2007). The differential method and the causal incompleteness of Programming Theory in Molecular Biology. Found. Sci. 12, 337–366.
Lorenz, K. (1965). Evolution and Modification of Behaviour. Chicago: The University of Chicago Press.
Mangan, S., and Alon, U. (2003). Structure and function of the feed-forward loop network motif. Proc. Natl. Acad. Sci. U.S.A. 100, 11980–11985.
Mangan, S., Zaslaver, A., and Alon, U. (2003). The coherent feedforward loop serves as a sign-sensitive delay element in transcription networks. J. Mol. Biol. 334, 197–204.
Mayr, E., and Provine, W. B. (1980). The Evolutionary Synthesis: Perspectives on the Unification of Biology. Cambridge: Harvard University Press.
Meinhardt, H., and Gierer, A. (2000). Pattern formation by local self-activation and lateral inhibition. Bioessays 22, 753–760.
Milo, R., Shen-Orr, S., Itzkovitz, S., Kashtan, N., Chklovskii, D., and Alon, U. (2002). Network motifs: simple building blocks of complex networks. Science 298, 824–827.
Mitrophanov, A. Y., and Groisman, E. A. (2008). Positive feedback in cellular control systems. Bioessays 30, 542–555.
Moore, J. H., and Williams, S. M. (2005). Traversing the conceptual divide between biological and statistical epistasis: systems biology and a more modern synthesis. Bioessays 27, 637–646.
Morata, G., and Lawrence, P. A. (1977). Homoeotic genes, compartments and cell determination in Drosophila. Nature 265, 211–216.
Müssel, C., Hopfensitz, M., and Kestler, H. A. (2010). BoolNet – an R package for generation, reconstruction and analysis of Boolean networks. Bioinformatics 26, 1378–1380.
Newman, M., Barabasi, A.-L., and Watts, D. (2006). The Structure and Dynamics of Networks. New Jersey: Princeton Studies in complexity.
Nochomovitz, Y. D., and Li, H. (2006). Highly designable phenotypes and mutational buffers emerge from a systematic mapping between network topology and dynamic output. Proc. Natl. Acad. Sci. U.S.A. 103, 4180–4185.
Oyama, S. (1985). The Ontogeny of Information: Developmental Systems and Evolution. Cambridge: Cambridge University Press.
Phenix, H., Morin, K., Batenchuk, C., Parker, J., Abedi, V., Yang, L., Tepliakova, L., Perkins, T. J., and Kærn, M. (2011). Quantitative epistasis analysis and pathway inference from genetic interaction data. PLoS Comput. Biol. 7, e1002048. doi:10.1371/journal.pcbi.1002048
Phillips, P. C. (2008). Epistasis – the essential role of gene interactions in the structure and evolution of genetic systems. Nat. Rev. Genet. 9, 855–867.
Pigliucci, M. (2009). An extended synthesis for evolutionary biology. Ann. N. Y. Acad. Sci. 1168, 218–228.
Pigliucci, M., and Müller, G. B. (2010). Evolution – the Extended Synthesis. Cambridge: The MIT Press.
Robert, J. S. (2004). Embryology, Epigenesis and Evolution: Taking Development Seriously. Cambridge: Cambridge University Press.
Roeder, A. H., Tarr, P. T., Tobin, C., Zhang, X., Chickarmane, V., Cunha, A., and Meyerowitz, E. M. (2011a). Computational morphodynamics of plants: integrating development over space and time. Nat. Rev. Mol. Cell Biol. 12, 265–273.
Roeder, A. H., Tarr, P. T., Tobin, C., Zhang, X., Chickarmane, V., Cunha, A., and Meyerowitz, E. M. (2011b). Mutually reinforcing patterning mechanisms: authors’ reply. Nat. Rev. Mol. Cell Biol. 12, 533.
Salazar-Ciudad, I. (2006). Developmental constraints vs. variational properties: how pattern formation can help to understand evolution and development. J. Exp. Zool. B Mol. Dev. Evol. 306, 107–125.
Savage, N. S., Walker, T., Wieckowski, Y., Schiefelbein, J., Dolan, L., and Monk, N. A. (2008). A mutual support mechanism through intercellular movement of CAPRICE and GLABRA3 can pattern the Arabidopsis root epidermis. PLoS Biol. 6, e235. doi:10.1371/journal.pbio.0060235
Schoof, H., Lenhard, M., Haecker, A., Mayer, K. F., Jürgens, G., and Laux, T. (2000). The stem cell population of Arabidopsis shoot meristems is maintained by a regulatory loop between CLAVATA and WUSCHEL genes. Cell 100, 635–644.
Shen-Orr, S. S., Milo, R., Mangan, S., and Alon, U. (2002). Network motifs in the transcriptional regulation network of Escherichia coli. Nat. Genet. 31, 64–68.
Shmulevich, I., and Kauffman, S. A. (2004). Activities and sensitivities in boolean network models. Phys. Rev. Lett. 93, 048701.
St Onge, R. P., Mani, R., Oh, J., Proctor, M., Fung, E., Davis, R. W., Nislow, C., Roth, F. P., and Giaever, G. (2007). Systematic pathway analysis using high-resolution fitness profiling of combinatorial gene deletions. Nat. Genet. 39, 199–206.
Tong, A. H., Lesage, G., Bader, G. D., Ding, H., Xu, H., Xin, X., Young, J., Berriz, G. F., Brost, R. L., Chang, M., Chen, Y., Cheng, X., Chua, G., Friesen, H., Goldberg, D. S., Haynes, J., Humphries, C., He, G., Hussein, S., Ke, L., Krogan, N., Li, Z., Levinson, J. N., Lu, H., Ménard, P., Munyana, C., Parsons, A. B., Ryan, O., Tonikian, R., Roberts, T., Sdicu, A. M., Shapiro, J., Sheikh, B., Suter, B., Wong, S. L., Zhang, L. V., Zhu, H., Burd, C. G., Munro, S., Sander, C., Rine, J., Greenblatt, J., Peter, M., Bretscher, A., Bell, G., Roth, F. P., Brown, G. W., Andrews, B., Bussey, H., and Boone, C. (2004). Global mapping of the yeast genetic interaction network. Science 303, 808–813.
Tyler, A. L., Asselbergs, F. W., Williams, S. M., and Moore, J. H. (2009). Shadows of complexity: what biological networks reveal about epistasis and pleiotropy. Bioessays 31, 220–227.
von Dassow, G., Meir, E., Munro, E. M., and Odell, G. M. (2000). The segment polarity network is a robust developmental module. Nature 406, 188–192.
Wagner, A. (2009). Evolutionary constraints permeate large metabolic networks. BMC Evol. Biol. 9, 231. doi:10.1186/1471-2148-9-231
Wagner, G. P., Pavlicev, M., and Cheverud, J. M. (2007). The road to modularity. Nat. Rev. Genet. 8, 921–931.
Watson, J. D., and Crick, F. H. (1953). Molecular structure of nucleic acids; a structure for deoxyribose nucleic acid. Nature 171, 737–738.
Wittmann, D. M., Krumsiek, J., Saez-Rodriguez, J., Lauffenburger, D. A., Klamt, S., and Theis, F. J. (2009). Transforming Boolean models to continuous models: methodology and application to T-cell receptor signaling. BMC Syst. Biol. 3, 98. doi:10.1186/1752-0509-3-98
Keywords: epistasis, gene regulatory networks, Boolean networks, feedback loops, feed-forward loops, temporal dynamics, modeling, gene interactions
Citation: Azpeitia E, Benítez M, Padilla-Longoria P, Espinosa-Soto C and Alvarez-Buylla ER (2011) Dynamic network-based epistasis analysis: Boolean examples. Front. Plant Sci. 2:92. doi: 10.3389/fpls.2011.00092
Received: 03 May 2011;
Accepted: 17 November 2011;
Published online: 15 December 2011.
Edited by:
Holger Puchta, Karlsruhe Institute of Technology, GermanyCopyright: © 2011 Azpeitia, Benítez, Padilla-Longoria, Espinosa-Soto and Alvarez-Buylla. This is an open-access article distributed under the terms of the Creative Commons Attribution Non Commercial License, which permits non-commercial use, distribution, and reproduction in other forums, provided the original authors and source are credited.
*Correspondence: Elena R. Alvarez-Buylla, Laboratorio de Genética Molecular, Desarrollo y Evolución de Plantas, Dpto de Ecología Funcional, Instituto de Ecología, 3er Circuito Exterior, Junto a Jardín Botánico, CU, Coyoacán, Mexico D.F. 04510, Mexico. e-mail: eabuylla@gmail.com