 Guillaume A. Rousselet1* Carl M. Gaspar1 Cyril R. Pernet2 Jesse S. Husk3 Patrick J. Bennett4 Allison B. Sekuler4
- 1 Centre for Cognitive Neuroimaging, Department of Psychology, University of Glasgow, Glasgow, UK
- 2 SFC Brain Imaging Research Centre, Division of Clinical Neurosciences, Western General Hospital, Edinburgh, UK
- 3 McGill Vision Research Unit, Department of Ophthalmology, McGill University, Montreal, QC, Canada
- 4 Department of Psychology, Behaviour and Neuroscience, McMaster University, Hamilton, ON, Canada
We used a single-trial ERP approach to quantify age-related changes in the time-course of noise sensitivity. A total of 62 healthy adults, aged between 19 and 98, performed a non-speeded discrimination task between two faces. Stimulus information was controlled by parametrically manipulating the phase spectrum of these faces. Behavioral 75% correct thresholds increased with age. This result may be explained by lower signal-to-noise ratios in older brains. ERP from each subject were entered into a single-trial general linear regression model to identify variations in neural activity statistically associated with changes in image structure. The fit of the model, indexed by R2, was computed at multiple post-stimulus time points. The time-course of the R2 function showed significantly delayed noise sensitivity in older observers. This age effect is reliable, as demonstrated by test–retest in 24 subjects, and started about 120 ms after stimulus onset. Our analyses suggest also a qualitative change from a young to an older pattern of brain activity at around 47 ± 4 years old.
Introduction
Visual cognition depends on fast and progressive transformations of retinal inputs into higher-order representations useful for decision-making (Rousselet et al., 2004; DiCarlo and Cox, 2007; Schyns et al., 2009). Hence, a theory of visual aging must specify how aging affects the time-course of visual processing, the information content of brain activity, and the operations performed on this information.
In this paper, we are primarily interested in age-related changes in the time-course of object processing. Fast processing has an obvious survival value and is essential for neural network coordination (Bullier, 2001; Uhlhaas et al., 2009). However, several results suggest that neural processes slow with age. First, in monkeys and in humans, aging is associated with a degradation of myelinated nerve fibers (Thomas et al., 2008; Davis et al., 2009; Peters, 2009; Piguet et al., 2009), which logically should lead to conduction slowing along these fibers. Second, the response selectivity of V1 and V2 neurons degrades with age in monkeys (Leventhal et al., 2003; Wang et al., 2005; Yu et al., 2006). Similarly, in the higher-order cortex of humans, age seems to lessen BOLD preferential categorical responses (Park et al., 2004; Voss et al., 2008). Such changes in tuning may lead to longer processing times, following a model of perceptual decision by accumulation of evidence in neuronal populations (Perrett et al., 1998). Third, spike timing within V1, and between V1 and V2, but not between the LGN and V1, has been shown to increase with age in monkeys (Wang et al., 2005). Finally, EEG and MEG studies in humans have described age-related increases in the peak latency of the P100 component in response to checkerboards and sine-wave gratings (Tobimatsu, 1995).
Overall, these structural and physiological changes suggest that senescence slows the whole cascade of information processing along the ventral pathway involved in object processing. Several studies have tested this prediction in humans using faces. Surprisingly, the results are inconsistent. Five studies have reported no effect of aging on early perceptual processing speed (Chaby et al., 2001, 2003; Pfutze et al., 2002; de Fockert et al., 2009; Gao et al., 2009), whereas three studies did report an effect around 150–200 ms after stimulus onset (Nakamura et al., 2001; Gazzaley et al., 2008; Wiese et al., 2008).
These eight studies used EEG or MEG component peak latencies to estimate processing speed and made a series of assumptions: (1) peak latency is a good measure of processing speed; (2) activity between peaks is irrelevant; (3) one ERP peak is often associated with one mechanism; (4) the link between a component and a process is stable over the life-span. In a recent study, we used a component-free approach, which does not rely on these unwarranted assumptions (Rousselet et al., 2009). We manipulated image structure systematically by varying the phase spectra of our stimuli along a continuum from 100% phase coherence (i.e., the original phase spectrum) to 0% phase coherence (i.e., completely random phase, Philiastides and Sajda, 2006; Rousselet et al., 2008b). A linear model was applied at all electrodes and time points in each subject, thus providing a spatial–temporal mapping of phase noise sensitivity that is not constrained to a priori defined events and time-windows. Because of the inter-individual differences in brain anatomy, scalp projections of neuronal activity can differ across subjects, with different electrodes showing the best model fit. Thus, one electrode showing the best model fit, as indexed by R2, was selected independently for each subject and entered into group analyses. This electrode optimization ensures that signals from electrodes with maximum sensitivity to image structure are compared; R2, the variance explained by the model, is a measure of the amount of information in the model. Hence, R2 time-courses eliminate effects caused by group differences in absolute response amplitude and provide a response metric that is based on the visual system’s sensitivity to image structure. Using this approach, we showed that the visual system of older adults (mean age 70) becomes sensitive to image structure at about the same time as younger adults (mean age 22), but then shows a systematic delay, culminating 190 ms after stimulus onset with a 50-ms delay between age groups (Rousselet et al., 2009). This 50-ms difference is considerably greater than previous estimates of 10–20 ms derived from peak measurements (Nakamura et al., 2001; Gazzaley et al., 2008; Wiese et al., 2008). In addition to a delay in noise sensitivity with age, we observed a qualitative change in the shape of the R2 function with age. Behavioral results also suggested that older subjects needed more information to achieve the same level of performance as younger subjects.
In the present study, we sought to provide a more quantitative description of the effect of aging on visual processing and to assess the reliability of this effect. To this aim, we merged the data from the 31 subjects described previously (Rousselet et al., 2009), with data from another 31 subjects. The new data set also contained middle-aged participants, allowing us to assess age-related qualitative but also quantitative changes in the time-course of visual processing. Among the new subjects, 24 were tested twice to determine the reliability of the effects.
Materials and Methods
Square brackets indicate the boundaries of 95% confidence intervals (CI) constructed using a percentile bootstrap technique (Wilcox, 2005). We used 1000 samples with replacement for descriptive statistics and group comparisons; we used 600 samples with replacement, and special adjustments to better control the type I error rate (Wilcox, 2005, pp. 418–419), to compute CI for regression parameters. P values of 0 are sometime reported – this is unusual for parametric statistics relying on an a priori distribution, but it is not impossible when the P value is computed from a bootstrapped distribution.
Testing procedures differed between the two subject groups, because of different laboratory setups in the two countries where the studies took place, and improvements we brought to the second set of recordings and analyses. We explain these differences below.
Subjects
We recruited 62 subjects from subject pools and the community in Canada (n = 31) and the UK (n = 31). We reported data from the Canadian group in Rousselet et al. (2009). Table 1 contains data pooled across the two groups of subjects.
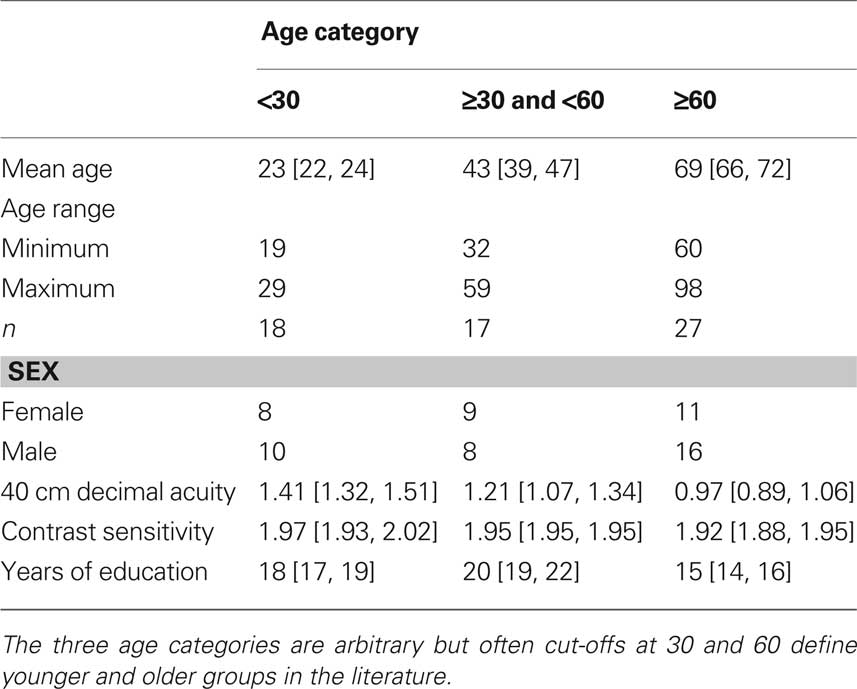
Table 1. Details of subjects split into three age categories.
All subjects received CAN$10/h or £6/h for their participation and gave written informed consent. The research ethics boards from McMaster University and the University of Glasgow approved the research protocols.
All subjects reported that they did not have cataracts, macular degeneration, amblyopia, or any other visual pathology. Younger adults had significantly better near decimal acuity and Pelli-Robson contrast sensitivity than older adults (slopes of the linear regression: acuity = −0.009 [−0.01, −0.006], P = 0; contrast sensitivity = −0.001 [−0.003, 0], P = 0.03). Additionally, younger subjects had more years of education (slope = −0.08 [−0.11, −0.05], P = 0). Subjects over 50 years old completed the Mini-Mental State Examination (MMSE) in Canada (median score 29, min = 26, max = 30), and the Montreal Cognitive Assessment (MOCA) in the UK (median score 28, min = 27, max = 30). All subjects scored above the thresholds for normal subjects.
Experimental Design
We tested subjects in two experimental sessions. The first day was a practice behavioral session; the second day consisted of both a behavioral task and simultaneous EEG recordings. In the UK group, 24 subjects participated in an additional EEG session. Each day, subjects performed a one-interval, two-alternative forced choice task discriminating between the same two faces. On each trial, one face appeared briefly (53 ms), and subjects had to indicate which of two possible faces was presented by pressing 1 or 2 on the numerical pad of the keyboard. The button-identity association was assigned randomly for all subjects. Subjects were given unlimited time to respond, and were told to emphasize response accuracy, not speed. Each subject performed the task with a single pair of base faces throughout the experiment. In Canada, for half of the subjects, the base face pair comprised two male faces; for the other half the base face pair comprised two female faces. In the UK, for all subjects the base face pair comprised two male faces. These faces were selected from a set of 10 faces, which are described in detail in previous publications (Gold et al., 1999; Husk et al., 2007; Rousselet et al., 2008a, 2009). Critically, the phase coherence of the faces was manipulated across trials. In Canada, on day 1, subjects saw 11 conditions along a noise–signal continuum, from 0 to 100% phase coherence, with increments of 10%. On day 2, subjects saw only seven conditions (0, 30, 40, 50, 60, 70, 100% phase information). In the UK, on both days, subjects saw 18 conditions along a noise–signal continuum, from 0 to 85% phase coherence, with increments of 5%.
In Canada, on the first day, there were seven blocks of 132 trials: 924 trials in total, with 84 trials per level of phase coherence. The second day, there were 10 blocks of 84 trials: 840 trials in total with 120 trials per level of phase coherence. In the UK, on both days, there were eight blocks of 144 trials: 1152 trials in total, with 64 trials per level of phase coherence. Within each block, there were equal repetitions of each face and each phase coherence level. Each block was preceded by 10 practice trials that allowed subjects to learn the stimulus–key association. In a regular trial, a blank screen was presented for 1000 ms, followed by a small fixation cross (i.e., a 0.3° “+” in the middle of the screen) for 200 ms, after which another blank screen was presented for a random duration ranging from 500 to 1000 ms. Then a test stimulus was presented for 53 ms, followed by a blank screen that stayed on until subjects provided their response. Practice trials were very similar, except that immediately after stimulus presentation, a choice screen appeared that showed each face simultaneously, one above the other, with the corresponding label below each item. Auditory feedback was provided after the subject pressed a response key, with low- and high-pitched tones indicating incorrect and correct responses. Feedback was provided only during practice trials.
Testing was conducted in a dimly-lit, sound-attenuated booth. Viewing distance was maintained with a chinrest, at 90 cm in Canada, and 80 cm in the UK. In Canada, the screen was 25° × 19° of visual angle, and the stimuli 8° × 8°. In the UK, the dimensions were 28° × 21°, and 9° × 9°. Stimuli were presented at an average luminance of about 33 cd/m2.
Behavioral Normalized Threshold
Behavioral percent correct data were modeled by a Weibull function (Rousselet et al., 2009). The goodness of fit was evaluated using a χ2 statistics and a bootstrap procedure with 10,000 resamples (Wichmann and Hill, 2001). In this procedure the model prediction is the null hypothesis and therefore a large P value indicates a reliable fit. Our fits were reliable (mean P value = 0.71 [0.64 0.78]) and did not vary with age (slope of the linear regression = 0.002 [−0.002, 0.006], P = 0.3, R2 = 0.02). From the fit, we obtained an estimate of subjects’ maximal performance and 75% correct thresholds. We used a modeled observer analysis to obtain a benchmark against which to compare subjects’ thresholds. For each observer, the two noise-free target stimuli, face 1 and face 2, served as templates that were cross-correlated (sum of pixel-by-pixel multiplications) with the stimuli shown at each noise level. For each image at a given noise level, the modeled observer response was determined by the largest cross-correlation of that image with templates 1 and 2. Then, we fit the percent correct of the modeled observer using a Weibull function. The ratio of the modeled observer’s 75% correct threshold over the subject’s threshold is a normalized threshold. A normalized threshold of 1 means that the subject was as good as a pixel template matcher.
EEG Recording and Preprocessing
In Canada, we acquired EEG data with a 256-channel Geodesic Sensor Net and pre-processed them as described previously (Rousselet et al., 2009). In the UK, we used a 128-channel Biosemi Active Two EEG system (BioSemi, Amsterdam, Netherlands). We recorded from four additional electrodes – UltraFlat Active BioSemi electrodes – below and at the outer canthi of both eyes. Analog signal was digitized at 512-Hz and band-pass filtered online between 0.1 and 200 Hz. Electrode offsets were kept between ±20 μV.
For both datasets we removed bad channels and down-sampled the signal at 250 Hz. The Canadian dataset was low-pass filtered at 30 Hz, following our observation that evoked responses to faces are contained within a narrow 5–15 Hz band (Rousselet et al., 2007a). In the UK dataset, we applied a 40-Hz low-pass filter and epoched the data between −300 and 1200 ms before using ICA (Makeig et al., 2004), as implemented in the runica EEGLAB function (Delorme and Makeig, 2004; Delorme et al., 2007). We removed ICA corresponding to blink activity, identified by visual inspection of their scalp topographies, time-courses and activity spectra. Subsequently, we re-epoched the data between −300 and 500 ms, and subtracted the average baseline activity from each time point. In both datasets, trials with abnormal activities were excluded based on a ±100 μV threshold for extreme values. An epoch was rejected for abnormal trends if it had a slope larger than 75 μV/epoch and a regression R2 larger than 0.3. All remaining trials were included in the analyses, whether they were associated with correct or incorrect behavioral responses. The average number of trials per subject was 594 [558, 630] in the Canadian group, 1110 [1097, 1122] in the UK group.
General Linear Modeling of EEG Data
We used a GLM approach (Figure 1) to express the single-trial EEG amplitude, in μV, independently at each time point and each electrode, using the model:
EEG = β0 + β1F1 + β2F2 + β3φG + β4φL + ε.
Stimulus identity was coded as two categories in our design matrix. Each column represented the state within one face, with one column for face 1 (F1) and the other for face 2 (F2); in each column a 1 indicated the presence of the face and a 0 indicated the absence of the face. Global phase coherence (φG) and local phase coherence (LPC, φL) were continuous regressors. Global phase coherence was our image noise manipulation. Kovesi’s LPC is a measure of wavelet phase alignment across spatial frequencies which is independent of image contrast and luminance (Kovesi, 1999, 2003). LPC can predict subjects’ behavior in a natural scene classification task (Gaspar and Rousselet, 2009) and seems to provide a good representation of non-linear changes in local image structure imposed by the linear global phase coherence manipulation (Rousselet et al., 2009). β0 is the constant term and ε the error.
We used a generalized Moore–Penrose pseudoinverse to estimate the beta parameters (Moore, 1920; Penrose, 1955). Thus, although the design matrix is rank deficient, the Moore–Penrose pseudoinverse minimizes the norm of the parameters’ vector and therefore their ratios for F or T tests are exact and R2 is identical to that obtained by applying a standard inverse to full rank matrix. In addition, inversion ensures that variance attributed to each regressor is unique even though the regressors might be correlated (Healy, 2000, p. 66, 76; McCulloch et al., 2008, pp. 121–122).
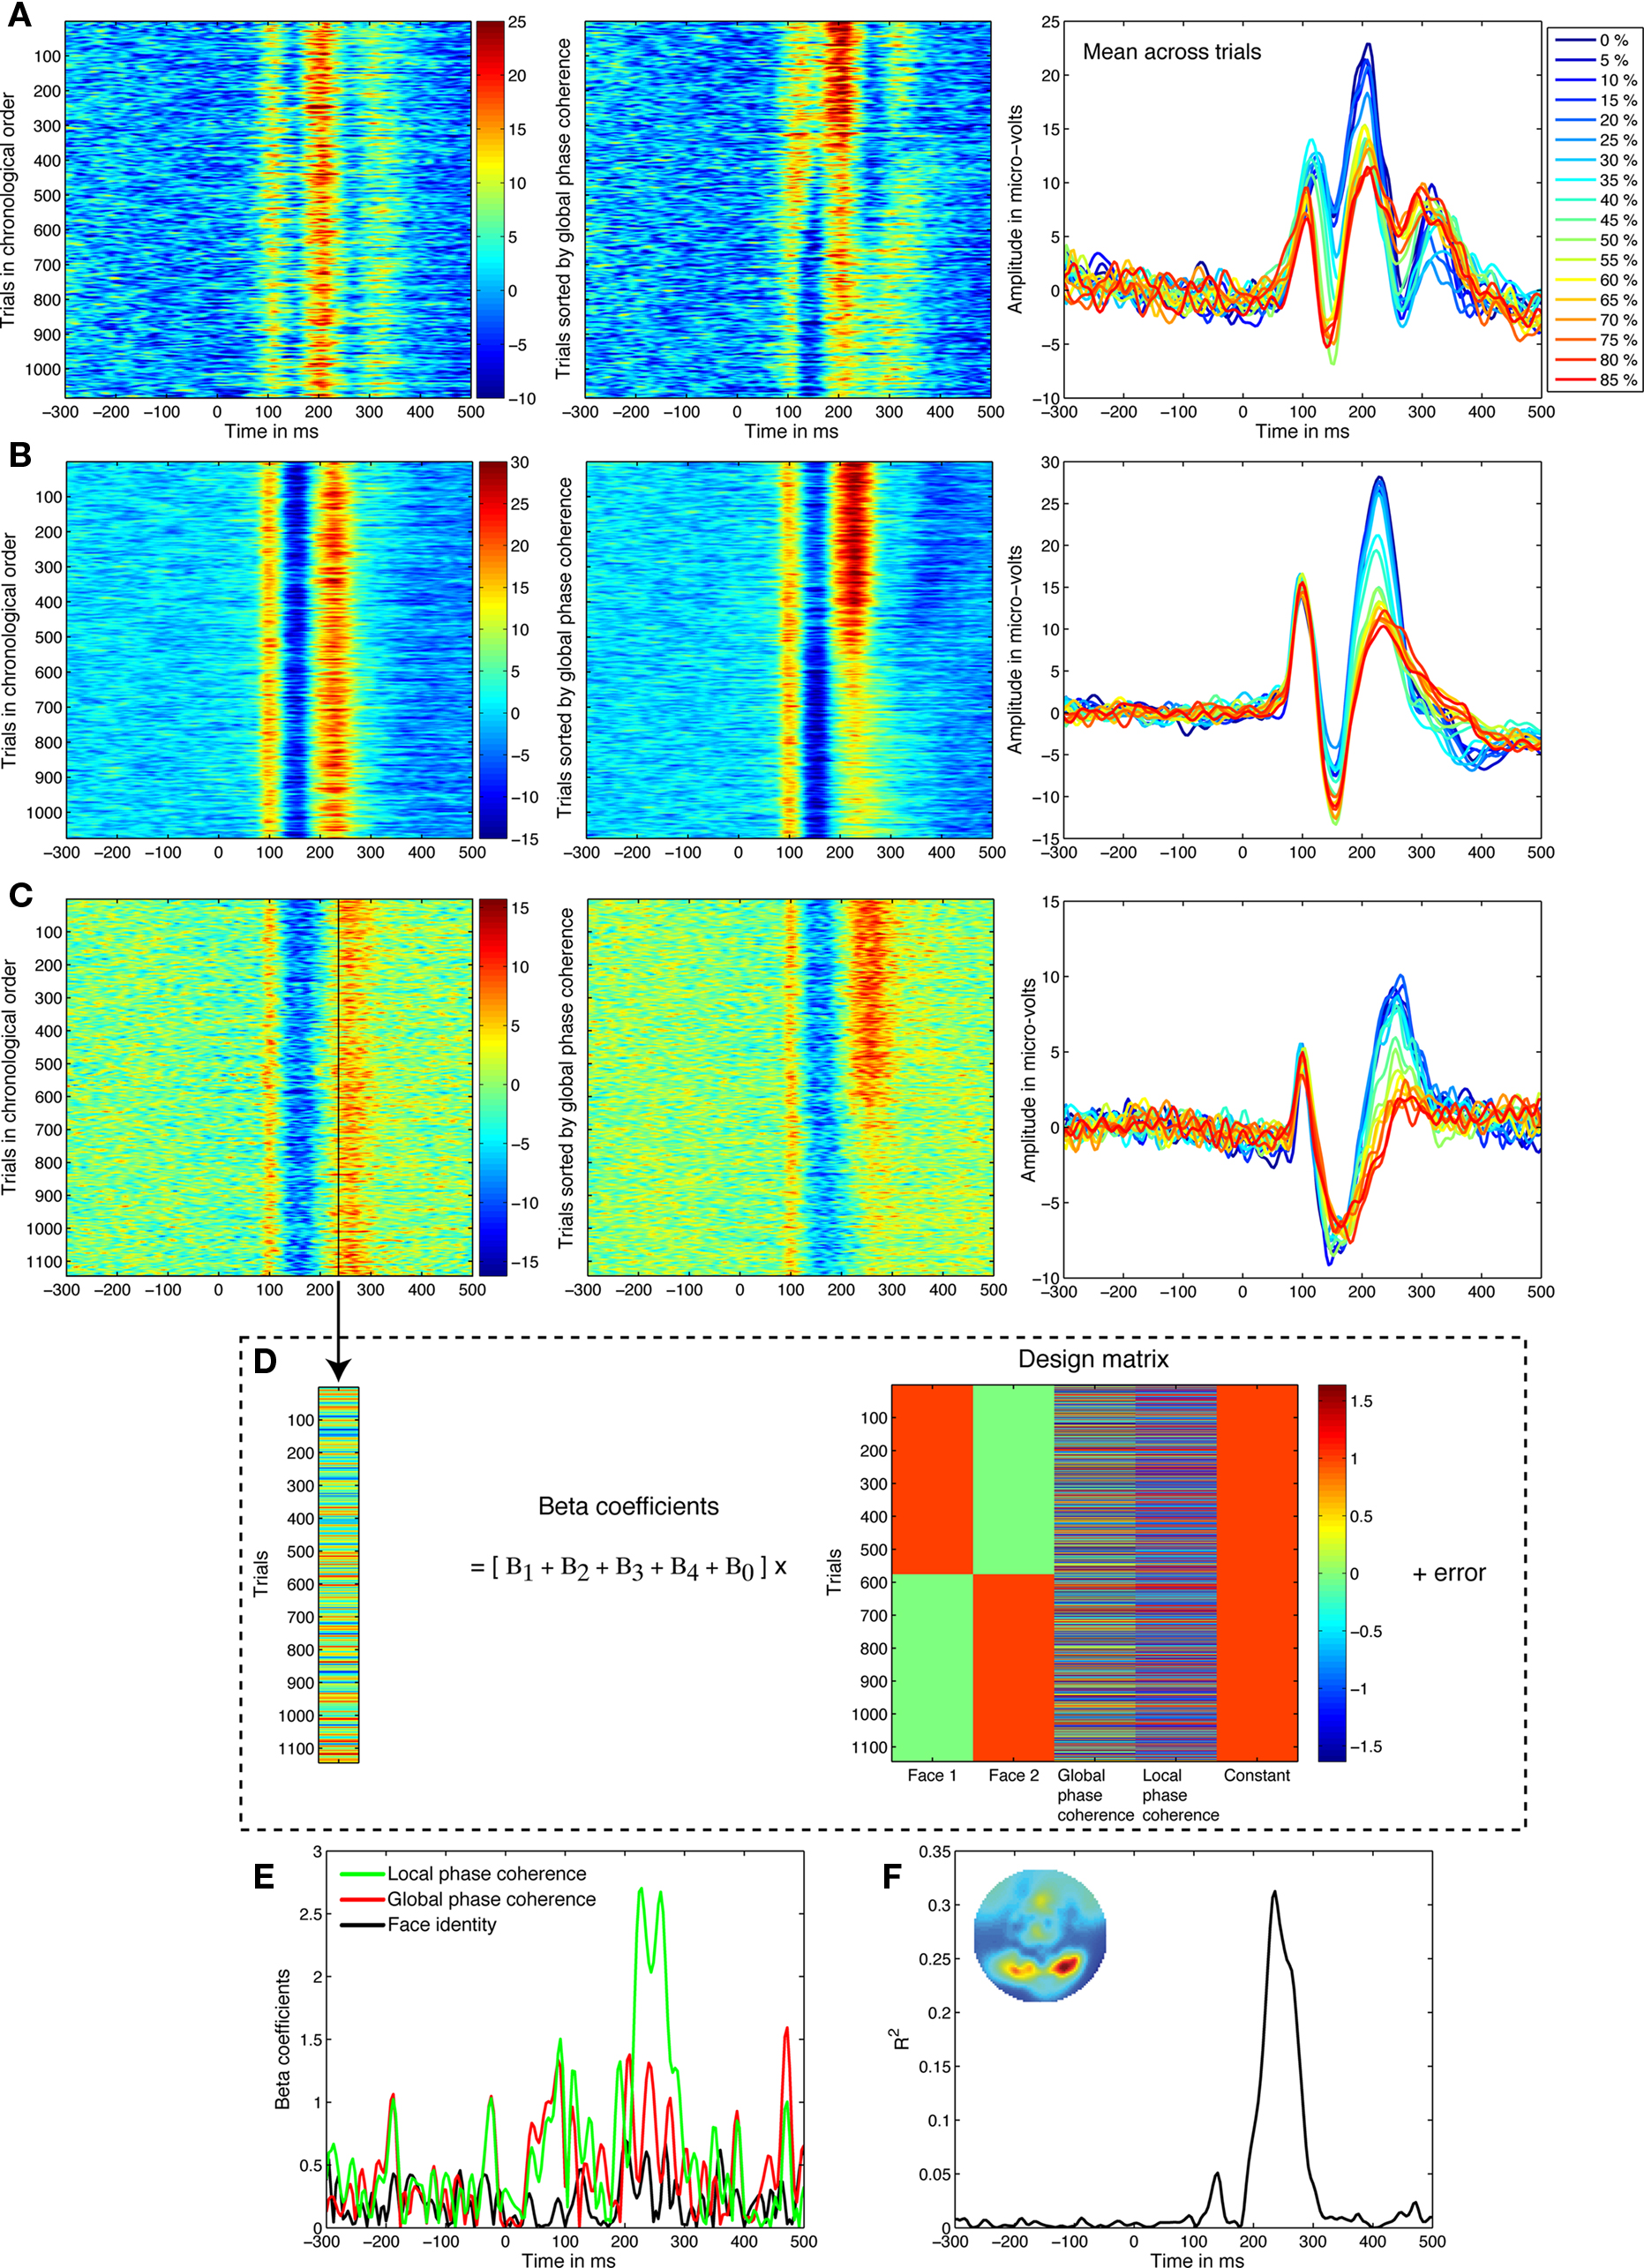
Figure 1. Linear regression analyses. (A) Data from a 21-year-old subject. In the left panel, single trials from the electrode showing the best model fit are sorted from top to bottom in their chronological order. Amplitude in μV is color coded from positive in red to negative in blue, and smoothed by a five-step moving average. In the middle panel, trials are sorted from top to bottom from 0 to 85% phase coherence, revealing strong phase modulations around 200–300 ms. In the right panel, the mean across trials at each noise level confirms this pattern. (B) Data from a 41-year-old subject. (C) Data from an 81-year-old subject. (D) The activity at each time point, like the one marked by a black vertical bar in (C), is decomposed using linear regression. In other words, we identify variations in neural activity across trials that are statistically associated with changes to visual information. Strong associations at certain time-points imply that the visual system activity is significantly modulated by image characteristics. (E) The weights allocated to the predictors can be visualized over time, revealing a stronger contribution of local phase coherence shortly after 200 ms. Face identity is the absolute difference between the face 1 and face 2 predictors. (F) The model R2 provides a good summary of the spatial–temporal EEG sensitivity to image structure. The inset map shows the R2 distribution at the R2 maximum peak latency.
We used the time-course of the R2 model fits across age groups to provide an estimate of age-related changes in visual processing. For each subject, we report the electrode at which the model provided the best fit, i.e. where R2 was the largest. The signal at that particular electrode was most sensitive to the structure of the image as described by the design matrix and therefore constitutes the most likely candidate for reflecting the activity of cortical sources sensitive to image information. In general, R2 was largest at posterior electrodes that also exhibited large responses to faces (Rousselet et al., 2008a,b). We also used the envelope R2, the maximum R2 across electrodes computed at each time point, to make sure our analyses did not miss local maxima at electrodes other than the one showing the largest R2.
The EEG regression model contained fewer parameters than the model we used previously (Rousselet et al., 2009). Nevertheless, the maximum amount of explained variance in the Canadian dataset did not differ between the two models.
R2 Distribution Lateralization Index
A lateralization index was computed to estimate the degree of hemispheric lateralization of R2 scalp distribution. First, R2 scalp data normalized in the range [0–1] were interpolated and rendered in a 67 × 67 pixel image using the EEGLAB topoplot function. Second, the intensity of the pixels in the lower left and right quadrants, excluding the midline, were summed separately. Finally, the lateralization index was computed as the ratio (Σleft − Σright)/(Σleft + Σright).
ERP Phase Coherence Thresholds
We determined the first level of phase coherence at which the signal differed significantly from the signal obtained in the noise condition. For each subject, we selected the electrode showing the maximum absolute difference between the 70% phase coherence and the 0% phase coherence conditions. We choose 70% because it was the highest phase coherence in common between the two datasets, and a level at which a face is clearly visible. Then, in the Canadian dataset, we compared the 0% trials (i.e., noise) to the 30, 40, 50, 60, and 70% trials. In the UK dataset, because of the smaller increments, the noise condition was formed by combining the 0, 5, and 10% phase coherence trials to increase sample size – the ERP did not differ and mean response accuracy was at chance in these three conditions. Conditions 20–70% phase coherence, with 10% increments, were created by combining the trials at each noise level with trials at 5% lower and 5% higher noise levels, e.g. 15, 20, and 25% formed the 20% phase coherence condition. Thus, each comparison involved two independent groups, a noise group and a signal group, with no overlap between the two groups. For the Glasgow dataset the signal groups did overlap. However, the assumption of the independent group t-test is only about the independence of the two groups that are actually compared, not about the independence of all possible comparisons. At each electrode and time point, the 20% trimmed mean of the noise condition was compared with every other condition using a Yuen t-test for independent groups (Wilcox, 2005, pp. 56–57, 159–161). We controlled for multiple comparisons by using a percentile-t bootstrap (Wilcox, 2005, pp. 162–165) and a clustering technique inspired by Maris and Oostenveld, (2007). We centered data so that each condition had a 20% trimmed mean of 0, our null hypothesis. By centering the data, we can use the bootstrap to derive an estimate of the sampling distribution of our statistic in a condition in which the null hypothesis (i.e., no difference in means) is true. Then, in each bootstrap loop, first we sampled single-trials with replacement. Second, we performed a t-test on trimmed means. Third, we computed the sum of each cluster of contiguous significant F values (squared t-values). Fourth, we determined, independently at each electrode, the maximum of these cluster sums. Fifth, we saved the maximum of these cluster sums across electrodes. We used this distribution of maximum bootstrapped cluster statistics to determine which original clustered F values were significant.
Variance Analyses
We determined if an age-related difference in ERP phase coherence thresholds could be due to a difference in variance across age groups. For the electrodes used in Section “ERP Phase Coherence Thresholds,” we performed, independently at each time point and noise level, a linear regression between age and the 20% winsorized variance, a robust measure of dispersion that is used to estimate the standard error of the trimmed mean (Wilcox, 2005, pp. 59–63). Even without control for multiple comparisons, we observed no significant age effect at any time point or noise level.
Weighted Age Functions
The Harrell–Davis estimator of a quantile is a robust estimator (Wilcox, 2005, pp. 71–73, 139–141) that is derived from a weighted sum of sorted values (Figure 2A). We applied the weights used in the calculation of the quantiles of the age distribution of our sample to entire behavioral and EEG functions to derive weighted means of these functions. This procedure allowed us to visualize how our dependent measures change as a continuous function of age.
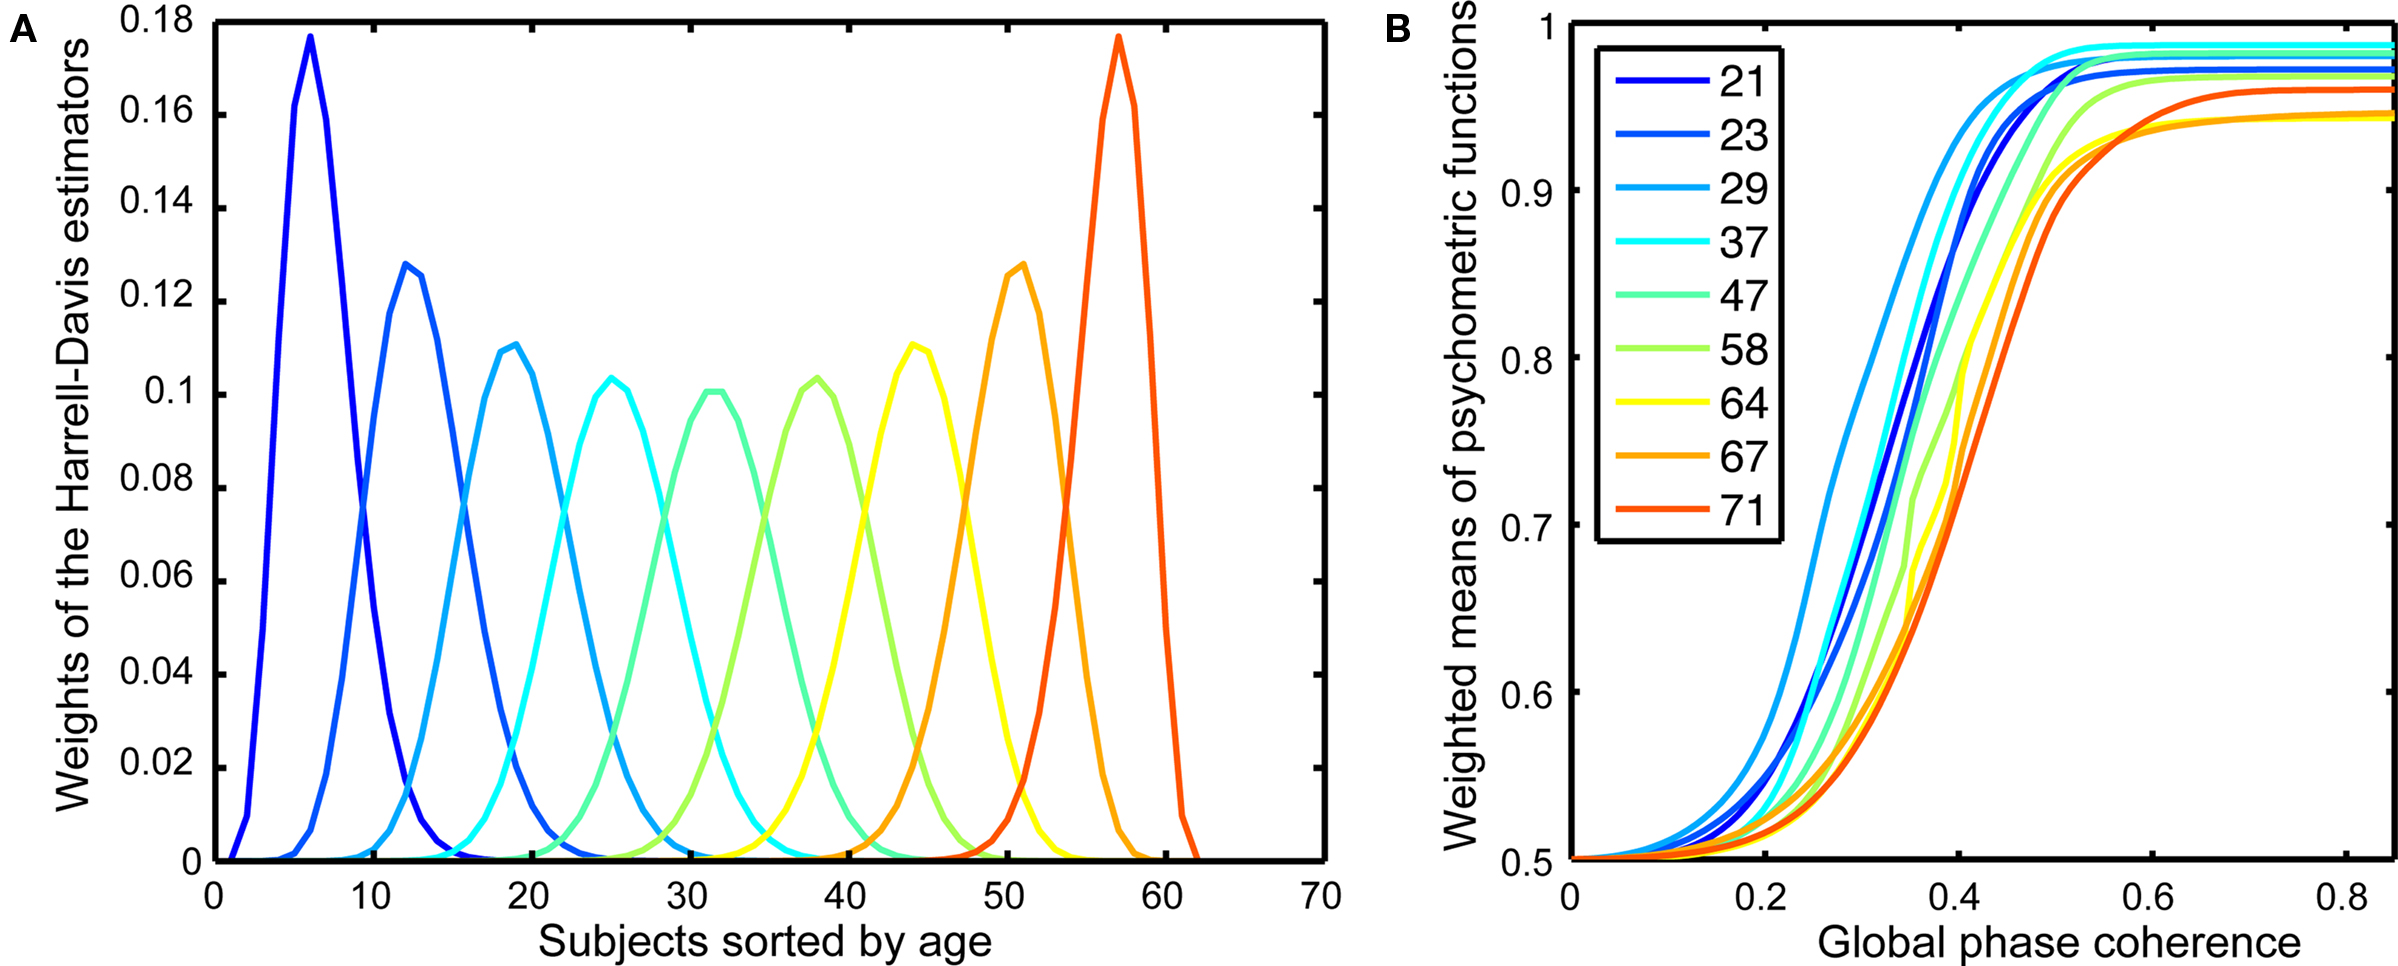
Figure 2. Psychometric functions. (A) Weights of the Harrell–Davis estimator of the deciles of the subjects’ age distribution. These weights were applied to the individual behavioral psychometric functions to create weighted means for different age groups, as shown in (B). The inset shows the colors corresponding to the different age deciles. The age deciles are closer together for subjects under 30 and over 60, reflecting a larger sampling of these age groups.
Results
Main Behavioral Results
Maximum percent correct tended to decrease, and 75% correct thresholds tended to increase, with age (Figures 2 and 3). A regression model of the 75% correct thresholds, including the factors age, visual acuity and sex revealed only a significant contribution of the age factor (model R2 = 0.33, beta coefficients: age = 0.0433, P = 0.0003; acuity = −0.0051, P = 0.65; sex = 0.0076, P = 0.41). Thus, a simple factor like increased blur (decreased visual acuity) is not likely to explain the increased thresholds with age. Also, there was no evidence that the 24 subjects tested in a second EEG session significantly lowered their thresholds, irrespectively of age, suggesting that the age effect was not due to insufficient behavioral training.
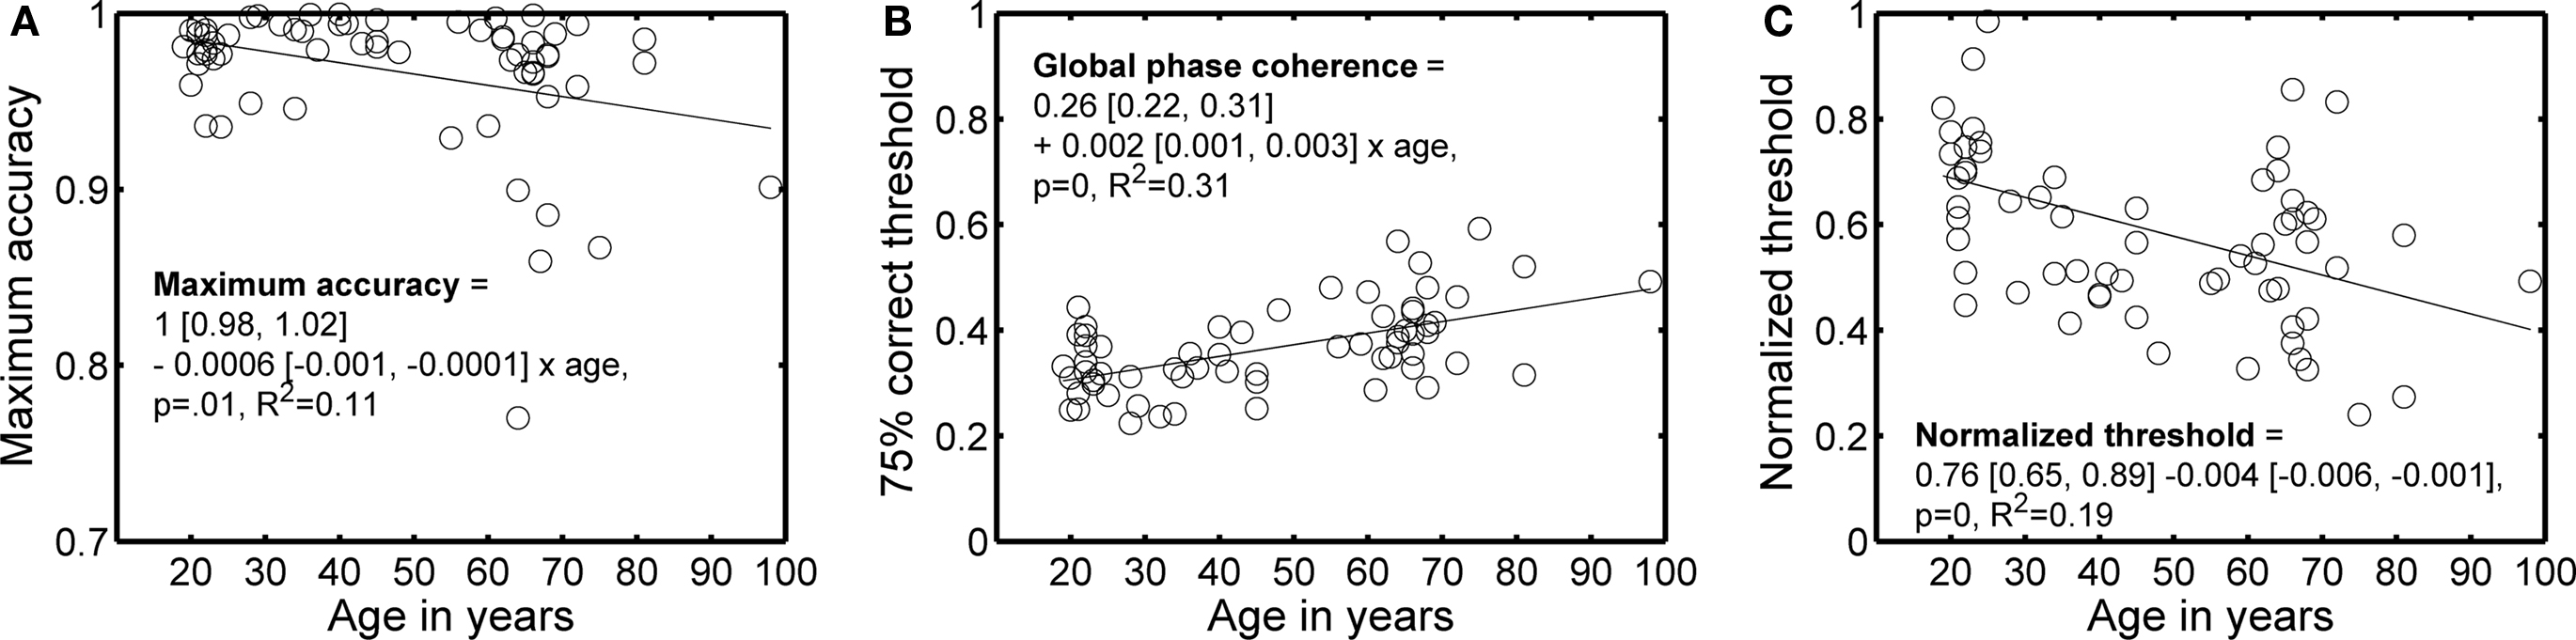
Figure 3. Main behavioral results as a function of age. (A) Maximum accuracy. (B) 75% correct threshold. (C) Normalized threshold. In each panel, the continuous line shows the linear trend described by the equation. In the equations, the first term is the intercept, the second term the slope, and the square brackets contain the 95% confidence intervals for each term.
To ensure that the age effect on behavioral thresholds was not due to a difference in the information available in the pairs of images assigned to different subjects, we used the ratio of the 75% correct threshold for a modeled pixel-matching observer divided by the 75% correct threshold for human observers. This ratio normalizes the behavioral thresholds by the discriminability of the images, as indexed by our template matching model, and decreased significantly with age (Figure 3C). The analysis of normalized thresholds suggests that variation in information availability was not the cause of threshold variation across age. A normalized threshold of 0.5 means that the modeled template matching observer was only twice as good as a human observer. Given that 67% of subjects had a threshold higher than 0.5, our subjects performed on average very well.
ERP Phase Coherence Thresholds
Although the main purpose of increased phase noise was to reduce face identity discrimination, another effect of noise is to reduce face detection. Therefore, the increase in 75% correct threshold with age could be due to a more conservative strategy in older subjects, who may feel uncomfortable responding to noisy stimuli that their visual system can nevertheless detect. Alternatively, the visual system of older subjects may literally need more evidence to detect the presence of a face. We tested this second hypothesis by calculating ERP thresholds, which indicate the phase coherence at which the ERP of each subject started to differ significantly from the ERP to noise. These thresholds tended to increase significantly with age, similarly to the behavioral thresholds (Figures 4A,B). After subtracting the ERP thresholds from the behavioral thresholds, the age-related increase in the phase coherence required to perform the task was no longer significant (Figure 4C), suggesting a decreased capacity to distinguish signal from noise, rather than a change in the capacity to use information.
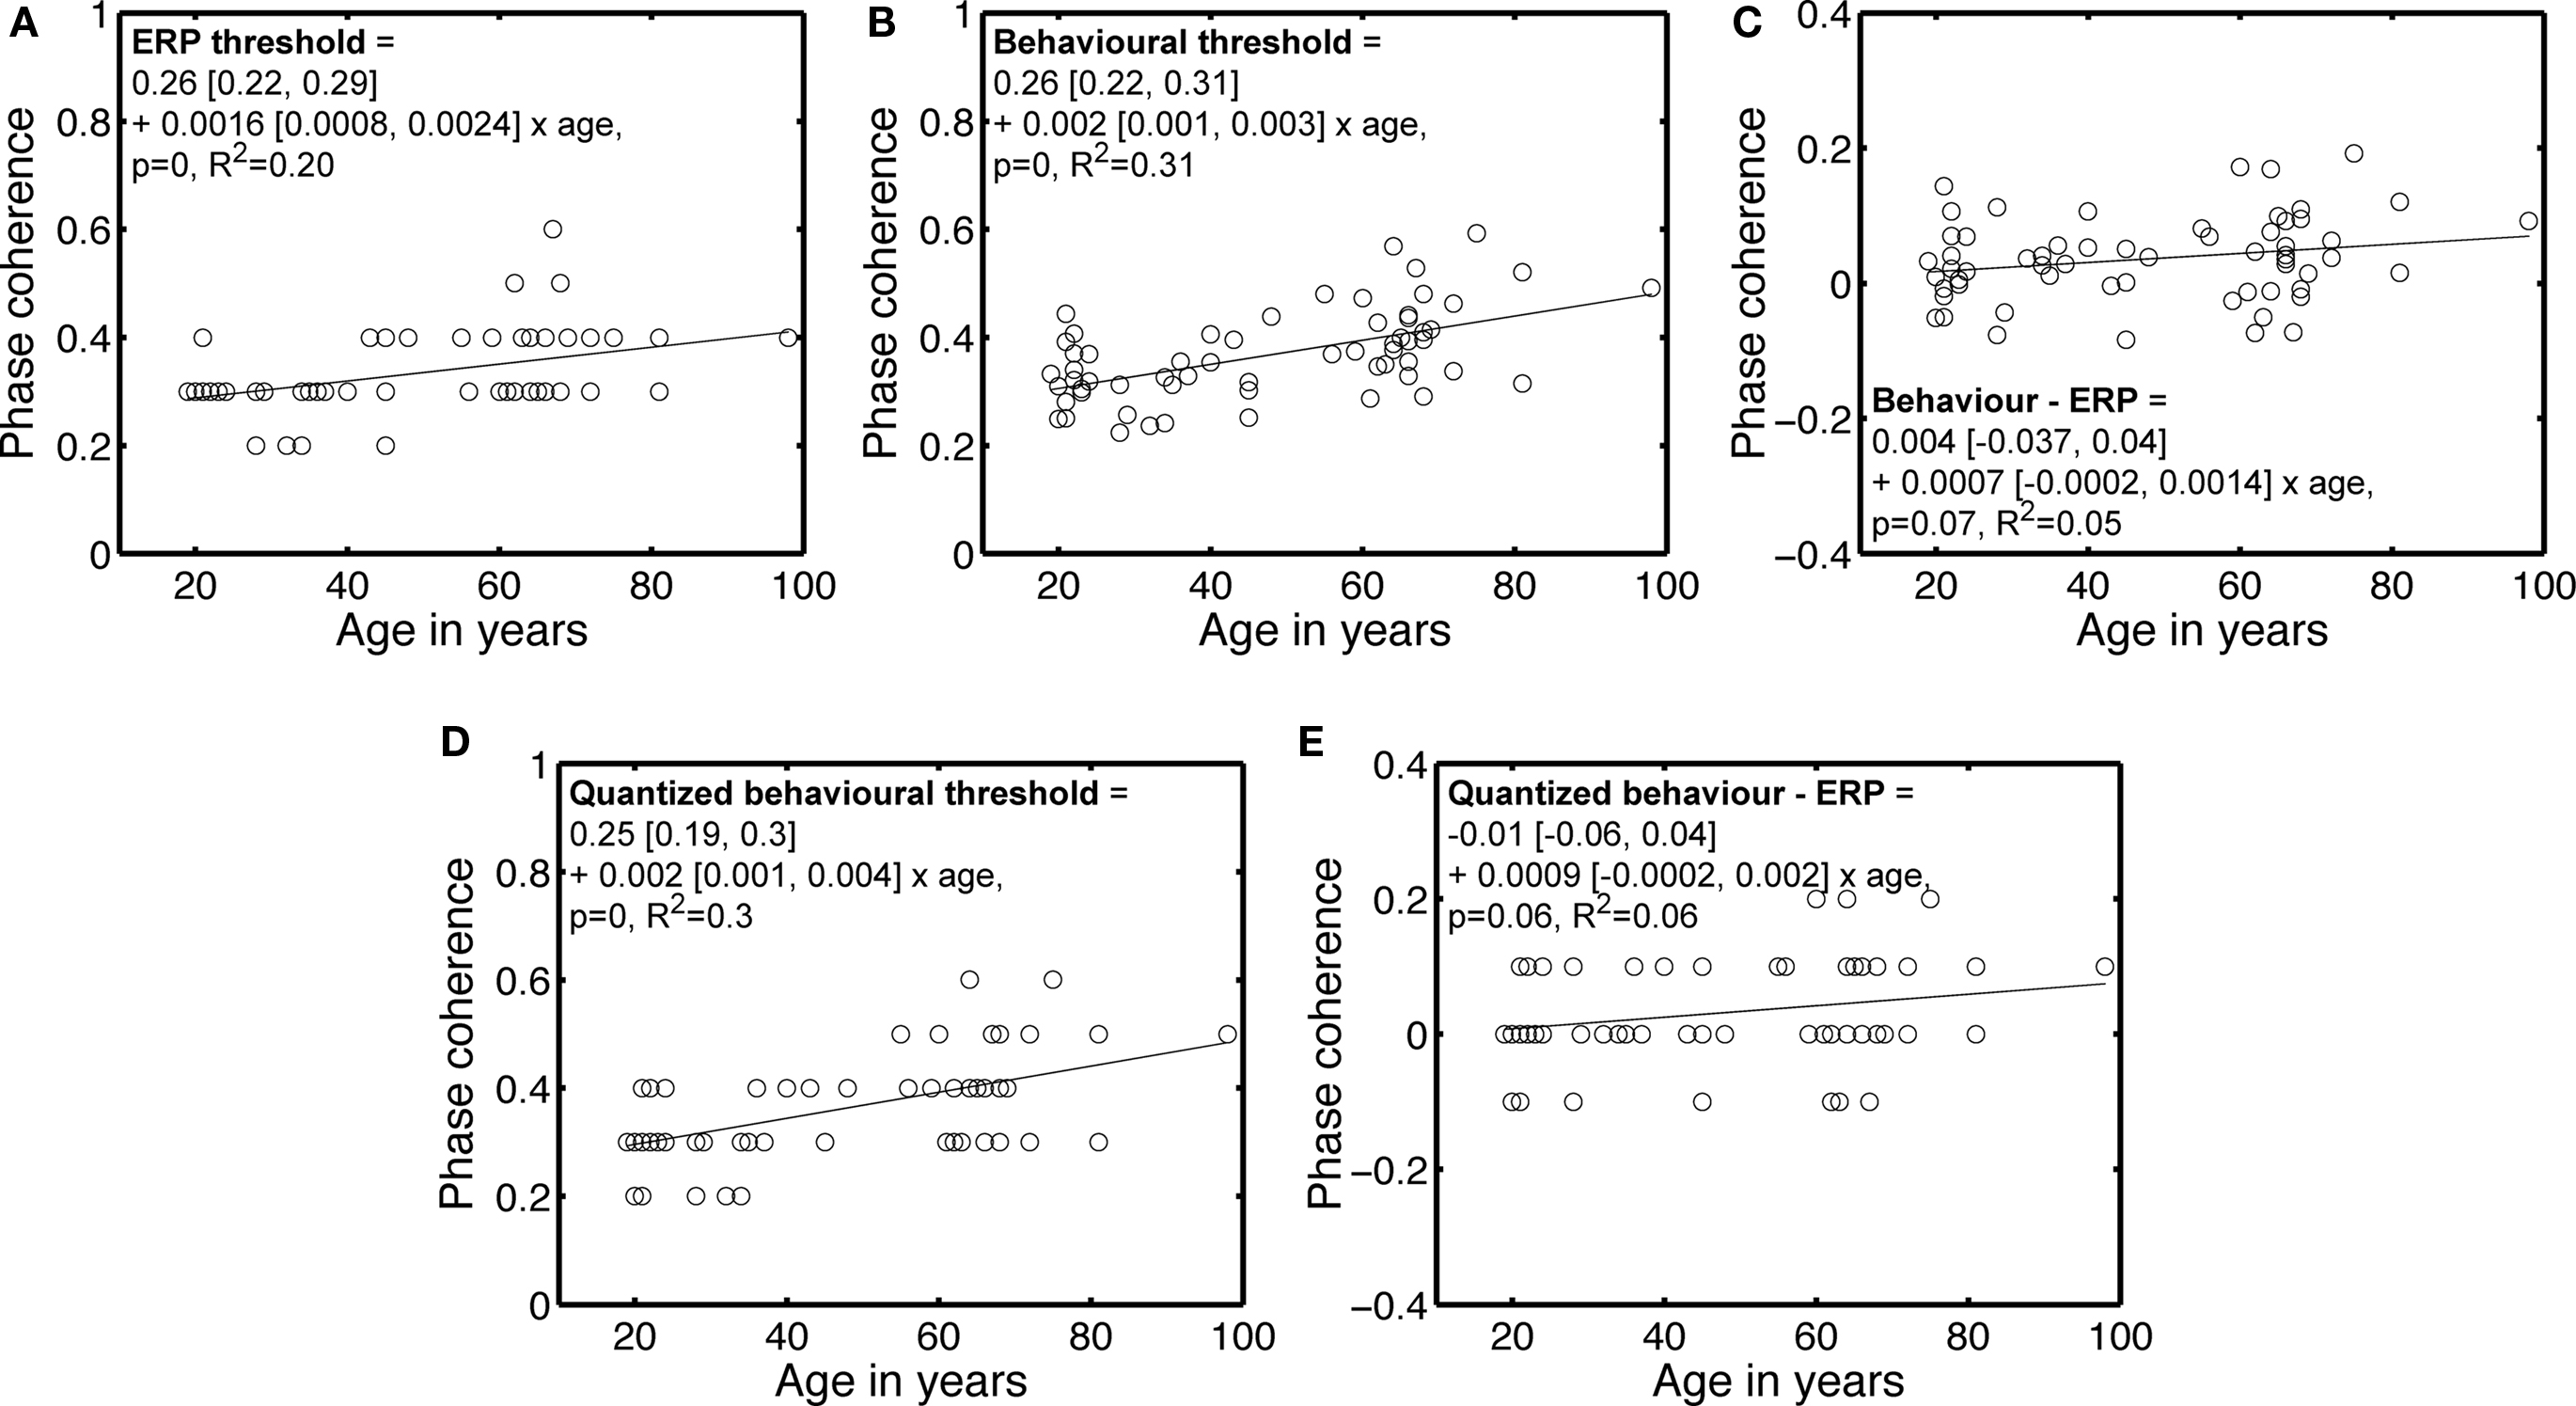
Figure 4. Behavioral and ERP phase coherence thresholds. (A) ERP phase coherence thresholds. Most subjects showed a significant difference at 30% (37) and 40% (16) phase coherence. (B) Behavioral 75% correct thresholds, repeated from Figure 3. (C) Differences between behavioral and ERP thresholds. (D) Quantized version of the behavioral thresholds shown in (B). Quantization was achieved by rounding to the nearest decimal number. (E) Difference between quantized behavioral thresholds and ERP thresholds. In the equations, the first term is the intercept, the second term the slope, and the square brackets contain the 95% confidence intervals for each term.
This result holds true after quantization of the behavioral thresholds, a transformation that makes them more comparable to the ERP thresholds (Figures 4D,E). Also, there was no significant increase in ERP variance with age at any time point or condition, suggesting that the age-related elevation in ERP thresholds was due to lower responses to signal with age, not increased noise.
EEG Regression: Global Fit and Beta Coefficients
The mean across subjects of the EEG maximum R2 was 0.4 [0.36, 0.43], min = 0.07, max = 0.66, median = 0.4, and did not differ significantly across ages. The maximum R2 was significantly larger in the UK group (mean = 0.44) than in the Canadian group (mean = 0.35, difference = −0.09 [−0.14, −0.03], P = 0.006). The better signal quality of the Biosemi system may explain this difference.
Figure 5 shows the time-course of the beta coefficient and the R2 model fit for all 62 subjects at the electrode with maximum R2. With age, R2 tended to start to rise later, and to peak later, with a split between a younger and an older group around the late 40s. These changes in R2 functions are quantified in Sections “Reliability of the R2 functions” and following.
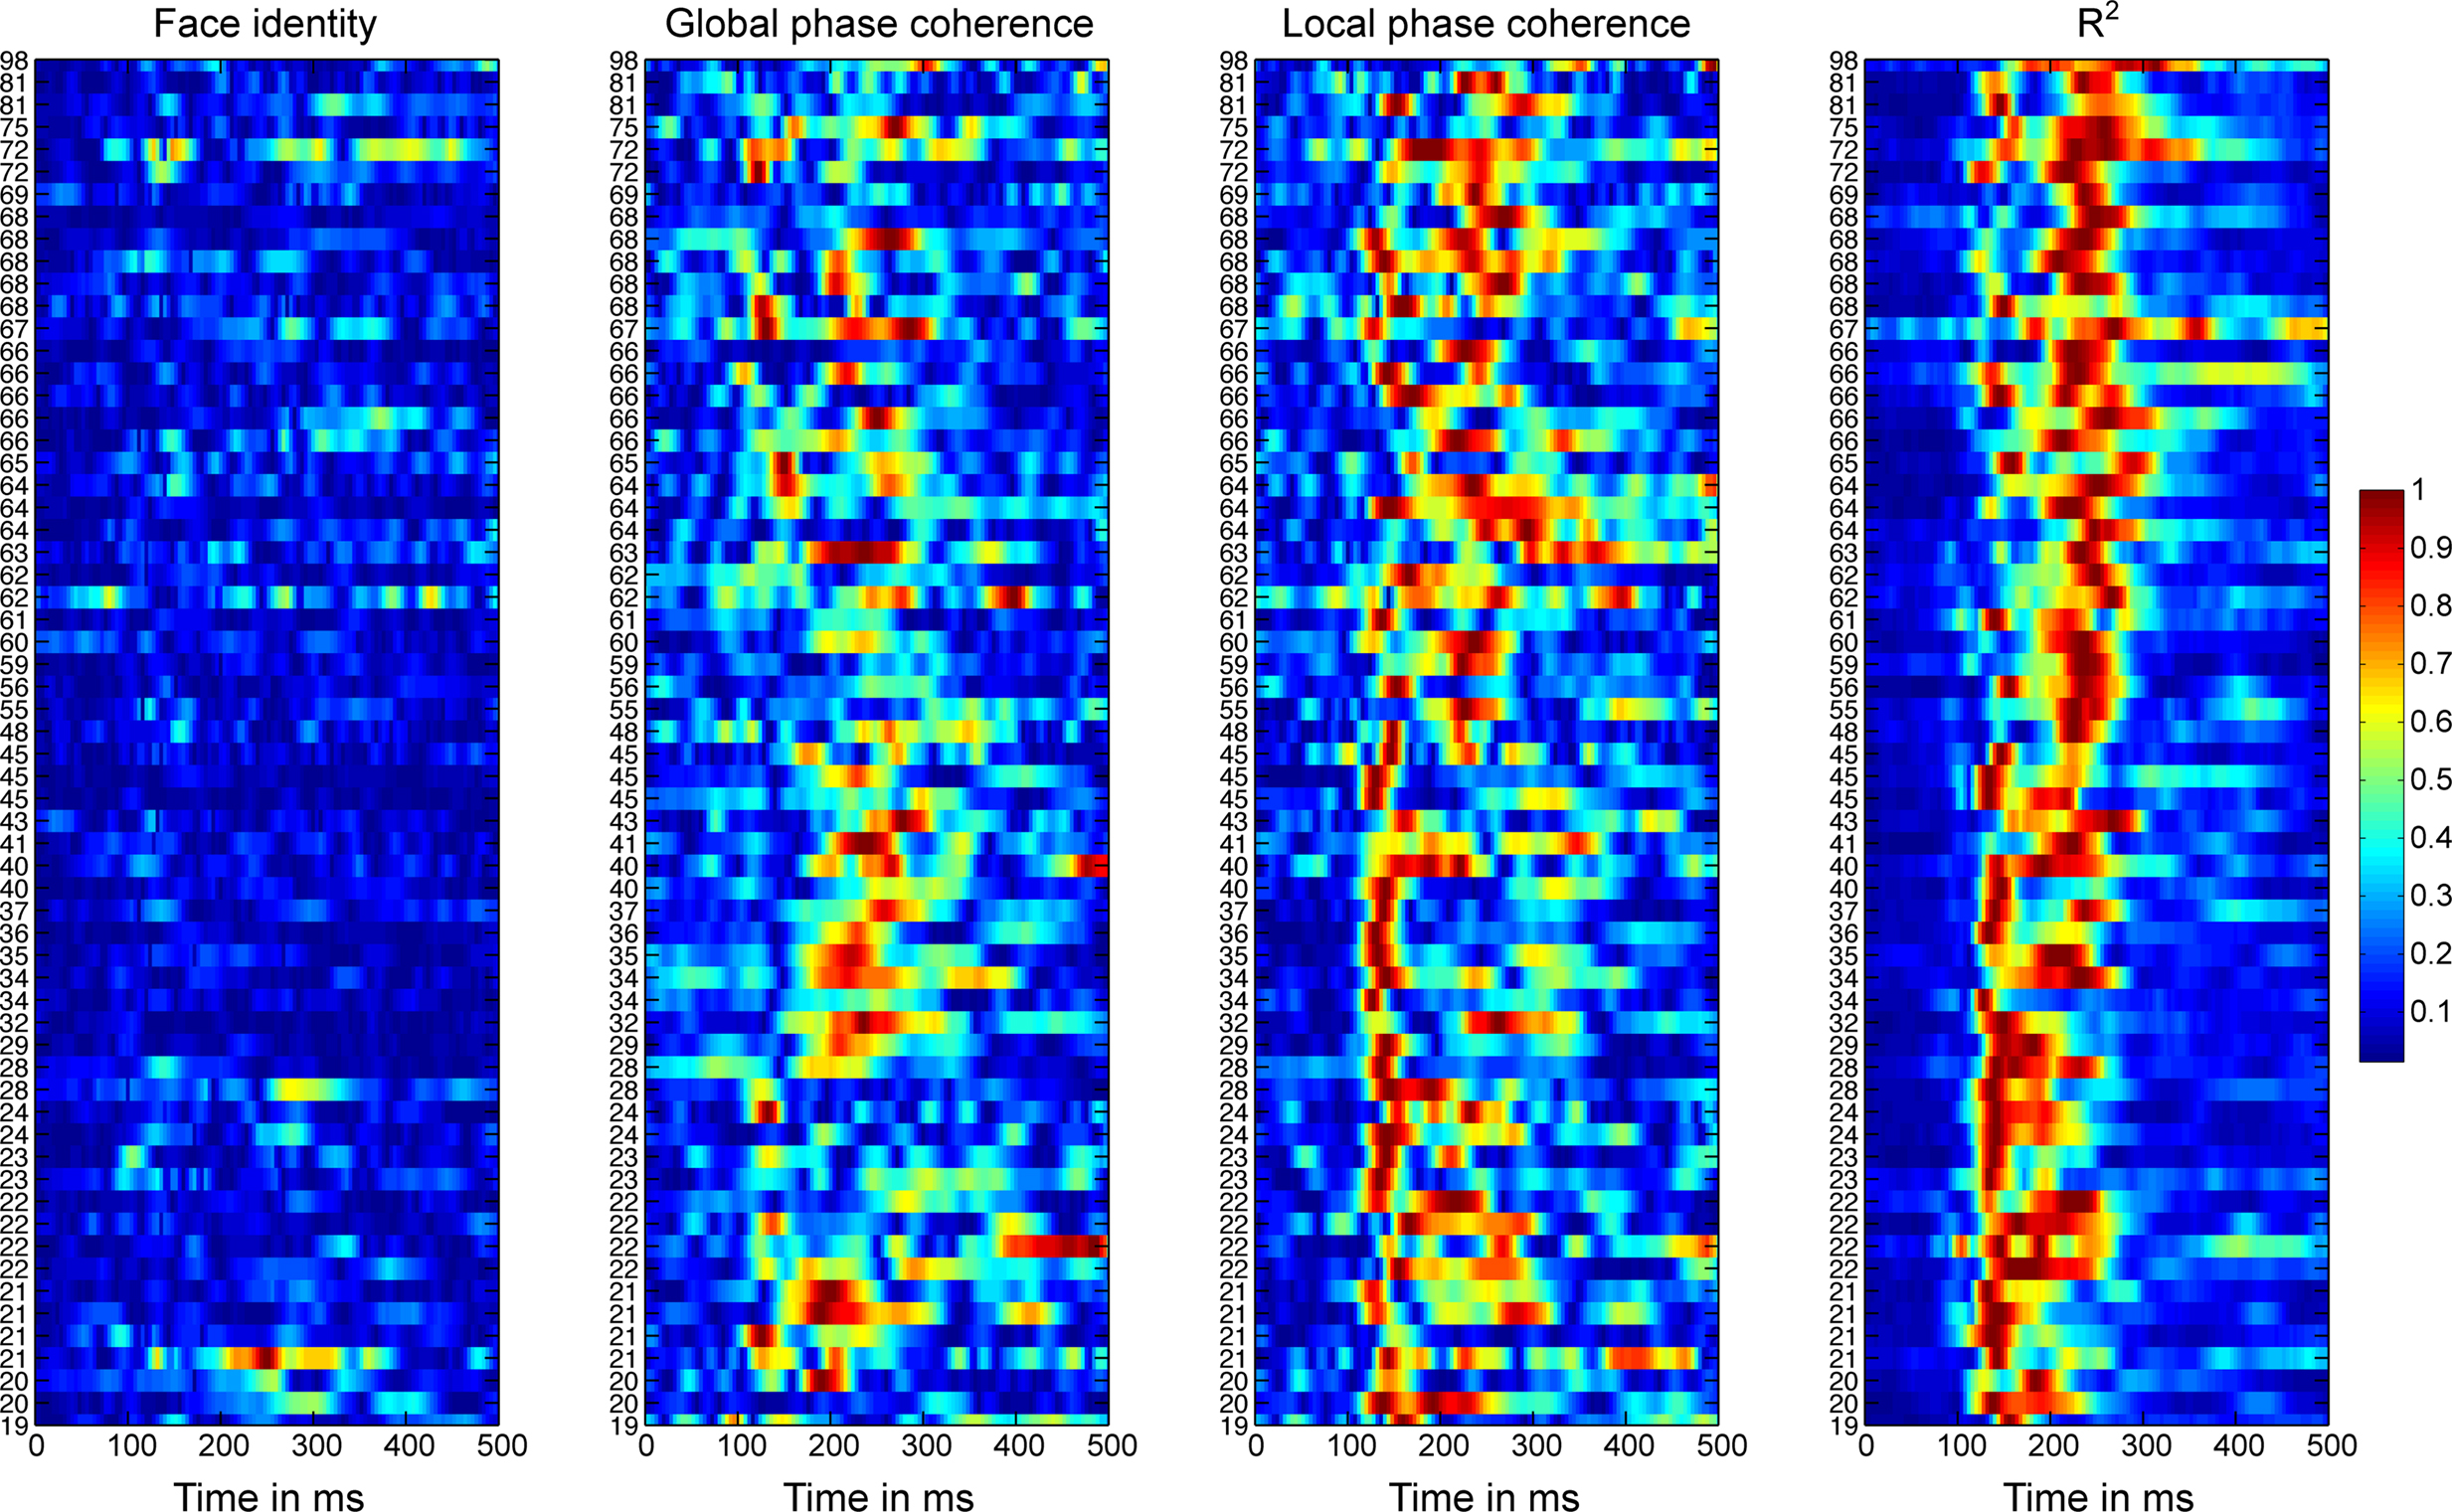
Figure 5. Absolute normalized beta coefficients and R2 of the EEG model for all participants. For each subject, we show the data at the electrode at which the best fit was obtained. Data were sorted by subjects’ age, from the youngest at the bottom, to the oldest at the top. The stimulus difference is the difference between beta face 1 and beta face 2. For each subject, the absolute betas were normalized by dividing by the maximum across betas and time points. The R2 was normalized by dividing by the maximum across time points.
Importantly, the changes in R2 with age were not due to a change in the relative sensitivity to image parameters, but to a delayed sensitivity to the same parameters. Indeed, as suggested by Figure 5, there was a significantly larger contribution of LPC, compared to global phase coherence, which in turn contributed more to the model fit than face identity (all P = 0; Figure 6). This was shown by an analysis of the unique variance (semi-partial regression coefficients) contributed by each factor at the electrode and time point of maximum R2. The contribution of these factors was not affected significantly by aging.
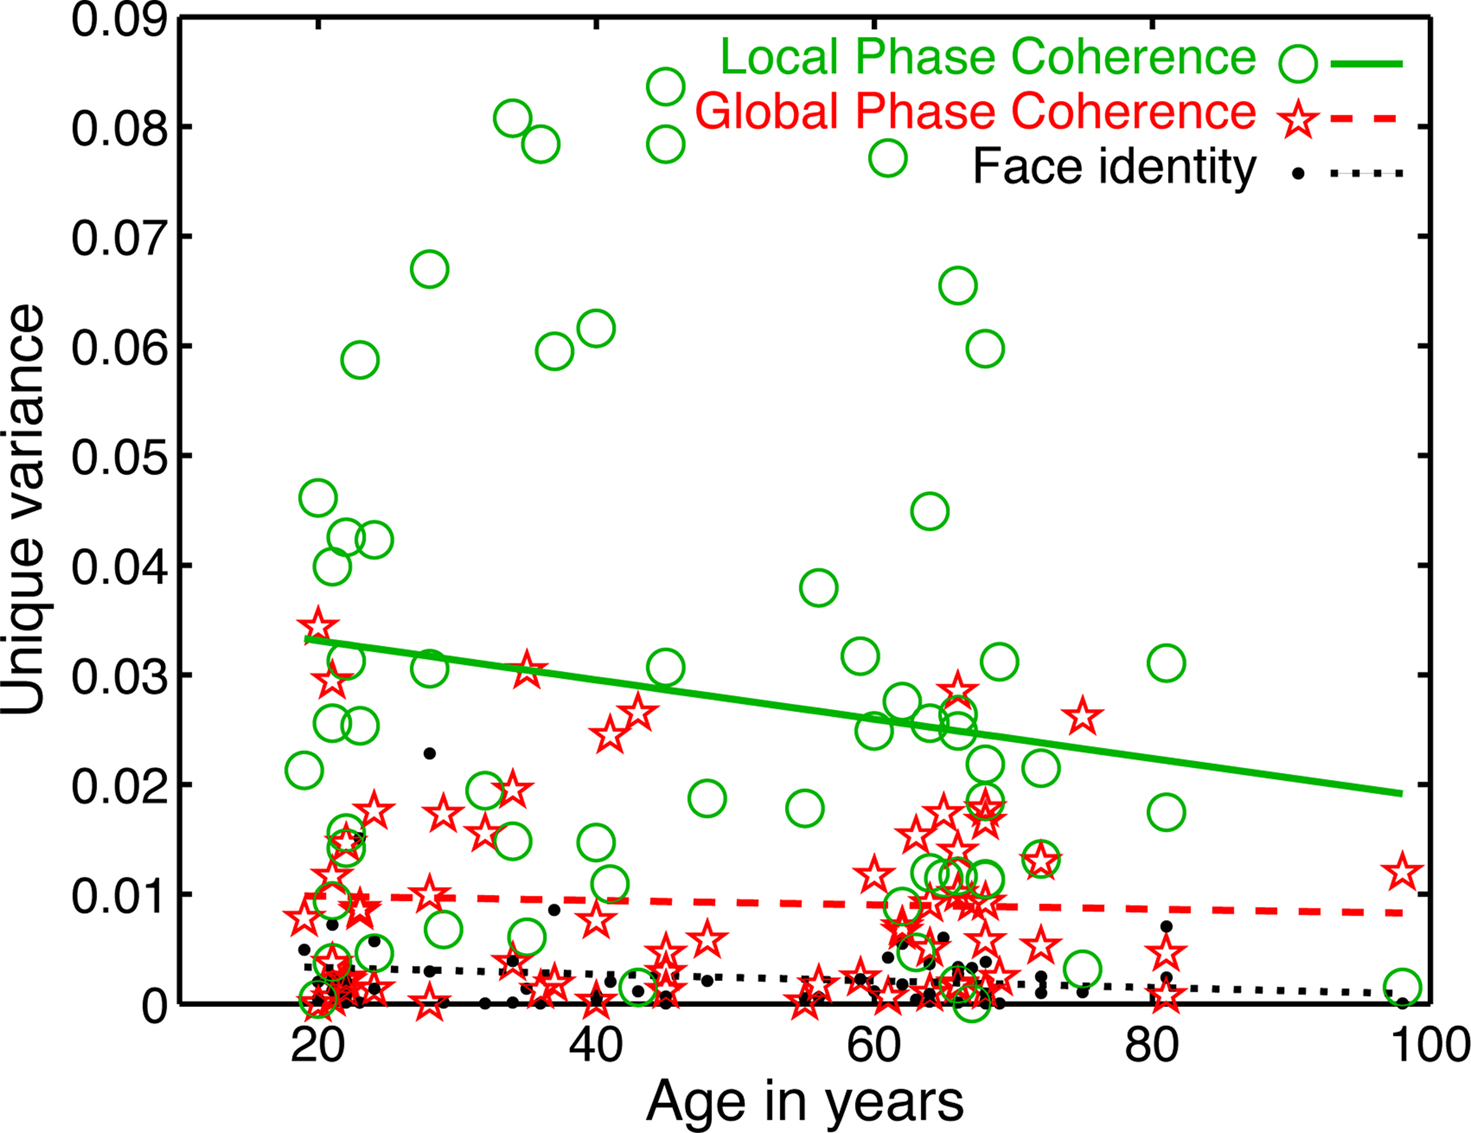
Figure 6. Unique variance explained by the model’s predictors. An analysis of semi-partial correlation revealed the unique contribution of each predictor to the model fit. The mean unique variance, was in ascending order of importance: face identity = 0.003 [0.002, 0.004]; global phase coherence = 0.009 [0.007, 0.011]; local phase congruence = 0.028 [0.022, 0.034]. The slope of the linear fit did not differ significantly from 0 for any predictor, suggesting that the contribution of each predictor was constant across age groups (slopes: face identity = 0 [−0.0001, 0], P = 0.19; global phase coherence = 0 [−0.0002, 0.0001], P = 0.71; local phase coherence = −0.0002 [−0.0004, 0.0001], P = 0.14).
The maximum R2 was located at posterior occipital electrodes in all age groups (Figure 7). The R2 scalp distribution was overall right lateralized (mean lateralization index = −0.13 [−0.18, −0.07], P = 0). As suggested by Figure 7, older subjects tended to be more right lateralized than middle age or younger subjects but this effect was not significant.
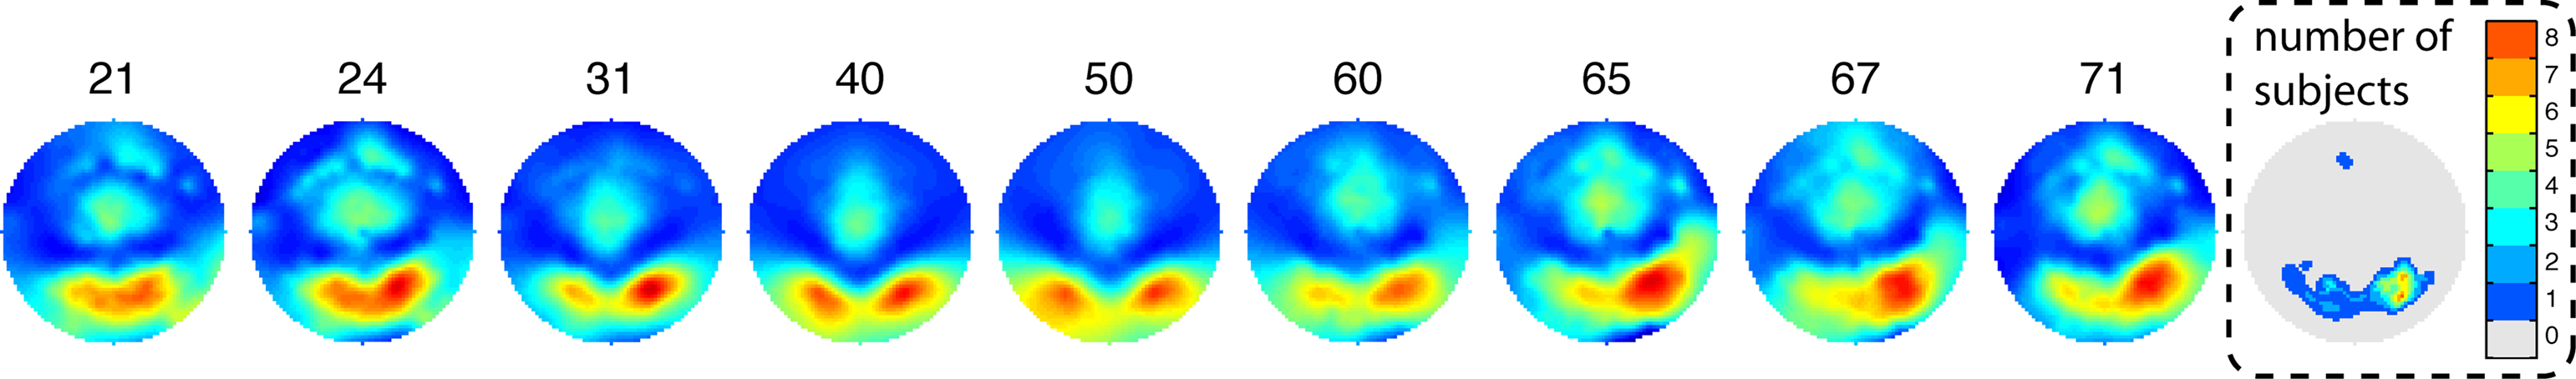
Figure 7. Topographic maps of normalized R2 as a function of age. Weighted averages of the individual topographic maps were obtained by using the weights from the Harrell–Davis estimator of the deciles of the age distribution. The age deciles appear at the top of the maps. The maps are color coded from 0 (dark blue) to 1 (dark red). The right end map shows the interpolated number of subjects with a max R2 at each scalp location. The distribution of max R2 electrodes is occipital–temporal and right lateralized. One subject had a maximum at a frontal electrode. This is not unexpected because most subjects also had sensitivity to noise at frontal electrodes, in keeping with the literature. The subject with a frontal maximum also had noise sensitivity at occipital electrodes.
Age-Related Changes in the Time-Course of Noise Sensitivity
Consistent with our previous findings (Rousselet et al., 2008b, 2009), the R2 functions measured in younger subjects tended to peak in the time-window 100–200 ms, whereas, in sharp contrast, R2 functions for older subjects peaked in a later time window, after 200 ms (Figure 5). We found the same results using an envelope R2 function, which was computed by taking the maximum R2 value across all electrodes independently at each time point (Figures 8 and 9).
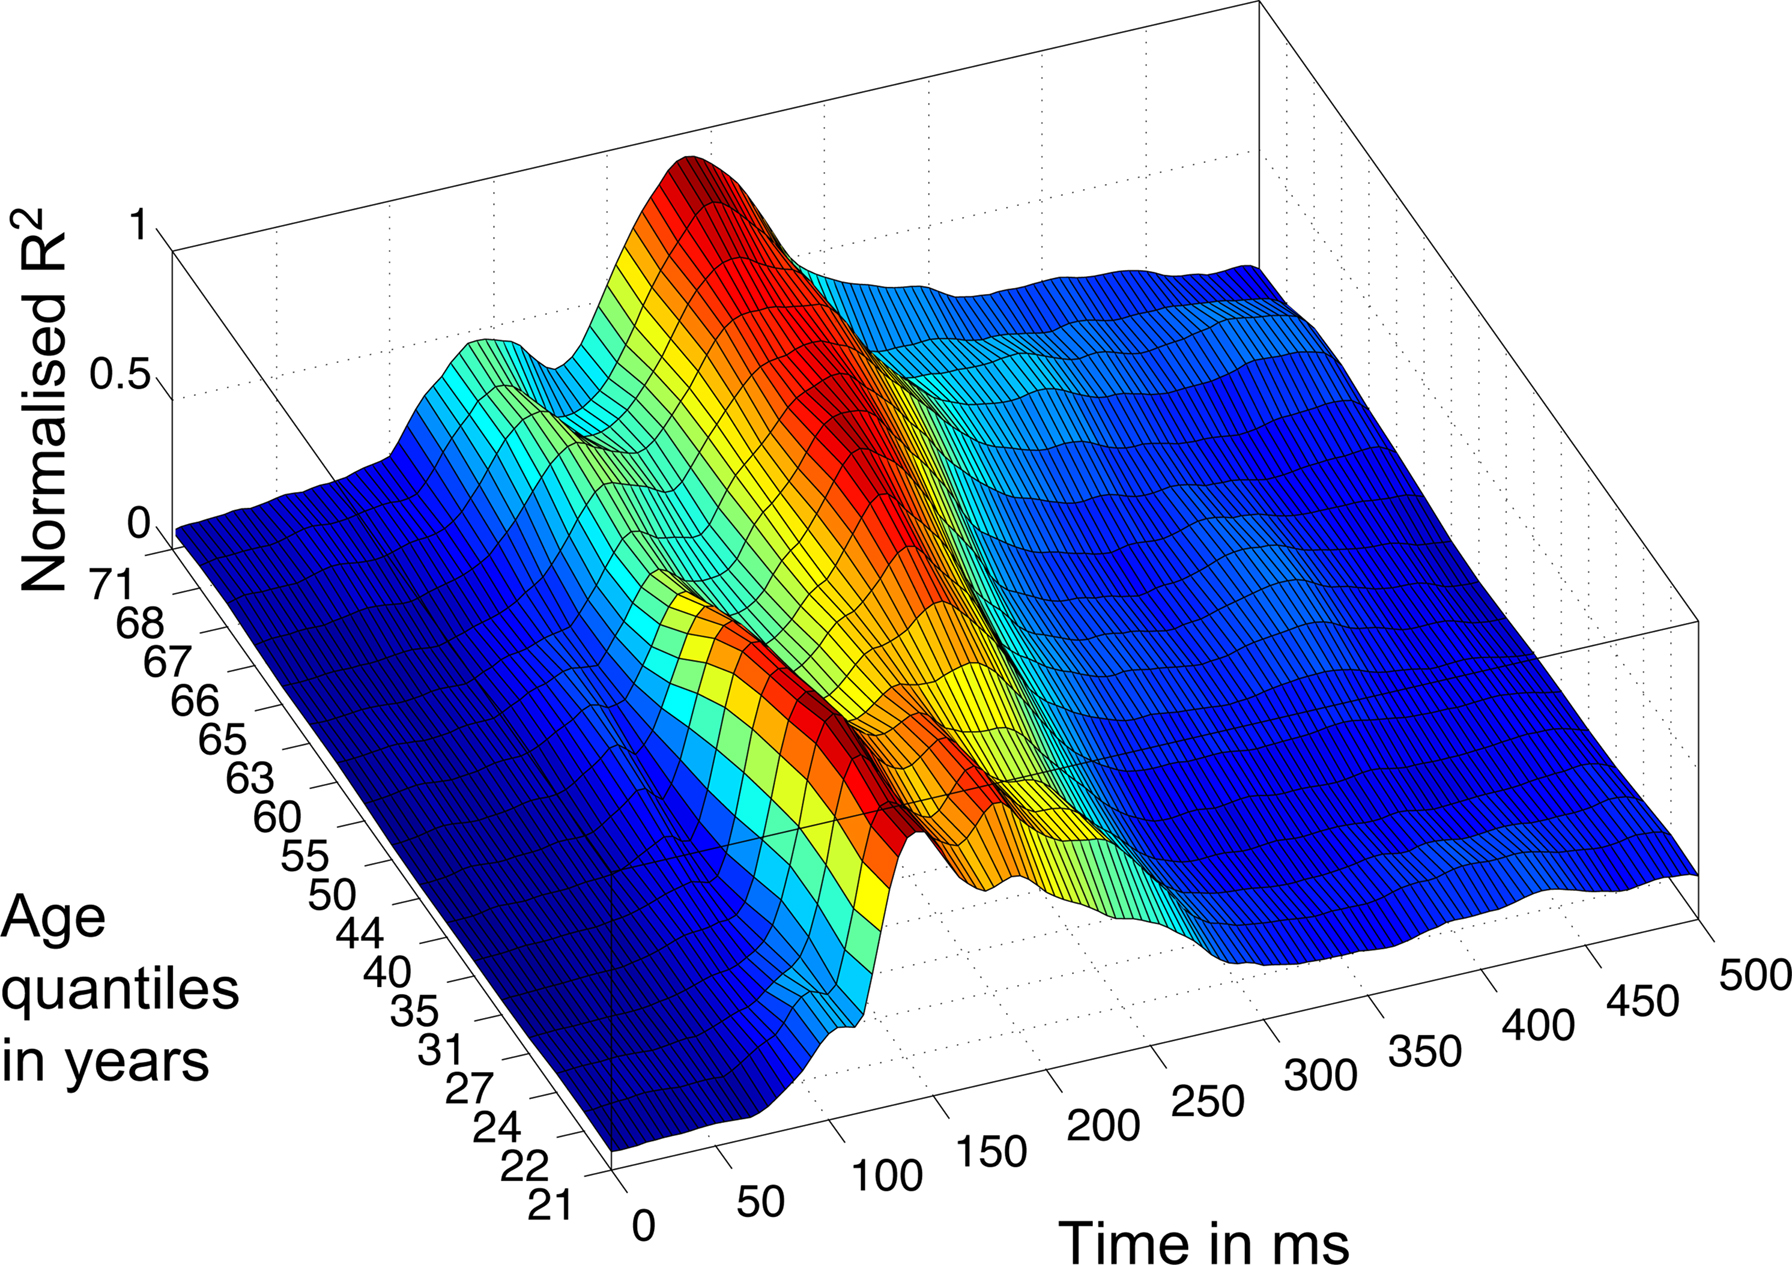
Figure 8. 3D rendering of the R2 quantiles. The Harrell–Davis estimation of the quantiles of the subjects’ age distribution is shown on the y-axis, from quantile 10 to 90%, with 5% increments. The weighted averages of the normalized envelope R2 functions corresponding to the different quantiles are color coded from 0 (dark blue) to 1 (dark red). Data were normalized before averaging.
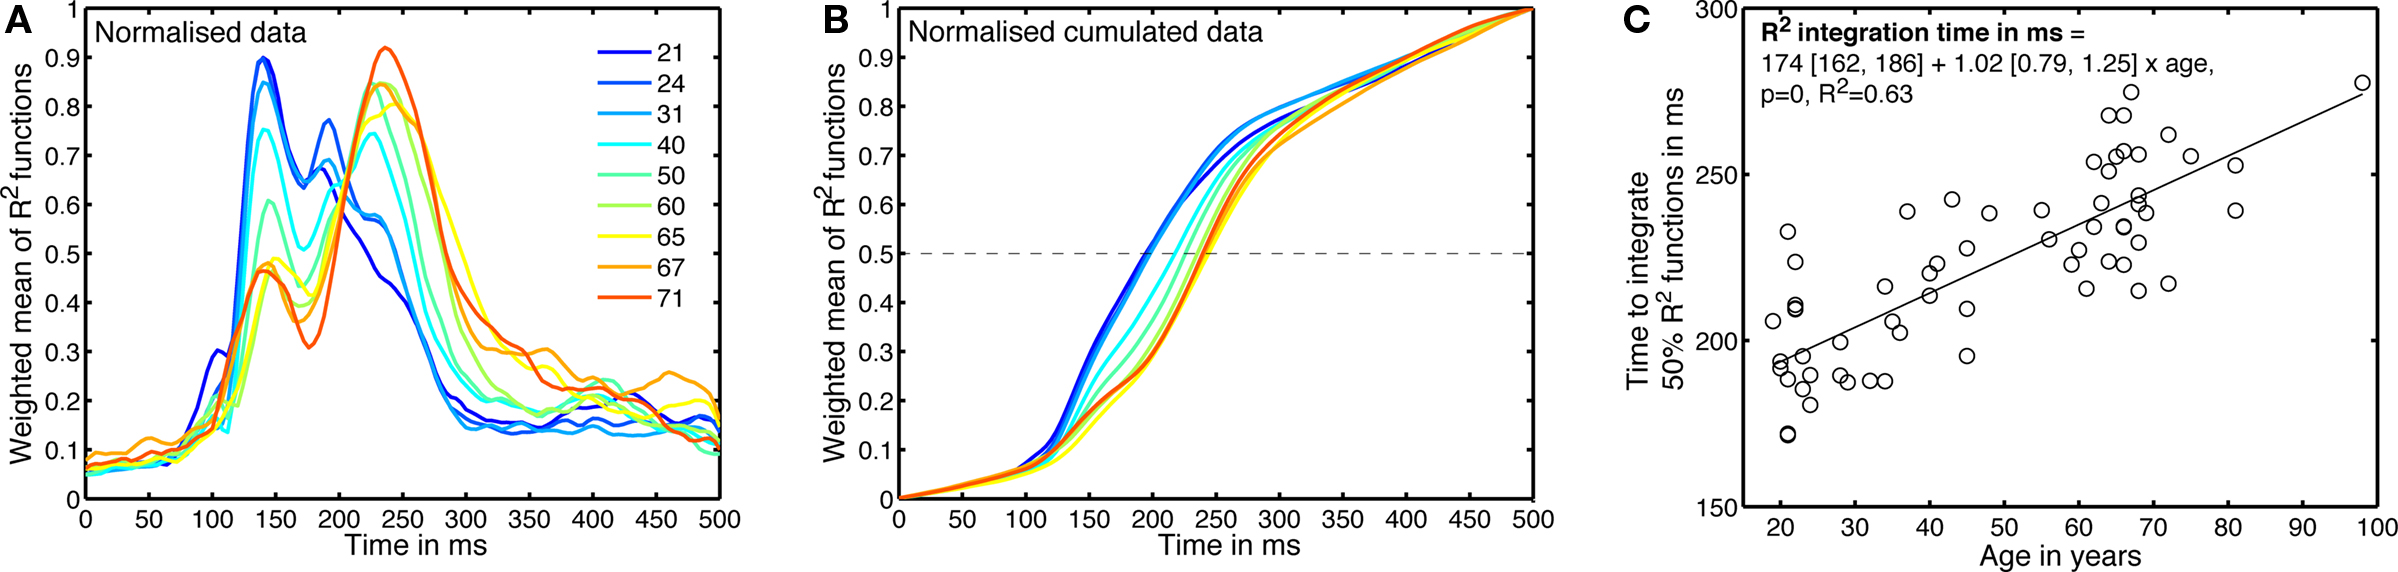
Figure 9. Age-related changes in the time-course of noise sensitivity. (A) Weighted means of normalized envelope R2 functions. This is a 2D version of Figure 8, using less quantiles. The inset shows the deciles of the subject’s age distribution. (B) Normalized cumulated sums of the functions depicted in (A). (C) Time to integrate 50% of the normalized envelope R2 function, for the 62 subjects.
To estimate age-related changes in the time-course of noise sensitivity, we determined how long it took subjects to integrate 50% of their R2 functions. For each subject, we computed the cumulated sum of the envelope R2 in the time window 0–500 ms. That cumulated sum was then normalized between 0 and 1: it had a value of 0 at stimulus onset, and a value of 1 at 500 ms after stimulus onset (Figure 9B). Finally, we computed the time necessary to reach 50% of that function using a cubic spline interpolation. The results across subjects are shown in Figure 9C.
A regression model of the 50% EEG R2 integration times, including the factors age, visual acuity and sex revealed a significant contribution of only the age factor (model: R2 = 0.64, beta coefficients: age = 23, P = 0; acuity = 3.3, P = 0.2; sex = 0.8, P = 0.7). We also found a significant relationship between the 50% EEG R2 integration times and the 75% correct behavioral thresholds (linear regression: R2 = 0.4, slope = 0.0020 [0.0013, 0.0027], P = 0), but we need to be cautious because 75% correct behavioral thresholds are also well explained by age and therefore the relationship between 50% EEG R2 integration times and 75% correct behavioral thresholds could be related to this common factor and thus spurious (Hofer and Sliwinski, 2001).
Finally, we determined the time-course of the age effect by looking at the data from a different perspective (Figure 10). Instead of determining how long it took subjects to integrate 50% of their R2 functions, we determined the percentage that had been integrated at each time point after stimulus onset – this is equivalent to cutting vertical slices through Figure 9B. Then, for each time point, we expressed the percentage integrated as a function of age. The slopes of the linear regressions between these two variables are shown in Figure 10. The age effect, although weak, started to be statistically significant at 120 ms after stimulus onset; it was maximal at 208 ms post-stimulus.
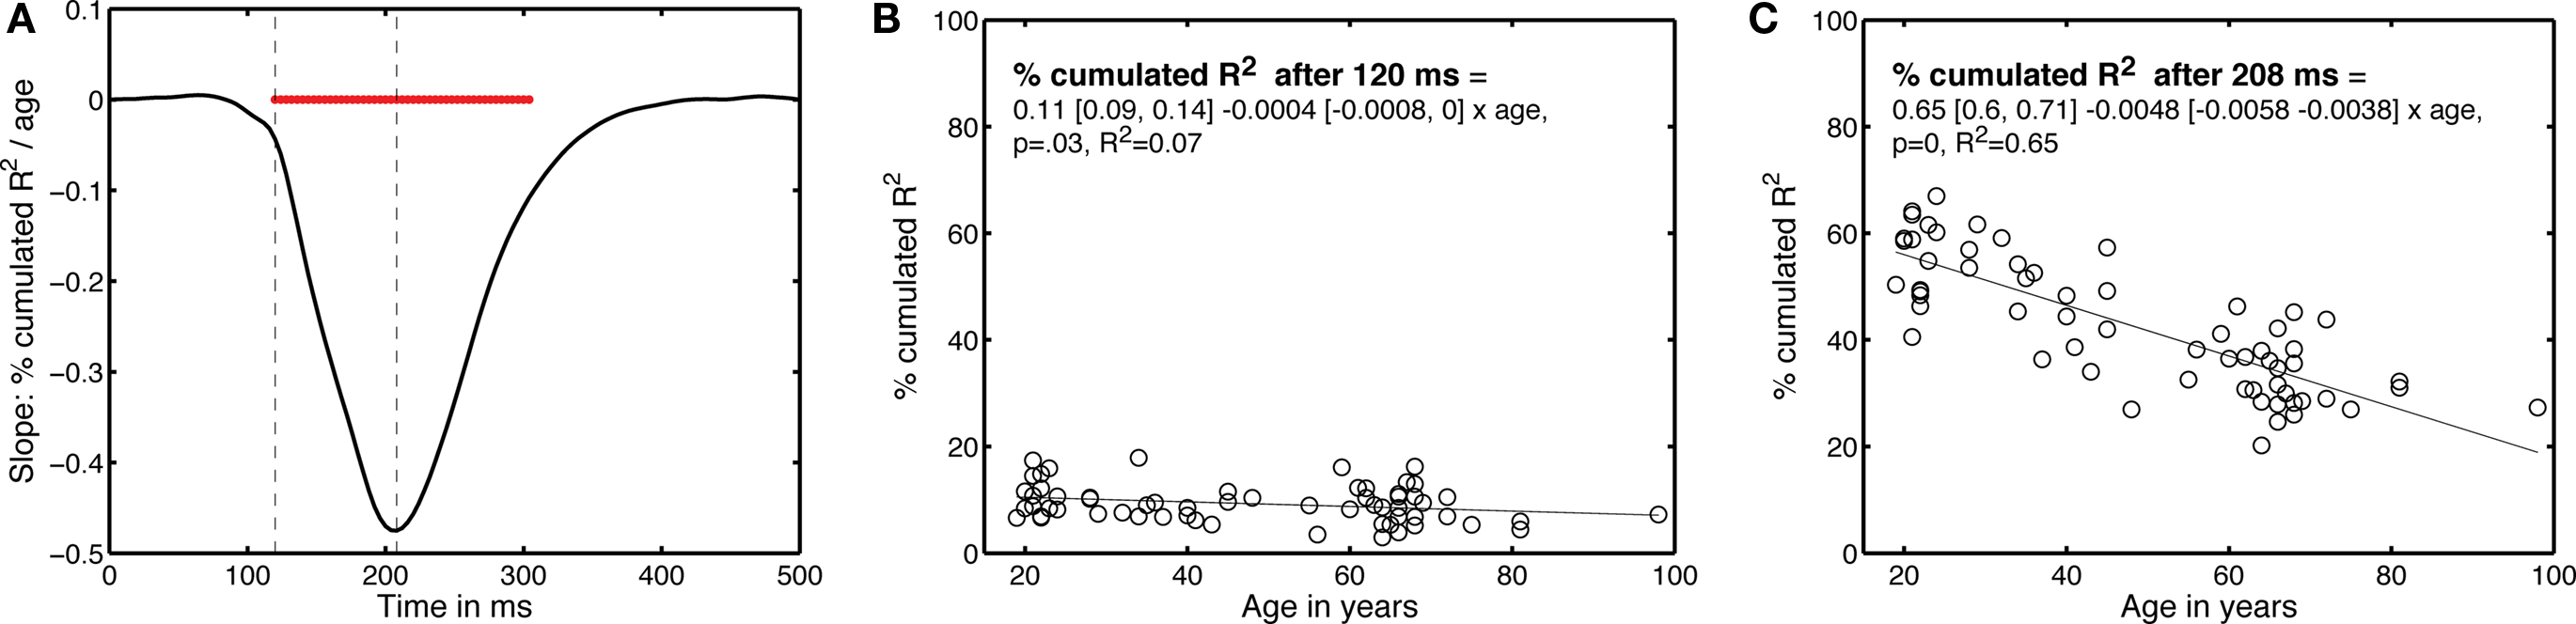
Figure 10. Time-course of the EEG age effect. (A) Slope of the percentage of integrated R2 function as a function of age, plotted over time. The horizontal red bar indicates time points at which the slope was significantly different from 0. The vertical dashed lines mark the time points that are described in (B,C).
Reliability of the R2 Functions
Our test–retest analyses suggest that the envelope R2 functions are both different among subjects and reliable within subjects (Figure 11). The mean Pearson’s correlation between sessions was 95.6% [94.4, 96.7], min = 88.6, max = 99.4. All the correlations between session 1 and session 2 of one subject were significantly larger than the correlations between session 1 of that subject and session 2 from all other subjects (p < 0.05).
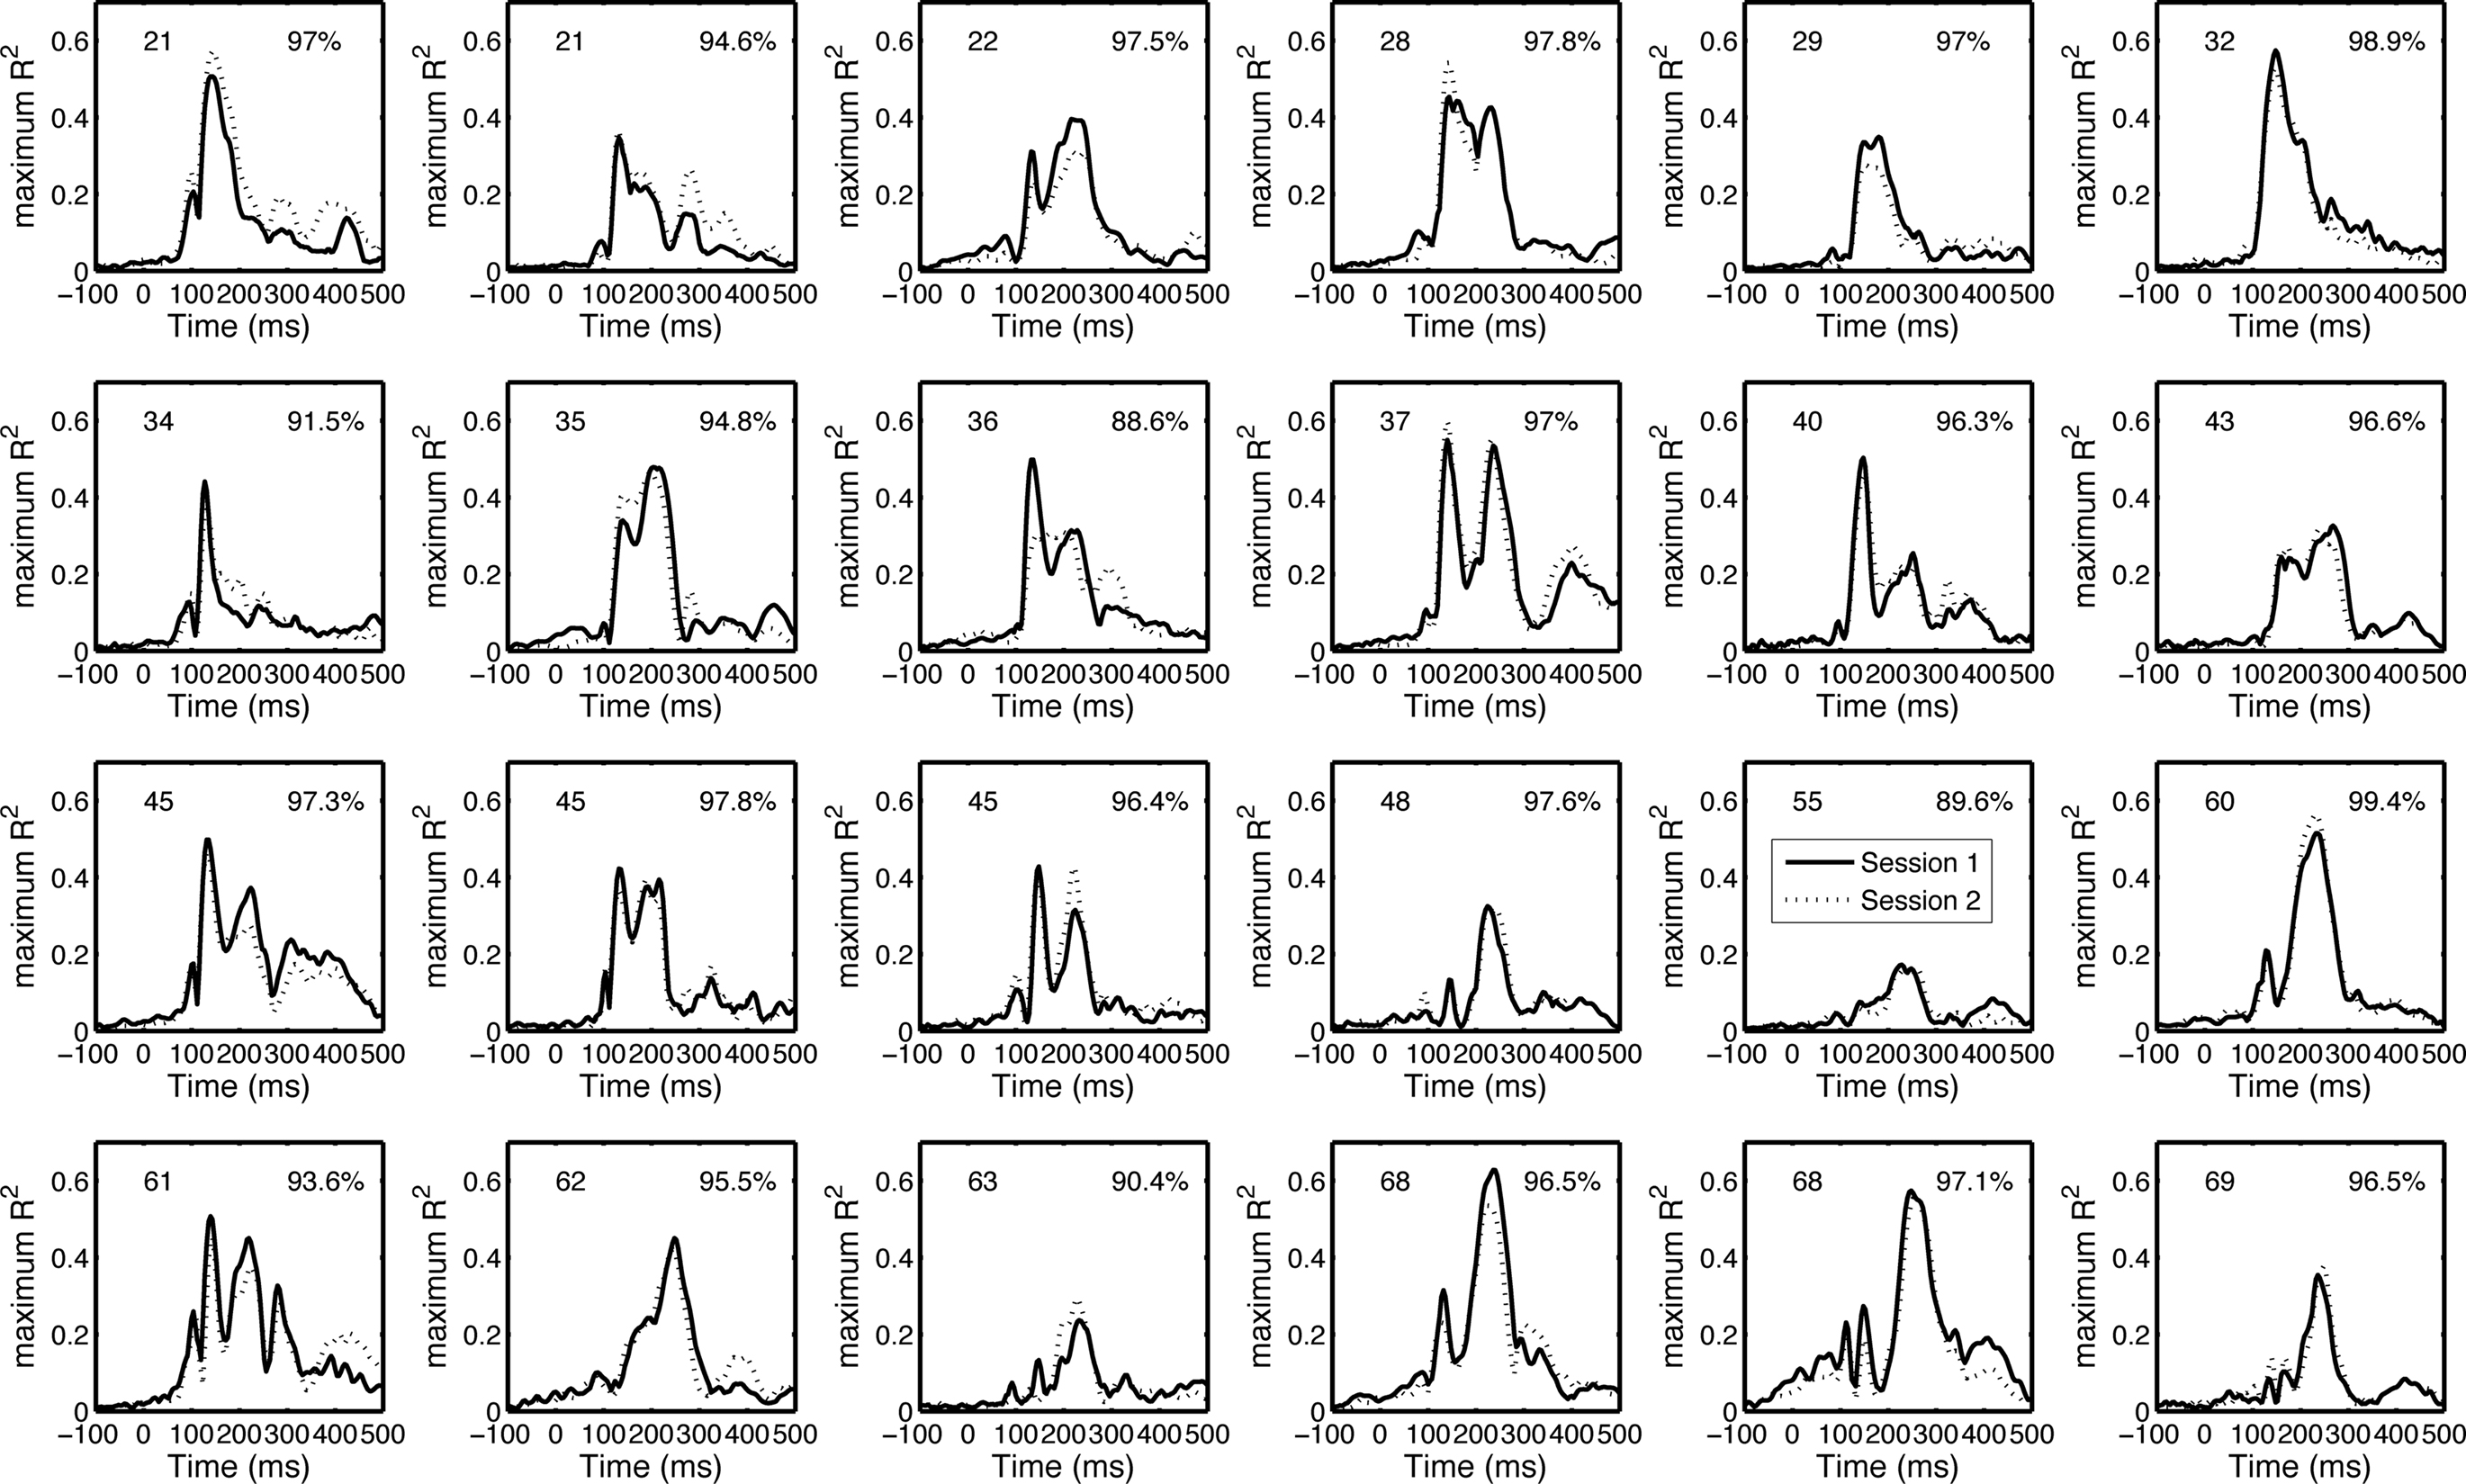
Figure 11. Test–retest of the envelope R2 functions. The envelope R2 functions (maximum across electrodes) from the 24 subjects from which we recorded EEG twice are sorted by subjects’ age from top to bottom. Subjects’ age is indicated in the upper left corner of each cell. Pearson’s correlation R is indicated in the upper right corner of each cell.
Across sessions, there was also a good correlation between the 50% EEG R2 integration times (Figure 12). These correlations were not significantly modulated by age. The estimates of the age-related increase in 50% EEG R2 integration time were similar in the two sessions, and fell within the confidence intervals of the original fit using all 62 subjects.
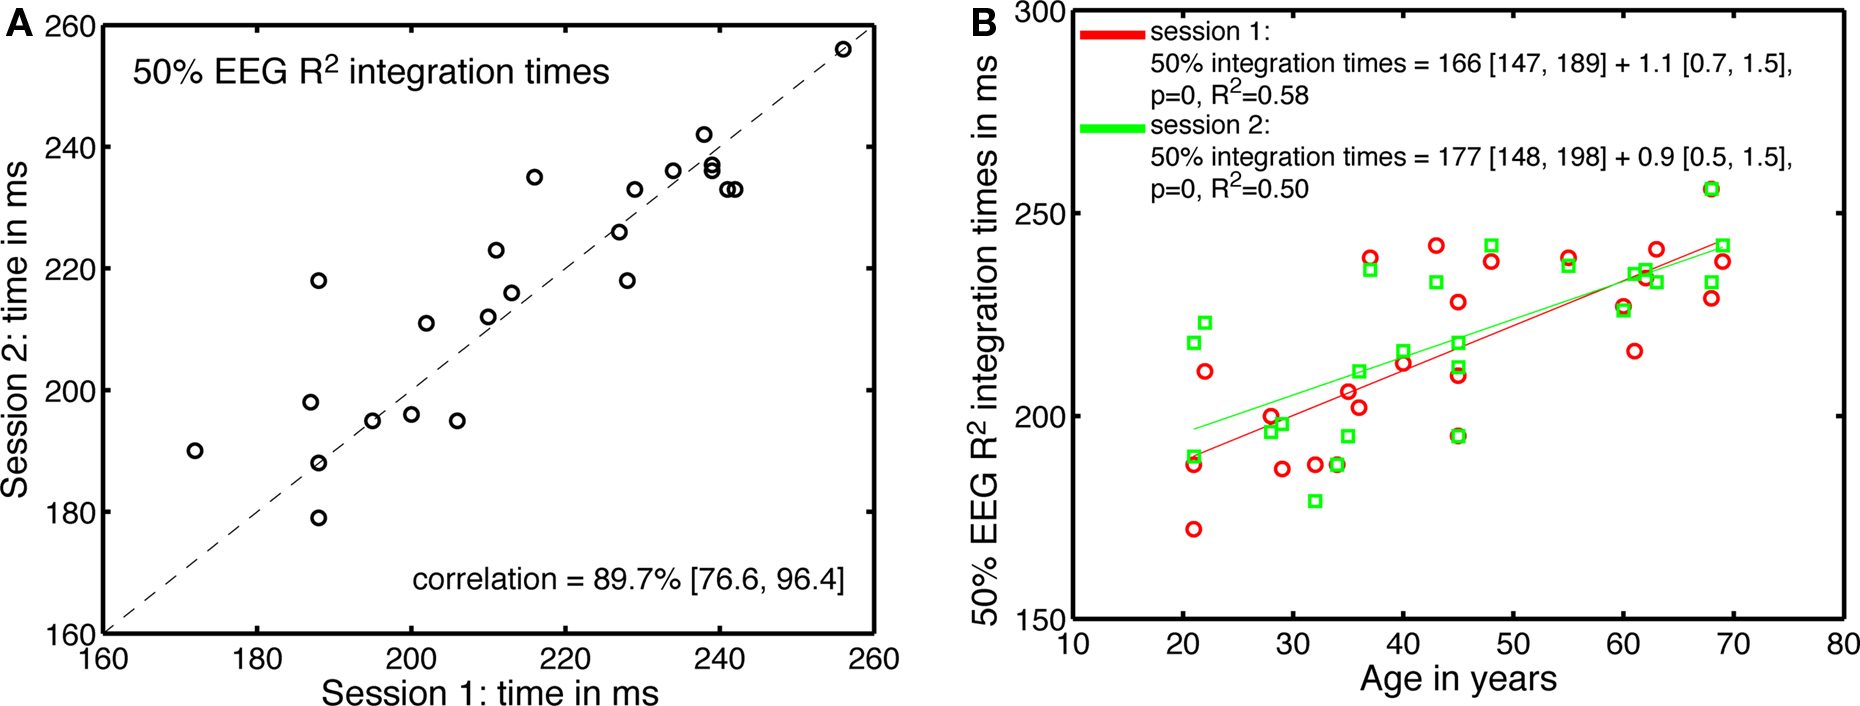
Figure 12. Test–retest of the processing time effects. (A) Correlation between 50% EEG R2 integration times in the two sessions. (B) 50% EEG R2 integration times, in the two sessions, as a function of age.
Age-Related Qualitative Changes in R2 Functions
Earlier, we observed a strong similarity in R2 functions within two clusters of subjects, one younger, one older, and strong dissimilarity between them (Figures 5 and 8). In a last analysis, we used cross-correlation to provide an objective measure of this observation. We quantified age-related changes in brain activity by measuring the shift needed in the R2 function of one subject to maximize its overall similarity with the R2 functions of other subjects. The analysis of the cross-correlation lags for maximum correlation confirmed the existence of two groups of subjects, one younger, one older (Figure 13). A regression analysis between age and the 20% trimmed mean of the cross-correlation lags showed a significant slope, with a switch from a younger to an older R2 function occurring around 47 years old.
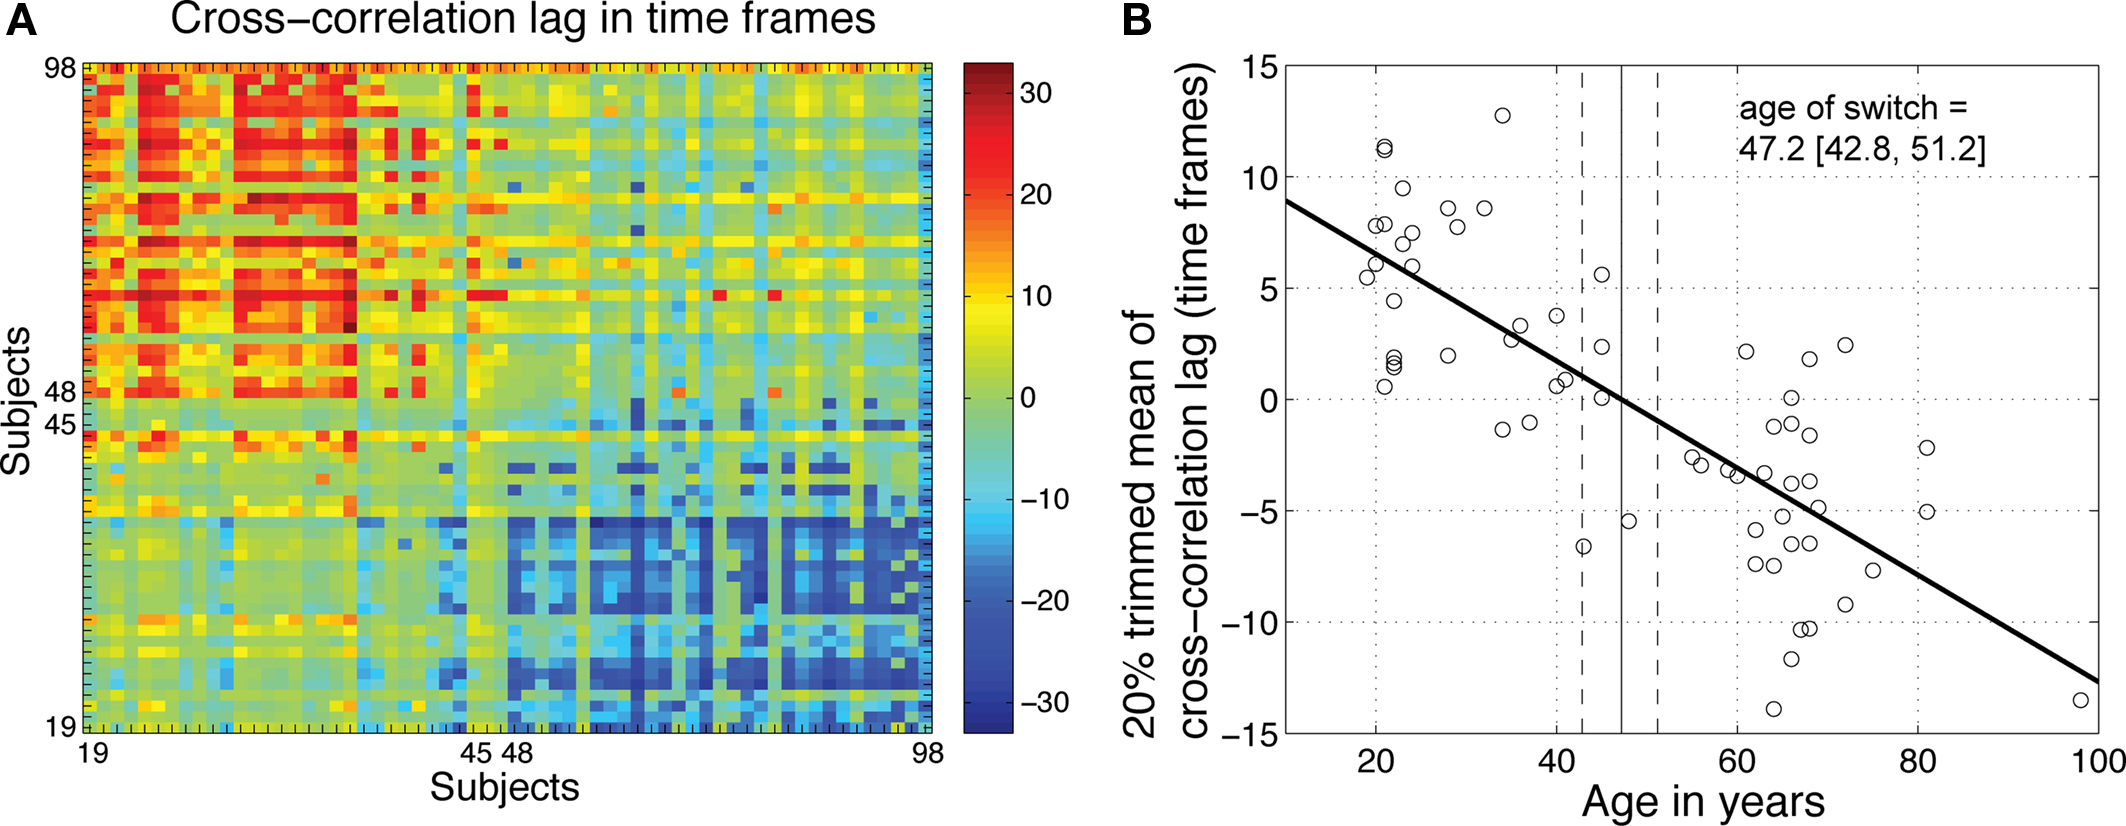
Figure 13. Age-related qualitative changes in R2 functions. (A) For each subject on the x-axis, the y-axis indicates the cross-correlation lag for maximum correlation between that subject and all the other subjects. The R2 functions from younger subjects did not need to be shifted much to maximize their overall similarity. However, their functions needed to be shifted to the right (positive shift, in red) to maximize the similarity with older functions. The reverse was true for older subjects. (B) For each subject, the 20% trimmed mean of the cross-correlation lags provides an indication of its overall similarity to other subjects. Younger subjects tended on average to have a positive lag, whereas older subjects tended to have a negative lag. There was a significant relationship between mean lags and age (R2 = 0.61, P = 0). The age at which a lag of 0 was observed provided an estimate of the age of a qualitative switch in brain activity.
Discussion
We quantified age-related changes in the time-course of scalp EEG noise sensitivity in 62 subjects (age range 19 – 98 years old) performing a simple face discrimination task. Older subjects needed more stimulus information (i.e., stimuli with a lower noise level) to achieve the same level of performance as younger subjects, a result that might be explained by lower signal sensitivity in older brains. The maximum performance decreased with age but this effect was due to a few older subjects and, overall, subjects performed very well in the task (0.97 [0.96, 0.98]). The EEG results show that aging delays noise sensitivity. This effect started 120 ms after stimulus onset and seemed to be independent of visual acuity, suggesting that increased blur does not explain the effect (Sokol and Moskowitz, 1981). Age-related changes in the time-course of the sensitivity to image structure could be due to a number of factors (Rousselet et al., 2009), including, but not limited to, loss of local GABA inhibition and loss of neuronal selectivity in early visual areas (Leventhal et al., 2003; Wang et al., 2005; Yu et al., 2006), myelin, dendritic and synaptic integrity (Peters, 2009; Piguet et al., 2009), alterations of long-range interactions between the ventral pathway and the prefrontal cortex (Thomas et al., 2008; Davis et al., 2009), differences in top-down control (Grady, 2008), and categorical dedifferentiation in higher-order cortex (Park et al., 2004; Voss et al., 2008). In addition to a new quantification of visual noise sensitivity delay with age, we established that this effect is reliable within subjects (test-retest in 24 subjects). Finally, we observed a qualitative shift in the time-course of brain activity around 47 years of age.
Improvements Over Previous Face Studies
Previous EEG and MEG studies have focused their analyses on component peak latencies to estimate processing speed. In particular, they all measured the latencies of the M/N170 peak as a measure of face processing speed (Rousselet et al., 2008a). However, a link between information processing speed and peak latencies of face-evoked activity has been demonstrated only recently in the case of an emotion discrimination task (Schyns et al., 2007). This relationship was observed using tightly controlled stimuli, and it may not apply to other tasks and uncontrolled stimuli used in previous experiments.
Comparing the latencies from the same peak across age groups presumes that one peak indexes the same neuronal process over the life-span. What information is processed in the time window of the N170, and how, has not been firmly established yet (Schyns et al., 2009). Here, we characterized the N170 time window by its sensitivity to image structure, which tended to be stronger than at any other period of time in young subjects. However, we observed a delay in image structure sensitivity with age. This delay in the maximum EEG sensitivity to image structure could either reflect a slowing of visual processing with age or be a consequence of additional attentional resources required by older subjects to perform the task. Indeed, old subjects might compensate for less efficient visual processing by increasing the top-down control of the ventral stream (Gazzaley et al., 2008; Grady, 2008). In young subjects, task requirements and task difficulty modulate ERP amplitude in the N170-P2 time-window in which our aging effects occurred (Vogel and Luck, 2000; Philiastides et al., 2006; Rousselet et al., 2007b; Rousselet et al., 2008a), so that the changes in the time-course of noise sensitivity we report could be due to attentional differences confounded with age.
Alternatively, the age-related delay in noise sensitivity might reflect a slowing of visual processing with age. This interpretation would lead to the conclusion that, in older subjects, later time windows might become functionally equivalent to the N170 time window in younger subjects (Figure 6). Hence, comparing the N170 across age groups might be misleading, because the single-trial activity around that time does not necessarily carry the same information content in all age groups.
The functional equivalence of two time periods, encompassing two peaks, seems to contradict the assumption that peaks reflect different processes, and the involvement of different cortical areas. Results from other laboratories also challenge this assumption. In intracranial recordings, the same narrow patch of cortex can produce the whole cascade of P1, N1/N170, and P2 peaks in response to objects and faces, sometimes with timing and relative shapes almost identical to scalp data (Allison et al., 1999; Barbeau et al., 2008; Sehatpour et al., 2008; Rosburg et al., 2009). In addition, the MEG sources of the M170 and the M200, the magnetic equivalent of the N170 and the P2, are very similar, suggesting that the two peaks may reflect the continuous activity of the same area (Itier et al., 2006). However, at this point, we cannot dissociate the attentional from the processing speed interpretations of our results.
Age-Latency Relationship
We found a progressive age-related delay in noise sensitivity, with an estimated slope of 1 ms/year (Figure 9). This estimate is difficult to compare to the existing face literature, because our study is the first to test a continuum of ages using a component-free approach.
Large groups of subjects, with a continuum of ages, have been tested in aging studies that used the P100 pattern-reversal component as a measure of perceptual processing speed. The P100 is the major positive peak around 100 ms recorded with EEG and MEG in response to checkerboards. Using this technique, some studies have reported a progressive slowing from early adulthood (Shaw and Cant, 1980; Sokol et al., 1981), whereas others have reported stable processing speed until the early 1950s or 1960s, followed by a progressive slowing in later life (Allison et al., 1984; Mitchell et al., 1987; Pitt and Daldry, 1988; Armstrong et al., 1991; Tobimatsu et al., 1993). Our results tend to show a linear age effect on the timing of noise sensitivity, but it seems that many more subjects would be required to properly assess the linearity of our results. Also, we did find a non-linear, qualitative shift, in the shape of brain activity around 47 years of age, but it is unclear how this effect may relate to earlier P100 effects (Figure 13).
Optical Factors
It is important to realize that aging studies, whether they used checkerboards, simple stimuli, or more complex face stimuli, have all reported large variance within age groups. Thus, despite significant age effects, there tends to be considerable overlap between age groups. The unexplained variance implies that factors other than chronological age may be more suitable for explaining our effects.
Beyond the other age-related changes we have listed already, P100 studies have identified senile miosis as a potential explanation for age-related delays. Senile miosis, the reduction in pupil size with age, is responsible for a reduction in retinal illuminance (Winn et al., 1994), which in turn may explain the increased latency of cortical evoked activity with age. Indeed, independently of age, the P100 latency increases with reduction in checkerboard luminance (Cant et al., 1978; Shaw and Cant, 1980; Kurita-Tashima et al., 1992; Tobimatsu et al., 1993). Drug induced pupil dilation decreases P100 latency, whereas pupil constriction has the opposite effect (Hawkes and Stow, 1981; Tobimatsu et al., 1988). More striking, reduced luminance causes the same latency increase in retinal evoked activity and in cortical evoked activity, suggesting that retinal delays could explain cortical delays, at least in young- and middle-age subjects (Tobimatsu et al., 1988; Froehlich and Kaufman, 1991).
Thus, there is a link between retinal illuminance and processing speed, suggesting that senile miosis may explain age-related changes in cortical processing speed. However, a study that directly assessed the effect of aging on retinal and cortical activity concluded that age-related retinal delays cannot account entirely for the cortical delays, so that cortical delays were neuronal, not optical in origin (Celesia et al., 1987). Other authors also concluded that reduced retinal illuminance caused by increased miosis could not entirely explain increased P100 latencies with age (Sokol et al., 1981; Morrison and Reilly, 1989; Tobimatsu et al., 1993). In contrast, one study reported a significant effect of age on the P100 latency at 5 cd/m2, but no effect at 50 cd/m2 (Shaw and Cant, 1980). Moreover, Trick et al. (1986) found no age-related latency change in retinal or cortical activity after correcting for the reduction in retinal illuminance caused by senile miosis. The correction was estimated by testing four control observers with neutral density filters. However, as noted by Morrison and Reilly (1989), equating for retinal illuminance fails to take into account the benefits provided by senile miosis (Sloane et al., 1988; Winn et al., 1994). It is also not clear whether the results from one study using checkerboards can be generalized to all visual stimuli, including our set of faces.
Overall, the literature suggests that senile miosis contributes to the age-related delay in P100 latency, but is unclear about the size of that contribution. Importantly, as far as we know, no study yet has modeled retinal and cortical processing speed as a function of age, pupil size, and luminance. We plan to study these factors systematically using our EEG approach.
Behavioral Consequences of the Age-Related Delay
One interpretation of our results suggests an age-related delay in EEG integration times, in the context of our task and face stimuli. We did not look for a relationship between reaction times and EEG estimates of processing speed because we instructed participants to be as accurate as possible, and that response speed was completely irrelevant to the experiment. Nevertheless, slower EEG integration times should predict the amount of time required by the visual system to reach a decision about the stimulus.
Visual integration time can be measured behaviorally using backward masking. Habak et al. (2008) used a 2-AFC task, in which a face is presented for 200, 500, or 1000 ms, followed by one random noise mask for 200 ms. Subjects then had to select one of two choice faces. The percentage of face geometry change necessary to perform the task was measured, at each stimulus duration, in young (mean age 23) and old (mean age 64) subjects. For front view faces, the same face orientation we used, Habak et al. reported a main effect of stimulus duration, but no effect of age. Their result suggests that aging does not affect processing speed in a front-view face-matching task, a result at odds with our EEG data. However, Habak et al. did not test older observers at stimulus durations shorter than 200 ms, and it is not clear whether their mask was able to completely block visual perception of the stimulus. Therefore, an aging effect might be observed at shorter stimulus durations or with a different mask. Our own behavioral results show that with 53 ms stimulus duration, older subjects had higher information thresholds than younger subjects. Finally, it is difficult to compare behavioral thresholds to our EEG estimates of processing speed, because we did not establish a link between brain activity and task- relevant diagnostic information (Schyns et al., 2009).
Future experiments will also need to determine whether the effects reported here extend to other object categories, and to tease apart task-relevant activity from mandatory bottom-up activity (Philiastides et al., 2006).
Conflict of Interest Statement
The authors declare that the research was conducted in the absence of any commercial or financial relationships that could be construed as a potential conflict of interest.
Acknowledgments
NSERC Discovery Grants 42133 and 105494, and Canada Research Chairs supported Patrick J. Bennett and Allison B. Sekuler. British Academy grant SG-45085 and ESRC grant RES-000-22-3209 supported Guillaume A. Rousselet. Cyril R. Pernet is funded by the SINAPSE collaboration – http://www.sinapse.ac.uk, a pooling initiative funded by the Scottish Funding Council and the Chief Scientist Office of the Scottish Executive. We thank Donna Waxman and Richard Louka for their help collecting data in Canada.
References
Allison, T., Hume, A. L., Wood, C. C., and Goff, W. R. (1984). Developmental and aging changes in somatosensory, auditory and visual evoked potentials. Electroencephalogr. Clin. Neurophysiol. 58, 14–24.
Allison, T., Puce, A., Spencer, D. D., and McCarthy, G. (1999). Electrophysiological studies of human face perception. I: Potentials generated in occipitotemporal cortex by face and non-face stimuli. Cereb. Cortex 9, 415–430.
Armstrong, R. A., Slaven, A., and Harding, G. F. (1991). Visual evoked magnetic fields to flash and pattern in 100 normal subjects. Vision Res. 31, 1859–1864.
Barbeau, E. J., Taylor, M. J., Regis, J., Marquis, P., Chauvel, P., and Liegeois-Chauvel, C. (2008). Spatio temporal dynamics of face recognition. Cereb. Cortex 18, 997–1009.
Cant, B. R., Hume, A. L., and Shaw, N. A. (1978). Effects of luminance on the pattern visual evoked potential in multiple sclerosis. Electroencephalogr. Clin. Neurophysiol. 45, 496–504.
Celesia, G. G., Kaufman, D., and Cone, S. (1987). Effects of age and sex on pattern electroretinograms and visual evoked potentials. Electroencephalogr. Clin. Neurophysiol. 68, 161–171.
Chaby, L., George, N., Renault, B., and Fiori, N. (2003). Age-related changes in brain responses to personally known faces: an event-related potential (ERP) study in humans. Neurosci. Lett. 349, 125–129.
Chaby, L., Jemel, B., George, N., Renault, B., and Fiori, N. (2001). An ERP study of famous face incongruity detection in middle age. Brain Cogn. 45, 357–377.
Davis, S. W., Dennis, N. A., Buchler, N. G., White, L. E., Madden, D. J., and Cabeza, R. (2009). Assessing the effects of age on long white matter tracts using diffusion tensor tractography. Neuroimage 46, 530–541.
de Fockert, J. W., Ramchurn, A., van Velzen, J., Bergstrom, Z., and Bunce, D. (2009). Behavioral and ERP evidence of greater distractor processing in old age. Brain Res. 1282, 67–73.
Delorme, A., and Makeig, S. (2004). EEGLAB: an open source toolbox for analysis of single-trial EEG dynamics including independent component analysis. J. Neurosci. Methods 134, 9–21.
Delorme, A., Sejnowski, T., and Makeig, S. (2007). Enhanced detection of artifacts in EEG data using higher-order statistics and independent component analysis. Neuroimage 34, 1443–1449.
DiCarlo, J. J., and Cox, D. D. (2007). Untangling invariant object recognition. Trends Cogn. Sci. 11, 333–341.
Froehlich, J., and Kaufman, D. I. (1991). Effect of decreased retinal illumination on simultaneously recorded pattern electroretinograms and visual-evoked potentials. Invest. Ophthalmol. Vis. Sci. 32, 310–318.
Gao, L., Xu, J., Zhang, B., Zhao, L., Harel, A., and Bentin, S. (2009). Aging effects on early-stage face perception: an ERP study. Psychophysiology 46, 970–983.
Gaspar, C. M., and Rousselet, G. A. (2009). How do amplitude spectra influence rapid animal detection? Vision Res. 49, 3001–3012.
Gazzaley, A., Clapp, W., Kelley, J., McEvoy, K., Knight, R. T., and D’Esposito, M. (2008). Age-related top-down suppression deficit in the early stages of cortical visual memory processing. Proc. Natl. Acad. Sci. U.S.A. 105, 13122–13126.
Gold, J., Bennett, P. J., and Sekuler, A. B. (1999). Identification of band-pass filtered letters and faces by human and ideal observers. Vision Res. 39, 3537–3560.
Habak, C., Wilkinson, F., and Wilson, H. R. (2008). Aging disrupts the neural transformations that link facial identity across views. Vision Res. 48, 9–15.
Hawkes, C. H., and Stow, B. (1981). Pupil size and the pattern evoked visual response. J. Neurol. Neurosurg. Psychiatr. 44, 90–91.
Hofer, S. M., and Sliwinski, M. J. (2001). Understanding ageing: an evaluation of research designs for assessing the interdependence of ageing-related changes. Gerontology 47, 341–352.
Husk, J. S., Bennett, P. J., and Sekuler, A. B. (2007). Inverting houses and textures: investigating the characteristics of learned inversion effects. Vision Res. 47, 3350–3359.
Itier, R. J., Herdman, A. T., George, N., Cheyne, D., and Taylor, M. J. (2006). Inversion and contrast-reversal effects on face processing assessed by MEG. Brain Res. 1115, 108–120.
Kovesi, P. (2003). “Phase congruency detects corners and edges,” in Paper Presented at The Australian Pattern Recognition Society Conference: DICTA 2003, Sydney.
Kurita-Tashima, S., Tobimatsu, S., Nakayama-Hiromatsu, M., and Kato, M. (1992). The neurophysiologic significance of frontal negativity in pattern-reversal visual-evoked potentials. Invest. Ophthalmol. Vis. Sci. 33, 2423–2428.
Leventhal, A. G., Wang, Y., Pu, M., Zhou, Y., and Ma, Y. (2003). GABA and its agonists improved visual cortical function in senescent monkeys. Science 300, 812–815.
Makeig, S., Delorme, A., Westerfield, M., Jung, T. P., Townsend, J., Courchesne, E., and Sejnowski, T. J. (2004). Electroencephalographic brain dynamics following manually responded visual targets. PLoS Biol. 2, e176. doi: 10.1371/journal.pbio.0020176.
Maris, E., and Oostenveld, R. (2007). Nonparametric statistical testing of EEG- and MEG-data. J. Neurosci. Methods 164, 177–190.
McCulloch, C. E., Searle, S. R., and Neuhaus, J. M. (2008). Generalized, Linear, and Mixed Models, 2nd Edn. Hoboken, NJ: John Wiley & Sons.
Mitchell, K. W., Howe, J. W., and Spencer, S. R. (1987). Visual evoked potentials in the older population: age and gender effects. Clin. Phys. Physiol. Meas. 8, 317–324.
Moore, A. R. (1920). Stereotropism as a function of neuromuscular organization. J. Gen. Physiol. 2, 319–324.
Morrison, J. D., and Reilly, J. (1989). The pattern visual evoked cortical response in human ageing. Q. J. Exp. Physiol. 74, 311–328.
Nakamura, A., Yamada, T., Abe, Y., Nakamura, K., Sato, N., Horibe, K., Kato, T., Kachi, T., and Ito, K. (2001). Age-related changes in brain neuromagnetic responses to face perception in humans. Neurosci. Lett. 312, 13–16.
Park, D. C., Polk, T. A., Park, R., Minear, M., Savage, A., and Smith, M. R. (2004). Aging reduces neural specialization in ventral visual cortex. Proc. Natl. Acad. Sci. U.S.A. 101, 13091–13095.
Penrose, L. S. (1955). Evidence of heterosis in man. Proc. R. Soc. Lond., B, Biol. Sci. 144, 203–213.
Perrett, D. I., Oram, M. W., and Ashbridge, E. (1998). Evidence accumulation in cell populations responsive to faces: an account of generalisation of recognition without mental transformations. Cognition 67, 111–145.
Peters, A. (2009). The effects of normal aging on myelinated nerve fibers in monkey central nervous system. Front. Neuroanat. 3, 11.
Pfutze, E. M., Sommer, W., and Schweinberger, S. R. (2002). Age-related slowing in face and name recognition: evidence from event-related brain potentials. Psychol. Aging 17, 140–160.
Philiastides, M. G., Ratcliff, R., and Sajda, P. (2006). Neural representation of task difficulty and decision making during perceptual categorization: a timing diagram. J. Neurosci. 26, 8965–8975.
Philiastides, M. G., and Sajda, P. (2006). Temporal characterization of the neural correlates of perceptual decision making in the human brain. Cereb. Cortex 16, 509–518.
Piguet, O., Double, K. L., Kril, J. J., Harasty, J., Macdonald, V., McRitchie, D. A., and Halliday, G. M. (2009). White matter loss in healthy ageing: a postmortem analysis. Neurobiol. Aging 30, 1288–1295.
Pitt, M. C., and Daldry, S. J. (1988). The use of weighted quadratic regression for the study of latencies of the P100 component of the visual evoked potential. Electroencephalogr. Clin. Neurophysiol. 71, 150–152.
Rosburg, T., Ludowig, E., Dumpelmann, M., Alba-Ferrara, L., Urbach, H., and Elger, C. E. (2009). The effect of face inversion on intracranial and scalp recordings of event-related potentials. Psychophysiology. 47, 147–157.
Rousselet, G. A., Husk, J. S., Bennett, P. J., and Sekuler, A. B. (2007a). Single-trial EEG dynamics of object and face visual processing. Neuroimage 36, 843–862.
Rousselet, G. A., Macé, M. J.-M., Thorpe, S. J., and Fabre-Thorpe, M. (2007b). Limits of ERP differences in tracking object processing speed. J. Cogn. Neurosci. 19, 1–18.
Rousselet, G. A., Husk, J. S., Bennett, P. J., and Sekuler, A. B. (2008a). Time course and robustness of ERP object and face differences. J. Vision 8, 3, 1–18. http://journalofvision.org/18/12/13/, doi:10.1167/1168.1112.1163.
Rousselet, G. A., Pernet, C. R., Bennett, P. J., and Sekuler, A. B. (2008b). Parametric study of EEG sensitivity to phase noise during face processing. BMC Neurosci. 9, 98. http://www.biomedcentral.com/1471-2202/1479/1498/
Rousselet, G. A., Husk, J. S., Pernet, C. R., Gaspar, C. M., Bennett, P. J., and Sekuler, A. B. (2009). Age-related delay in information accrual for faces: evidence from a parametric, single-trial EEG approach. BMC Neurosci. 10. doi: 1410.1186/1471-2202-1410-1114. http://www.biomedcentral.com/1471-2202/1410/1114.
Rousselet, G. A., Thorpe, S. J., and Fabre-Thorpe, M. (2004). How parallel is visual processing in the ventral pathway? Trends Cogn. Sci. 8, 363–370.
Schyns, P. G., Gosselin, F., and Smith, M. L. (2009). Information processing algorithms in the brain. Trends Cogn. Sci. 13, 20–26.
Schyns, P. G., Petro, L. S., and Smith, M. L. (2007). Dynamics of visual information integration in the brain for categorizing facial expressions. Curr. Biol. 17, 1580–1585.
Sehatpour, P., Molholm, S., Schwartz, T. H., Mahoney, J. R., Mehta, A. D., Javitt, D. C., Stanton, P. K., and Foxe, J. J. (2008). A human intracranial study of long-range oscillatory coherence across a frontal-occipital-hippocampal brain network during visual object processing. Proc. Natl. Acad. Sci. U.S.A. 105, 4399–4404.
Shaw, N. A., and Cant, B. R. (1980). Age-dependent changes in the latency of the pattern visual evoked potential. Electroencephalogr. Clin. Neurophysiol. 48, 237–241.
Sloane, M. E., Owsley, C., and Alvarez, S. L. (1988). Aging, senile miosis and spatial contrast sensitivity at low luminance. Vision Res. 28, 1235–1246.
Sokol, S., and Moskowitz, A. (1981). Effect of retinal blur on the peak latency of the pattern evoked potential. Vision Res. 21, 1279–1286.
Sokol, S., Moskowitz, A., and Towle, V. L. (1981). Age-related changes in the latency of the visual evoked potential: influence of check size. Electroencephalogr. Clin. Neurophysiol. 51, 559–562.
Thomas, C., Moya, L., Avidan, G., Humphreys, K., Jung, K. J., Peterson, M. A., and Behrmann, M. (2008). Reduction in white matter connectivity, revealed by diffusion tensor imaging, may account for age-related changes in face perception. J. Cogn. Neurosci. 20, 268–284.
Tobimatsu, S., Celesia, G. G., and Cone, S. B. (1988). Effects of pupil diameter and luminance changes on pattern electroretinograms and visual evoked potentials. Clin. Vision Sci. 2, 293–302.
Tobimatsu, S., Kurita-Tashima, S., Nakayama-Hiromatsu, M., Akazawa, K., and Kato, M. (1993). Age-related changes in pattern visual evoked potentials: differential effects of luminance, contrast and check size. Electroencephalogr. Clin. Neurophysiol. 88, 12–19.
Trick, G. L., Trick, L. R., and Haywood, K. M. (1986). Altered pattern evoked retinal and cortical potentials associated with human senescence. Curr. Eye Res. 5, 717–724.
Uhlhaas, P. J., Pipa, G., Lima, B., Melloni, L., Neuenschwander, S., Nikolic, D., and Singer, W. (2009). Neural synchrony in cortical networks: history, concept and current status. Front. Integr. Neurosci. 3:17. doi: 10.3389/neuro.07.017.2009.
Vogel, E. K., and Luck, S. J. (2000). The visual N1 component as an index of a discrimination process. Psychophysiology 37, 190–203.
Voss, M. W., Erickson, K. I., Chaddock, L., Prakash, R. S., Colcombe, S. J., Morris, K. S., Doerksen, S., Hu, L., McAuley, E., and Kramer, A. F. (2008). Dedifferentiation in the visual cortex: an fMRI investigation of individual differences in older adults. Brain Res. 1244, 121–131.
Wang, Y., Zhou, Y., Ma, Y., and Leventhal, A. G. (2005). Degradation of signal timing in cortical areas V1 and V2 of senescent monkeys. Cereb. Cortex 15, 403–408.
Wichmann, F. A., and Hill, N. J. (2001). The psychometric function: II. Bootstrap-based confidence intervals and sampling. Percept. Psychophys. 63, 1314–1329.
Wiese, H., Schweinberger, S. R., and Hansen, K. (2008). The age of the beholder: ERP evidence of an own-age bias in face memory. Neuropsychologia 46, 2973–2985.
Wilcox, R. R. (2005). Introduction to Robust Estimation and Hypothesis Testing, 2nd Edn. San Diego, CA: Academic Press.
Winn, B., Whitaker, D., Elliott, D. B., and Phillips, N. J. (1994). Factors affecting light-adapted pupil size in normal human subjects. Invest. Ophthalmol. Vis. Sci. 35, 1132–1137.
Keywords: healthy aging, face processing, vision, noise, single-trials, EEG, ERP
Citation: Rousselet GA, Gaspar CM, Pernet CR, Husk JS, Bennett PJ and Sekuler AB (2010) Healthy aging delays scalp EEG sensitivity to noise in a face discrimination task. Front. Psychology 1:19. doi: 10.3389/fpsyg.2010.00019
Received: 12 March 2010;
Paper pending published: 17 April 2010;
Accepted: 18 May 2010;
Published online: 19 July 2010
Edited by:
Paul Sajda, Columbia University, USAReviewed by:
Marios Philiastides, Max Planck Institute for Human Development, GermanyArnaud Delorme, Centre de Recherche Cerveau et Cognition, France
Copyright: © 2010 Rousselet, Gaspar, Pernet, Husk, Bennett and Sekuler. This is an open-access article subject to an exclusive license agreement between the authors and the Frontiers Research Foundation, which permits unrestricted use, distribution, and reproduction in any medium, provided the original authors and source are credited.
*Correspondence: Guillaume A. Rousselet, Centre for Cognitive Neuroimaging, Department of Psychology, University of Glasgow, 58 Hillhead street, Glasgow G12 8QB, UK. e-mail: g.rousselet@psy.gla.ac.uk