Visual tuning properties of genetically identified layer 2/3 neuronal types in the primary visual cortex of cre-transgenic mice
- 1 Allen Institute for Brain Science, Seattle, WA, USA
- 2 Center for Integrative Brain Research, Seattle Children’s Research Institute, Seattle, WA, USA
The putative excitatory and inhibitory cell classes within the mouse primary visual cortex V1 have different functional properties as studied using recording microelectrode. Excitatory neurons show high selectivity for the orientation angle of moving gratings while the putative inhibitory neurons show poor selectivity. However, the study of selectivity of the genetically identified interneurons and their subtypes remain controversial. Here we use novel Cre-driver and reporter mice to identify genetic subpopulations in vivo for two-photon calcium dye imaging: Wfs1(+)/Gad1(−) mice that labels layer 2/3 excitatory cell population and Pvalb(+)/Gad1(+) mice that labels a genetic subpopulation of inhibitory neurons. The cells in both mice were identically labeled with a tdTomato protein, visible in vivo, using a Cre-reporter line. We found that the Wfs1(+) cells exhibited visual tuning properties comparable to the excitatory population, i.e., high selectivity and tuning to the angle, direction, and spatial frequency of oriented moving gratings. The functional tuning of Pvalb(+) neurons was consistent with previously reported narrow-spiking interneurons in microelectrode studies, exhibiting poorer selectivity than the excitatory neurons. This study demonstrates the utility of Cre-transgenic mouse technology in selective targeting of subpopulations of neurons and makes them amenable to structural, functional, and connectivity studies.
Introduction
The cellular and circuit level understanding of perception may benefit from structural, functional, and connectivity analyses of the population of neurons encoding sensory information. The primary visual cortex (V1) has served as a model for understanding cortical circuitry and computation since Hubel and Wiesel reported orientation tuning in this region in the cat (Hubel and Wiesel, 1962; Ferster and Miller, 2000). Neurons in the rodent V1 show, among other hallmarks of a developed visual system, high orientation selectivity. This has encouraged the study of emergence of visual tuning in the mouse V1 and the role of thalamic input and local connectivity of subpopulations of neurons (Drager, 1975; Mangini and Pearlman, 1980; Niell and Stryker, 2008). The combination of two-photon calcium dye imaging and transgenic labeling of genetically identified cells in mouse is a promising method for studying simultaneous neuronal activity from a large number of V1 neurons within which subpopulations of neurons are selectively labeled (Stosiek et al., 2003; Ohki, 2005; Sohya et al., 2007).
In vivo calcium dye imaging experiments have been performed on labeled inhibitory interneurons carrying the transgene Gad67-EGFP Δneo (Sohya et al., 2007; Kerlin et al., 2010) (Gad67 = Gad1). The orientation tuning of the labeled interneuron population was compared to the non-labeled population of the surrounding unidentified, mostly excitatory neurons in the layer 2/3 of mouse V1. The genetic labeling method in this transgenic mouse did not distinguish between the three major genetic subpopulations of interneurons, namely, parvalbumin (PVALB), somatostatin (SST), and vasoactive intestinal peptide (VIP) expressing cells (Kawaguchi and Kubota, 1997; Markram et al., 2004; Ascoli et al., 2008; Xu et al., 2010). Niell and Stryker (2008) used multisite silicon probes to identify and study the wide-spiking putative excitatory cells and narrow-spiking putative inhibitory cells across various depths of the cortex (McCormick et al., 1985; Niell and Stryker, 2008). They demonstrated that the orientation tuning, spatial frequency tuning, and linearity of responses segregated across the two cell types. But what is unknown is how well the narrow-spiking putative interneuron category in microelectrode studies maps onto the visually active Gad1(+) population in the two-photon imaging experiments. It is widely believed that the narrow-spiking interneurons identified by microelectrode recordings are frequently the Pvalb(+) subpopulation of Gad1(+) interneurons.
Pvalb(+) interneurons constitute not more than 10% of all neurons in the mouse cortex and not more than half of all Gad1(+) interneurons (Xu et al., 2010). These cells show typical morphology (e.g., basket or chandelier cells) and synaptic connectivity, in most cases providing a feed forward somatic inhibition (Kawaguchi and Kubota, 1997; Chattopadhyaya et al., 2004; Cruikshank et al., 2010). Two recent studies used in vivo calcium dye imaging and targeted cell-attached electrical recording methods to study the Pvalb(+) cell population in V1, and reached different conclusions about the selectivity of these cells to the orientation of moving gratings (Kerlin et al., 2010; Runyan et al., 2010). These studies used different approaches to identify the Pvalb(+) cells. Runyan et al. used viral reporter with a Pvalb-Cre mouse while Kerlin et al. used the Gad67-EGFP mouse and post-imaging immunohistochemistry (IHC) with Pvalb antibodies. While these studies interpret two alternative tuning of the Pvalb(+) cell population, the data suggests a certain extent of diversity in the selectivity of neurons within the Pvalb(+) population. In the current study we also used Cre mice to identify specific cell populations but employed a well characterized and ubiquitous Cre-reporter mouse line that produces even labeling of all genetically identified cells. The use of these mice eliminates confounds due to gene knock-in into functional alleles and tropism of viral reporters (Hasenstaub and Callaway, 2010; Madisen et al., 2010; Runyan et al., 2010). By using double-transgenic mice (Cre lines crossed with reporter) for in vivo two-photon calcium dye imaging, the bright orange tdTomato fluorescence (Shaner et al., 2004) also eliminated potential ambiguity in distinguishing genetically labeled cells from the green calcium dye fluorescence signal (OGB-1), as compared to the commonly used GFP reporter.
The Allen Mouse Brain Atlas led to the identification of selective genetic markers for various layer-specific and interneuron-specific cortical cells in the mouse (Lein et al., 2007). Wfs1 gene is selectively enriched in neurons of layer 2/3 in the mouse cortex. The functional basis or consequence of this enriched expression is not yet understood (Hofmann et al., 2003; Osman et al., 2003; Kawano et al., 2008; Kakiuchi et al., 2009). Our interests in characterizing neurons labeled by this marker are manifold. This is the first genetically labeled excitatory population enriched in the mouse cortical layer 2/3 that could be readily studied using dye imaging methods. Furthermore, we wished to characterize functional properties of a Cre-labeled excitatory population that could be targeted toward local microcircuitry and/or developmental plasticity studies in V1. Finally, we wished to test the possibility that the Wfs1(+) cell population may represent a functionally distinct subset within excitatory neurons that are known to respond to many orientations, directions, and spatial frequencies. Since the Wfs1 gene is enriched across the entire layer 2/3 of the mouse cortex, it might also represent a conserved and functionally consistent component of the cortical microcircuitry.
Materials and Methods
All surgeries and experimental procedures were conducted under guidelines of the Allen Institute for Brain Science Institutional Animal Care and Use Committee. We used only adult mice for these studies, in the age range of P56–P120 days.
Transgenic Mice
Two types of Cre-transgenic mice were used in the study. The first was Wfs1-Tg2-CreERT2;Ai9, in which the CreERT2 recombinase expression from the BAC transgenic line Wfs1-Tg2-CreERT2 activated the tdTomato reporter (in Ai9) expression in Wfs1(+) excitatory population after Tamoxifen induction either through I.P. route or oral gavage at a dose of 200 μg per gram body weight per day for 5 days (Madisen et al., 2010). The second type of mice was Pvalb-2A-Cre;Ai9, in which the Cre recombinase expression from the knock-in line Pvalb-2A-Cre activated tdTomato labeling in Pvalb(+) population (Madisen et al., 2010).
Immunohistochemistry
Primary mouse anti-NeuN antibodies (Chemicon) were used (1:250, in 0.1% TritonX, blocked by 4% normal goat serum in PBS) followed by goat anti-mouse secondary antibodies conjugated with Alexa 488. The images were acquired using Olympus Fluoview 1000 confocal microscope (20×, with sequential scanning, excitation wavelengths of 488 and 568 nm, emission bandpass at 500–535 nm and 550–600 nm).
Mouse Preparation for in vivo Imaging
Mice were anesthetized with 5% isoflurane at a 4:1 ratio of N2:O2. An anesthetized mouse was intubated with a single use sterile I.V. catheter (Surflash, O.D. 1.1 mm, I.D. 0.8 mm, length 25 mm) for ventilation and kept ventilated with a 1.5–2.0% isoflurane in 4:1 ratio of N2:O2 during the surgery. Following midline incision, a titanium imaging chamber (O.D. 15 mm, I.D. 8 mm, weight 800 mg) was implanted using a mix of dental cement (Lang dental) and graphite powder, centered over the mouse visual cortex (stereotaxic coordinates 2 and 3 mm laterally from midline and 1 mm anterior to the lambda suture) over a cleaned skull. Each mouse was allowed to recover completely in its home cage after the chamber implantation. The mouse was once again prepared for surgery on the day of imaging. A 2-mg/kg dexamethasone was administered subcutaneously to reduce secretion and edema during the craniotomy followed by isoflurane induction, intubation, and ventilation as detailed above. The craniotomy and calcium dye injections were performed at 1.5–2.0% isoflurane in 4:1 N2:O2 (heart rate was invariably between 350 and 550 beats/min). A 1-mM concentration of calcium indicator dye (Oregon Green BAPTA-1-AM ester, Invitrogen) was prepared and bulk loaded 200–300 μm below the dura mater as has been detailed in other literature (Garaschuk et al., 2006; Gandhi et al., 2008). A sedative chlorprothixene (1 mg/kg or 0.05–0.1 ml of 2% solution for an under 20 g mouse) was injected via I.P. after completion of dye loading. This allowed reduction of isoflurane down to 0.7%. The craniotomy was sealed with 1.2% low melting agarose (Sigma) in saline. Eyes were kept lubricated with mineral oil (30000 centistokes from Sigma).
Imaging Setup
Imaging was performed using a custom built two-photon microscope (Tsai et al., 2002) fitted with a Mai Tai 80 femto second pulse laser with dispersion compensation unit and a Zeiss W Plan-Apochromat, water immersion, 20×, 1.0 NA objective with 1.8 mm working distance. The calculated depth point spread function was 5 μm (FWHM). In order to synchronize the visual stimulation with image acquisition, a digital pulse was sent using a National Instruments PCI-6221 board from the computer controlling Psychtoolbox. This signal was then recorded on one of four analog channels of an NI PCI-6115 board on the image acquisition computer. Image acquisition was performed using MPScope software (Nguyen et al., 2006). The other three Analog input channels on the image acquisition system were used for acquiring images. Data were collected at 324 × 324 (pixel × lines) at 3.54 Hz.
Visual Stimuli
The 2-D moving grating stimuli were generated using Psychtoolbox (Brainard, 1997; Pelli, 1997) in Matlab version 2007b (Figure A1A of Appendix). The gratings were presented through a calibrated LCD monitor (NEC 19-inch), placed 28 cm from the center of the line between the two eyes of the mouse. The monitor subtended an angle of ±33° horizontally and −10° and +30° vertically around the eye of the mouse. For orientation tuning, 12 directed gratings were presented with the spatial frequency set at 0.05 cycles per degree (cpd) for the Wfs1(+) mice and 0.02 cpd for the Pvalb(+) mice. Stimuli were presented at 2.0 Hz temporal frequency. For spatial frequency tuning the spatial frequency was varied over six octaves (0.01, 0.02, 0.04, 0.08, 0.16, and 0.32 in cpd) for three moving grating stimuli directed at 60°, 180°, and 300° along with a full field dark and light flicker at 2.0 Hz temporal frequency (Table 1). Twelve directed gratings were presented at 0.04 cpd in order to determine the orientation preference of the cell.
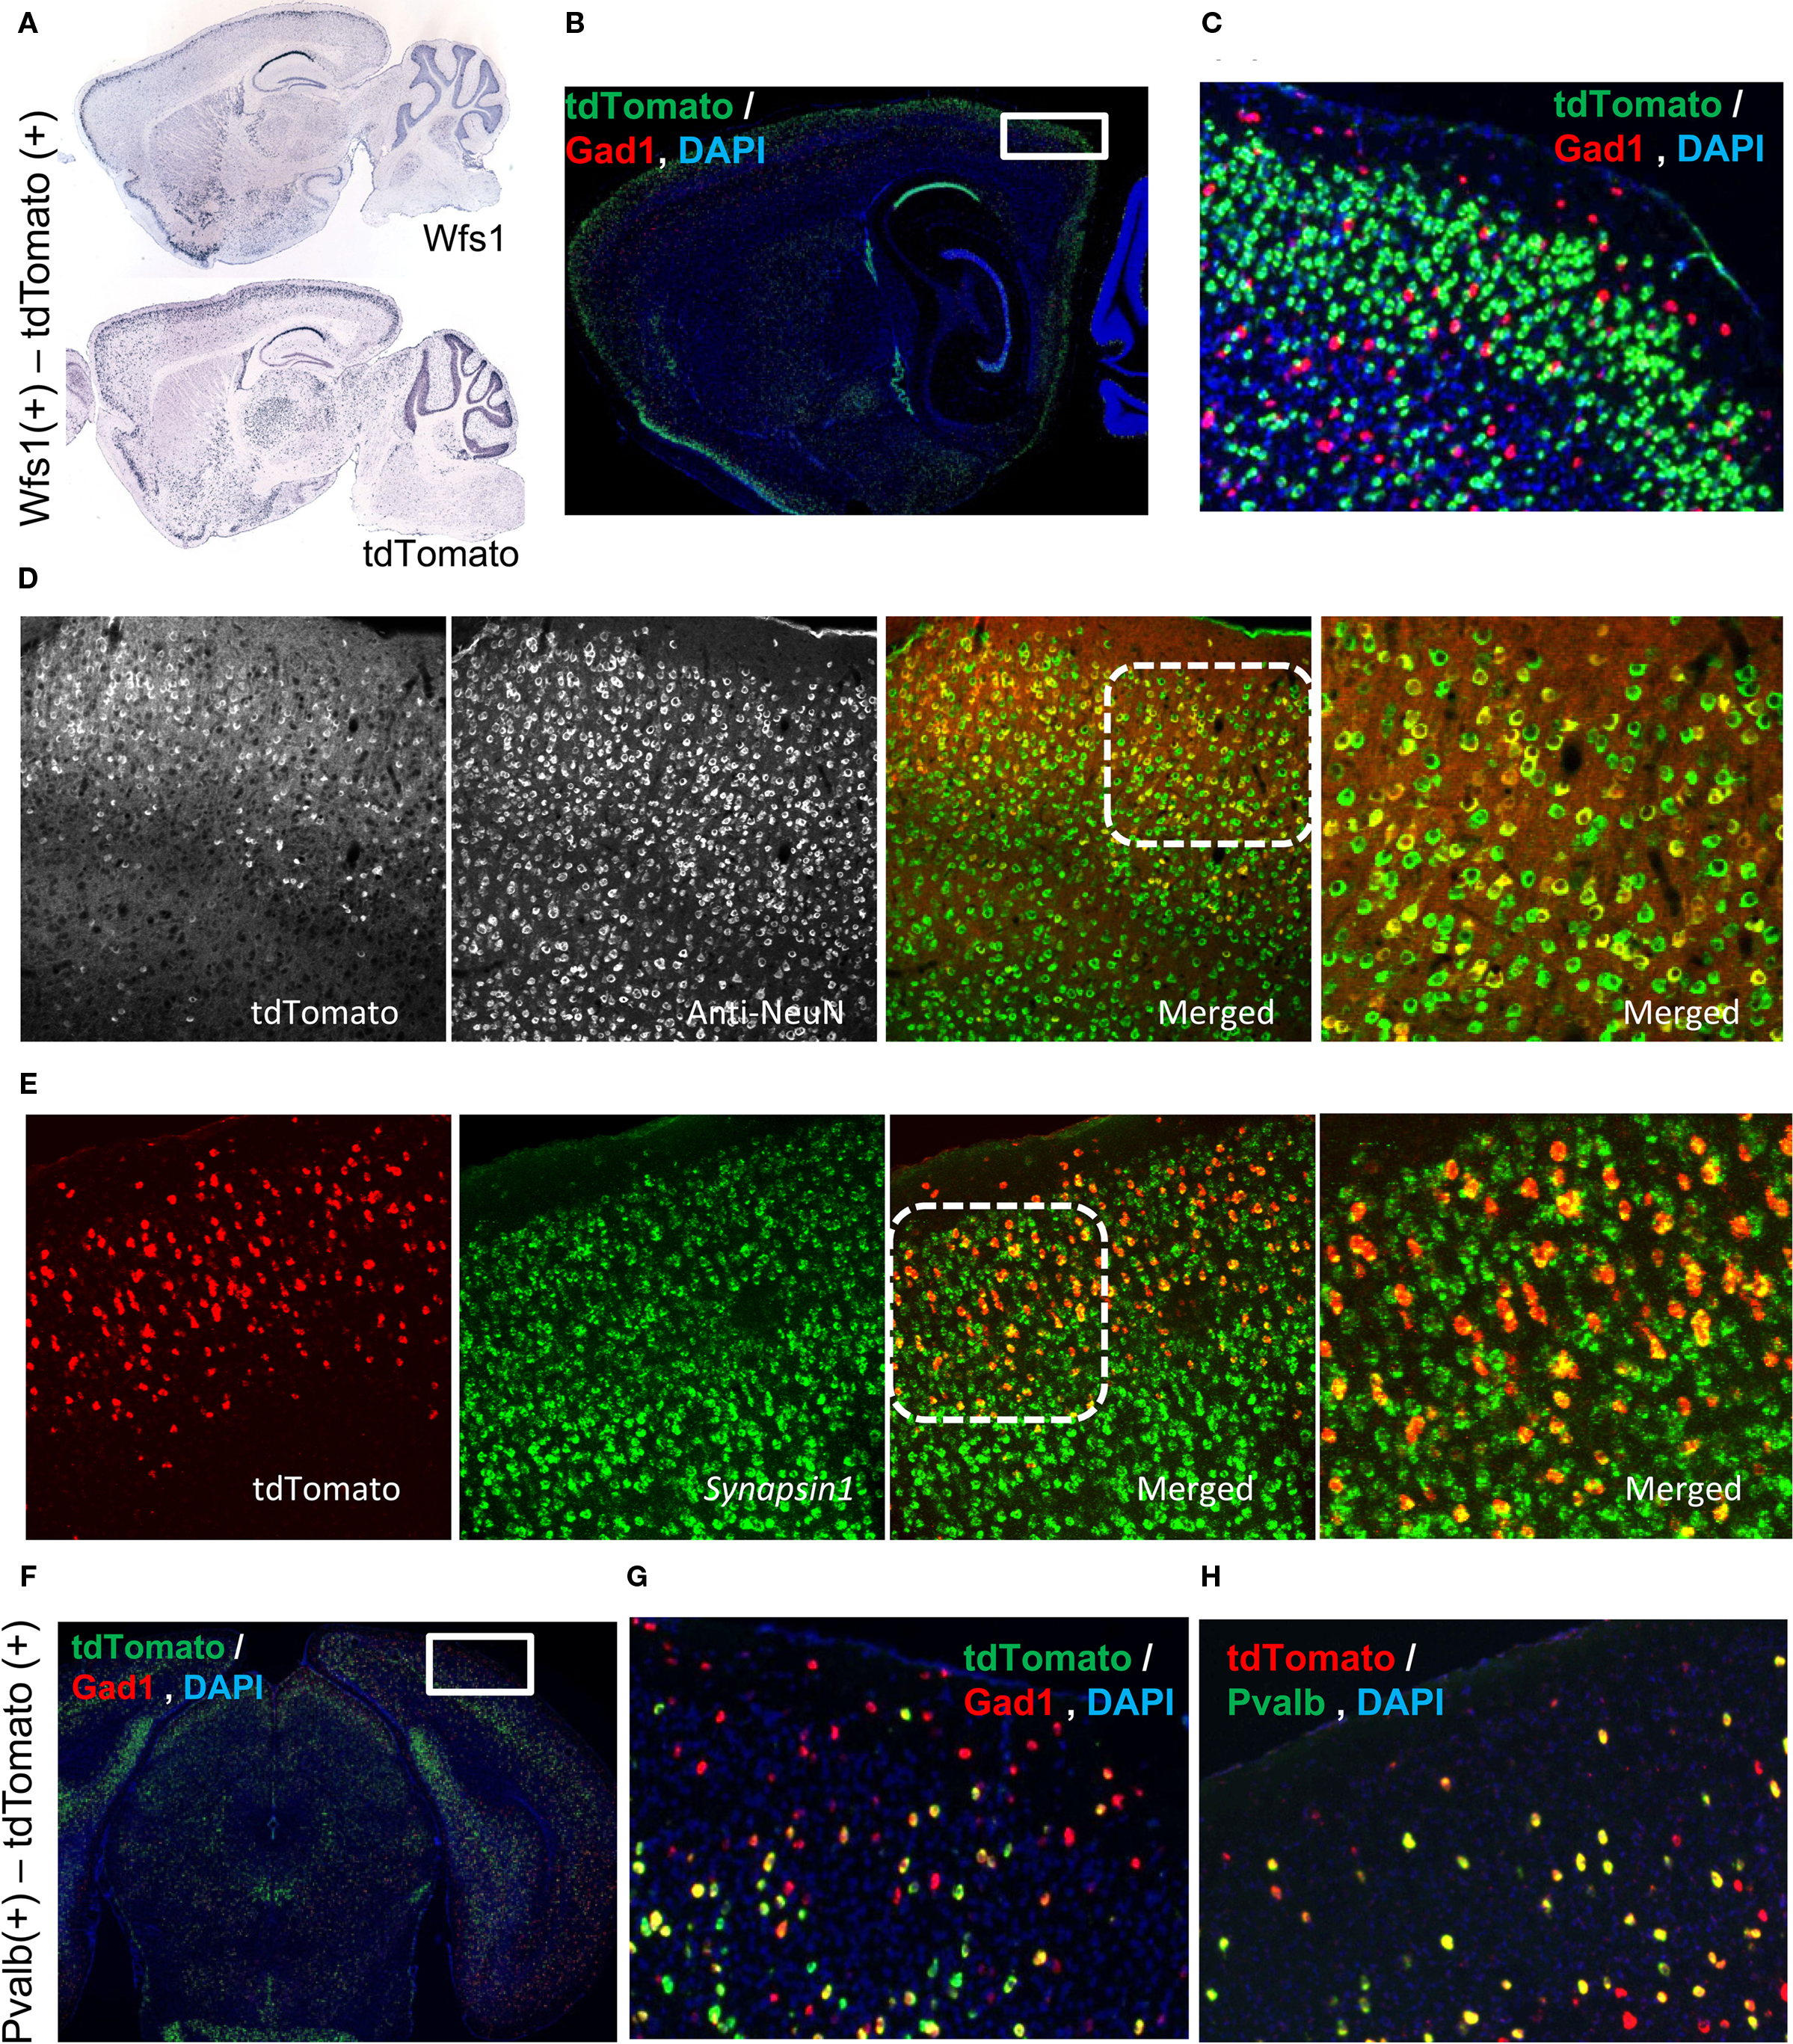
Figure 1. Molecular characterization of the Wfs1(+) and Pvalb(+) cells. (A) Allen Mouse Brain Atlas ISH data depicting Wfs1 gene expression compared with the tdTomato ISH pattern in the Wfs1-Tg2-CreERT2 line. (B,C) Wfs1(+) specific tdTomato expression is enriched in layer 2/3 and is Gad1(−). dFISH shows Gad1(+) cells in red and tdTomato expressing cells in green. The area boxed in (B) is enlarged in (C). (D) Immunohistochemical characterization of Wfs1(+) – tdTomato labeled (native fluorescence) using NeuN antibodies (Alexa 488 conjugated secondary) in a Wfs1(+) mouse crossed with Ai9 reporter mouse. (E) dFISH characterization with probes for Synapsin I and tdTomato genes in Wfs1(+) – Ai9 mouse. Superficial layer on the top in both (D,E). Area marked with dotted square on the merged image in (D,E) is shown enlarged in the subsequent image to the right. (F,G,H) Pvalb(+) cell population in superficial layers is Gad1(+). dFISH shows Gad1 (red) and tdTomato (green) expression pattern (F,G), and tdTomato (red), Pvalb (green) expression (H). The area boxed in (F) is enlarged in (G).
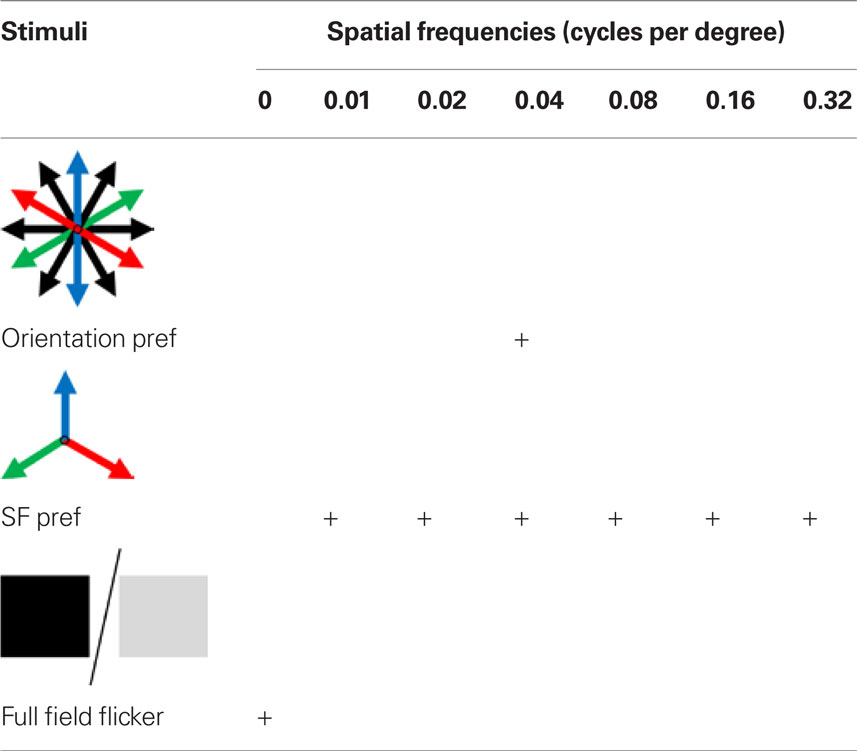
Table 1. Stimuli set used for identifying orientation and spatial frequency preference in mice tested for spatial frequency tuning.
The choice of imaging area was based on a visual survey of responses from at least 5–15 cells that showed transients locked to full field sinusoids at six orientation angles (30° apart) where each angle was blocked in 4–6 repeated trials. In most cases, imaging was initiated at approximately 3.0 mm lateral from midline (the border to V1 and V2) and was adjusted to posterior and/or medial positions (toward the monocular zone).
Data Analysis
The acquired images were converted into image stacks (as TIFF) using MP View software (Nguyen et al., 2006). We corrected for frame misalignment by a 2-D translation in X and Y directions. An algorithm used the middle frame of a sequence as template, estimated, and corrected the 2-D offsets of each frame by a maximum correlation method. All further analysis was performed in Matlab (version R2007a). Regions of interest (ROI) for visually identifiable cell bodies were selected at the center of the tdTomato labeled cell units on an averaged image from 30 to 100 image frames collected with 950 nm two-photon excitation (605 nm emission). The ROI image mask was overlaid on the averaged image of the correlation-corrected time lapsed image stack acquired on the 525-nm imaging channel (for OGB filled neurons excited with 800 nm wavelength). ROIs were re-adjusted to align them to the center of the cell and eroded at the edges to choose only the center pixels. This reduced the level of contamination of the non-selective neuropil signal (Garaschuk et al., 2006; Gandhi et al., 2008). TdTomato labeled units that were not double labeled with OGB-1 were not included in the analysis. The ROIs for the rest of the OGB filled units were then drawn over the same averaged image. In case of Wfs1(+) cells, all ROIs that were visually identifiable were included in the analysis. Since the interneurons exhibited mostly non-selective responses, Pvalb(+) cells labeled with tdTomato that were below the plane of dissection or could not be clearly visualized were not analyzed. The raw fluorescent signal was divided into trials as pre-stimulus baseline, stimulus, and post-stimulus baseline. An average of the pre- and post-stimulus baseline was taken to calculate the ΔF/F. Neuropil contamination (average of fluorescence signal from four regions that were occupied by blood vessels and therefore devoid of cell bodies) was subtracted from the raw signal before calculating ΔF/F. In case of Pvalb(+) cells, we compared two different neuropil signals: An average of the region representing blood vessel and a cell-free area adjacent to each of the Pvalb(+) cell bodies. Our results [orientation selectivity index (OSI) and tuning] were not affected by the choice of neuropil subtraction. Choosing ROIs at the center removes the major component of neuropil contamination.
Cells were identified as visually responsive if their mean ΔF/F during the stimulus period was greater than mean ± 3 SD above the ΔF/F of the baseline period and significant by ANOVA at P < 0.01.
Preferred orientation and direction
To calculate the preferred orientation angle (θpref) we defined “a” and “b” using the following equations (Swindale et al., 1987).
Where N is the number of angles presented, “θ” is angles 30, 60, 90, 120, 150, and 180 in degree. θpref was then calculated by testing following conditions
θpref carried values between 1° and 180°. These values were binned into six bins centered at 30°, 60°, 90°, 120°, 150°, and 180°. Each bin was assigned a color code used for generating the functional map (see ahead Figure 5A).
A cell was assigned as direction-selective if the response in one preferred direction was three times larger than the response to the opposite direction (Swindale et al., 1987).
Orientation and direction selectivity
The OSI of each cell was calculated from the strength of calcium response (peak response height, R) for the preferred orientation of the cells (θpref) and the orthogonal orientation (θortho), where θortho = θpref + π/2. R was measured as difference in the peak (average of three maximum values) of calcium response from mean of entire baseline (period with no stimulus). The values were normalized across all orientation angles before calculating OSI.
The preferred orientation was calculated for the tuned units using the method outlined above.
Spatial frequency tuning
A Gaussian was fitted to the signal height (maximum ΔF/F during stimulus period − ΔF/F during mean baseline) corresponding to each of the presented spatial frequencies at the preferred orientation angle of the cell. Optimal parameters were found using a downhill simplex method (FMINSEARCH function in Matlab). The peak of the fitted Gaussian was chosen as the peak spatial frequency of the cell.
Results
The molecular characteristics of the two types of double-transgenic mice, Wfs1-Tg2-CreERT2;Ai9 [simplified as Wfs1(+)] and Pvalb-2A-Cre;Ai9 [simplified as Pvalb(+)], was analyzed using in situ hybridization (ISH) and also with IHC. Their functional tuning to moving grating stimuli (Figure A1A of Appendix) of a subpopulation of tdTomato labeled excitatory and inhibitory neurons was studied using two-photon calcium dye imaging (Figures A1B,C of Appendix). The analysis was confined to layer 2/3 of the primary visual cortex V1. The data acquired across various depths within layer 2/3 were pooled for analysis of functional tuning. The dye loading procedure limits the ability to image from neurons below the depth of approximately 350 μm. TdTomato fluorescence was detectable with 950 nm two-photon laser excitation at depths below 350 μm.
Molecular Characterization of Wfs1(+) and Pvalb(+) Cells
The Wfs1 gene is enriched in the layer 2/3 as shown in the Allen Mouse Brain Atlas using ISH (Figure 1A). In the Wfs1-Tg2-CreERT2;Ai9 mouse the expression pattern of tdTomato reporter gene captures the original laminar expression pattern of Wfs1 gene in the cortex (Figure 1A). The tdTomato labeled cells constitute a large percentage of excitatory population in the mouse V1 layer 2/3, as revealed by double fluorescent in situ hybridization (dFISH) with probes for tdTomato and Gad1 expression (Madisen et al., 2010), indicating non-overlapping with Gad1(+) population (Figures 1B,C). To demonstrate that the tdTomato expressing Wfs1(+) cells are indeed neuronal cells we performed first an immunohistochemical (IHC) staining using NeuN antibody (a marker for neurons) against the native tdTomato fluorescence in a Wfs1(+) mouse and secondly a dFISH with probes for a pan-neuronal gene Synapsin I (Alexa 488) and tdTomato (Alexa 555) gene. The native tdTomato fluorescence from the cell bodies of Wfs1(+) neurons colocalized with the NeuN labeling in the IHC staining and so did the tdTomato and Synapsin I probes in the dFISH study (Figures 1D,E).
The Pvalb(+) – Ai9 labeled cells constitutes a scattered population in the mouse V1 (Figure 1F). In layer 2/3 these cells are also Gad1(+) (Figures 1F–H). Note that in deeper layers, especially layer 5, some Pvalb(+)-tdTomato cells are also Gad1(−), which is consistent with the known Pvalb expression pattern (Madisen et al., 2010). Since the focus of the present study is layer 2/3, the Pvalb(+)-tdTomato labeled cells are nearly all Gad1(+) interneurons.
Functional Analysis of the Individual Cell Population
A double-labeling approach, by genetic labeling of a cells in combination with bulk loading of a calcium dye, was used to analyze the functional tuning of Wfs1(+) neurons in the mouse visual cortex. Multiple Wfs1(+) cells were identified in a single frame when observed in the orange channel (605 ± 25 nm) at 950 nm excitation (Figure 2A, upper row, Figure A1C of Appendix top row, red cells). In the green channel (525 ± 25 nm) and at 800 nm excitation, cells labeled with OGB-1 included many Wfs1(+) cells (Figure 2A, lower row, Figure A1C of Appendix, second row, green cells). The baseline fluorescence signal was stable for the duration of the image acquisition (Figure 2B) which is a little over 16 min in this example. The mouse was presented with oriented moving gratings of 6 different angles and 12 directions (Figure 2C) at 0.05 cpd spatial frequency and 2 Hz temporal frequency. Most visually responsive cells reliably and repeatedly showed a significant change in calcium fluorescence compared to the baseline period to its preferred orientations (Figures 2C,D for the selected example cell). Different Wfs1(+) units showed preference for different orientation/direction angles (Figure A2A of Appendix).
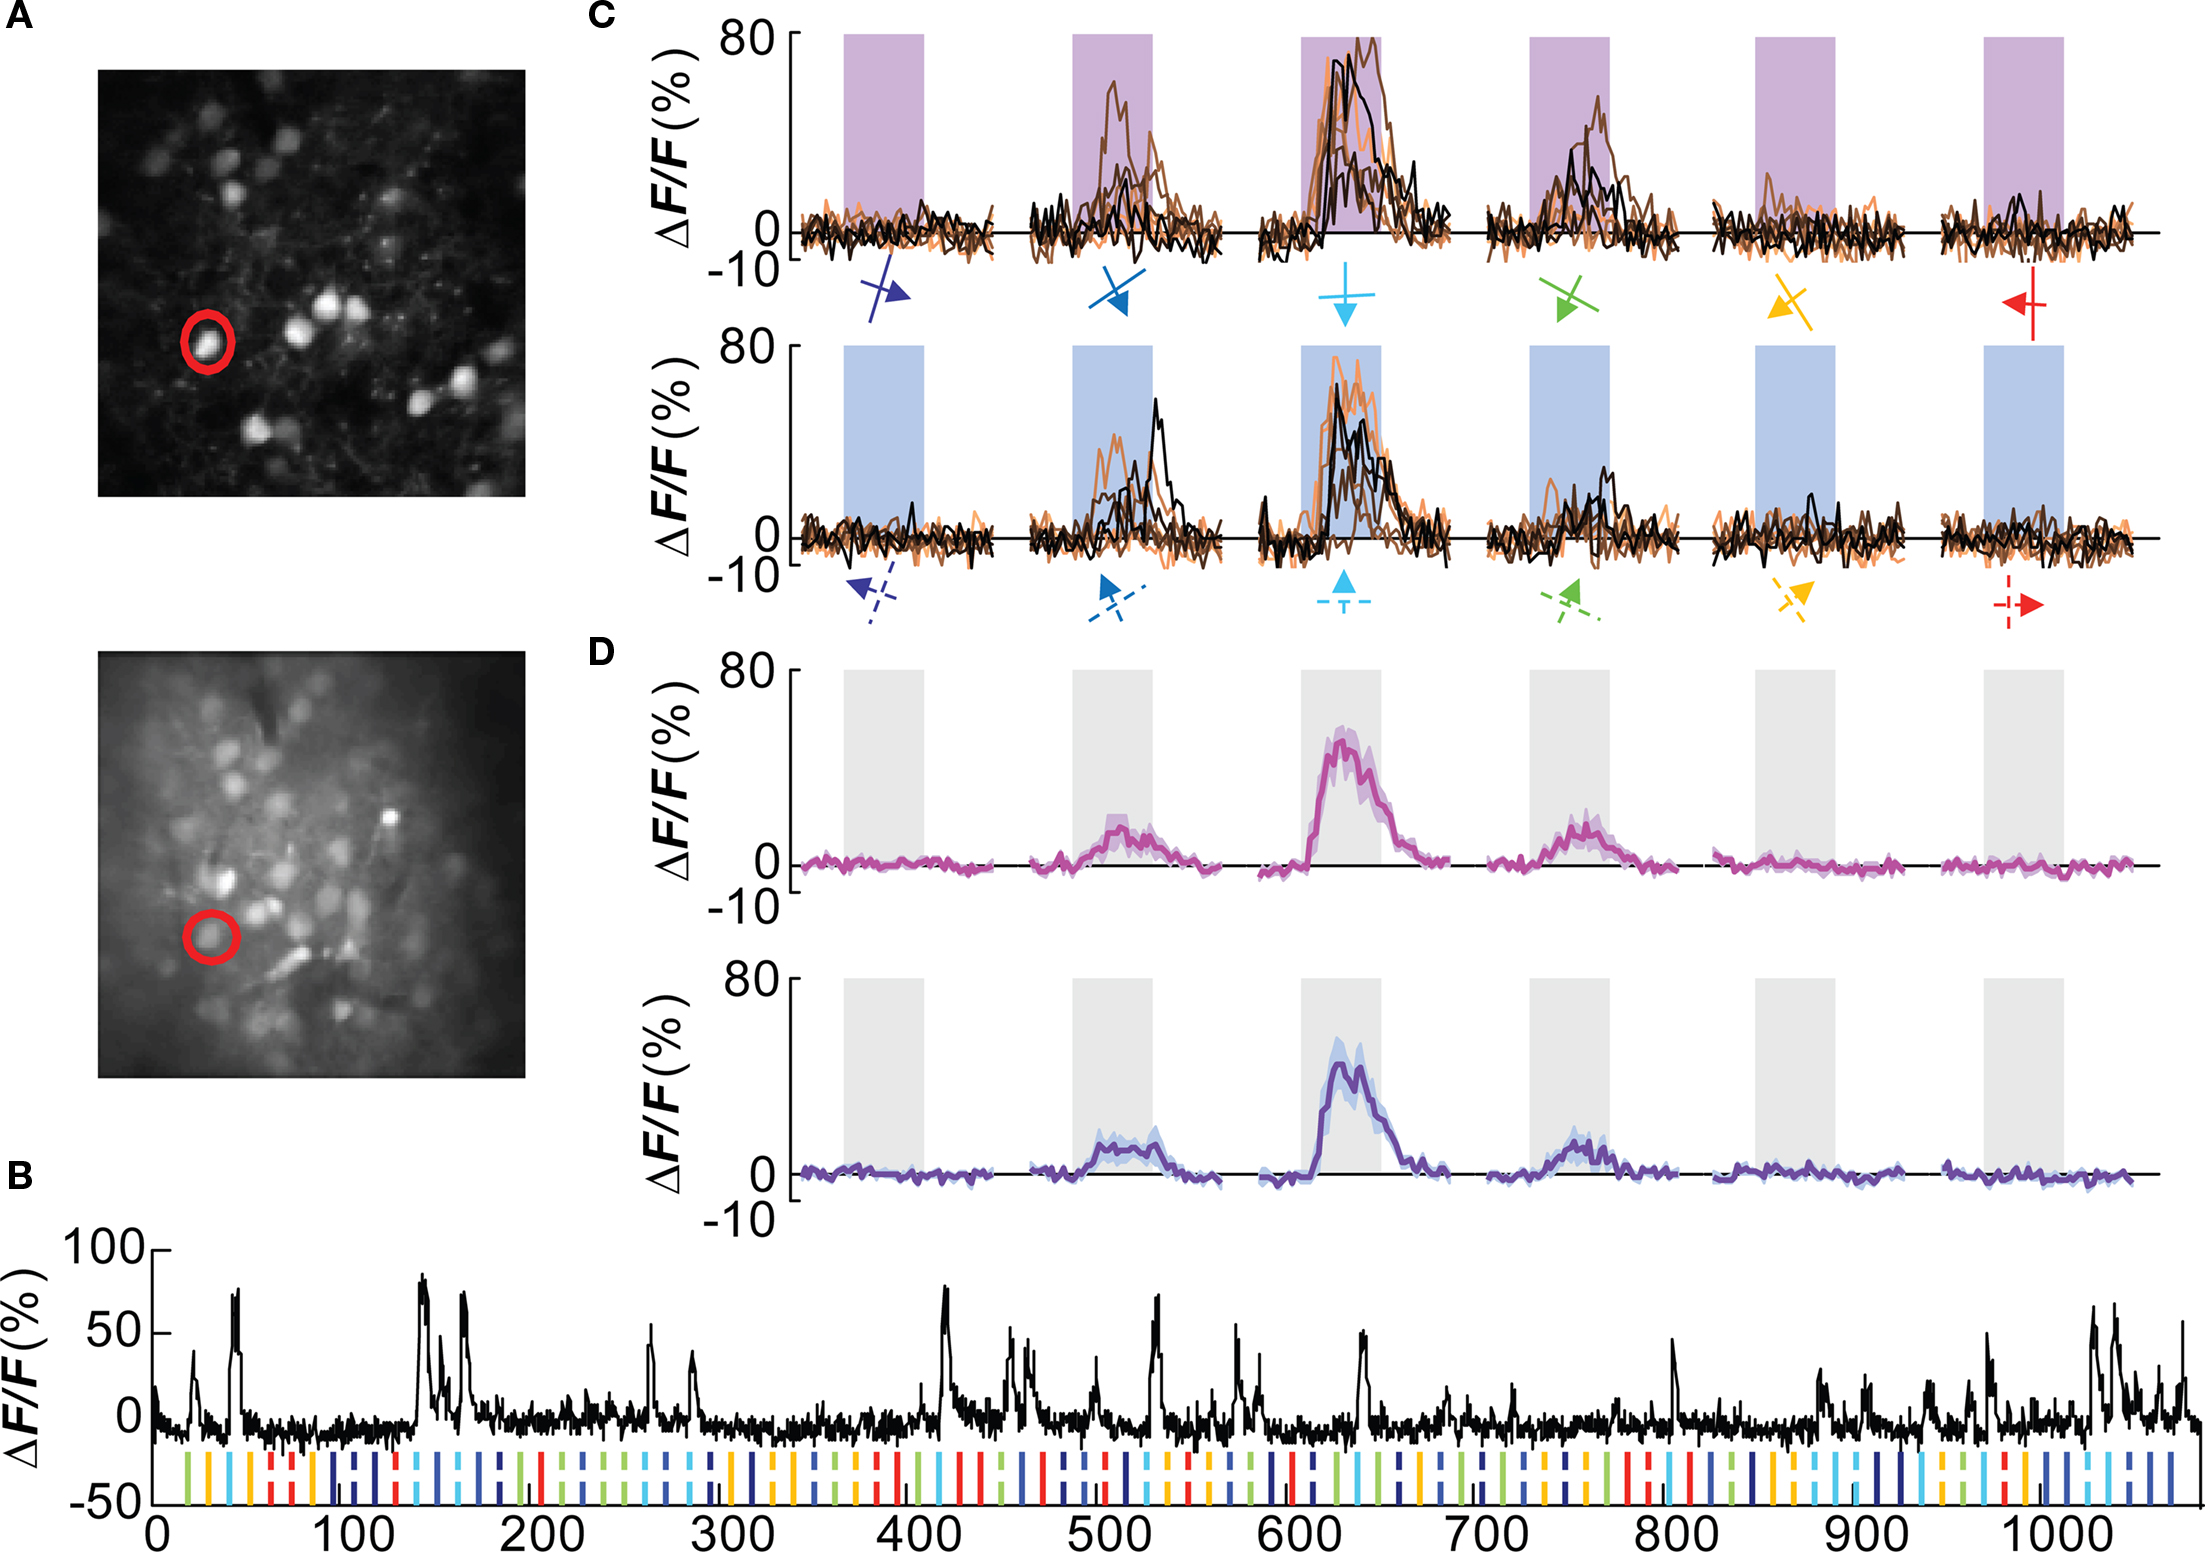
Figure 2. Orientation tuned Wfs1(+) cell. (A) Wfs1(+) tdTomato (+) cells (upper) and all OGB-1 filled cells (lower) within an imaged plane. The red circle indicates the double labeled (OGB and tdTomato) cell whose visually driven responses are shown in (B–D). (B) Calcium responses from the selected cell. Ticks at the bottom of the plot represent timing of various stimuli presented in this experiment (color coded for orientation angle). Solid ticks for gratings moving in one direction [see also (C) upper row] and dashed ticks for gratings moving in the opposite direction [see also (C) lower row]. (C) Plots in the upper row are change in fluorescence of the cell to eight presentations of six orientation gratings moving in one direction (shown by color coded arrows). Lower row is for corresponding opposite direction of motion (broken arrows). X-axis is time (in seconds). Shaded area represents time period of stimulus presentation. Stimulus was presented for 5 s. (D) Average of eight presentations in [(C) upper row in magenta and lower row in purple]. Shaded area around the mean represents mean ± SEM (n = 8 presentations).
Out of 923 cells that were labeled with OGB-1 that could be reliably imaged in 5 mice, 387 (∼42%) were tdTomato positive. The yield per mouse was 77 ± 13 (mean ± SEM, n = 5 mice) of Wfs1(+) cells and 107 ± 17 of other cells. Of these, 35 ± 10 (46%) Wfs1(+) cells and 51 ± 12 of other cells met the criterion (see Materials and Methods) for responses to visual stimuli. The yield of visually responsive cells may depend on the sampling of units included in the analysis and optimization of the visual field and the range of stimuli, i.e., number of orientation and directions presented. In the case of two-photon imaging, the number of neurons sampled is optimized for imaging at an order of magnitude greater than what would be sampled for electrophysiological recordings. This yield is consistent with a previous report from rat V1 (Ohki et al., 2005) and higher than in a report (34%) from mouse V1 (Sohya et al., 2007), employing similar methods and response criteria. Among cells that were visually modulated, 28 ± 8 (∼80%) of Wfs1(+) cells and 40 ± 10 of other cells showed preference to an orientation or direction angle. This is consistent with microelectrode studies (Niell and Stryker, 2008) in mouse V1, and higher than the previous reports from other two-photon imaging studies (Ohki et al., 2005; Sohya et al., 2007). It is possible that the higher yield of tuned responses in this study could be due to a combination of lower levels of isoflurane anesthesia and better sampling of the stimulus space (12 directions here versus 8 directions in previous studies).
We could successfully identify 67 Pvalb(+) cells in 5 Pvalb-2A-Cre; Ai9 mice used for this study (Figures 3A,B and Figure A1C of Appendix), which constitutes 13.5% of all OGB-1 filled cells, consistent with the percentage of Pvalb(+) in the cortex. Nearly 40% (27/67 cells) were visually responsive based on the same criteria used for Wfs1(+) cells. The yield of Pvalb(+) cells is consistent with the number of narrow-spiking neurons found with microelectrode recordings (Niell and Stryker, 2008) and the active Gad1(+) population in Sohya et al. (2007). The calcium transients (peak signal height from baseline) for these units were modest compared to the excitatory units (Figures 3B,C). Other studies have also reported modest calcium transients from Gad1(+) and Pvalb(+) inhibitory neurons (Sohya et al., 2007; Kerlin et al., 2010). Kerlin et al. compared the calcium dye and electrophysiological responses in simultaneous recording from Pvalb (+) – Cre mice where Pvalb(+) cells are labeled with tdTomato using the Cre-reporter mouse. In order to get the best orientation tuned responses from these units, 12 directions of moving gratings at 0.02 cpd spatial frequency was used, which is known from previous studies to be the peak spatial frequency for fast spiking interneurons in mouse V1 (Niell and Stryker, 2008). The orientation-direction tuning properties of these cells were analyzed using the same criterion as the Wfs1(+) cells. Most Pvalb(+) cells showed calcium transients in response to all presented angles and directions of motion (Figure 3D and Figure A2B of Appendix).
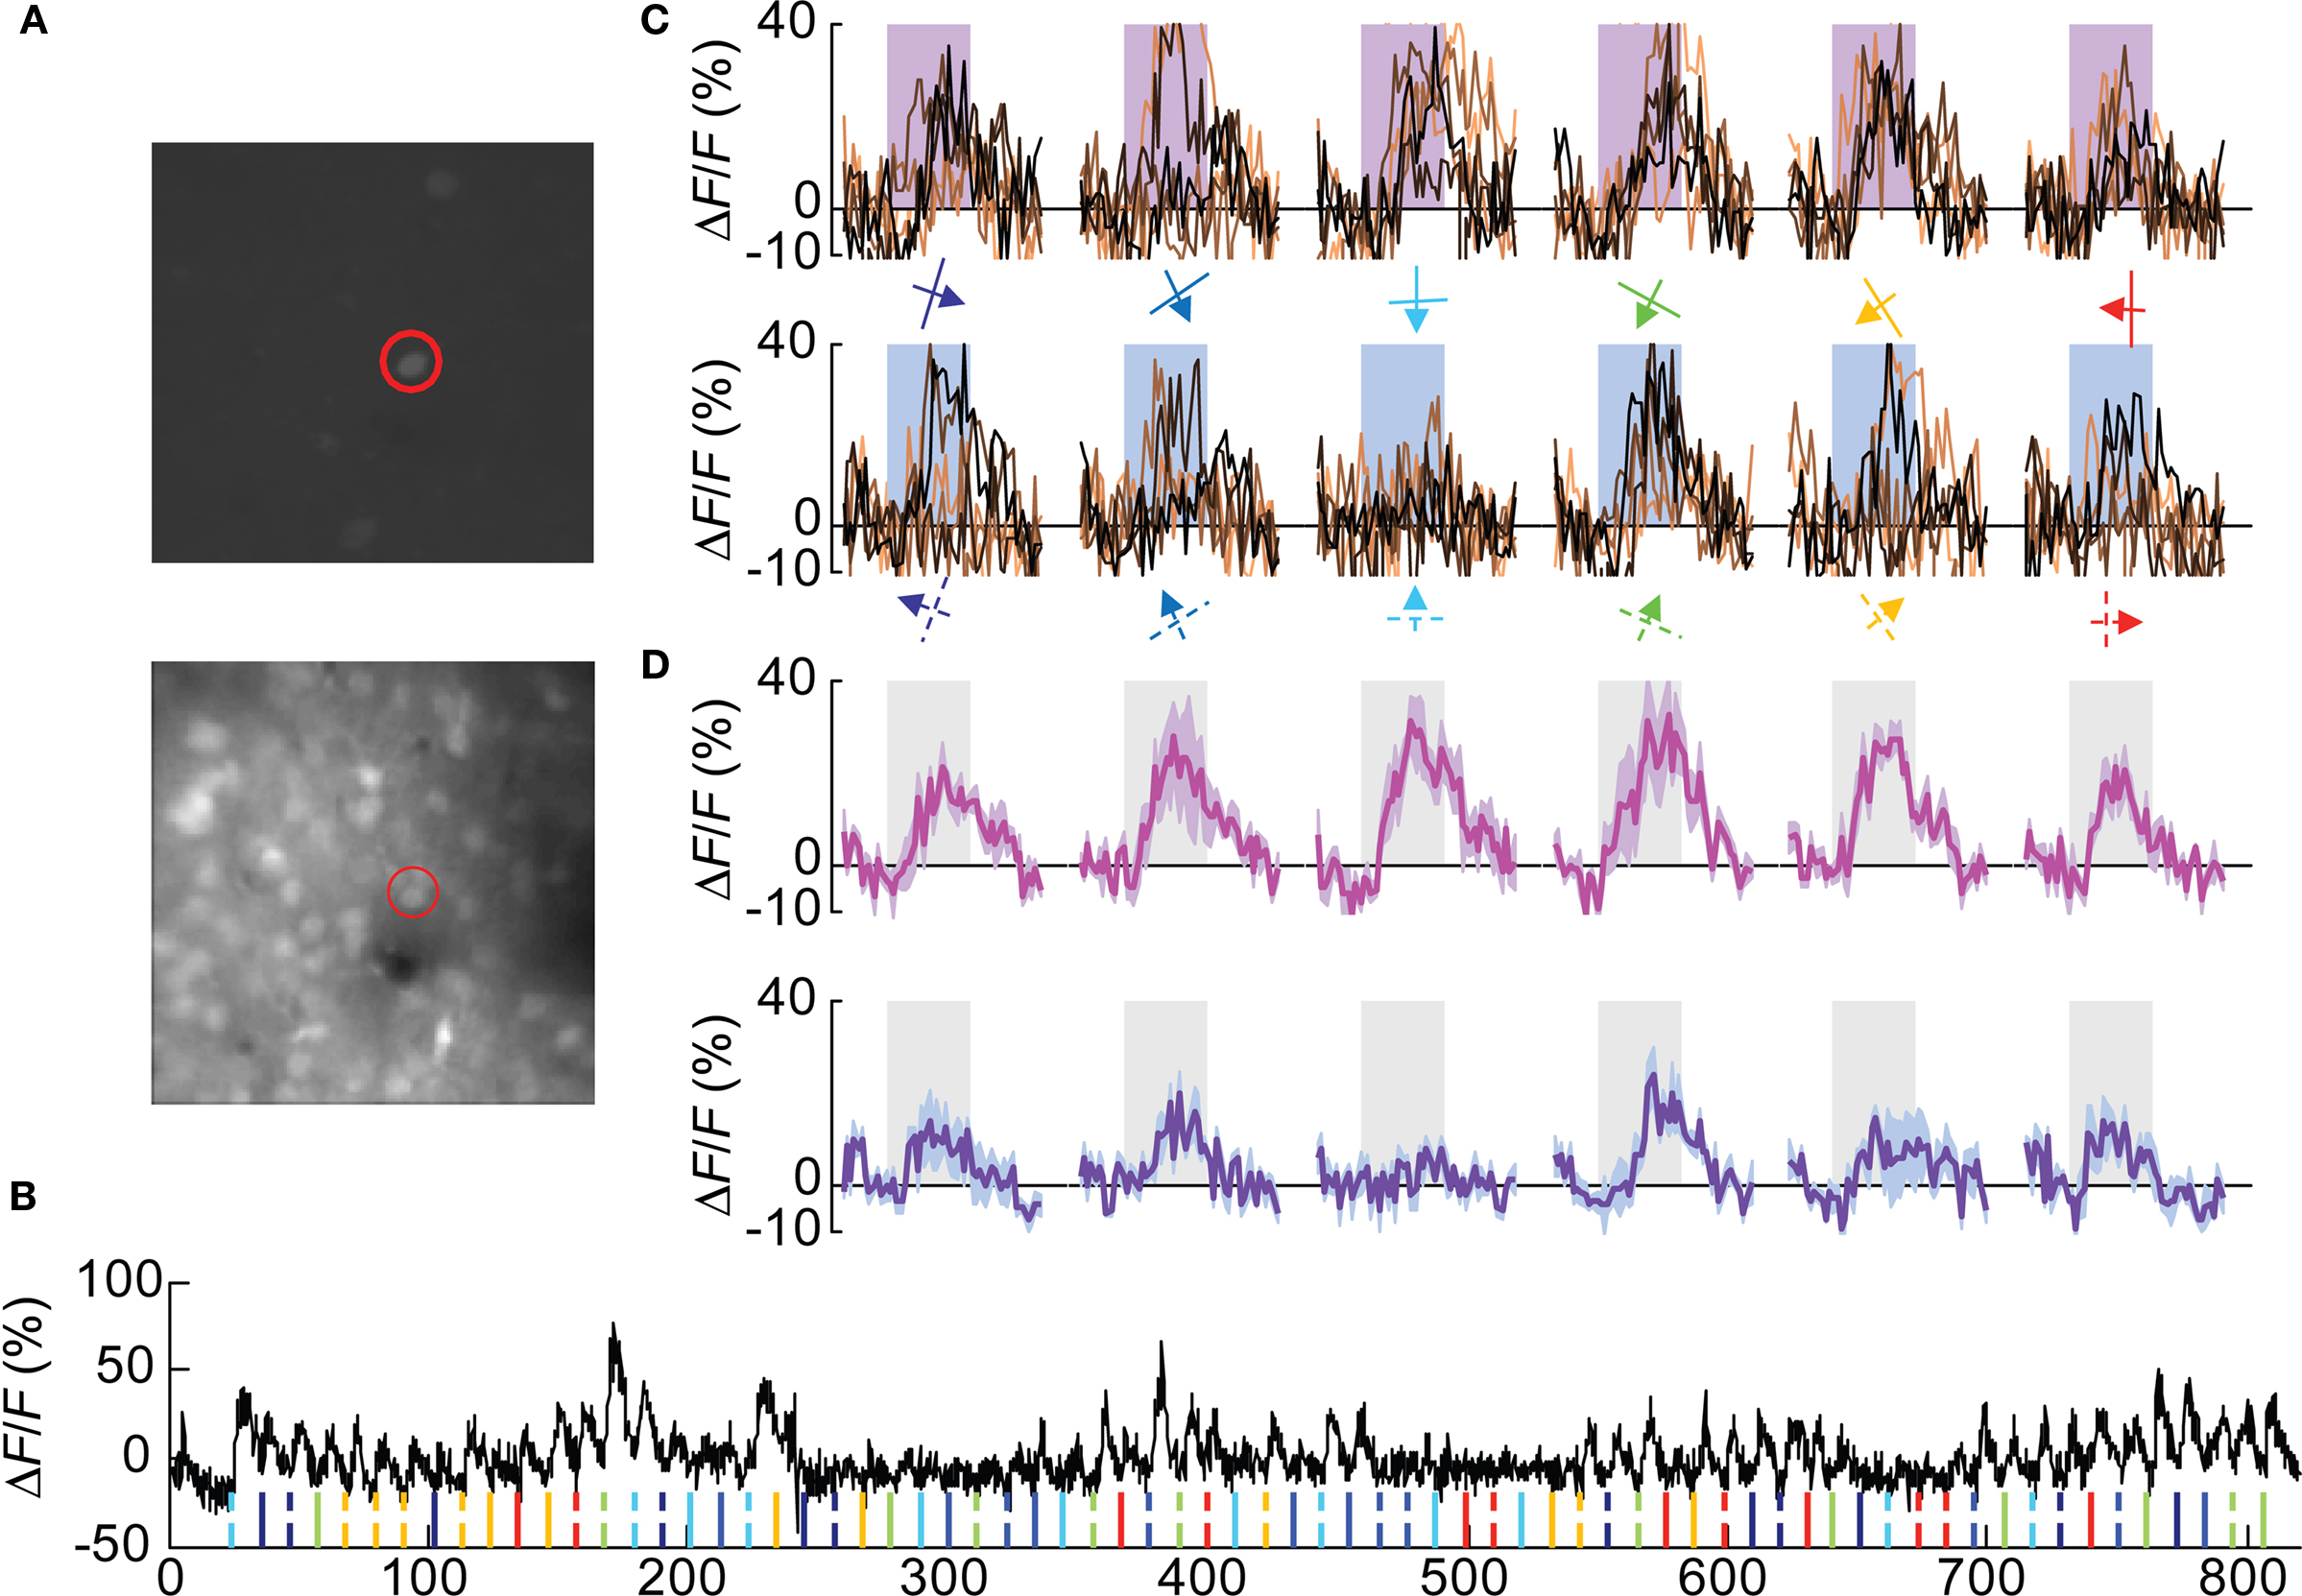
Figure 3. A Pvalb(+) cell showing poorly selective responses. (A) Cells labeled with tdTomato (top image) and all OGB-1 filled cells (lower image). The red circle indicates the double labeled (OGB and tdTomato) cell profiled in (B–D). (B) Calcium responses are shown from the selected cell. Ticks at the bottom of the plot represent timing of various stimuli (color coded for orientation angles) presented in this experiment. Solid ticks for gratings moving in one direction [see also (C) upper row] and dashed ticks for gratings moving in the opposite direction [see also (C) lower row]. (C) Plots in the upper row are change in fluorescence (ΔF/F) of the cell to eight presentations of six orientation gratings moving in one direction (shown by colored arrows). Lower row is for opposite direction of motion. Shaded rectangular bar represents time period of stimulus presentation (5 s). (D) Average of eight presentations in (C) (upper row in magenta and lower row in purple). Shaded area around the mean represent mean ± SEM (n = 8 presentations).
Comparative Analysis of Excitatory and Inhibitory Population
The OSI is a measure of strength of orientation tuning of cells. The OSI of Wfs1(+) and the simultaneously recorded but unidentified cells were well tuned to orientation angles (Figure 4). The median OSI for Wfs1(+) cells was 0.54 and that of unidentified cells was 0.62. In comparison, the Pvalb(+) cells showed low median OSI values of 0.33. The median OSI of the neuropil adjacent to the Pvalb(+) cells was 0.19, significantly lower than the Pvalb(+) cells. Though Pvalb(+) cells show poor selectivity their selectivity is intermediate between the largely untuned neuropil and the excitatory population.
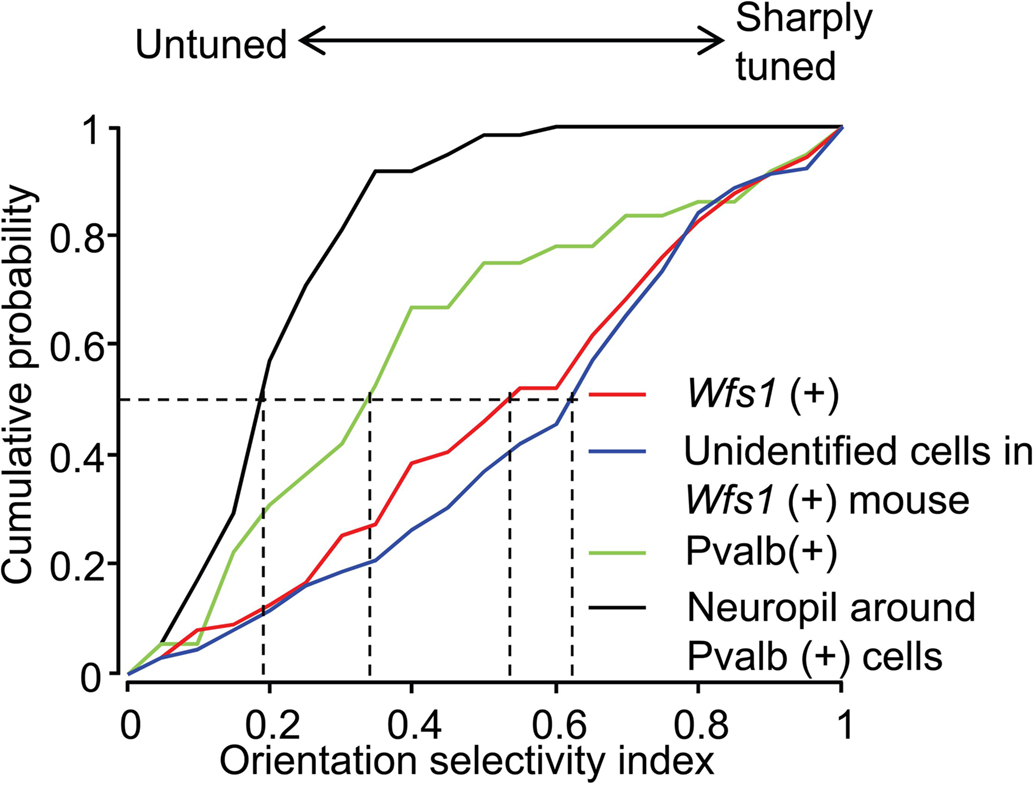
Figure 4. Comparison of orientation selectivity of Wfs1(+) and Pvalb(+) cell population. Cumulative probability distribution of the orientation selectivity index (OSI) of Wfs1(+) cells, unidentified cells, Pvalb(+) cells, and the neuropil near the Pvalb(+) cells is plotted. Dropped vertical dotted lines represent the median of each population.
Functional Map and Spatial Distribution of Orientation-Direction Selectivity
In the mouse V1 there is no relationship in the orientation preferences of nearby excitatory units, i.e., nearby neurons could show opposite orientation preference. Therefore, the spatial map of orientation preferences shows a “salt and pepper” arrangement as compared to “pinwheel” arrangement in carnivores and primates (Ohki et al., 2005). In order to demonstrate the spatial relationship in the orientation selectivity of two Wfs1(+) cells in comparison to that of the Wfs1(+) cell with unidentified cells, we superimposed a color coded orientation angle preference map of cells onto the anatomical map (Figure 5A). The spatial distribution of preferred orientations of both Wfs1(+) cells and their unidentified neurons was random and non-clustered as has been shown before for V1 neurons in the rats.
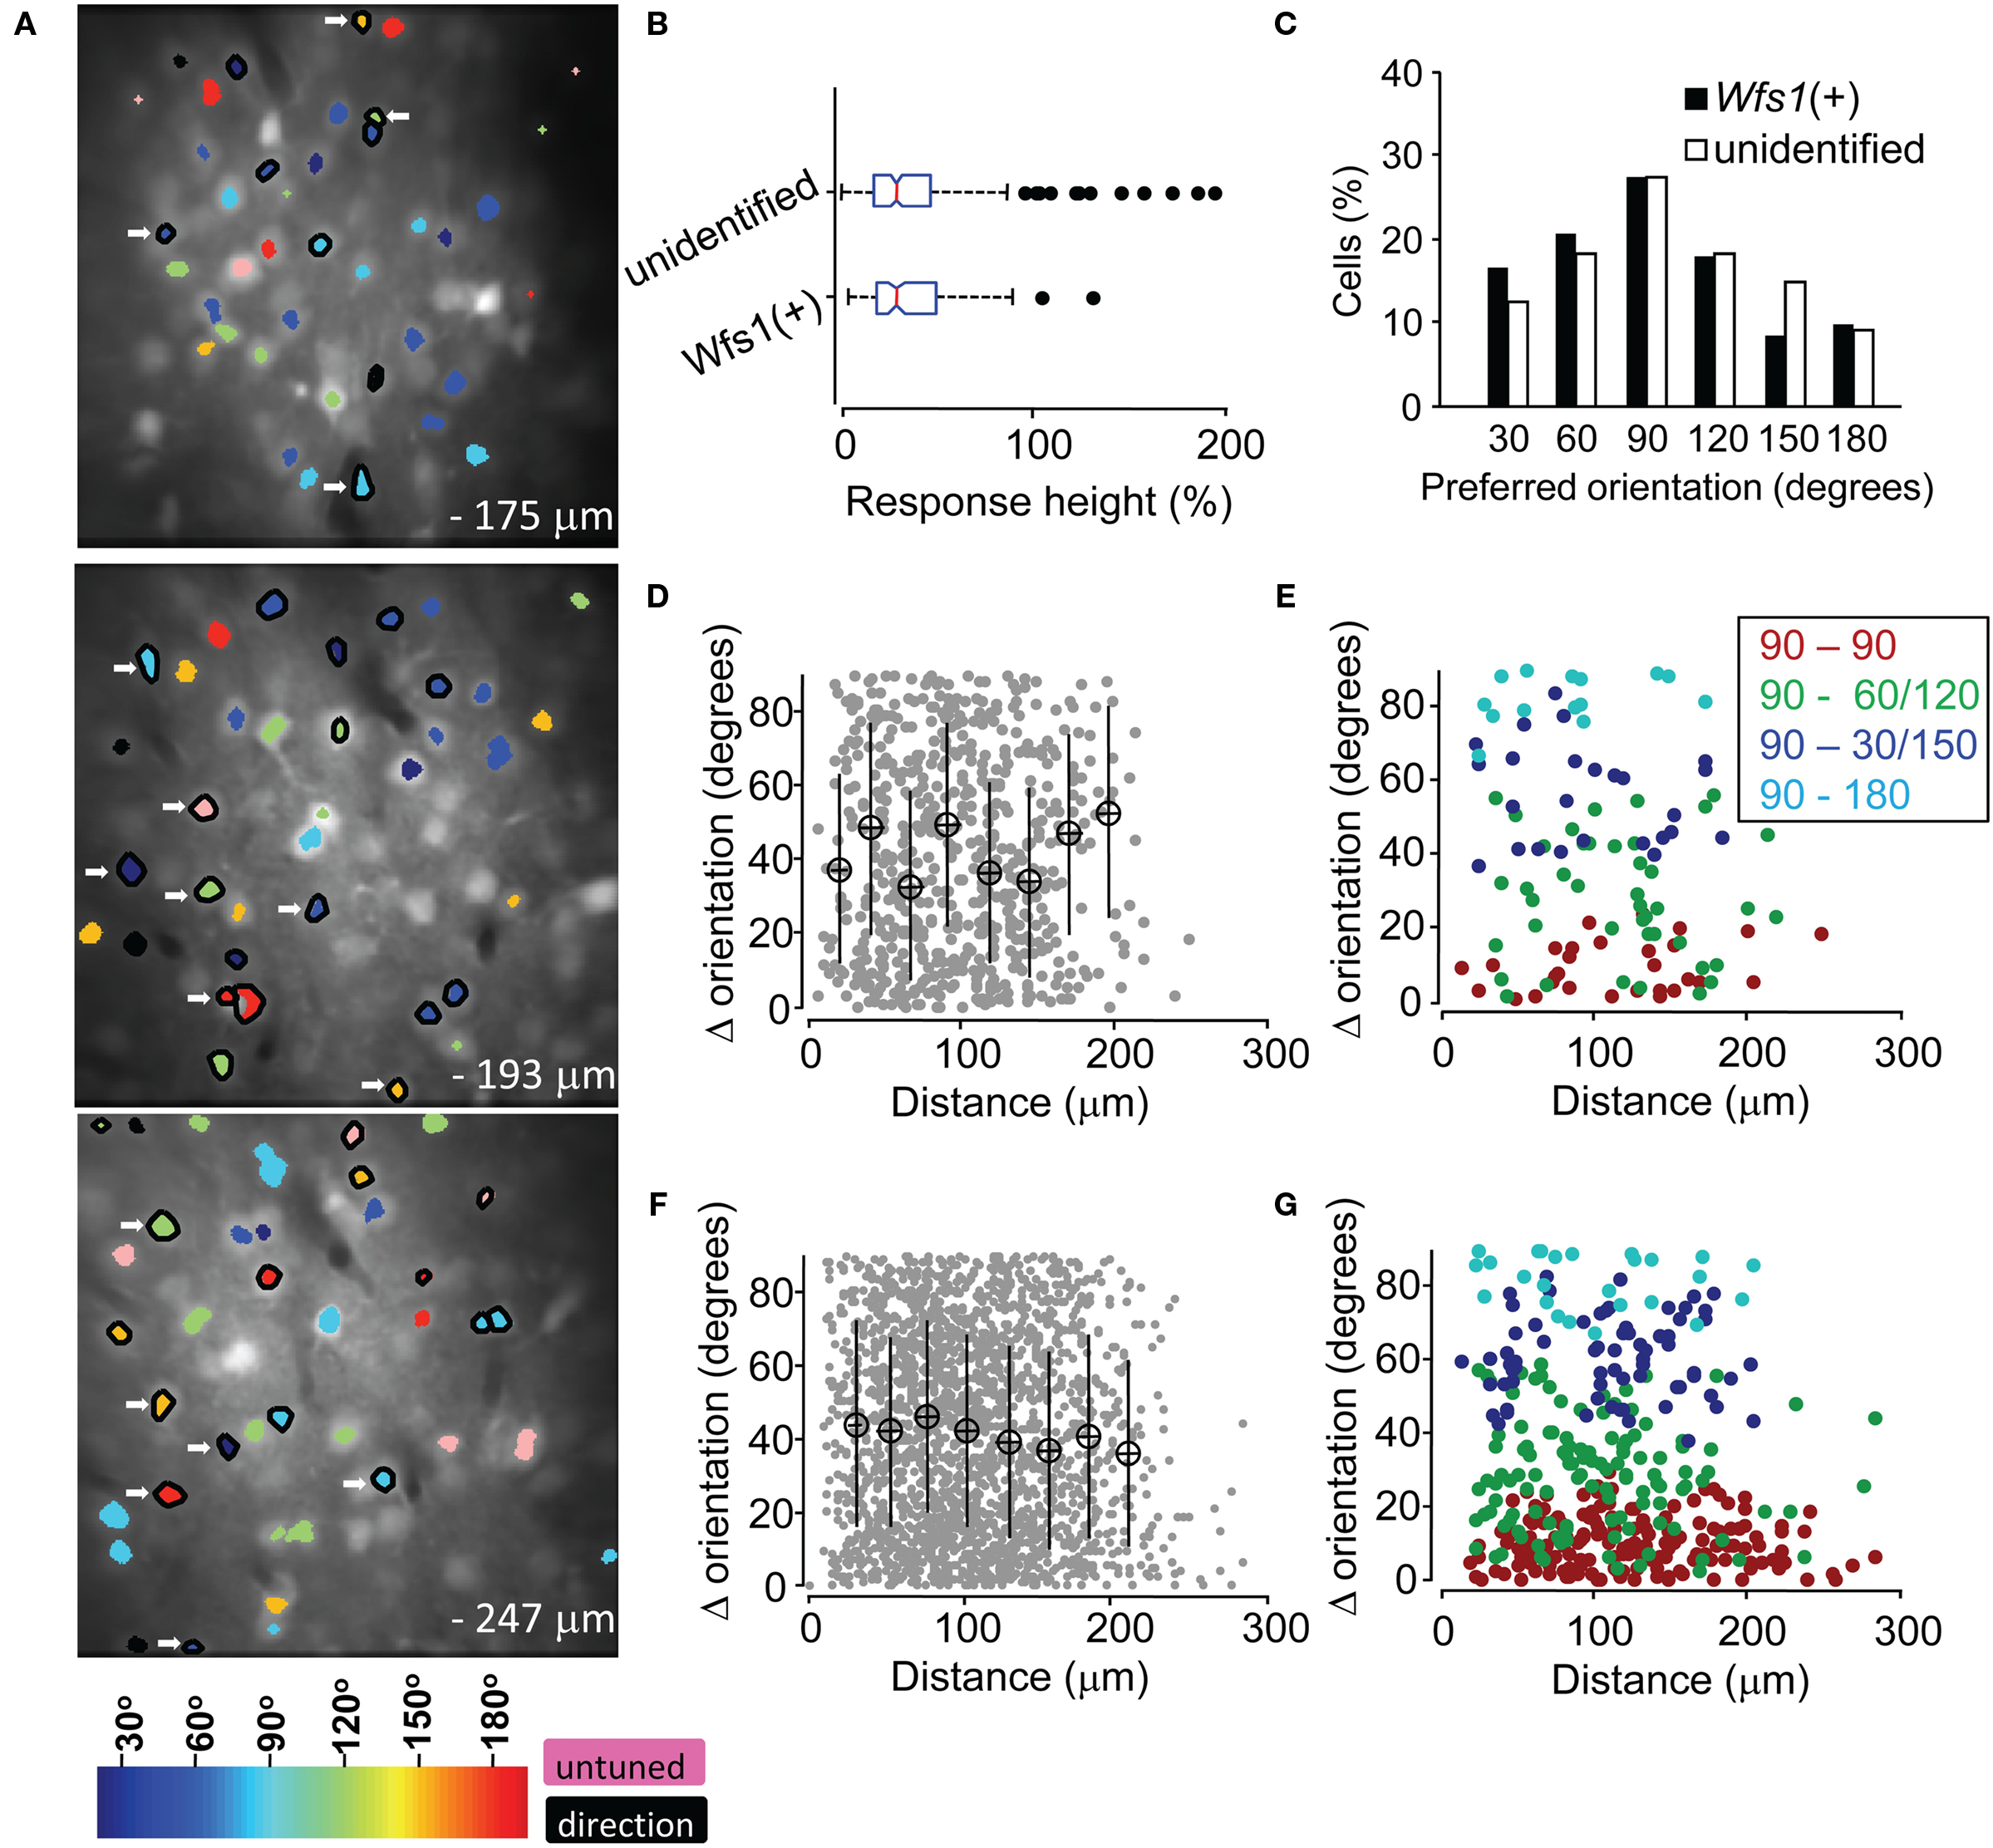
Figure 5. Functional map and spatial distribution of orientation/direction selectivity. (A) Spatial orientation and direction selectivity map of Wfs1(+) cells shown (black polygon surrounding the ROI) and rest of the visually responsive OGB-1 filled cells at three different depths within a single mouse V1. Colors, as shown in the color map at the bottom, represent preferred orientation angles. Cells with OSI < 0.2 were assigned as untuned. (B) Comparison of the distribution of calcium transients from sharply oriented (OSI > 0.54) tdTomato labeled and unidentified cells on repeated presentation of their preferred orientations. Box plots show median (vertical red line), SE (notch), upper and lower quartile (extent of the box), next 1.5 quartile (whiskers), and outliers (black dots). (C) Histogram of preferred orientation angle of Wfs1(+) and unidentified cells (90° for horizontally oriented grating moving up or down). (D) Difference in orientation angle preference between pairs of Wfs1(+) cells (data pooled from four experimental mice). Mean ± SD of distance and orientation angle difference within a 20-μm bin is plotted. (E) Difference in orientation angle preference between pairs of Wfs1(+) cells sub-categorized by the bin center in (C). Legend denotes pairwise comparison between cells according to their preferred orientations. (F) Difference in orientation angle preference between pairs of Wfs1(+) cells and unidentified cells [data pooled from four experimental mice also shown in (D)]. Mean ± SD of distance and orientation angle difference within a 20-μm bin is plotted. (G) Difference in preferred angle between pairs of Wfs1(+) cells and unidentified cells sub-categorized by the bin center in (C). Legend denotes pairwise comparison between cells according to their preferred orientations.
The transgenically labeled Wfs1(+) neurons express high level of tdTomato protein (Madisen et al., 2010). In this study, the Wfs1(+) cells and their near neighbors showed robust visually driven responses. The calcium transients from the labeled and unlabeled cells are a function of spiking activity which may indicate the functional viability of the cells. A similar distribution of peak response heights (R in % ΔF/F) from the two populations would indicate the similarity in their ability to generate action potentials and integrate orientation specific information. Therefore, we compared the distribution of “R” across the Wfs1(+) and non-genetically labeled cells. In order to control for the variability in OGB-1 dye filling across different days of experiments, the analysis was restricted to within five image stacks collected from a single Wfs1(+) mouse (functional map shown in Figure 5A). In addition, the analysis was performed with cells within a 132.5 μm × 132.5 μm area, centered at the region where OGB-1 fluorescence was maximal (through visual survey). Only cells with an OSI above the median OSI for Wfs1(+) and unidentified neurons (OSI > 0.54, Figure 4) were selected. Calcium transients only for repeated presentation of the most preferred stimuli were considered for the analysis. The distribution of calcium transients for this highly selected Wfs1(+) and unidentified cell samples was not significantly different (Figure 5B, P = 0.53, unpaired t-test). Other categories like OSI less than median OSI of the population, analysis regions of larger (200 μm × 200 μm) and smaller (75 μm × 75 μm) areas and for within images collected from two other mice were also analyzed and gave the same results (data not shown).
In addition to the visualization of the orientation preference map, we made a comparison of pairwise difference in preferred angle over distance between two given cells. For both Wfs1(+) – Wfs1(+) (i.e., transgene labeled–labeled cell pairs) and Wfs1(+) – unidentified (transgene labeled – unlabeled) cell pairs there was no significant correlation between the distance between two cells and the difference in their preferred angles (Figures 5D,F). The Pearson correlation coefficient (R) for individual mice (n = 4) ranged from −0.2 to 0.04 and was insignificant (P > 0.13) for both labeled–labeled and labeled–unlabeled pairs. This indicates the spatial heterogeneity in orientation preference between nearby cells in mice, consistent with what has been seen in rats (Ohki et al., 2005). The lack of difference between the labeled–labeled and labeled–unlabeled cell pairs suggests that the Wfs1(+) cells might be a random subset of the general population of excitatory neurons.
We found that a majority of imaged neurons were selective for a horizontally oriented grating (90°), while just ∼10% of the cells showed preference to a vertically oriented grating (180°, Figure 5C, data pooled across the five mice). The Wfs1(+) and the unidentified cells both showed this preference. Intrinsic imaging reports in mice have indicated that horizontal bars or gratings strongly drive the V1 (Cang et al., 2005). This activity could be due to larger number of cells encoding horizontally oriented gratings instead of larger responses from horizontally tuned cells. In order to determine the pairwise spatial relationship between horizontally tuned labeled cells and other labeled and unlabeled cells, a pairwise comparison was made. The difference in orientation preference angles and distance between horizontally tuned Wfs1(+) neurons with other Wfs1(+) neurons and unidentified neurons was made (Figures 5E,G). Each cell in this analysis was categorized in bins that were centered at 90° (horizontal) to 180° (vertical) orientation angle. We found no spatial clustering of horizontally tuned cells for within and across labeled and unidentified cells. The Pearson correlation coefficients for each of the four categories in Figures 5E,G were not significant.
Spatial Frequency Tuning of Wfs1(+) Cells
In microelectrode studies, the excitatory cell population in layer 2/3 exhibited a wider distribution across various octaves of spatial frequency with a median of 0.04 cpd (Niell and Stryker, 2008). We inquired if the Wfs1(+) cells represent the layer 2/3 excitatory neurons exhibiting a wide range of spatial frequency tuning, or a functionally distinct subset with selective preference of spatial frequencies. In order to compare the spatial frequency tuning of Wfs1(+) cells with other excitatory population, spatial tuning properties were profiled using calcium dye imaging. We used new set of Wfs1(+) mice for this study. Three moving gratings at 120° apart in orientation angle were presented at six different spatial frequencies of continuously varying octaves (Table 1, second row; Figures A3A,C,D of Appendix showing data for an example Wfs1(+) cell) along with a full field flicker (Table 1, third row; Figure A3E of Appendix; Kerlin et al., 2010). A cell was classified as tuned to low pass spatial frequency if it showed a significant visual response to full field flicker stimulus with a response peak twice as high as response to grating stimuli at the peak spatial frequencies.
In order to ascertain the orientation selectivity of the cells, moving gratings at 12 orientation-direction pairs at spatial frequency of 0.04 cpd were also presented within the same experiment (Table 1, first row; Figures 6A,B, Figure A3B of Appendix). Nearly 80% of the visually responsive cells (191/240 Wfs1(+) and 249/340 unidentified cells) were orientation selective at 0.04 cpd spatial frequency. We binned the preferred orientation of the cell into three bins centered at the three directions chosen for spatial frequency mapping.
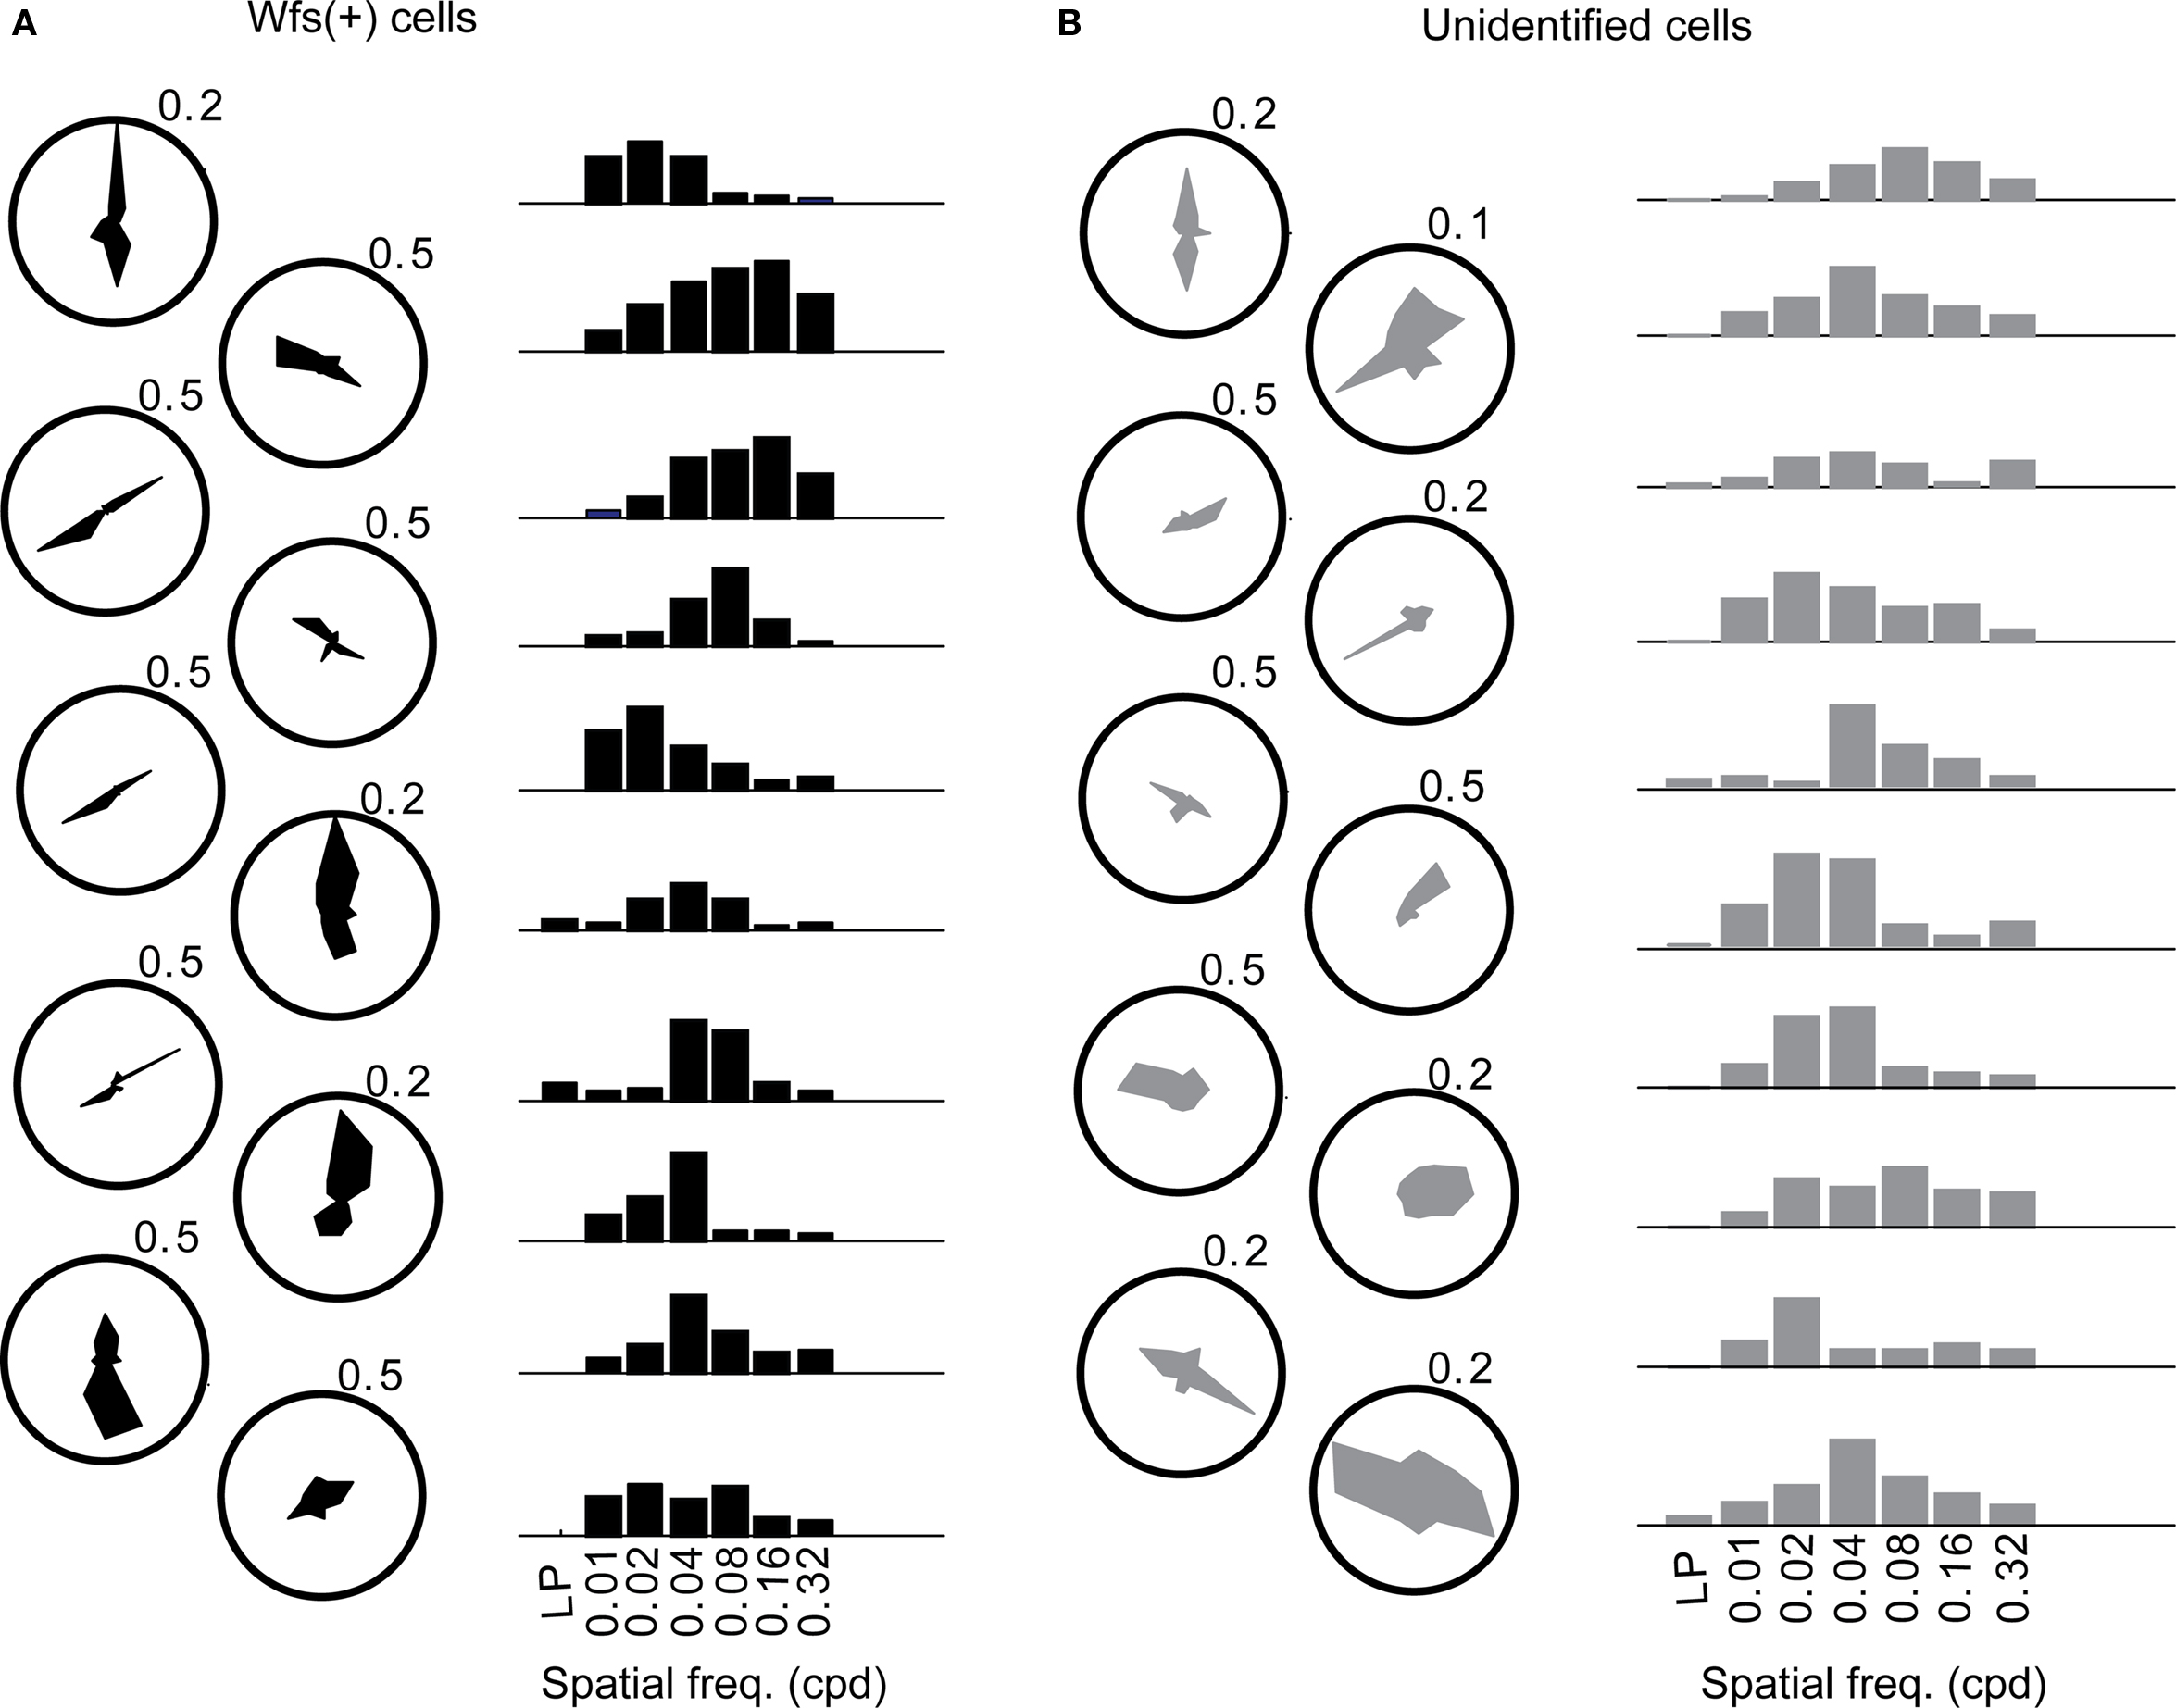
Figure 6. The orientation tuning (polar plots) and normalized responses to various spatial frequencies presented at the preferred orientation (bar plots) of (A) 10 Wfs1(+) (shown in black) and (B) 10 unidentified neurons (gray). Values against polar plots indicate the maximum scale of the polar plot in fraction ΔF/F.
In order to find the preferred spatial frequency, a single Gaussian function was fitted to the peak height of the mean calcium response at each of the presented spatial frequencies for each of the three directions [Figure A3F of Appendix for the example Wfs1(+) cell]. The peak of the Gaussian fit for the preferred direction of the cell was chosen as the preferred spatial frequency of the cell (peak of red curve in Figure A3F of Appendix). The cells which did not show significant orientation preference to 12 directed gratings at 0.04 cpd [49/240 Wfs1(+) and 91/340 unidentified cells] were eliminated from the analysis.
The distribution of preferred spatial frequencies of the Wfs1(+) neurons and unidentified cells showed no significant difference (example cells in Figures 6A,B and 7A,B). The medians of preferred spatial frequencies for Wfs1(+) and unidentified neurons were both 0.04 cpd. The Wfs1(+) neurons had a broad distribution across the six tested octaves similar to the unidentified cells representing the general layer 2/3 excitatory population in their spatial frequency tuning. The median preferred spatial frequencies of both groups of cells were identical to that of the layer 2/3 excitatory neurons found in the microelectrode study (Niell and Stryker, 2008).
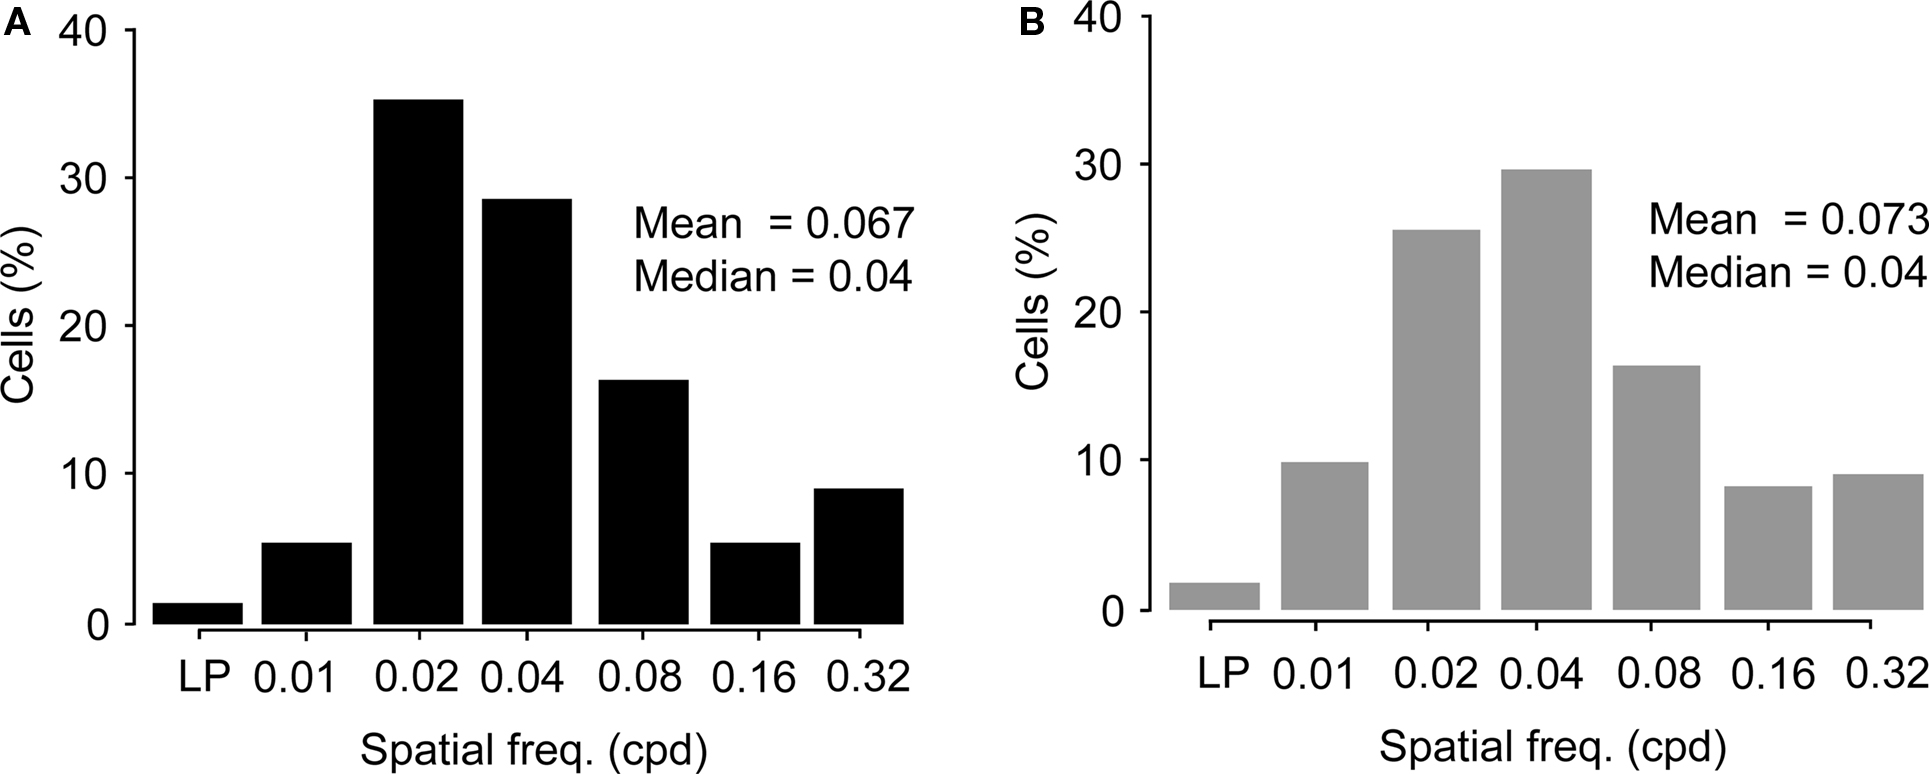
Figure 7. Comparison of preferred spatial frequencies. (A) Distribution of spatial frequency tunings of Wfs1(+) cells (n = 191) across the six tested octaves. LP, low pass tuned cells. (B) Distribution of spatial frequency tunings of unidentified cells (n = 249) across the six tested octaves. LP, low pass tuned cells.
Discussion
Transgenic Mouse Tools and the Study of Cortical Cell Types
We report here the use of a robust and ubiquitous reporter system for Cre-expression in combination with in vivo calcium dye imaging to study the activities of specific cell types in two different Cre mouse lines. The utility of our technique is underscored by several recent studies that used 2-photon calcium imaging to address the visual response properties of inhibitory cells, which came to potentially conflicting results (Sohya et al., 2007; Kerlin et al., 2010; Runyan et al., 2010). Several aspects of our system could make such studies more robust and reproducible across laboratories.
First, we compared the selectivity of well identified excitatory and inhibitory populations that were transgenically labeled using the same reporter mouse, unlike other previous studies (Sohya et al., 2007; Kerlin et al., 2010; Runyan et al., 2010). Second, the use of mouse reporter compared to viral reporter offers a greater ease in surgical preparation for calcium imaging and an even expression of label within all Cre-expressing cells, without the confound of viral tropism. Although, viral reporters are a viable alternative and allow for a localized expression in a brain region where region specific Cre-expression is not available or in other instances offer methodological advantages such as trans-synaptic labeling across neurons (Marshel et al., 2010). Our Cre-reporter mouse system provides much-desired reliability and reproducibility in targeting a subpopulation. Finally, the designs of the two Cre lines and the tdTomato reporter line that we have used do not disrupt the endogenous genes unlike the Gad67-GFP line where the GFP gene is inserted to replace a copy of Gad67 gene resulting in reduced GABAergic synaptic transmission (Runyan et al., 2010), A further advantage of the reporter mouse strategy is that it allows the straightforward extension to drive expression of various genetic tools in the population of labeled cells, such as light-activated activating or inhibiting channels (Zhang et al., 2007), genetically encoded calcium indicators (GECIs) like GCamp3 (Tian et al., 2009) and Y.C3.6 (Andermann et al., 2010), and receptors for toxins in order to perform cell ablations (Kobayakawa et al., 2007).
Recent studies have demonstrated the role that different cell populations play in development and cortical plasticity (Gandhi et al., 2008; Yazaki-Sugiyama et al., 2009).The selectivity and early onset expression of Cre to label specific cell classes can be used for longitudinal studies over developmentally important times, e.g., postnatal critical period of cortical plasticity (Antonini et al., 1999). For example, the superficial Wfs1(+) and Pvalb(+) populations can be studied using calcium dye imaging for functional plasticity across development (Garaschuk et al., 2006; Gandhi et al., 2008; Yazaki-Sugiyama et al., 2009).
Comparison with Previous Findings in Mouse V1
Our characterization of layer 2/3 cells corresponds well with previous studies of the upper layers of mouse V1. The percentage of orientation tuned cells among visually responsive V1 neurons is comparable to the yield with microelectrode recordings (Niell and Stryker, 2008). Furthermore, the median spatial frequency of the Wfs1(+) and unidentified cells was 0.04 cpd, consistent with the study employing microelectrodes (Niell and Stryker, 2008).
A previous extracellular study showed that narrow-spiking units (putative inhibitory cells) had much poorer orientation selectivity overall than broad-spiking units (putative excitatory cells; Niell and Stryker, 2008). Our results from the Pvalb and Wfs1 cell populations are consistent with this finding. Although there was some diversity of tuning in both populations, the Pvalb(+) population as a whole had significantly poorer orientation selectivity than the excitatory Wfs1(+) population, yet more selective than the largely untuned neuropil. In comparison with two recent imaging studies of Pvalb(+) cells, our finding of 22% of the Pvalb(+) cells with OSI > 0.5 appears to be slightly higher than Kerlin et al. (2010), but unlike Runyan et al. (2010) the Pvalb(+) population had a significantly lower OSI than the excitatory cells.
The small population of well-tuned Pvalb(+) cells that was captured in our study of transgenic mice (Figure A2B of Appendix), may be due to diversity in the morphological, physiological, and laminar distribution within Pvalb(+) cell population as previously suggested (Markram et al., 2004). A comprehensive characterization of Pvalb(+) cell population would involve studying function using combination of targeted patch recording in mice labeled with the Ai9 tdTomato reporter followed by morphological reconstruction or intersectional genetic strategies that allow identification of cell type using two or more genetic markers (Miyoshi and Fishell, 2006). Likewise, although our study does not show evidence for functional differences within the excitatory population, there may still exist genetic and projectional segregation within the Wfs1(+) cell population (Kasper et al., 1994). The use of anterograde and retrograde labeling achieved by viral-based synaptic connectivity labels can elucidate the spatial partners of the genetically identified cell types and their tuning properties (Yoshimura et al., 2005; Wickersham et al., 2007). Furthermore, we cannot exclude the possibility that Wfs1(+) cells have distinct properties for other visual stimuli that were not tested in this study.
Layer 2/3 neurons are more selective for orientation than the deeper cortical layers (Mangini and Pearlman, 1980; Metin et al., 1988; Niell and Stryker, 2008), making Wfs1(+) cells, as a genetically labeled, highly selective cell population appealing for studying the role of layer 2/3 neurons in visual tasks (Andermann et al., 2010). The Pvalb(+) cell population is a major subclass of inhibitory neurons in the mouse cortex. In our study these cells showed a visually evoked response profile comparable to what has been reported before for a pan-interneuronal labeling Gad67-GFP mouse (Sohya et al., 2007). In order to differentiate between the response profiles of interneuron subtypes, there is a need for other knock-in Cre-transgenics such as Sst and Vip neurons, and other cell classes as they emerge through ongoing studies.
Conflict of Interest Statement
The authors declare that the research was conducted in the absence of any commercial or financial relationships that could be construed as a potential conflict of interest.
Acknowledgments
We are grateful to Michael Stryker, Cris Niell, Damon Page, and Michael Hawrylycz for their comments on the manuscript. Cris Niell provided valuable help with discussion of the data. Sunil Gandhi and Cris Niell provided valuable technical help on experiments and analysis. We wish to thank all the teams and their past and present members at the Allen Institute for their professional support. In particular, we are greatly thankful to Theresa Zwingman for generating the Wfs1-Tg2-CreERT2 mice, and Marty Mortrud, Nick Dee, and Jolene Kidney for technical assistance. The authors thank the Allen Institute for Brain Science founders, Paul G. Allen and Jody Allen, for their vision, encouragement and support.
References
Andermann, M. L., Kerlin, A. M., and Reid, R. C. (2010). Chronic cellular imaging of mouse visual cortex during operant behavior and passive viewing. Front. Cell Neurosci. 4:3. doi: 10.3389/fncel.2010.00003
Antonini, A., Fagiolini, M., and Stryker, M. P. (1999). Anatomical correlates of functional plasticity in mouse visual cortex. J. Neurosci. 19, 4388–4406.
Ascoli, G. A., Alonso-Nanclares, L., Anderson, S. A., Barrionuevo, G., Benavides-Piccione, R., Burkhalter, A., Buzsaki, G., Cauli, B., Defelipe, J., Fairen, A., Feldmeyer, D., Fishell, G., Fregnac, Y., Freund, T. F., Gardner, D., Gardner, E. P., Goldberg, J. H., Helmstaedter, M., Hestrin, S., Karube, F., Kisvarday, Z. F., Lambolez, B., Lewis, D. A., Marin, O., Markram, H., Munoz, A., Packer, A., Petersen, C. C., Rockland, K. S., Rossier, J., Rudy, B., Somogyi, P., Staiger, J. F., Tamas, G., Thomson, A. M., Toledo-Rodriguez, M., Wang, Y., West, D. C., and Yuste, R. (2008). Petilla terminology: nomenclature of features of GABAergic interneurons of the cerebral cortex. Nat. Rev. Neurosci. 9, 557–568.
Cang, J., Renteria, R. C., Kaneko, M., Liu, X., Copenhagen, D. R., and Stryker, M. P. (2005). Development of precise maps in visual cortex requires patterned spontaneous activity in the retina. Neuron 48, 797–809.
Chattopadhyaya, B., Di Cristo, G., Higashiyama, H., Knott, G. W., Kuhlman, S. J., Welker, E., and Huang, Z. J. (2004). Experience and activity- dependent maturation of perisomatic GABAergic innervation in primary visual cortex during a postnatal critical period. J. Neurosci. 24, 9598–9611.
Cruikshank, S. J., Urabe, H., Nurmikko, A. V., and Connors, B. W. (2010). Pathway-specific feedforward circuits between thalamus and neocortex revealed by selective optical stimulation of axons. Neuron 65, 230–245.
Drager, U. C. (1975). Receptive fields of single cells and topography in mouse visual cortex. J. Comp. Neurol. 160, 269–290.
Ferster, D., and Miller, K. D. (2000). Neural mechanisms of orientation selectivity in the visual cortex. Annu. Rev. Neurosci. 23, 441–471.
Gandhi, S. P., Yanagawa, Y., and Stryker, M. P. (2008). Delayed plasticity of inhibitory neurons in developing visual cortex. Proc. Natl. Acad. Sci. U.S.A. 105, 16797–16802.
Garaschuk, O., Milos, R. I., and Konnerth, A. (2006). Targeted bulk-loading of fluorescent indicators for two-photon brain imaging in vivo. Nat. Protoc. 1, 380–386.
Hasenstaub, A. R., and Callaway, E. M. (2010). Paint it black (or red, or green): optical and genetic tools illuminate inhibitory contributions to cortical circuit function. Neuron 67, 681–684.
Hofmann, S., Philbrook, C., Gerbitz, K. D., and Bauer, M. F. (2003). Wolfram syndrome: structural and functional analyses of mutant and wild-type wolframin, the WFS1 gene product. Hum. Mol. Genet. 12, 2003–2012.
Hubel, D. H., and Wiesel, T. N. (1962). Receptive fields, binocular interaction and functional architecture in the cat’s visual cortex. J. Physiol. 160, 106–154.
Kakiuchi, C., Ishigaki, S., Oslowski, C. M., Fonseca, S. G., Kato, T., and Urano, F. (2009). Valproate, a mood stabilizer, induces WFS1 expression and modulates its interaction with ER stress protein GRP94. PLoS ONE 4, e4134. doi: 10.1371/journal.pone.0004134
Kasper, E. M., Larkman, A. U., Lubke, J., and Blakemore, C. (1994). Pyramidal neurons in layer 5 of the rat visual cortex. I. Correlation among cell morphology, intrinsic electrophysiological properties, and axon targets. J. Comp. Neurol. 339, 459–474.
Kawaguchi, Y., and Kubota, Y. (1997). GABAergic cell subtypes and their synaptic connections in rat frontal cortex. Cereb. Cortex 7, 476–486.
Kawano, J., Tanizawa, Y., and Shinoda, K. (2008). Wolfram syndrome 1 (Wfs1) gene expression in the normal mouse visual system. J. Comp. Neurol. 510, 1–23.
Kerlin, A. M., Andermann, M. L., Berezovskii, V. K., and Reid, R. C. (2010). Broadly tuned response properties of diverse inhibitory neuron subtypes in mouse visual cortex. Neuron 67, 858–871.
Kobayakawa, K., Kobayakawa, R., Matsumoto, H., Oka, Y., Imai, T., Ikawa, M., Okabe, M., Ikeda, T., Itohara, S., Kikusui, T., Mori, K., and Sakano, H. (2007). Innate versus learned odour processing in the mouse olfactory bulb. Nature 450, 503–508.
Lein, E. S., Hawrylycz, M. J., Ao, N., Ayres, M., Bensinger, A., Bernard, A., Boe, A. F., Boguski, M. S., Brockway, K. S., Byrnes, E. J., Chen, L., Chen, L., Chen, T.-M., Chin, M. C., Chong, J., Crook, B. E., Czaplinska, A., Dang, C. N., Datta, S., Dee, N. R., Desaki, A. L., Desta, T., Diep, E., Dolbeare, T. A., Donelan, M. J., Dong, H.-W., Dougherty, J. G., Duncan, B. J., Ebbert, A. J., Eichele, G., Estin, L. K., Faber, C., Facer, B. A., Fields, R., Fischer, S. R., Fliss, T. P., Frensley, C., Gates, S. N., Glattfelder, K. J., Halverson, K. R., Hart, M. R., Hohmann, J. G., Howell, M. P., Jeung, D. P., Johnson, R. A., Karr, P. T., Kawal, R., Kidney, J. M., Knapik, R. H., Kuan, C. L., Lake, J. H., Laramee, A. R., Larsen, K. D., Lau, C., Lemon, T. A., Liang, A. J., Liu, Y., Luong, L. T., Michaels, J., Morgan, J. J., Morgan, R. J., Mortrud, M. T., Mosqueda, N. F., Ng, L. L., Ng, R., Orta, G. J., Overly, C. C., Pak, T. H., Parry, S. E., Pathak, S. D., Pearson, O. C., Puchalski, R. B., Riley, Z. L., Rockett, H. R., Rowland, S. A., Royall, J. J., Ruiz, M. J., Sarno, N. R., Schaffnit, K., Shapovalova, N. V., Sivisay, T., Slaughterbeck, C. R., Smith, S. C., Smith, K. A., Smith, B. I., Sodt, A. J., Stewart, N. N., Stumpf, K.-R., Sunkin, S. M., Sutram, M., Tam, A., Teemer, C. D., Thaller, C., Thompson, C. L., Varnam, L. R., Visel, A., Whitlock, R. M., Wohnoutka, P. E., Wolkey, C. K., Wong, V. Y., Wood, M., Yaylaoglu, M. B., Young, R. C., Youngstrom, B. L., Yuan, X. F., Zhang, B., Zwingman, T. A., and Jones, A. R. (2007). Genome-wide atlas of gene expression in the adult mouse brain. Nature 445, 168–176.
Madisen, L., Zwingman, T. A., Sunkin, S. M., Oh, S. W., Zariwala, H. A., Gu, H., Ng, L. L., Palmiter, R. D., Hawrylycz, M. J., Jones, A. R., Lein, E. S., and Zeng, H. (2010). A robust and high-throughput Cre reporting and characterization system for the whole mouse brain. Nat. Neurosci. 13, 133–140.
Mangini, N. J., and Pearlman, A. L. (1980). Laminar distribution of receptive field properties in the primary visual cortex of the mouse. J. Comp. Neurol. 193, 203–222.
Markram, H., Toledo-Rodriguez, M., Wang, Y., Gupta, A., Silberberg, G., and Wu, C. (2004). Interneurons of the neocortical inhibitory system. Nat. Rev. Neurosci. 5, 793–807.
Marshel, J. H., Mori, T., Nielsen, K. J., and Callaway, E. M. (2010). Targeting single neuronal networks for gene expression and cell labeling in vivo. Neuron 67, 562–574.
McCormick, D. A., Connors, B. W., Lighthall, J. W., and Prince, D. A. (1985). Comparative electrophysiology of pyramidal and sparsely spiny stellate neurons of the neocortex. J. Neurophysiol. 54, 782–806.
Metin, C., Godement, P., and Imbert, M. (1988). The primary visual cortex in the mouse: receptive field properties and functional organization. Exp. Brain Res. 69, 594–612.
Miyoshi, G., and Fishell, G. (2006). Directing neuron-specific transgene expression in the mouse CNS. Curr. Opin. Neurobiol. 16, 577–584.
Nguyen, Q. T., Tsai, P. S., and Kleinfeld, D. (2006). MPScope: a versatile software suite for multiphoton microscopy. J. Neurosci. Methods 156, 351–359.
Niell, C. M., and Stryker, M. P. (2008). Highly selective receptive fields in mouse visual cortex. J. Neurosci. 28, 7520–7536.
Ohki, K., Chung, S., Ch’ng, Y. H., Kara, P., and Reid, R. C. (2005). Functional imaging with cellular resolution reveals precise micro-architecture in visual cortex. Nature 433, 597–603.
Osman, A. A., Saito, M., Makepeace, C., Permutt, M. A., Schlesinger, P., and Mueckler, M. (2003). Wolframin expression induces novel ion channel activity in endoplasmic reticulum membranes and increases intracellular calcium. J. Biol. Chem. 278, 52755–52762.
Pelli, D. G. (1997). The videotoolbox software for visual psychophysics: transforming numbers into movies. Spat. Vis. 10, 437–442.
Runyan, C. A., Schummers, J., Van Wart, A., Kuhlman, S. J., Wilson, N. R., Huang, Z. J., and Sur, M. (2010). Response features of parvalbumin-expressing interneurons suggest precise roles for subtypes of inhibition in visual cortex. Neuron 67, 847–857.
Shaner, N. C., Campbell, R. E., Steinbach, P. A., Giepmans, B. N., Palmer, A. E., and Tsien, R. Y. (2004). Improved monomeric red, orange and yellow fluorescent proteins derived from Discosoma sp. red fluorescent protein. Nat. Biotechnol. 22, 1567–1572.
Sohya, K., Kameyama, K., Yanagawa, Y., Obata, K., and Tsumoto, T. (2007). GABAergic neurons are less selective to stimulus orientation than excitatory neurons in layer II/III of visual cortex, as revealed by in vivo functional Ca2+ imaging in transgenic mice. J. Neurosci. 27, 2145–2149.
Stosiek, C., Garaschuk, O., Holthoff, K., and Konnerth, A. (2003). In vivo two-photon calcium imaging of neuronal networks. Proc. Natl. Acad. Sci. U.S.A. 100, 7319–7324.
Swindale, N. V., Matsubara, J. A., and Cynader, M. S. (1987). Surface organization of orientation and direction selectivity in cat area 18. J. Neurosci. 7, 1414–1427.
Tian, L., Hires, S. A., Mao, T., Huber, D., Chiappe, M. E., Chalasani, S. H., Petreanu, L., Akerboom, J., McKinney, S. A., Schreiter, E. R., Bargmann, C. I., Jayaraman, V., Svoboda, K., and Looger, L. L. (2009). Imaging neural activity in worms, flies and mice with improved GCaMP calcium indicators. Nat. Methods 6, 875–881.
Tsai, P. S., Nishimura, N., Yoder, E. J., Dolnick, E. M., White, G. A., and Kleinfeld, D. (2002). “Principle, design and construction of a two photon laser-scanning microscope for in vitro and in vivo brain imaging,” in In Vivo Optical Imaging of Brain Function, ed. R. D. Frostig (Boca Raton, FL: CRC Press), 115–171.
Wickersham, I. R., Lyon, D. C., Barnard, R. J., Mori, T., Finke, S., Conzelmann, K. K., Young, J. A., and Callaway, E. M. (2007). Monosynaptic restriction of transsynaptic tracing from single, genetically targeted neurons. Neuron 53, 639–647.
Xu, X., Roby, K. D., and Callaway, E. M. (2010). Immunochemical characterization of inhibitory mouse cortical neurons: three chemically distinct classes of inhibitory cells. J. Comp. Neurol. 518, 389–404.
Yazaki-Sugiyama, Y., Kang, S., Cateau, H., Fukai, T., and Hensch, T. K. (2009). Bidirectional plasticity in fast-spiking GABA circuits by visual experience. Nature 462, 218–221.
Yoshimura, Y., Dantzker, J. L., and Callaway, E. M. (2005). Excitatory cortical neurons form fine-scale functional networks. Nature 433, 868–873.
Keywords: orientation preference, GABAergic, somatic inhibition, microcircuitry, cre, reporter mouse, cell type
Citation: Zariwala HA, Madisen L, Ahrens KF, Bernard A, Lein ES, Jones AR and Zeng H (2011) Visual tuning properties of genetically identified layer 2/3 neuronal types in the primary visual cortex of cre-transgenic mice. Front. Syst. Neurosci. 4:162. doi: 10.3389/fnsys.2010.00162
Received: 30 June 2010;
Accepted: 20 December 2010;
Published online: 13 January 2011.
Edited by:
Mriganka Sur, Massachusetts Institute of Technology, USAReviewed by:
Hongbo Yu, Massachusetts Institute of Technology, USAJudith Hirsch, University of Southern California, USA
Copyright: © 2011 Zariwala, Madisen, Ahrens, Bernard, Lein, Jones and Zeng. This is an open-access article subject to an exclusive license agreement between the authors and the Frontiers Research Foundation, which permits unrestricted use, distribution, and reproduction in any medium, provided the original authors and source are credited.
*Correspondence: Hatim A. Zariwala, Center for Integrative Brain Research, Seattle Children’s Research Institute, 1900 9th Avenue, Seattle, WA 98101, USA. e-mail: hatim.allen@gmail.com; Hongkui Zeng, Allen Institute for Brain Science, 551 N 34th Street, Seattle, WA 98103, USA. e-mail: hongkuiz@alleninstitute.org