Comparing the feature selectivity of the gamma-band of the local field potential and the underlying spiking activity in primate visual cortex
1
Max Planck Institute for Biological Cybernetics, Tübingen, Germany
2
Baylor College of Medicine, Department of Neuroscience, Houston, TX, USA
3
Division of Imaging Science and Biomedical Engineering, University of Manchester, Manchester, UK
The local field potential (LFP), comprised of low-frequency extra-cellular voltage fluctuations, has been used extensively to study the mechanisms of brain function. In particular, oscillations in the gamma-band (30–90 Hz) are ubiquitous in the cortex of many species during various cognitive processes. Surprisingly little is known about the underlying biophysical processes generating this signal. Here, we examine the relationship of the local field potential to the activity of localized populations of neurons by simultaneously recording spiking activity and LFP from the primary visual cortex (V1) of awake, behaving macaques. The spatial organization of orientation tuning and ocular dominance in this area provides an excellent opportunity to study this question, because orientation tuning is organized at a scale around one order of magnitude finer than the size of ocular dominance columns. While we find a surprisingly weak correlation between the preferred orientation of multi-unit activity and gamma-band LFP recorded on the same tetrode, there is a strong correlation between the ocular preferences of both signals. Given the spatial arrangement of orientation tuning and ocular dominance, this leads us to conclude that the gamma-band of the LFP seems to sample an area considerably larger than orientation columns. Rather, its spatial resolution lies at the scale of ocular dominance columns.
Low frequency extracellular voltage fluctuations, widely known as local field potential (LFP), are abundant across species and brain regions. These signals are believed to primarily reflect synchronized dendro-somatic components of synaptic signals (Mitzdorf, 1987
), subthreshold membrane oscillations (Kamondi et al., 1998
) and afterpotentials of somatodendritic action potentials originating from an area around the electrode tip (Buzsaki, 2002
; Logothetis and Wandell, 2004
). In recent years a growing number of studies have tried to link local field potentials in cortical circuits to coding of sensory stimuli (Henrie and Shapley, 2005
; Kayser and Konig, 2004
; Kreiman et al., 2006
; Kruse and Eckhorn, 1996
; Liu and Newsome, 2006
; Siegel and Konig, 2003
) as well as cognitive processes like attention (Fries et al., 2001
; Taylor et al., 2005
), memory (Lee et al., 2005
; Pesaran et al., 2002
) and perception (Fries et al., 2002
; Gail et al., 2004
; Womelsdorf et al., 2006
). Recently, it has been suggested that LFPs can be useful for the control of cortical motor prostheses (Andersen et al., 2004
; Mehring et al., 2003
; Rickert et al., 2005
). In addition, electroencephalography (EEG), the extracranial counterpart of the LFP signal, has been used in research and clinical application for decades. Much of the current resurgent interest also stems from the LFPs intricate relationship to the BOLD signal measured with fMRI (Logothetis et al., 2001
).
Surprisingly little is known, however, about the mechanisms generating the LFP signal and its relationship to local cortical circuits. It has been established, for example, that the spectral coherence between local field potentials from different recording sites falls of with increasing distance (Destexhe et al., 1999
; Juergens et al., 1999
; Leopold and Logothetis, 2003
), where the falloff is steeper in higher frequency bands than in lower ones. But surprisingly strong correlation between the signals from different sites can typically be found up to a few millimeters. Under visual stimulation with gratings, Juergens et al. find that up to a distance of 1.5 mm LFP coherence in the gamma-band remains very high at ∼0.7 (Juergens et al., 1999
). This has been interpreted as a sign of synchronized activity between distant cortical populations measured via the LFP signal, which was taken to reflect activity from local populations (Engel et al., 2001
). An alternative parsimonious interpretation, however, is that the LFP signal measures the extended network activity with poor spatial resolution, as it is not well understood how closely LFP activity reflects physiological properties and local processing at the scale of cortical columns (Albright et al., 1984
; Hubel and Wiesel, 1968
, 1974
; Zeki, 1974
). Functional properties of neurons in the cortex are often organized on a very fine spatial scale, such as orientation tuning in area V1 of the macaque. It is believed to be represented in orientation columns spanning a cortical distance of about 50 μm (Hubel and Wiesel, 1968
, 1974
, 1977
) or to vary smoothly along the cortical surface with several changes in preferred orientation within one ocular dominance column (Bartfeld and Grinvald, 1992
; Blasdel, 1992b
; Horton and Adams, 2005
; Vanduffel et al., 2002
). In order to understand the relationship between the activity of localized populations of neurons and the gamma-band frequency range of the LFP, it is imperative to determine if LFP signals are in fact restricted enough to reflect local activity at the scale of orientation columns.
We investigated this question by studying the relationship of the LFP, and in particular the gamma-band, to the spiking activity of local populations of neurons in the primary visual cortex of the macaque. We exploited the well known spatial organization of orientation tuning and ocular dominance columns and recorded multi-unit (MU) activity and LFP using arrays of multiple chronically implanted tetrodes. With this experimental setup we were able to record simultaneously from nearby sites with distinct MU preferences and compare the properties of the LFP to those of the MU at the same site. Previous studies established a power increase in the gamma-band as the most prominent feature of LFP activity under visual stimulation in V1, but did not systematically assess the relationship between LFP tuning and the tuning of MU activity, which reflects the spiking activity of neurons close to the recording electrode tip (Frien and Eckhorn, 2000
; Frien et al., 2000
; Fries et al., 2001
, 2002
; Gray and Singer, 1989
; Siegel and Konig, 2003
).
We find that the preferred orientation of the LFP did not correlate well with the preferred orientation of the MU recorded at the same site. As expected, nearby MU recording sites (around 200 μm apart) had distinct orientation preferences, while LFP tuning was homogenous across adjacent tetrodes located up to 1 mm apart. This leads us to conclude that the LFP integrates the activity of neurons with diverse orientation preferences, sampling an area spanning several orientation columns (more than 50 μm). In contrast to orientation tuning, ocular dominance columns span about 450 μm (Bartfeld and Grinvald, 1992
; Blasdel, 1992a
; Hubel and Wiesel, 1972
, 1977
). When we compared the ocular dominance tuning of the LFP and the MU at the same site, we did find a much stronger correlation between LFP and MU preferences.
Electrophysiological Recordings and Surgical Methods
Experiments were conducted in three healthy, adult monkeys (Macaca mulatta) weighing 16, 12, and 11 kg (monkeys A, B, and C). The studies were approved by the local authorities (Regierungspräsidium) and were in full compliance with the guidelines of the European Community (EUVD 86/609/EEC) for the care and use of laboratory animals. Recording chambers were positioned stereotactically with the aid of high-resolution magnetic resonance anatomical images. These methods have been described in detail previously (Logothetis et al., 1999
). Inside the form-specific chambers built out of titanium (monkeys A and B) a custom-built array of tetrodes was chronically implanted over the left hemisphere operculum in area V1 (Tolias et al., 2007
). In monkeys A and C we also recorded non-chronically from form-specific chambers implanted in the right hemispheres. All recordings were conducted with tetrodes attached to microdrives that could be manually adjusted independently. The initial impedances of the tetrodes after electroplating and before implantation were between 200 and 800 kΩ.
For the chronic recordings, the distance between nearby tetrodes was 200 and 500 μm for monkeys A and B, respectively, and the maximal distance between pairs of tetrodes was ∼750 μm in monkey A and 1 mm in monkey B. For the non-chronic recordings, manually adjustable microdrives were inserted into a custom-built grid and activity was recorded using tetrodes. No functional pre-selection criteria were applied for the neurons. Multi-unit (MU) activity and single unit (SU) activity was sampled at 32 kHz, digitized, and stored using the Cheetah data acquisition system (Neuralynx, Tuscon, AR). LFP signals were recorded by filtering (steepness of filters: 16 db/octave) the raw voltage signal from one of the tetrode channels using analogue band pass filtering (0.1–475 Hz) and digitized at 2 kHz (12 bits). Multi-unit activity was defined as the events that exceeded a predefined threshold (set at 25 μV for most recording sites and 30 μV for a few) of the filtered, digitized signal (analogue filtering, 0.6–6 kHz and digitized at 32 Hz, 12 bits). Single units were isolated using a custom-built offline clustering system working on features extracted from the recorded waveforms. Details of single units isolation have been described elsewhere (Tolias et al., 2007
).
In the orientation tuning experiments, in monkey A two tetrodes were advanced deep into white matter and used for reference (142/160 recording sites for this experiment were recorded with these reference tetrodes). The remaining 18 sites and all the data from monkey B were recorded using the ground for referencing (a screw on the bone inside the chamber). We did not find any significant differences in the results we obtained from the two animals. Given the recording arrangement using a reference tetrode, it is possible that the increase in the gamma band (see Results) is dominated by electrical dipoles close to the reference. If this were the case, we expect nearby tetrodes to have nearly the same signal. However, re-referencing each recording-tetrode with an adjacent tetrode (by digital subtraction), we find a 5% increase in the gamma-band power in the re-referenced signal compared to the original one. In contrast, if the increase in the gamma band was caused by dipoles close to the reference, this portion of the signal would be present on both tetrodes and re-referencing would lead to a strong decrease in gamma-band power. Therefore, it is very unlikely that the gamma power is dominated by dipoles close to the original reference. In the ocular dominance experiments, all sites were recorded using ground referencing.
In the orientation experiments, data from monkey A were recorded from 64 and 96 sites using static and moving gratings, respectively (datasets A1 and A2, recorded using the same chronic tetrode array 10 months apart). Data from monkey B were recorded from 36 sites (dataset B1). Due to our chronic recording setup, most recordings from each monkey come from a very similar part of the cortical map. The shape of the evoked potential of the LFP was suggestive that recordings were performed in layer 4 (Schroeder et al., 1995
). In the ocular dominance experiments, data from monkey A were recorded from 199 sites using monocular static gratings (92 chronic, 107 non-chronic). All data from monkey C were recorded non-chronically from 210 sites using the same kind of stimuli.
Visual Stimulation and Behavioral Paradigm
Visual stimuli were displayed using a dedicated graphics workstation (TDZ 2000; Intergraph Systems, Huntsville, AL) with a resolution of 1280 × 1024 pixels, and refresh rate of 85 Hz, running an OpenGL-based stimulation program. The behavioral aspects of the experiment were controlled using the QNX real-time operating system (QSSL, Ontario, Canada). In the orientation experiments, after the monkey acquired fixation on a colored square target (0.2°) for 300 ms, a sine wave grating stimulus was presented. Typically the size of the grating was 5° in diameter and the spatial frequency 4 cycles per degree. We applied either static or moving gratings equally distributed at eight different orientations and typically high contrast (moving gratings: 100%, static gratings: 30–100%). For moving gratings the speed was 0.5 cycles per second. The grating stimuli were displayed for 500 ms and the animal was required to maintain fixation for another 500 ms. At the end of each successful trial a drop of apple juice was used for reward. In the ocular dominance experiments, a similar stimulus presentation design was used, but gratings were presented monocularly using a custom-made mirror-stereoscope and two LCD monitors on both sides running with a refresh rate of 60 Hz. The fixation window was ±0.5°. The animals were implanted with a scleral search coil (Robinson, 1963
) and their eye movements were monitored on-line. Data were also collected for off-line analysis using both the QNX-based data acquisition system at 200 Hz and the Cheetah data acquisition system at 2000 Hz.
Statistical and Data Analysis
We considered three different time periods. The baseline period ranged from 300 ms before the stimulus appeared to stimulus onset. We consider the first 200 ms of the stimulation period as the evoked response period (ERP), where we observe a strong transient response dominated by low frequencies. Therefore, we treat this period separately. The stimulation period ranged from 200 to 500 ms after stimulus onset.
The power spectrum of the LFP was obtained by computing its multi-taper estimate (Thomson, 1982
) using a time-bandwidth product of 2.5 (number of samples: N = 600, spectral concentration: W = 0.042, or ∼8 Hz). The power increase in the LFP during stimulation period relative to baseline was defined as 10·(log(Pstim) − log(Pbase)) and is measured in db. To obtain a “response value” for the LFP at different frequencies, we used the mean power in a narrow band of 10 Hz around the center frequency. As a response value for the ERP we used the root mean square power in the respective time period.
We tested both MU and LFP responses for orientation tuning with an ANOVA (p < 0.05). Orientation tuning functions were fitted using a standard least squares algorithm (lsqcurvefit, Optimization Toolbox, Matlab, The Mathworks) and modified a von Mises circular distribution function (Fisher, 1993
) given by
The parameter θ is the sites’ preferred orientation, b determines the width of the orientation tuning function (the larger, the more sharply tuned, flat if zero), f0 and a determine the offset above zero and the peak firing rate.
To assess how well stimuli with different orientations can be discriminated at each site, we computed a tuning index d′ defined as
Here μpref and μorth denote the mean response to the preferred and the orthogonal stimulus condition, respectively, and  is the pooled variance of the two response distributions. This measure differs from those used in previous studies (Frien and Eckhorn, 2000
; Frien et al., 2000
; Kayser and Konig, 2004
; Liu and Newsome, 2006
) in that it takes explicitly into account the trial variability of the response (Siegel and Konig, 2003
). We also investigated other tuning indices used in the above studies. Although they gave qualitatively similar results for the LFP tuning alone, they underestimate the effect of the variability of the LFP response compared to the MU response especially in low frequencies (data not shown). Therefore they lead to spuriously high estimates of LFP tuning strength compared to that of the MU signal. To obtain an estimate of the expected d′ assuming no structure in the LFP over conditions, we calculated the tuning index on shuffled datasets, where trials were randomly assigned to conditions.
is the pooled variance of the two response distributions. This measure differs from those used in previous studies (Frien and Eckhorn, 2000
; Frien et al., 2000
; Kayser and Konig, 2004
; Liu and Newsome, 2006
) in that it takes explicitly into account the trial variability of the response (Siegel and Konig, 2003
). We also investigated other tuning indices used in the above studies. Although they gave qualitatively similar results for the LFP tuning alone, they underestimate the effect of the variability of the LFP response compared to the MU response especially in low frequencies (data not shown). Therefore they lead to spuriously high estimates of LFP tuning strength compared to that of the MU signal. To obtain an estimate of the expected d′ assuming no structure in the LFP over conditions, we calculated the tuning index on shuffled datasets, where trials were randomly assigned to conditions.
The correlation between the preferred orientations of MU and LFP was assessed using the circular correlation coefficient (Jammalamadaka and SenGupta, 2001
). Its sample estimate is given by
Here αi and βi denote the respective sample angles and  and
and  the circular sample means.
Ocular dominance of MU and LFP was tested using a t-test (p < 0.05) between the responses to stimuli presented to the left and the right eye. An ocular dominance index was computed
where μleft and μright denote the response value to stimuli presented to the left and right eye respectively. This index ranges between −1 (right preference) and 1 (left preference). To compute correlation coefficients between MU and LFP ocular dominance indices we used Spearman’s ρ, a rank correlation measure appropriate for bounded data.
Orientation Tuning: Electrophysiological Signals
We recorded from 196 V1 recording sites from two monkeys (A and B) using chronically implanted tetrode arrays. From each site, we recorded local field potentials (LFP) and multi-unit activity (MU, Figure 1
). Orientation tuning functions were mapped using sinusoidal gratings.
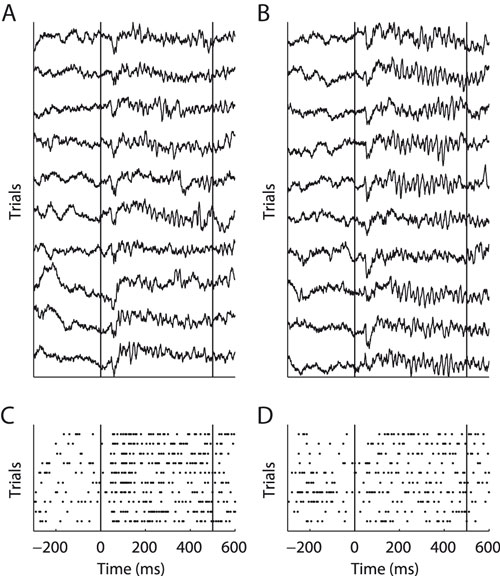
Figure 1. Example of LFP (A and B) and MU activity (C and D). Two orthogonal stimulus conditions recorded at the same site are shown. Panels (A and C) and (B and D) show identical trials of the two signals, respectively. Vertical lines indicate onset and offset of visual stimulation. During the stimulation period clear gamma-band oscillations in the LFP can be seen. However, in (B) these are much more prominent then in (A). Note that MU response strength is higher in (C) than in (D).
Figure 1
A and B show exemplar local field potential traces of a single recording site during stimulation with two gratings of orthogonal directions. During the stimulus period a dominant high-frequency oscillation can be observed. Visually, fast oscillations during the sustained period increase noticeably from A to B, while the signal shape during the evoked response period (ERP) does not change. Figure 1
C and D show the multi-unit activity recorded simultaneously with the LFP from A and B, respectively. In contrast to the fast oscillations in the LFP, the MU firing rate is higher in C than in D. This indicates that oscillations in the local-field potential are not always tightly coupled to the activity of local populations of neurons. In the remainder of the paper, we investigate the link between the LFP and spiking activity in local cortical circuits in more detail.
First, we computed the LFP power spectra separately for the baseline period (–300 ms to stimulus onset) and the stimulus period (200–500 ms after stimulus onset, excluding the ERP transient). Figure 2
A and B show the power spectra of a recording site representative of our sample where visual stimulation induces a broad band increase in the LFP as compared to baseline (dashed line) located in a band centered around 55 Hz. Interestingly, the power increase is stronger for some stimulus orientations than for others: In the example, a grating at 22° led to a stronger power increase than one at 90° (dark grey and light grey line, respectively). At most recording sites (88%), visual stimulation induced at least a twofold increase of LFP power in the gamma band (40–70 Hz) of the frequency spectrum (Figure 2
C, dataset A2, all sites). While the precise position of the peak in the relative spectra was dependent on the type of stimulation and the monkey (median frequency of maximal increase: A1 66.1, A2 54.4, and B1 60.3 Hz), the increase of gamma-band power was prominent in all three datasets (Figure 2
D).
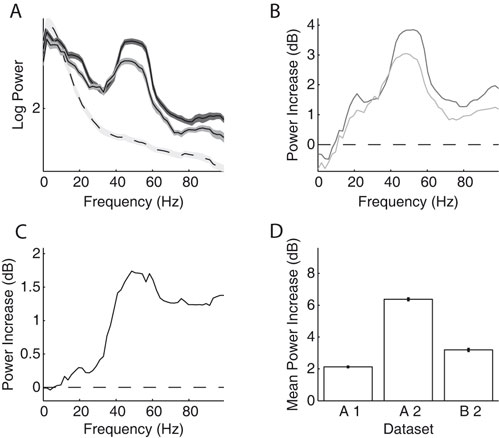
Figure 2. LFP spectral properties. (A) Example of the power spectrum of a single typical recording site during baseline activity (–300 to stimulus onset, dashed line, light grey error bars) and visual stimulation (200–500 ms after stimulus onset, solid lines). The two solid lines show spectra under stimulation with two gratings with different orientations (dark grey: 22°, medium grey: 90°). This site shows stronger gamma-oscillations in response to the former orientation. All shaded regions indicate one standard error of the mean. Site is from dataset A2. (B) Power difference spectrum between stimulus and fixation demonstrating a prominent increase in power in the gamma-band (30–70 Hz) at the same site as shown in (A). (C) Population average over the relative power of the LFP spectra under stimulation to baseline for all sites in dataset A2. (D) Mean relative power of all sites (n = 196) in the gamma-band for all used data groups. Error bars show standard error of the mean.
Orientation Tuning of the LFP
We investigated the stimulus dependent modulation of the LFP gamma-band power quantitatively by computing an orientation tuning index for the power in different narrow frequency bands. This tuning index describes the strength of tuning as a function of the discriminability between the stimulus orientation evoking the strongest response and the response to the orthogonal condition (for details see Materials and Methods). To further control for spuriously high estimates of tuning strength induced by a large variability in the data, we also computed this tuning index on condition shuffled data (for details see Materials and Methods). We observe that tuning strength is significantly increased from 40 up to 70 Hz with a maximum at 55 Hz for dataset A2 (Figure 3
A). This effect was similar in all three datasets (Figure 3
D, A1 30–45 Hz, B1 58–75 Hz).
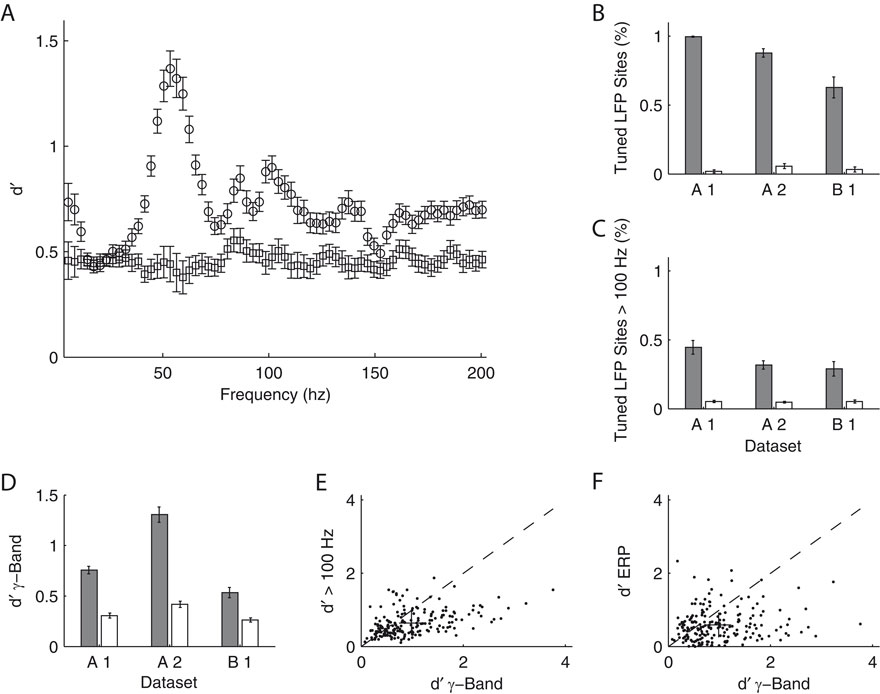
Figure 3. Orientation tuning properties of the LFP. (A) Mean tuning index d′ as a function of frequency for the dataset A2 (n = 96, circles). This tuning index is an indication of the discriminability between the preferred and the orthogonal orientation (see Materials and Methods). Also shown is a shuffle corrected tuning index (squares), where trials were randomly assigned to conditions. A tuning index that is significantly greater than chance is observed in the gamma-band. (B) Mean fraction of tuned sites in the gamma-band. The left grey bar of each dataset shows the percentage for the original data, while the right white bar was obtained from the shuffled data. The number was computed in a 10 Hz band around the frequency with maximal tuning index. (C) Mean fraction of tuned sites in frequency bands over 100 Hz. Colors as in (B). (D) Mean tuning index d′ averaged over all sites in the same bands used for (B) (gamma band). (E) Comparison of the tuning index of the gamma-band (x-axis) with tuning index at frequencies over 100 Hz. The cross indicates the mean. Note that it lies well below the main diagonal. Therefore the gamma-band is on average more tuned than the frequencies over 100 Hz. (F) Comparison of the tuning index of the gamma-band (x axis) with tuning index of the event-related potential. The cross indicates the mean. Note that it lies well below the main diagonal. Therefore the gamma-band is on average more tuned than the event-related potential.
Therefore, as previously shown, the increase in power of the gamma-band is tuned to the orientation of the stimulus (Frien et al., 2000
). This was the case in a large percentage of recording sites across all datasets (Figure 3
B, A1 99%, A2 87%, B1 67%). The power at frequencies over 100 Hz is also significantly tuned, but not as strong as the gamma power (Figure 3
C and E, Sign test, p = 3.8 × 10⁻⁸). Interestingly, in contrast to other studies in inferior temporal cortex (Kreiman et al., 2006
), we did not observe a strong stimulus dependence of the evoked response power (Figure 3
F). The power of the ERP signal (see Materials and Methods) is significantly less tuned than the power in the gamma-band (Sign test, p = 2.1 × 10⁻¹⁰).
Comparison of Orientation Tuning of LFP and MU
To obtain a deeper insight into the relationship between the gamma band activity of the LFP signal and the underlying neural activity, we also computed the tuning index for all MU sites and compared it to the corresponding LFP sites (Figure 4
). Although we used the most strongly tuned LFP band for each site (see above), the MU is on average significantly more tuned than the LFP in this frequency band (Sign test, p = 3.1 × 10⁻¹¹) with a mean tuning strength (d′) of 2.46 ± 0.15 for MU and 1.01 ± 0.05 for the LFP (mean ± SEM, data pooled from all three datasets).
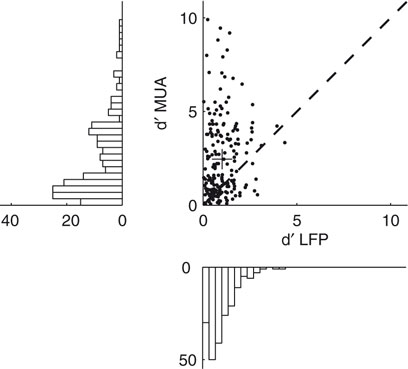
Figure 4. Tuning strength of LFP compared to MU activity. Scatter plot of the tuning index d′ for the MU activity and LFP obtained from the same recording site. Tuning strength for the LFP was computed in the best tuned frequency band in the gamma range. The cross indicates the population average, showing that the MU activity is more strongly tuned than the gamma band of the LFP. Marginal histograms are shown on the left and the bottom.
We also compared the preferred orientation of the LFP tuning function with that of the MU tuning function (Figure 5
). We find that the preferred orientations of significantly tuned MU and LFP sites are not significantly correlated (circular correlation coefficient for dataset A1 0.19, p = 0.12; A2 –0.07, p = 0.57; B1 0.39, p = 0.12) or at best only weakly correlated (circular correlation coefficient 0.21, p = 0.0094, dataset A1 and A2 pooled together). In Figure 6
we show two examples of orientation tuning functions. While at site A the tuning curves of MU activity and LFP gamma band are tightly correlated, the preferred directions of both signals at site B are separated by 90°. The two sites shown in A and B are representative of our sample of sites: While there is a considerable number of sites where MU activity and LFP have similar preferred orientations (within 20°), there are also many sites, at which the preferred orientations of the two signals are separated by over 60° (Figure 6
C). The mean distance between the preferred orientations of MU and LFP was 34.1°. It is possible that the two groups of sites represent different recording locations on the orientation map: Due to signal integration properties, the preferred orientations might be better correlated at sites in linear zones than at sites near pinwheel centers (see Discussion). To test this hypothesis, we compared the LFP tuning strength as measured with d′ of sites with well matching preferred orientations (Δθ < 20°, n = 63) to sites with very different preferred orientations (Δθ > 60°, n = 35). Indeed, we find the LFP gamma-band at sites where LFP and MU had closely matching preferred orientations to be significantly more tuned than sites where MU and LFP had very different preferred orientations (Figure 6
D, Wilcoxon rank sum test, p = 0.0282). The mean tuning strength was 1.20 and 0.81 in the two groups, respectively. Interestingly, we observe that all preferred orientations of the LFP cluster around one value, −40.1° for monkey A and 3.8° for monkey B (Figure 5
, lower panels, see Discussion). In contrast, the MU preferred orientations are uniformly distributed over the whole range of orientations (Figure 5
, left panels).
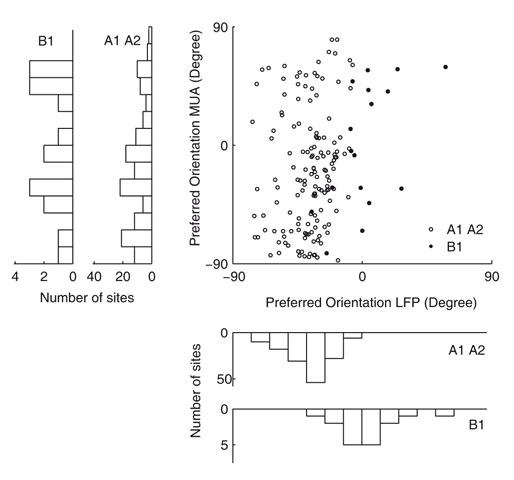
Figure 5. Preferred orientation of the LFP compared with MU activity. Scatter plot of the preferred orientations of the gamma-band power of the LFP and MU activity recorded from the same site obtained by fitting a circular Gaussian tuning function (see Materials and Methods). White circles indicate data from monkey A (datasets A1 and A2), while black circles indicate monkey B (dataset B1). Marginal histograms are shown on the left and the bottom. The inner histograms show data from monkey A, the outer from monkey B. While the preferred directions of the LFP signal cluster around a mean value, MU preferred directions are distributed across the entire space of orientations (for a detailed discussion, see text).
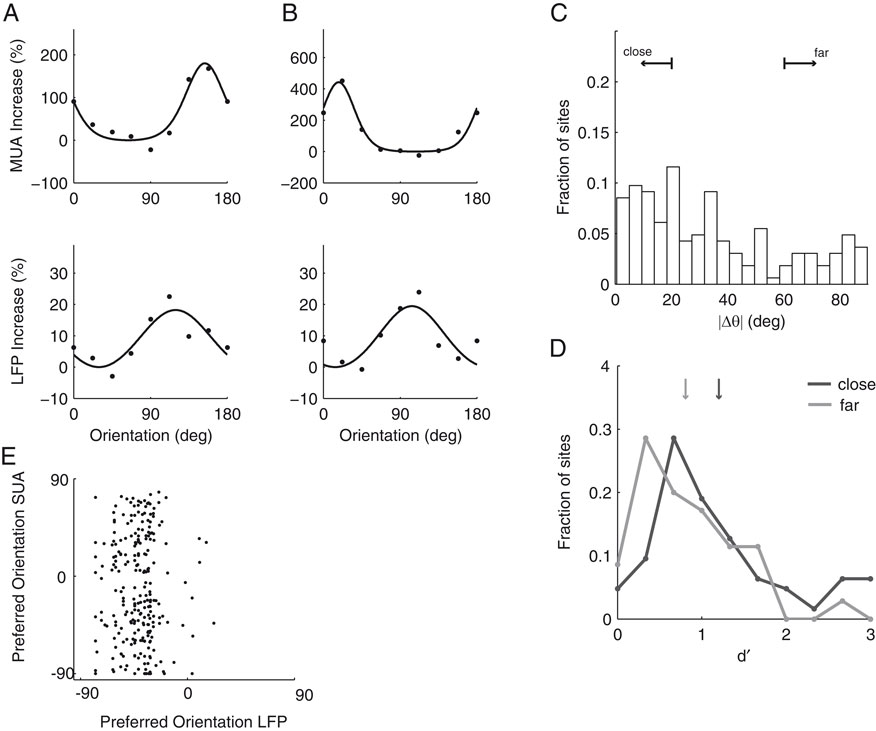
Figure 6. Examples of MU and LFP tuning functions and relationship of tuning strength to preference difference. (A and B) Two typical examples of tuning functions of MU (top row) and LFP (bottom row). Site (A) shows similar tuning curves for MU and LFP, whereas site (B) has nearly orthogonal preferred orientations for the two signals. Note also that the relative increase from minimal to maximal activity is larger in both MU tuning curves. (C) Population histogram of the difference in preferred orientations between MU and LFP. While many sites have close tuning, there is a large fraction with nearly orthogonal tuning as well. Small arrows labeled “close” and “far” indicate the groups used in (D). (D) Population histogram of d′ as a function of the difference in preferred orientations between LFP and MU (“close”, <20°, dark grey and “far”, >60°, light grey). Median d′ of the LFP is indicated by arrows and is larger for close than for far tuned neurons (for a detailed description, see main text). (E) Scatter plot of preferred orientations of LFP and single units isolated from the same tetrode as in Figure 5
. Both are uncorrelated (for a detailed discussion, see text).
The apparent lack of strong correlation could be due to the fact that the MU signal is dominated by interneurons with high mean firing rates and orientation preference differing from the local pyramidal neurons, that contribute little to the LFP power, as their absolute number is low (Beaulieu and Colonnier, 1983
). Therefore, we studied the relationship between the preferred orientations of the LFP with that of well-isolated and significantly tuned single neurons (SU), recorded from the same tetrode. It is likely that a large fraction (∼75–90%) of these are pyramidal neurons contributing to the MU (Bartho et al., 2004
; Constantinidis and Goldman-Rakic, 2002
). We find that the preferred orientation of the LFP and the SU activity are not significantly correlated as well (Figure 6
E, circular correlation coefficient –0.07, p = 0.26). This provides strong evidence that the preferred orientation of the LFP gamma band indeed does not reflect well the tuning properties of localized populations of neurons.
We also studied the correlation between preferred orientations as a function of frequency and we found an increase at frequencies over 100 Hz (Figure 7
A). This correlation is moderate for frequencies up to 150 Hz and strong for frequencies around 200 Hz. Examples at 125 and 195 Hz are shown in Figure 7
B and C respectively (Circular correlations at 195 Hz: 0.86, p = 8.4 × 10⁻⁹, datasets A1 and A2 collapsed; 0.87, p = 6.5 × 10⁻⁵, dataset A1; 0.63, p = 3 × 10⁻⁴, dataset A2; 0.85, p = 0.04, dataset B1).
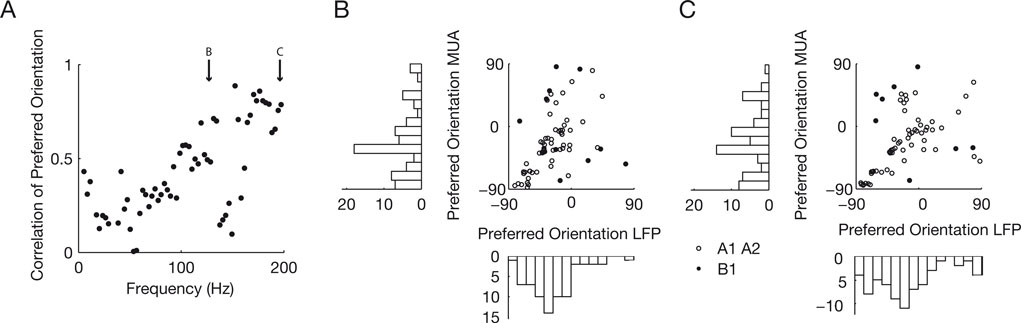
Figure 7. Correlation as a function of frequency. (A) Correlation between the preferred orientation of the MU and the LFP is shown as a function of frequency. Note that the correlation increases over at 100 Hz and saturates over 150 Hz at 0.8. Bins at 50 and 150 Hz are confounded by possible line noise and therefore very noisy. (B and C) Scatter plot of the preferred orientation of MU against the preferred orientation of the LFP at 125 and 195 Hz. Note the clearly visible increase in correlation from Figure 5
. Most points fall along the main diagonal. Points in the lower right and upper left corner are also well correlated because of the circular nature of the distribution. The number of points is not the same as in Figure 5
, because not so many LFP sites are tuned in these frequency bands.
Ocular Dominance
In addition, we recorded from 409 sites from two monkeys (A and C) using chronically implanted and non-chronic tetrodes and mapped ocular dominance using static sinusoidal gratings, presented on each eye separately. As before, we recorded LFP and MU.
For each site, we computed an ocular dominance index (ODI), ranging between –1 for preferred right eye and +1 for preferred left eye (for details, see Materials and Methods). 56.7% of all MU sites had a significant ocular dominance tuning (t-test, p < 0.05; Monkey A: 54.7%; Monkey B: 58.6%), 53.9% of which where preferably excited by stimulation to the left eye. The significantly tuned sites had a mean absolute ODI of 0.22. For the LFP analysis we chose again a frequency band where ocular dominance was strongest. In both monkeys, this was in the lower gamma-band between 35 and 45 Hz, somewhat lower than the bands chosen for analysis in the orientation experiments. Here, 50.8% of all LFP recording sites had significant ocular dominance (Monkey A: 55.3%; Monkey B: 46.7%), with 52.4% of which being preferably excited by the left eye. LFP sites had a mean absolute ODI of 0.13 in the most strongly modulated frequency band around 40 Hz. Therefore, the MU activity shows significantly stronger ocular dominance tuning than the LFP (Sign test, p = 6.5 × 10⁻²⁵).
We compared the ODI of MU activity and LFP recorded from the same site for all sites, which showed significant ocular dominance in both signals (Figure 8
A, 35.7% of all sites). We find a significant correlation in both monkeys (All sites: Spearman’s ρ = 0.61, p < 10−20; Monkey A: ρ = 0.51, p = 5 × 10⁻⁶; Monkey C, ρ = 0.65, p = 2.4 × 10⁻⁹). Furthermore, if a site showed significant ocular dominance for MU, it also exhibited significant ocular modulation for the LFP in 62.1% of the cases. When MU activity did not show significant ocular dominance, only 37.3% of the sites had significant ocularity tuning for the LFP. Therefore, the LFP gamma-band signal was significantly more likely to be tuned when the MU was (p = 1.2 × 10⁻⁶, Fisher exact test, right-tailed). We also analyzed how the correlation between LFP and MU ODIs changes in higher frequency bands (Figure 8
B). We observe an increase of the correlation to values up to 0.7 in frequency bands ranging to 70 Hz. After that, the correlation remains constant for the entire range of analyzed frequency bands.
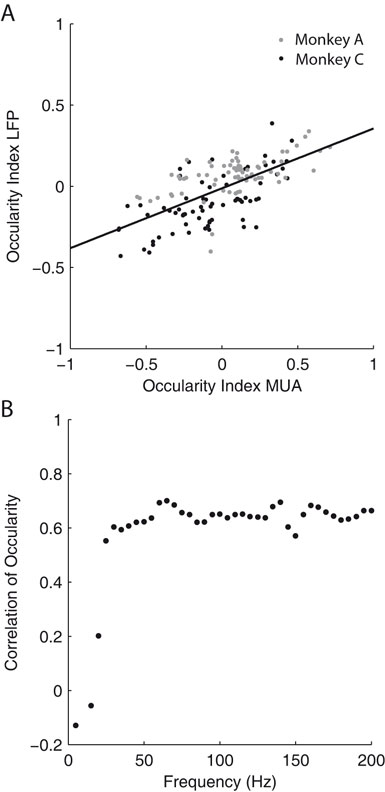
Figure 8. Ocular dominance analysis. (A) Scatter plot of the ocular dominance index (ODI) of MU against the ODI of the LFP in the 32–55 Hz frequency range. While the correlation is not perfect, a linear trend is clearly (All sites: Spearman’s ρ = 0.61, p < 10−20; Monkey A: ρ = 0.51, p = 5 × 10⁻⁶; Monkey C, ρ = 0.65, p = 2.4 × 10⁻⁹). The black line shows the least square fit to the data of both monkeys. LFPs are generally less tuned to ocularity than MU activity. Grey dots represent data from monkey A, black dots from monkey C. (B) Correlation of the ODI between MU activity and LFP as a function of frequency. The correlation increases to a maximal level of about 0.6, saturating for frequencies greater than 60 Hz. Also compare to Figure 7
A. The different spatial scales seem to be reflected in the saturation point as well.
The Spatial Scale of the Local Field Potential
In the present study we find that in a large proportion of our recording sites the gamma-power of the LFP does not reflect well the orientation tuning properties of local multi-unit activity. While the gamma-power of the LFP is in general less tuned than the MU, at sites where LFP and MU had similar orientation preferences the gamma-power of the LFP tends to be more strongly tuned than at other sites, where the two signals had strongly differing preferred orientations. Also, we observe a strong correlation between the LFP power in the gamma-band and the MU activity on the scale of ocular dominance columns (450 μm). In addition, the correlation between LFP power and MU activity increases with frequency saturating around 40 Hz for ocular dominance and 120 Hz for orientation tuning. At least part of the increased correlation at high frequencies may reflect contamination from low-frequency components of individual spikes.
These results suggest that the gamma-band activity is generated by ensembles of neurons that are larger than local populations measured as multi-unit activity. More likely it resembles the activity of neurons from an area spanning several hundred micrometers, as indicated by the ocular dominance correlation between MU activity and LFP (Figure 8
A). These conclusions are compatible with at least two hypotheses regarding the underlying mechanism generating the LFP:
a. Based on modeling studies, it is possible that the brain acts like a capacitive filter and therefore lower frequencies are attenuated less than higher frequencies (Bedard et al., 2004
). Assuming a flat local LFP spectrum, in this case, one would expect an inverse relationship between the spatial scale of organization of the stimulus property under study and frequency bands tuned to it. A stimulus property represented at fine spatial scale like orientation tuning in V1 is reflected only in higher frequency bands of the LFP signal, because the generating signals must be strongly attenuated to produce a measurement with high enough spatial resolution. In converse, when a stimulus property is organized on a much larger scale like ocular dominance columns, the attenuation at medium frequencies might suffice to capture the properties of local populations of neurons. However, there is direct experimental evidence against the capacitive filtering model. Studies in the rabbit cortex (Ranck, 1963
) showing that the impedance spectrum of the cortex is rather flat have recently been confirmed by detailed measurements in monkey cortex (Logothetis et al., 2007
).
b. An alternative parsimonious explanation for our findings which does not depend on the capacitive filtering model is the following: Oscillations in the local field potential are generated by neural populations of distinct size and power acting as potential generators at different frequencies (Logothetis et al., 2007
). Small, weak generators might oscillate at high frequencies, like small local groups of neurons, and strong, larger generators at low frequencies, possibly reflecting coherent subcortical input (Logothetis et al., 2007
; Steriade, 2006
). Locally, this would lead to a power spectrum with roughly exponential decay. If attenuation takes place independently of frequency (Logothetis et al., 2007
; Ranck, 1963
), frequencies with more power generated by stronger neural generators will propagate farther through the tissue. This leads to higher correlations between LFP power and MU activity at higher frequencies, as these have less power and are therefore more local.
Under visual stimulation, the maximal power increase can be found in the gamma-range, as we and others have reported (Frien et al., 2000
). Under the above model, oscillators of this particular frequency become stronger under visual stimulation, possibly reflecting the coherent activity of local populations of neurons. Indeed, the gamma band of the LFP has been interpreted as the “working regime” of cortical neurons: the activity of neurons is temporally structured by a sub-threshold oscillatory process indicated by coherence between spike trains and the LFP at this frequency band (Siegel and Konig, 2003
). As the power of the signal in this band is increased under visual stimulation, however, it spreads further and gets averaged over a wider area of cortical tissue.
Note that averaging over a larger area does not necessarily lead to no tuning at all: It has been shown that even 3 × 3 × 3 mm voxels in fMRI data can be used to decode orientation from human primary visual cortex (Haynes and Rees, 2005
). This explains naturally why the preferred orientations of all our sites scatter around a single value per monkey (Figure 5
) and LFP tuning is weaker than MU tuning (Figure 4
): As we record from a chronically implanted tetrode array with closely spaced tetrodes (maximal distance: ∼750–1000 μm) and the LFP integrates over a relatively large area of cortical tissue, this local average is seemingly insensitive to the tetrode location and is blurred compared to the MU (Figure 4
).
At frequencies higher than the gamma-band, we observe a stronger correlation between preferred orientations of LFP and MU for tuned sites in contrast to the weak correlation between the preferred orientation of the gamma band of the LFP and MU. However, compared to the gamma-band we find only a minority of the LFP sites to be tuned to the stimulus at these higher frequencies (compare Figure 3
B and C). Under our second hypothesis, it is likely due to the fact that high-frequency generators are smaller and have less power, thereby creating a weaker, but more localized signal. As mentioned before, given that action potentials have power around this higher frequency range, it could also be the case that these high correlations result from low-frequency components of individual spikes leaking into the LFP measurement.
In contrast, ocular dominance properties of MU recordings are reflected well in the gamma-band of the LFP, because neural populations generating a coherently oscillating dipole in response to the stimulation of one eye are large enough (i.e. about the size of ocular dominance columns of ∼450 μm) to be faithfully picked up using the LFP.
Recording Location in the Orientation Map
Naturally, the exact position of the recording electrode within the orientation map has an important impact on the strength of the correlation between MU and LFP preferred orientations. For instance in the middle of a linear zone that can stretch out for several hundred micrometers, the two are likely to be well correlated, as the main signal generators for both signals all have the same preferred orientation, despite the fact that MU activity originates from ∼65–100 μm around the electrode tip (Gray et al., 1995
) and LFP gamma-band under the above model from several hundred micrometers. This is different, however, close to a singularity or pinwheel. Although orientation preferences of single neurons are arranged in a highly ordered manner (Ohki et al., 2006
), only the MU activity will reflect the local processing structure well. The LFP power is in this case strongly modulated by groups of neurons with widely varying orientation preferences due to the pinwheel structure and possibly dominated by neurons with a completely different preferred orientation than the MU activity at the tetrode tip. Therefore, it should be less tuned than LFP signals in linear zones. In agreement with this line of thought, we find that a group of sites with a small difference in orientation preference between LFP and MU has on average a more strongly tuned LFP gamma-band signal, than sites where orientation preferences differ a lot (Figure 6
). It is tempting to speculate that this result indeed reflects the recording location in the orientation map. Interestingly, a recent study has found that even single units in parts of the orientation map where many different orientations are represented are less tuned than in linear zones (Nauhaus et al., 2008
), lending further support to this interpretation. We plan to investigate this further by combining tetrode recordings with optical imaging in the awake macaque.
Relationship to Other Cortical Areas and Functional Properties
In a recent study, the authors compared the speed and direction tuning properties of MU activity and LFP in area MT (Liu and Newsome, 2006
). Comparable to our results from the ocular dominance analysis, they also find a correlation on the scale of speed tuning [300–600 μm; (Liu and Newsome, 2003
)]. In addition, they report a near perfect correlation between the two signals when looking at direction of motion tuning curves. Direction of motion is believed to be represented in MT on a similar spatial scale as orientation tuning in V1 (Albright et al., 1984
). The major difference between our and their study is that we used a grating stimulus that was large compared to the typical receptive field size in V1 and covered several degrees of the visual field. On the contrary, Liu and Newsome optimized their stimulus size for maximal MU response (Liu and Newsome, 2003
, 2006
). It has been shown that unlike the MU response the LFP response monotonically increases when a grating stimulus is enlarged (Gieselmann and Thiele, 2007
), even beyond a point where MU activity decreases again because of possible center-surround effects. This naturally could explain the apparent difference: While in our study large neuronal ensembles with differing orientation tuning get simultaneously activated although the stimulus orientation might not be optimal for all of them, Liu and Newsome record more localized signals from groups of neurons around their electrode since these are the only ones excited. Thus, to assess the feature selectivity of the LFP and the related issue of its spatial resolution large stimuli relative to the receptive field size are better suited than small stimuli. Furthermore, our findings are in good agreement with a recent study in auditory cortex (Kayser et al., 2007
) which also finds a weak correlation between MU and LFP preferred frequencies in the gamma-range rising to a strong correlation at 80 Hz and higher.
The Role of Synaptic Input and Interneurons
It is also conceivable that we find differences in orientation preferences of the gamma-band LFP and the MU activity because the LFP does not measure spiking output but rather synaptic input to a local group of neurons. Therefore our results might not reflect differences in spatial integration properties between the two signals but rather a difference in the orientation tuning of synaptic inputs and cortical outputs. In the macaque, however, orientation tuning is thought to be generated within V1 circuits in layer 4C, whereas the thalamic input is largely untuned (Hubel and Wiesel, 1968
; Lund et al., 2003
). While untuned synaptic input from the thalamus might contribute to the diminished tuning strength of the LFP signal compared to the MU activity (Figure 4
), it is unlikely to be the source of the discrepancy in the preferred orientations of the two signals. As in addition to postsynaptic potentials, the local field potential likely also measures several nonsynaptic events like spike afterpotentials or intrinsic neural currents across membranes (Buzsaki, 2002
; Logothetis and Wandell, 2004
; Logothetis et al., 2007
) the feature tuning observed in the spiking responses should also be reflected in the tuning of the LFP. It cannot be excluded, however, that synaptic input from lateral connections or feedback projections from other cortical areas that is tuned differently than the local spiking activity contributes to the observed difference in orientation tuning. Moreover, populations of inhibitory interneurons might dominate the increase in gamma power (Henrie and Shapley, 2005
), as inhibitory postsynaptic currents have been shown to exhibit stronger gamma modulation and larger synchrony between neighboring cells than excitatory currents (Hasenstaub et al., 2005
). Therefore, it is possible that differences between LFP and MU orientation tuning could reflect differences between the tuning of interneurons and pyramidal neurons.
LFP for Cortical Motor Prostheses
Recently the use of LFP signals for the decoding of movement directions has become popular (Andersen et al., 2004
; Rickert et al., 2005
) for it is comparably easy to obtain and can be used without need for complex post-processing like single-unit isolation. One study shows the LFP to be superior to the MU activity for decoding movement direction (Mehring et al., 2003
). Our findings have important implications of the use of LFP signals for prosthetic devices. Given that our data show that the LFP reflects activity from an area of probably at least the size of ocular dominance columns in V1 (∼450 μm), certainly larger than fine spatial representation of orientation tuning (∼50 μm), the LFP does not seem to be a good choice for decoding parameters which are spatially organized at a smaller scale if other signals with a better signal to noise ratio are available. In other words, the LFP is better suited to be used in the regions of the brain where the spatial organization is at least at order of hundreds of microns. In practical applications this result has to be carefully weighted against other factors like implant lifetime as well as MU activity and single unit isolation quality and stability. Nevertheless, recent advances in chronic multi-tetrode recordings in non-human primates with the capability to record from the same neurons across many days and weeks (Tolias et al., 2007
) combined with online single unit isolation and sophisticated machine learning algorithms (Eichhorn et al., 2004
; Shpigelmann et al., 2005
) may help improve the quality of cortical motor prostheses.
While the intricate relationship between the LFP signal, spikes, and synaptic events in single neurons is not yet fully understood, the gamma-band activity as measured with extracellular tetrodes seems to be generated by ensembles of neurons larger than 50–100 μm, as the spatial organization of V1 suggests. It resembles the activity of neurons from an area spanning a few hundred micrometers of cortical tissue. Exploiting the organization of physiological properties in primary visual cortex we have been able to provide evidence for a lower bound on the spatial resolution of the local field potential. These results cast some doubt on the prevalent interpretation of coherence between close-by LFP sites as a sign of local synchrony, but rather suggest that part of these findings may be attributed to the poor spatial resolution of the LFP as a measuring tool. We suggest that more care is needed in the interpretation of findings based on the LFP and argue for an increased effort to the study of well-isolated neurons.
The authors declare that the research was conducted in the absence of any commercial or financial relationships that could be construed as a potential conflict of interest.
This work was supported by the Max Planck Society and a National Research Service Award from the National Eye Institute (NEI) of the National Institutes of Health to AST. We thank Axel Oeltermann for extensive discussion on the nature of the LFP signal, Athanassios Siapas for useful discussions and comments on the manuscript as well as Arthur Gretton, Edward Tehovnik, Jakob Macke, and Stelios Smirnakis for comments on the manuscript.
Eichhorn, J., Tolias, A. S., Zien, A., Kuss, M., Rasmussen, C. E., Weston, J., Logothetis, N. K., and Schölkopf, B. (2004). Prediction on spike data using Kernel algorithms. Advances in neural information processing systems. In Proceedings of the Seventeenth Annual Conference on Neural Information Processing Systems (NIPS 2003), Vol. 16, S. Thrun, L. K. Saul and B. Schölkopf, eds (Cambridge, MA, MIT Press), pp. 1367–1374.
Gieselmann, M. A., and Thiele, A. (2007). Firing rate and local field potential provide complementary information regarding spatial summation and centre-surround influences in primary visual cortex of the awake macaque monkey. In Proceedings of the 7th Meeting of the German Neuroscience Society/31th Göttingen Neurobiology Conference 2007, K.-P. Hoffmann and K. Krieglstein, eds (Göttingen, German Neuroscience Society).