3D-reconstructions and virtual 4D-visualization to study metamorphic brain development in the sphinx moth Manduca sexta
Department of Biology, Animal Physiology, Philipps-University Marburg, Marburg, Germany
During metamorphosis, the transition from the larva to the adult, the insect brain undergoes considerable remodeling: new neurons are integrated while larval neurons are remodeled or eliminated. One well acknowledged model to study metamorphic brain development is the sphinx moth Manduca sexta. To further understand mechanisms involved in the metamorphic transition of the brain we generated a 3D standard brain based on selected brain areas of adult females and 3D reconstructed the same areas during defined stages of pupal development. Selected brain areas include for example mushroom bodies, central complex, antennal- and optic lobes. With this approach we eventually want to quantify developmental changes in neuropilar architecture, but also quantify changes in the neuronal complement and monitor the development of selected neuronal populations. Furthermore, we used a modeling software (Cinema 4D) to create a virtual 4D brain, morphing through its developmental stages. Thus the didactical advantages of 3D visualization are expanded to better comprehend complex processes of neuropil formation and remodeling during development. To obtain datasets of the M. sexta brain areas, we stained whole brains with an antiserum against the synaptic vesicle protein synapsin. Such labeled brains were then scanned with a confocal laser scanning microscope and selected neuropils were reconstructed with the 3D software AMIRA 4.1.
Brains are typically organized in defined neuropils, which can usually be characterized by their spatial location, gross anatomy, and often by a certain function and brains of evolutionary related animals typically share a similar neuroarchitecture. During development, the formation of brain neuropils including their location and interconnections follows a minute pattern in time and space orchestrated by complex (genetical) programs which eventually give rise to the adult brain structures.
Metamorphosis, the transition of a larva to an adult insect has always fascinated us humans. By far, most of the living insects belong to the group of holometabolous insects (Grimaldi and Engel, 2005
) which have in addition to the embryonic development a second developmental phase called metamorphosis. During metamorphosis, as demonstrated by many researchers over the years, the nervous system undergoes considerable remodeling: new neurons are integrated while larval neurons are remodeled or eliminated (for reviews see e.g. Truman, 2009
, 1996
). Most obvious, neuropils involved in the processing of visual and olfactory information are to a large extent newly formed during metamorphosis. To understand further the mechanisms involved in transforming a larval to an adult brain, we have mapped the anatomical changes of selected brain areas throughout metamorphosis of the sphinx moth Manduca sexta. M. sexta serves since long as a model to understand metamorphic brain development and the development of most of the discernable brain areas has been described earlier (see Discussion). However, so far a comprehensive view which compares the anatomical changes of all these brain neuropils throughout metamorphic development is missing. Thus, the aim of the current study was to visualize the anatomical changes of discernable brain areas in parallel and thus to provide a tool which allows a comparison of these changes along the developmental time line.
To obtain the desired datasets, we labeled whole brains of different metamorphic stages with an antiserum against the synaptic vesicle protein synapsin to visualize neuropil areas, analyzed the staining using confocal laser scanning microscopy, 3D reconstructed the selected brain neuropils using the software AMIRA (Visage Imaging, Fürth, Germany), and subsequently transformed the data sets into the 4D visualization software Cinema 4D. The used technique can in principal be adapted to any brain area which can be visualized and 3D reconstructed at different times of development.
Animals
Moths (M. sexta; Lepidoptera: Sphingidae) were raised at 26°C under a long-day photoperiod (L:D = 17:7) and were fed on an artificial diet (Bell and Joachim, 1978
). Under these conditions animals required 18 days from hatching to pupal ecdysis and another 20 days from pupal ecdysis to adult eclosion. The wandering stage presents the last phase of the fifth larval stage (L5) and consists of about 5 days (W0–W4). The beginning of this stage (W0) is characterized by the occurrence of a red pigment along the dorsal vessel. At about noon of W2, the animals go into a quiescent prepupal stage. Pupal ecdysis occurs on day W4, and the newly formed pupa is designated as day P0. Subsequent days of pupal development are counted as P1-P20. The freshly eclosed adult individual is termed A0. The staging of larvae and pupae was based on the criteria described by Schwartz and Truman (1983) and Jindra et al. (1997)
. For our experiments we used only female animals.
To describe, visualize and animate the development of the brain of M. sexta during pupal metamorphosis we 3D-reconstructed brains from defined pupal stages. We reconstructed two brains of representative stages (except stage P4; n = 1), including the fifth instar larva (L5) and nine pupal stages during metamorphosis (P0; P1; P3; P4; P7; P9; P11; P14; P16). As adult brain we used the M. sexta standard brain (freshly eclosed, A0) for our animation (el Jundi et al., 2009
).
Immunohistochemistry
For our studies we used a wholemount staining protocol as described in el Jundi et al. (2009)
. Brains from different developmental stages were dissected out of the head capsule under cold saline (Weevers, 1966
) and were fixed overnight at 4°C, in a solution composed of one part formaldehyde (37%, Roth, Karlsruhe, Germany), one part methanol and eight parts phosphate-buffered saline (PBS 0.01 M, pH 7.4). Whole brains were rinsed in 0.1 M PBS containing 0.3% Triton X-100 (PBT) for 1 h at room temperature and were preincubated (4°C, overnight) in 5% normal goat serum (NGS; Jackson ImmunoResearch, Westgrove, PA, USA) in 0.1 M PBT containing 0.02% sodium azide. For visualization of the brain areas we used a monoclonal primary antibody from mouse against a fusion protein consisting of a glutathione-S-transferase and the first amino acids of the presynaptic vesicle protein synapsin I coded by its 5′-end (SYNORF1, Klagges et al., 1996
, kindly provided by Dr. E. Buchner, Würzburg). Its specificity in M. sexta was shown in western blots by Utz et al. (2008)
. The anti-synapsin antibody was diluted 1:50 in 0.1 M PBT containing 1% NGS and 0.02% sodium azide.
After 4–6 days incubation with the primary antibody, the brains were rinsed 6 times in 2 h with PBT before they were incubated with the secondary goat anti-mouse antibody conjugated to Cy5 (1:300; Jackson ImmunoResearch, Westgrove, PA, USA) in PBT and 1% NGS for 4 days at 4°C. Afterwards, the brains were rinsed with PBT 6 times in 2 h, then dehydrated in an ascending ethanol series (50–100%, 15 min each) and then cleared in methyl salicylate (Merck, Gernsheim, Germany) for about 40 min. At last the brains were mounted in Permount (Fisher Scientific, Pittsbourgh, PA, USA) between two coverslips. Compression of brains was prevented by spacers (Zweckform, Oberlaindern, Germany). According to the brain sizes we used for larval brains (L5) and early pupal brains three to five spacers (P0–P4). Late pupal brains (P7–P16) were embedded using six to nine spacers.
Image Acquisition
All brains were scanned with a confocal laser scanning microscope (Leica TCS SP2). The fluorescent signal of Cy5 was detected with a HeNe laser (633 nm). Late pupal brains (P7–P16) were imaged at 512 × 512 pixel resolution by using a 10× oil immersion objective (HC PL APO 10×/NA: 0.40 Imm (working distance: 0.36 mm); Leica, Bensheim, Germany). Larval and early pupal brains (L5–P4) were scanned with a 10× oil objective or a 20× oil objective (HC PL APO 20×/0.70 lmm Corr CS, Leica, Bensheim, Germany). All brains were scanned with a voxel size of 2.9 × 2.9 µm in xy-direction. Late pupal brains were imaged with a step size of 2 µm, younger brains were detected with a step size of 1.5 µm. The thickness of older brains and the limited working distance of the objectives made it necessary to scan the brains from two sides (anterior and posterior) to eventually acquire images of the whole brain. Younger brains were scanned only from anterior. Depending on xy dimension which increased with the developmental stage the brains had to be scanned in two and up to eight image stacks. For example, for P16 brains we needed three stacks from anterior and another three stacks from the posterior side. For A0 brains four stacks from each side were needed (el Jundi et al., 2009
).
Image Processing and 3D Reconstruction
Image processing and 3D reconstruction were performed in the program AMIRA 4.1 (Visage Imaging, Fürth, Germany). First the different image stacks of all brain regions were merged into one stack: corresponding optical slices in the z direction in overlapping parts of the image stacks were found with the module AlignSlices, redundant slices of the stacks were abolished and corresponding batches of data were merged with the module AlignSlices. Before we merged these image stacks in xy direction, computation limits made it necessary to downsample the voxel size of the image stacks of P7–P16 pupal brains with the module Resample to a voxel size of 6 × 6 × 6 µm. For brains < P7 it was not essential to downsample the image stacks. Again, we used the module AlignSlices for finding the corresponding optical slice and with the module Merge batches of data were merged into one batch of data which contained the whole brain.
For 3D reconstructions, Labelfield files were created with the same dimensions (voxel size, resolution) as the corresponding merged image stacks. Using the Segmentation Editor, reconstructions of selected neuropils were performed. Regions of interests were labeled in three dimensions in several optical slices and subsequently extrapolated into 3D structures by using the tool Wrap. Clearly identifiable neuropilar borders in all three dimensions based on anti-synapsin staining were the limiting criterion for reconstructing a brain region in a certain developmental stage. The color codes for neuropils are consistent with existing standard brain models (Brandt et al., 2005
; Kurylas et al., 2008
; el Jundi et al., 2009
; Dreyer et al., 2010
). With the module SurfaceGen the 3D surface visualizations were calculated. Based on visual appearance, surface models of brains which represented the according stage best were used for 4D visualization of the brain development during the metamorphosis.
4D Visualization
To animate the development of the brain of M. sexta during metamorphosis we reconstructed brains ranging from the last larval stage (L5) to brains of freshly eclosed animals (A0). Because of the limited computational capacity it was necessary to reduce the number of the polygons of the surface models in AMIRA. Subsequently, representative brains of distinct developmental stages were exported from Amira as drawing exchange format (.dxf) files and were opened in the software Cinema 4D (v.10.1; MAXON Computer, Friedrichsdorf, Germany). Only those brains were chosen which clearly exhibited representative features of their stage. Using those brain polygon models as templates, the 4D visualization of brain development was created in Cinema 4D. The creation of the 4D visualization of the M. sexta brain is described in detail in the results.
Anatomical Development of the Brain Neuropils
Overall, we reconstructed 19 female brains from 10 different stages during M. sexta brain development. In an earlier study we already reconstructed 12 brains of freshly eclosed adult females (A0) to produce a standard brain (el Jundi et al., 2009
). Since we wanted to cover the brain transition between the larval and the adult brain during pupal development, we started with fifth instar larval brains, chose nine stages during pupal development (P0, P1, P3, P4, P7, P9, P11, P14, P16) and closed with the female A0 standard brain (el Jundi et al., 2009
). Because early metamorphic development coincides with more obvious structural changes, these phases were resolved with higher temporal resolution. During the approximately 3 weeks of pupal development, the Manduca brain undergoes an enormous increase in size (the reconstructed neuropils grow about 132-fold from P0 to A0), which is largely due to the development of the optic lobes (Figure 1
). But all other parts of the brain also increase in size, and further developmental processes in the brain take place (Figures 2
–6
). Most prominently, the subesophageal ganglion merges with the supraesophageal ganglion, thereby forming the esophageal foramen. This process is initiated during the wandering stage and is finished around P3 (Amos and Mesce, 1994
; Homberg and Hildebrand, 1994
). Additionally, the metamorphosing brain undergoes certain rotational movements, mirrored in the orientation of neuropils in the brain: (1) Neuropils located anteriorly move upwards (mushroom body lobes, antennal lobes), (2) the brain midline folds slightly outwards towards the dorsal side (orientation of mushroom body calyces), and (3) central parts of the protocerebrum tilt back (mushroom body peduncles with calyces, central complex). Most of these movements are finished until P7/8, followed by further size increase of all neuropils. Because these movement and growth processes are temporally overlapping we created a 4D movie for better comprehension (see below; Movie S1 in Supplementary Material). Below, all major neuropils are dealt with in more detail.
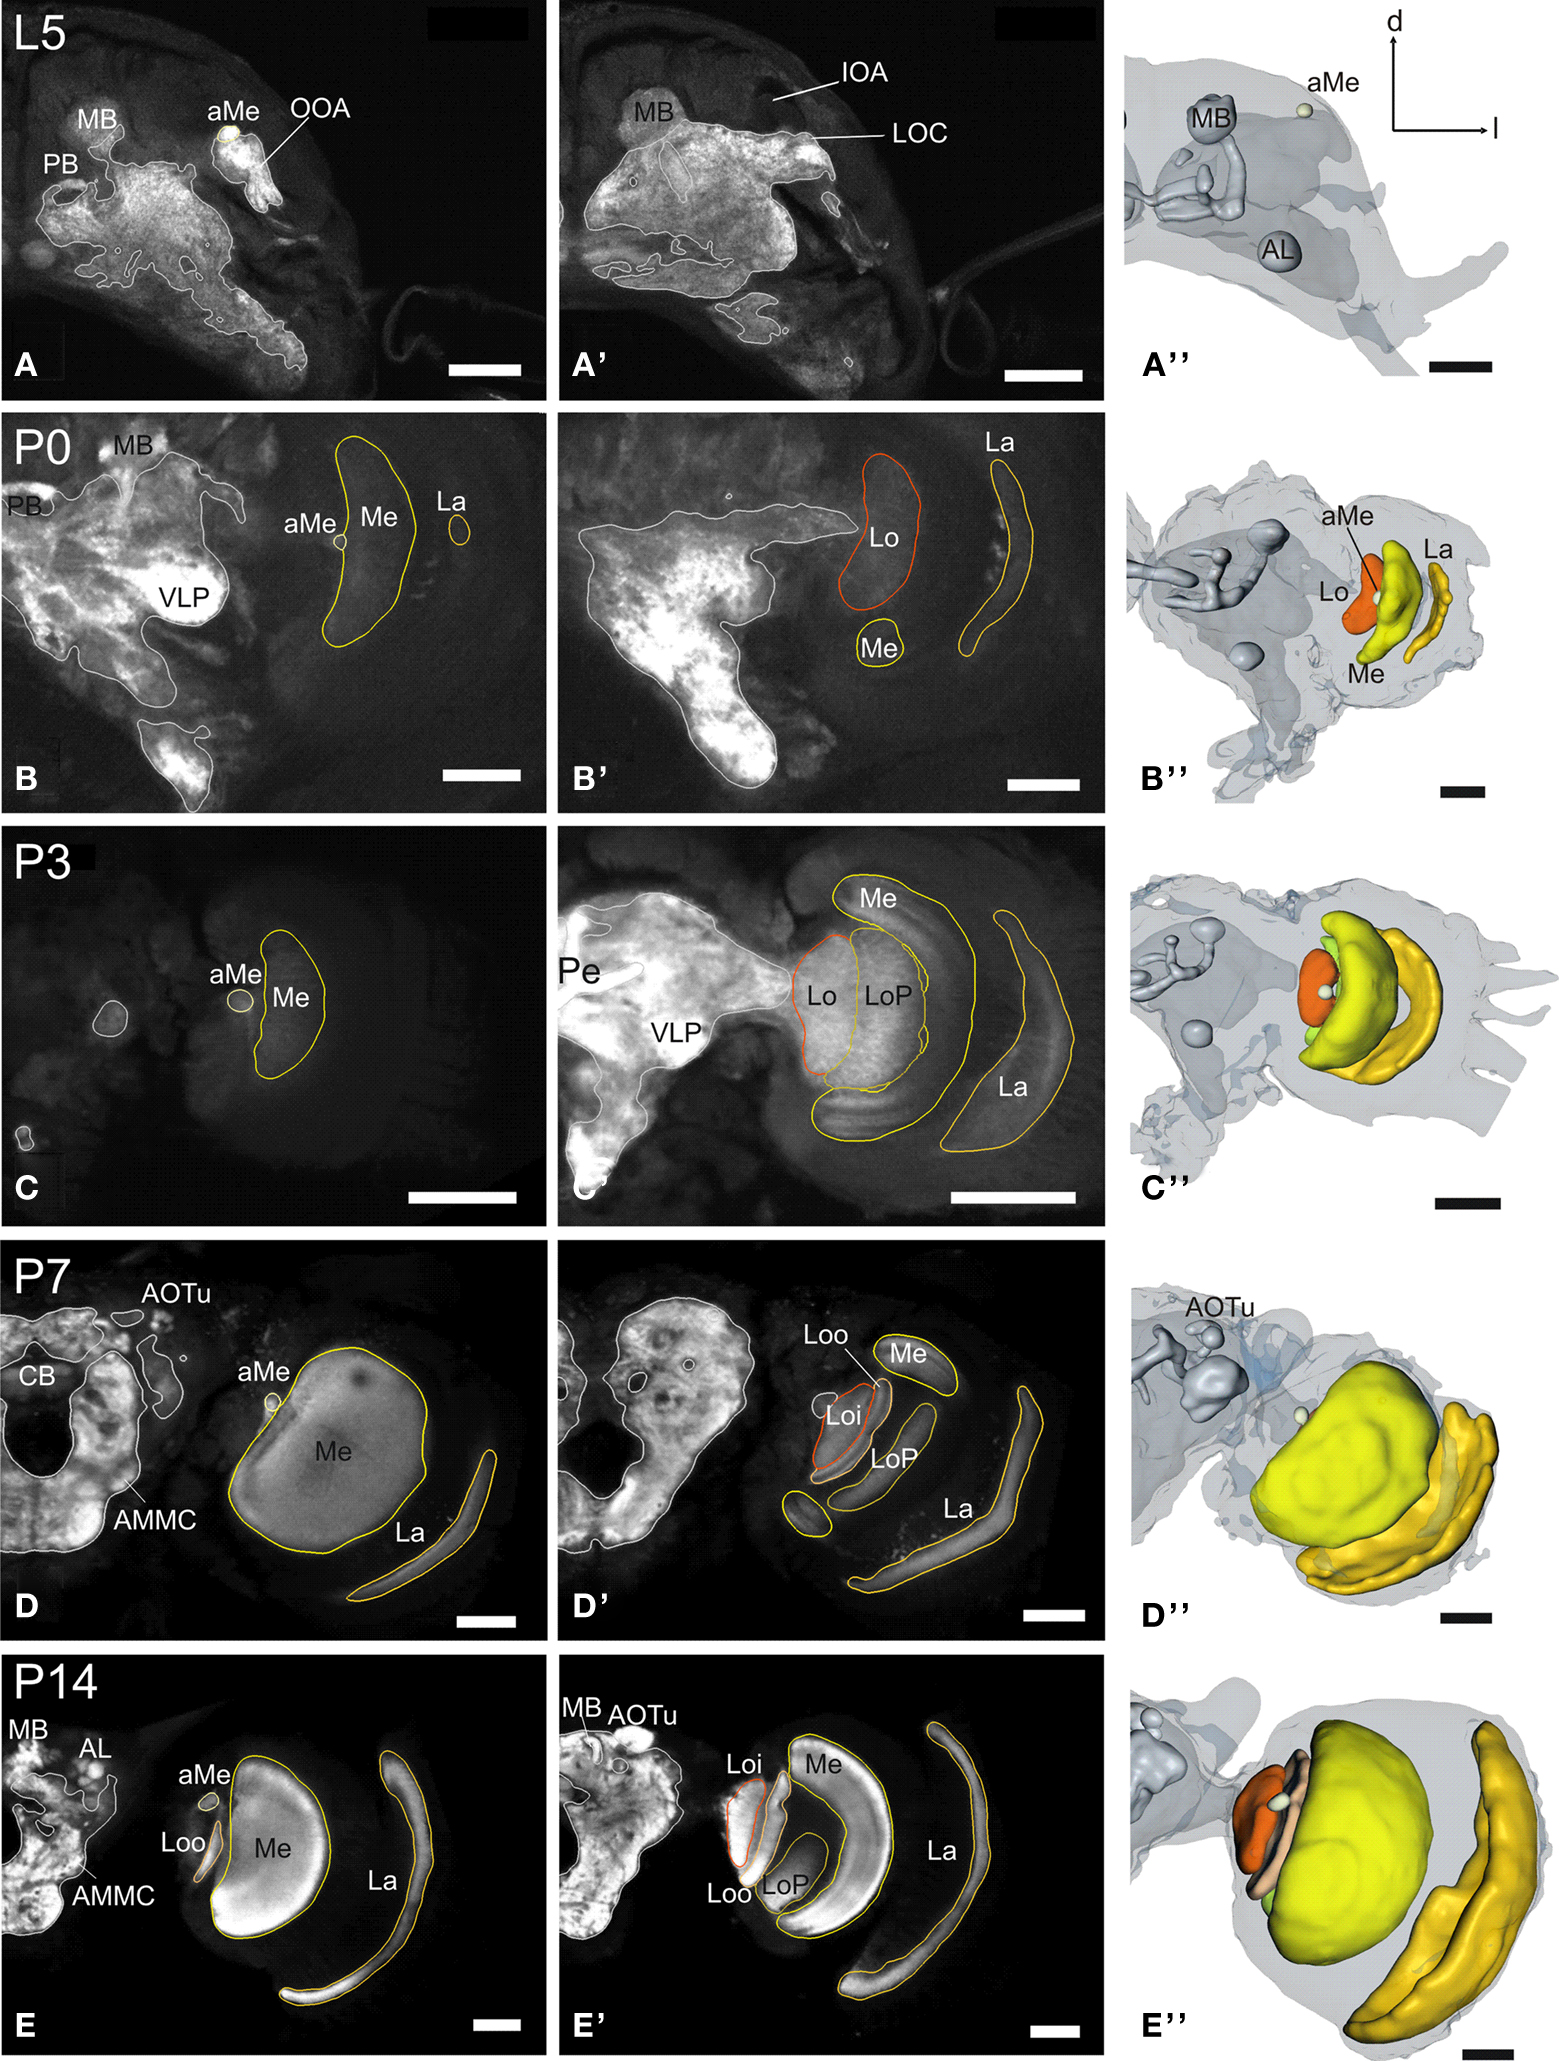
Figure 1. Development of the adult optic lobe. Single optical sections in the frontal plane at different depths, anti-synapsin immunostaining (left two columns). Right column, 3D reconstructions (frontal views). (A–A′′) Last larval stage (L5): the larval optic center (LOC) is hardly distinguishable from the midbrain neuropil (gray line). The accessory medulla (aMe) is part of the LOC. IOA, inner optic anlage; OOA, outer optic anlage. (B–B′′) Stage P0: the ribbon-like adult neuropils lamina (La), medulla (Me) and lobula (Lo) show faint anti-synapsin staining. The aMe is separated from the midbrain neuropil and stays close to the antero-medial rim of the Me. Note the strong anti-synapsin immunoreactivity in the ventrolateral protocerebrum (VLP). (C–C′′) Stage P3: the La and Me further expand and the dorsal and ventral tips of the La bend behind the Me. The lobula plate (LoP) appears between Me and Lo. The anti-synapsin staining gains intensity in all neuropils; layers of the Me become recognizable. (D–D′′) Stage P7: the inner and outer lobula (Loi, Loo) can be separated. The La starts to exhibit its bowl-like appearance, the opening still tilted towards the anterior side. (E–E′′) Stage P14: all optic lobe neuropils reached their final adult positions. Orientation bars: d, dorsal; l, lateral; scale bars: 100 µm (A–B′′); 200 µm (C–E′′).
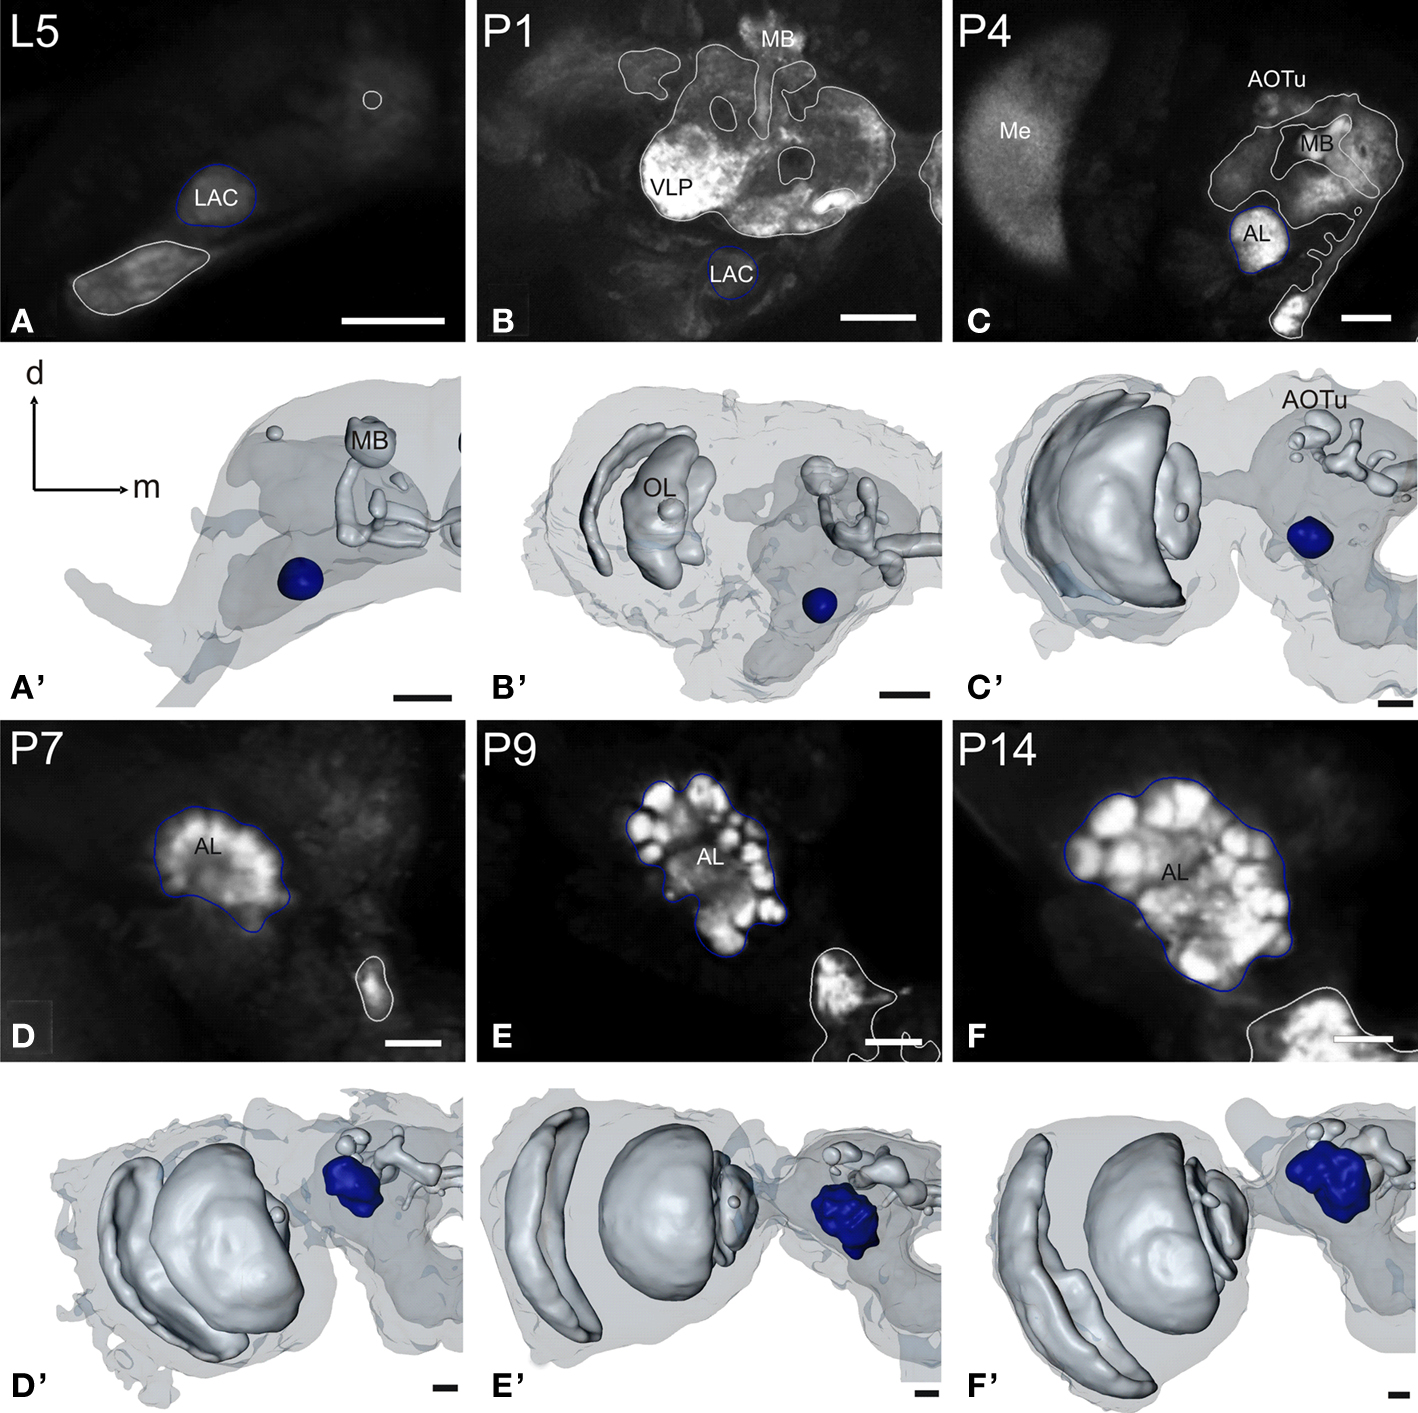
Figure 2. Development of the antennal lobe. Single optical sections in the frontal plane, anti-synapsin immunostaining (first and third row). Second and fourth row, 3D reconstructions (frontal views). (A–A′) The larval antennal center (LAC) exhibits no glomerular organization in Manduca sexta L5 larva. (B–B′) Strong anti-synapsin immunoreactivity is visible in the ventro-lateral protocerebrum (VLP), compared to the weak labeling in the LAC/AL. (C–C′) Stage P4: the developing AL becomes recognizable in the anti-synapsin staining. Note the ventral position of the AL compared to stage P7. (D–D′) Stage P7: glomerular structures surrounding a coarse neuropil become first visible. (E–E′) Stage P9: single glomeruli become discernible structures and achieve their final position within the AL. The dorsal migration of the AL ends. (F–F′) Stage P14: glomerular and AL volume increased compared to stage P9. Orientation bars: d, dorsal; m, medial; all scale bars: 100 µm.
The optic lobes
In the last larval stage (5th instar; L5), the larval optic center (LOC), is barely separated from the midbrain neuropil (Figure 1
, gray line). The inner (IOA) and outer optic anlagen (OOA), the precursors of the adult optic neuropils, are already present, although they exhibit almost no anti-synapsin immunoreactivity at this stage. At this early stage, the accessory medulla (aMe) is still part of the LOC. Several other neuropils are already distinguishable, the larval antennal lobe (see Figure 2
), the calyx (Ca) and peduncle (Pe) of the mushroom body (see Figure 3
), and the protocerebral bridge (PB; see Figure 4
). With the onset of pupation (P0), the optic lobe neuropils begin to grow and the now ribbon-like neuropils lamina (La), medulla (Me) and lobula (Lo) begin to show faint anti- synapsin staining. At this stage, the aMe is separated from the midbrain neuropil and stays close to the antero-medial rim of the Me. At P3 the outer optic neuropils further expand mainly along the antero-posterior axis; the dorsal and ventral tips of the La bend behind the Me, thus resembling a horseshoe. The lobula plate (LoP) appears as a discernible structure between Me and Lo. The anti-synapsin staining gains intensity in all neuropils; the different layers of the Me become recognizable (Figure 1
C′). After one third of pupal development (P7), the inner and outer lobula subunits (Loi, Loo) can be separated based on their anti-synapsin immunoreactivity. The La starts to exhibit its bowl-like appearance, the opening still tilted towards the anterior side. Three subunits of the anterior optic tubercle (AOTu, see Figure 5
) are now present in the antero-dorsal protocerebrum. After two-thirds of pupal development (P14) all neuropils of the optic lobe reached their relative position and continue to increase in size until adult eclosion. The relative distance between La and Me increased up to here.
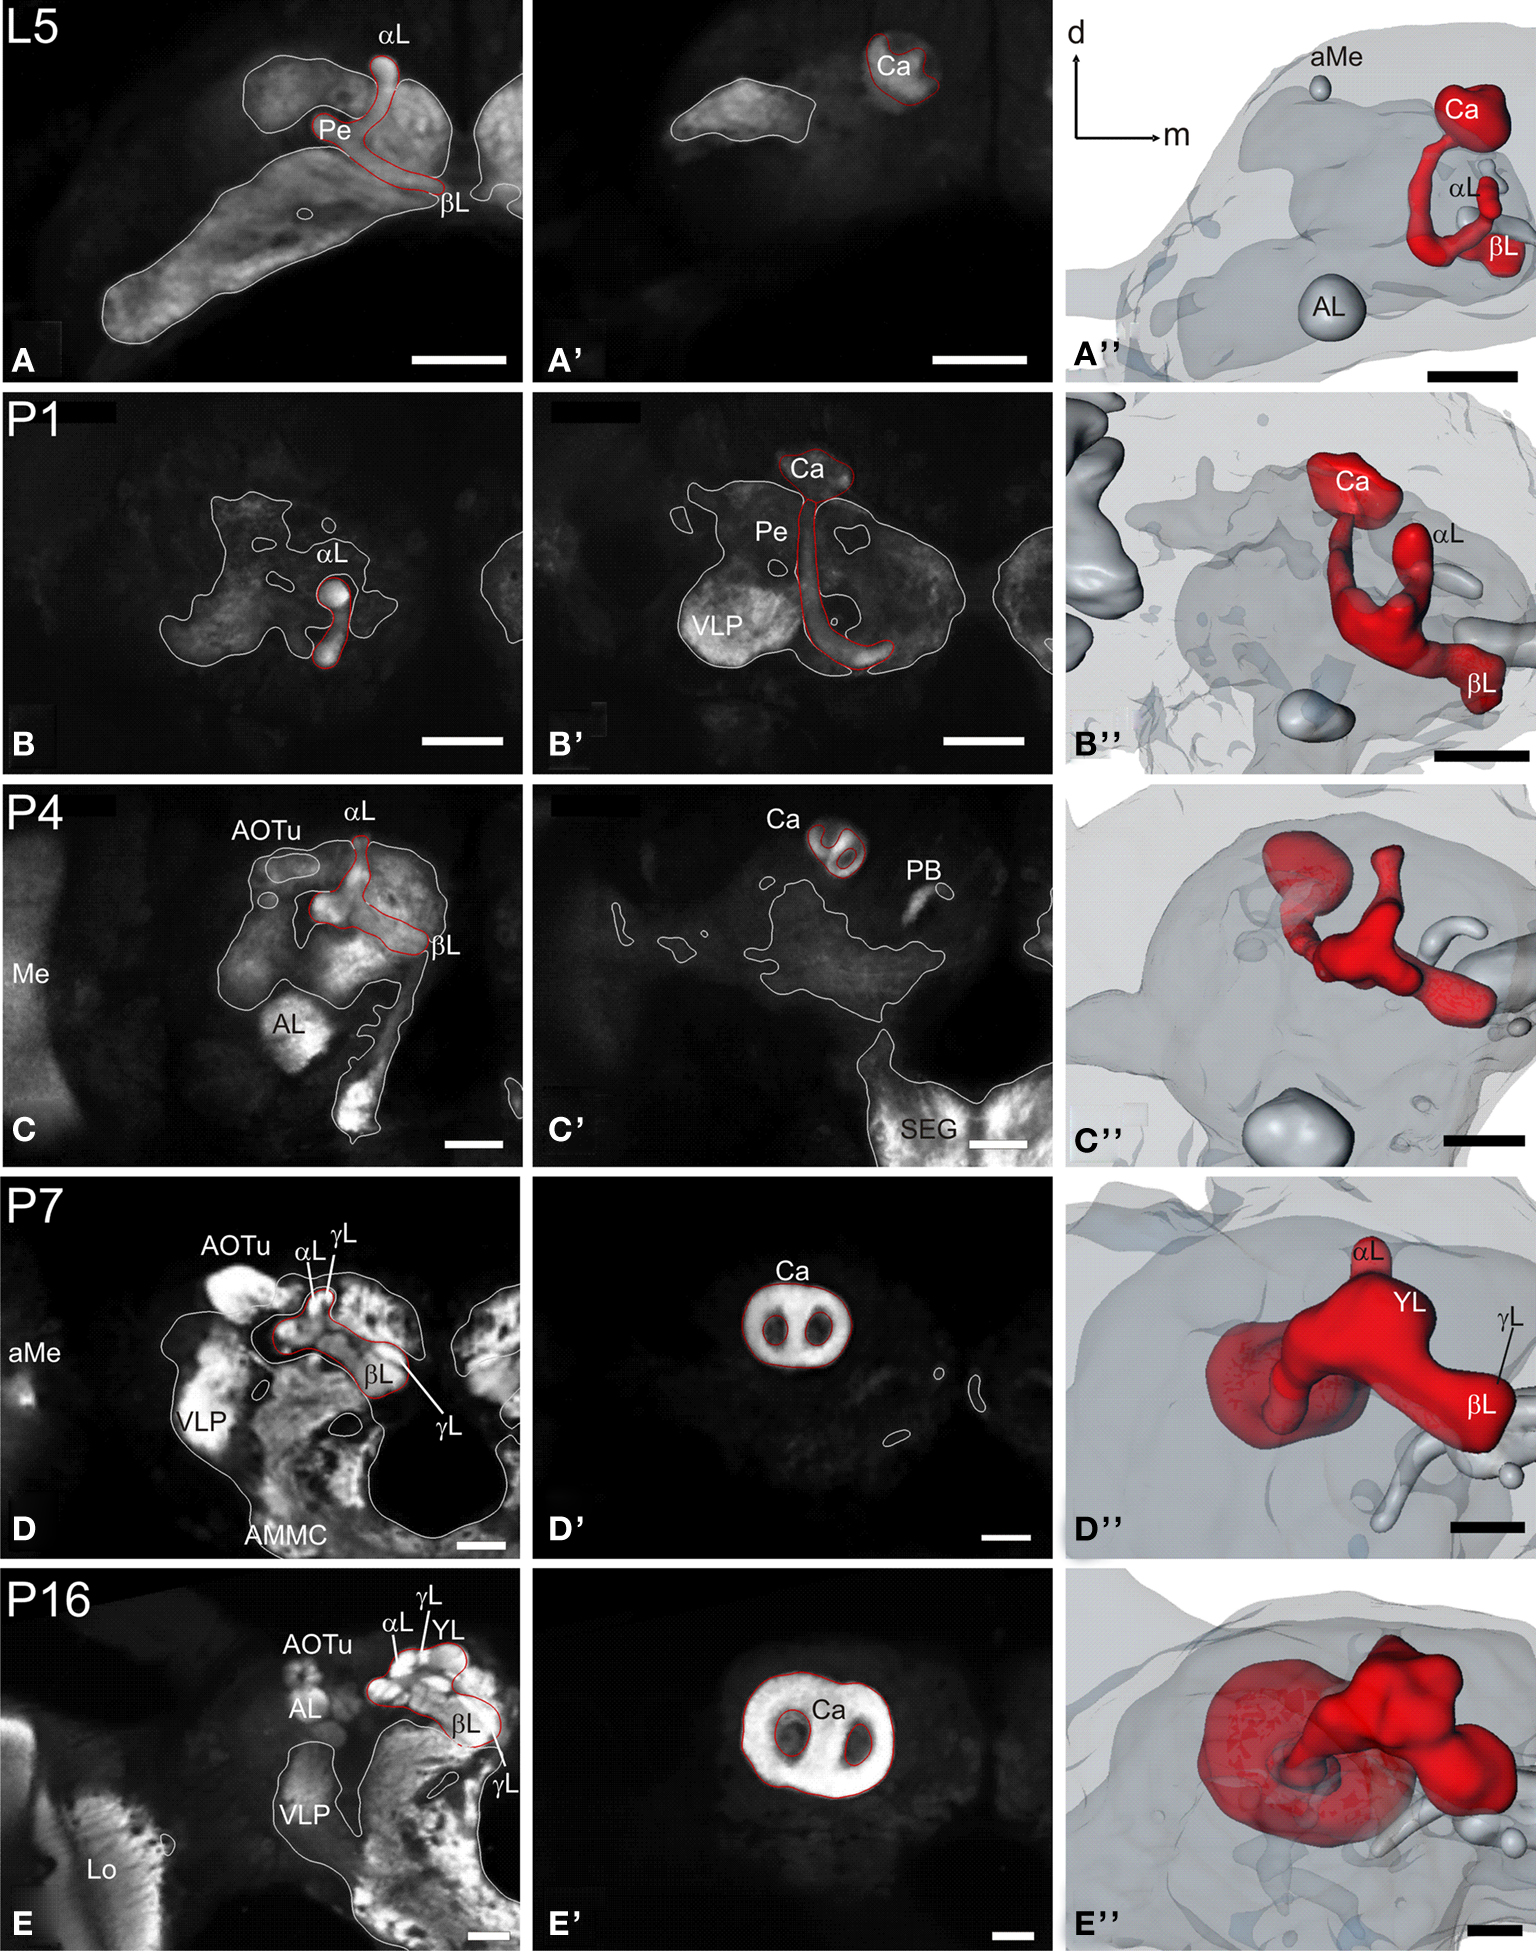
Figure 3. Development of the mushroom body. Single optical sections in the frontal plane at different depths, anti-synapsin immunostaining (left two columns). Right column, 3D reconstructions (frontal views). (A–A′′) Rather thin α-and β-lobes (αL, βL) and a slender peduncle are characteristic for the larval (L5) mushroom body (MB). The peduncle of the larval MB is oriented antero-ventrally, with a slight inclination of the calyces (Ca) to the dorsal midline. While the αL points antero-dorsally, the βL extends medially in the horizontal plane. (B–B′′) early pupae (P1): the peduncle shows a straightened orientation. (C–C′′) Stage P4: the MB tilts from a ventro-dorsal orientation to a more antero-posterior orientation. (D–D′′) Stage P7: the MB is oriented antero-posteriorly and has massively increased in size compared to stage P4. Additionally to the αL and βL, the γ-lobe (γL) and the Y-lobe (YL) appear as protrusions on the MB. (E–E′′) Stage P16: the MB reached its final adult orientation and shape. Orientation bars: d, dorsal; m, medial; all scale bars: 100 µm.
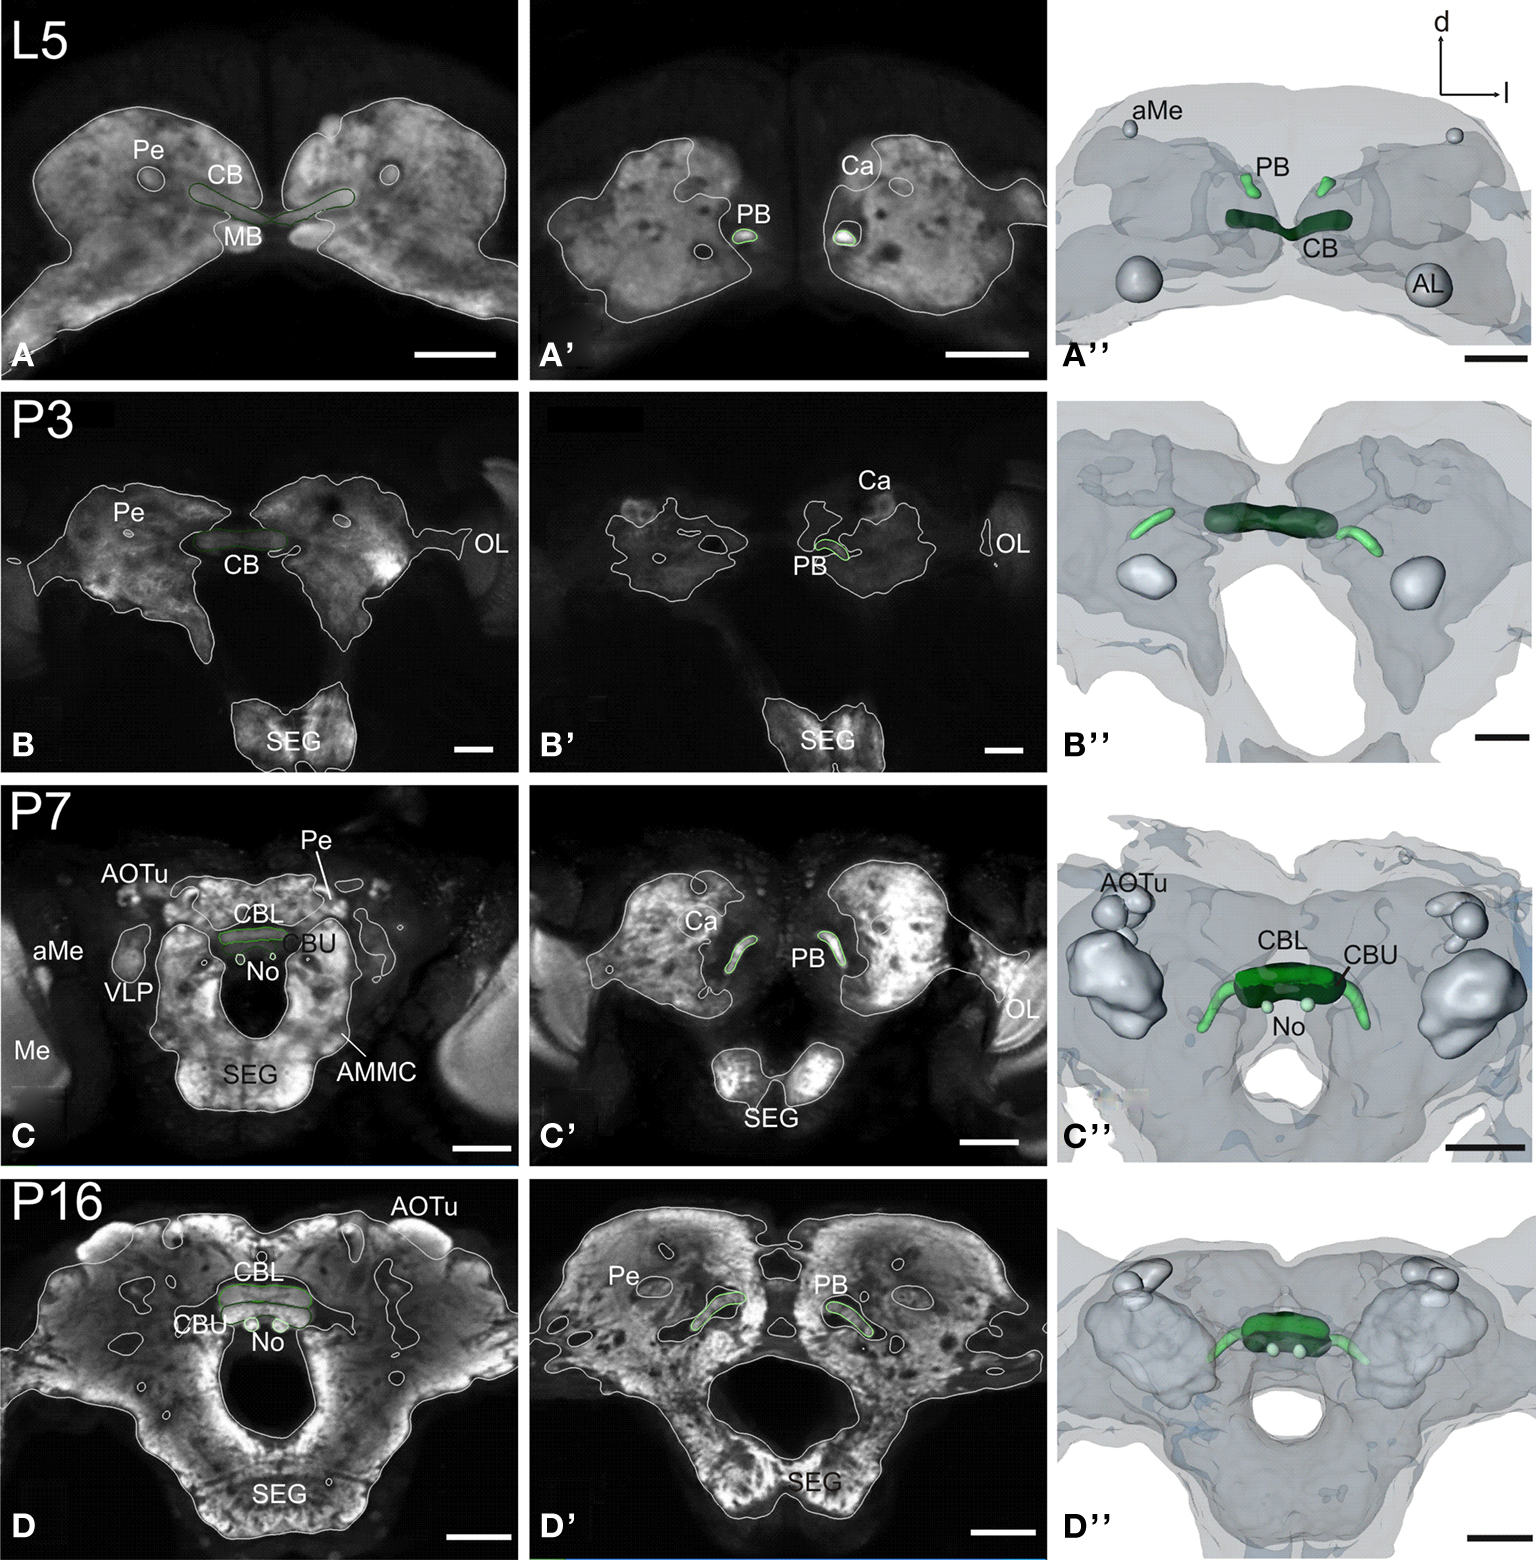
Figure 4. Development of the central complex. Single optical sections in the frontal plane at different depths, anti-synapsin immunostaining (left two columns). Right column, 3D reconstructions (frontal views). (A–A′′) Central body (CB) and protocerebral bridge (PB) are present in the L5 larva. The PB consists of two separate neuropils and retains this layout up to adulthood. (B–B′′) Stage P3: the two parts of the PB elongate horizontally while the CB becomes thicker. (C–C′′) Stage P7: a lower (CBL) and upper (CBU) subunit are discernable. The noduli (No) appear antero-ventrally of the CB. The PB reaches its final position with its lateral ends pointing postero-ventrally. (D–D′′) Stage P16: the central complex has further increased in size. Orientation bars: d, dorsal; l, lateral; scale bars: 100 µm (A–B′′); 200 µm (C–D′′).
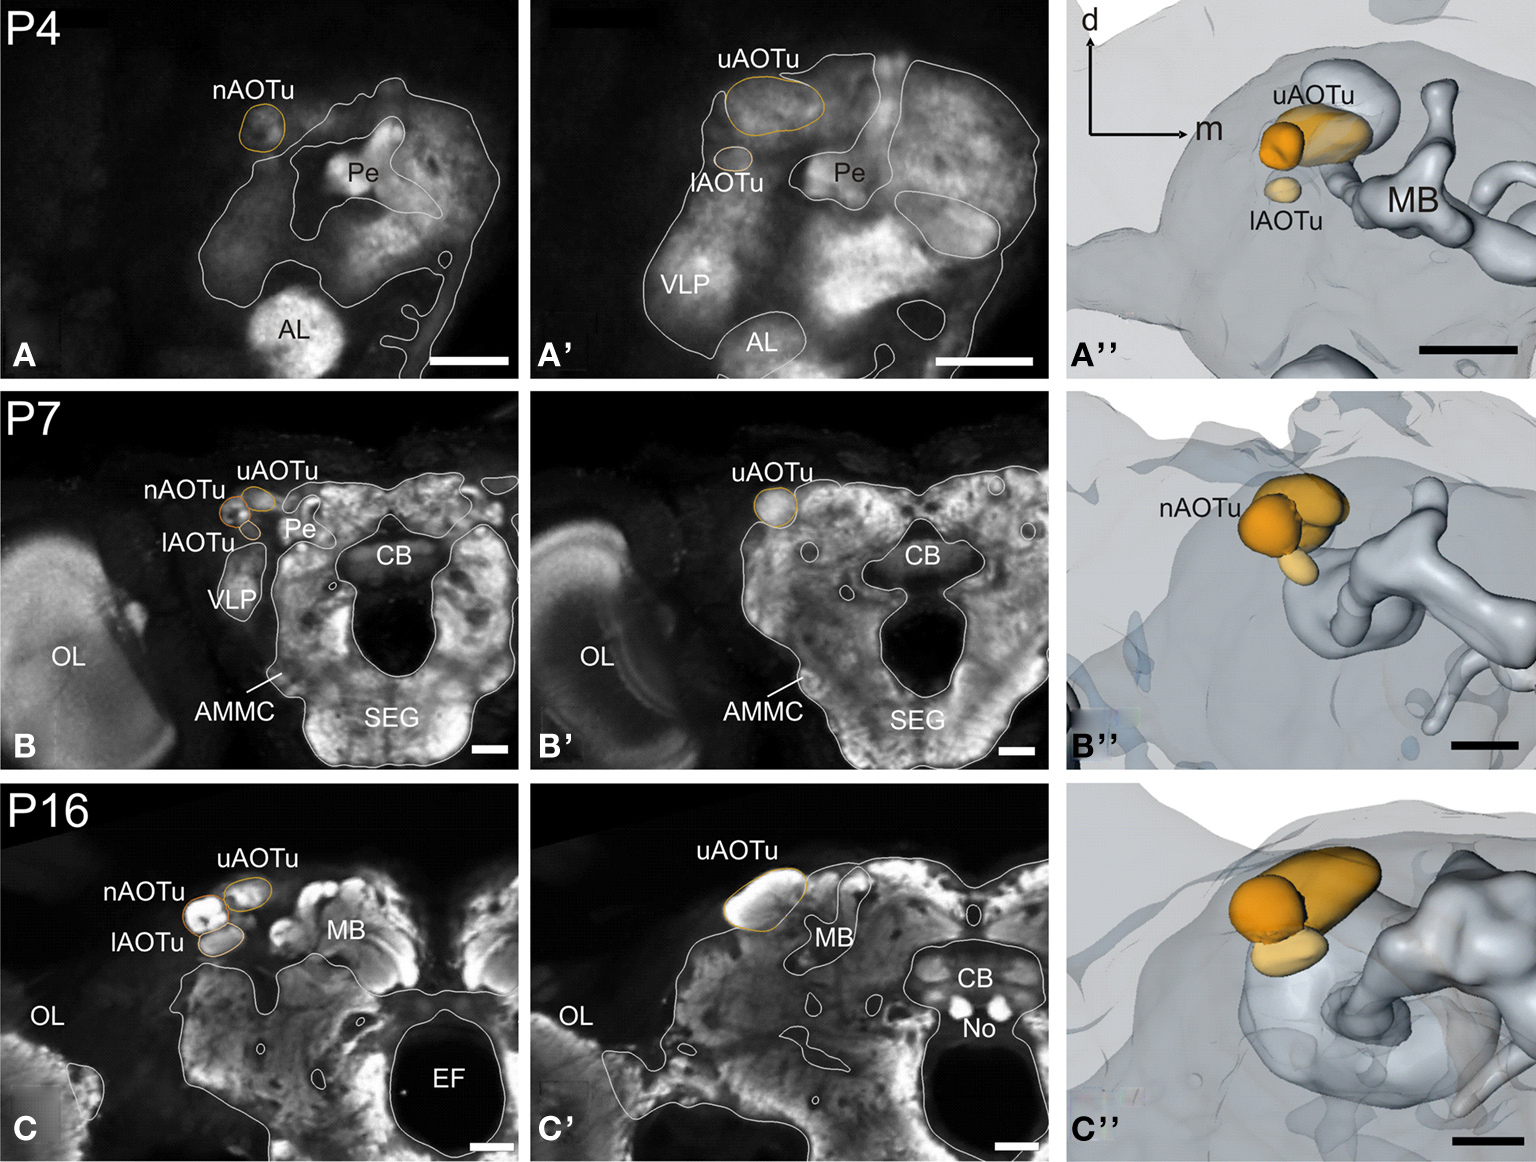
Figure 5. Development of the anterior optic tubercle. Single optical sections in the frontal plane at different depths, anti-synapsin immunostaining (left two columns). Right column, 3D reconstructions (frontal views). (A–A′′) Stage P4: all three subcompartments of the anterior optic tubercle (AOTu) become discernible structures in the antero-dorso-lateral midbrain: the upper (uAOTu), lower (lAOTu), and the nodular subunit (nAOTu). (B–B′′) Stage P7: independent of the rotation events of mushroom bodies (MBs) and the central complex, the subunits of the AOTu stay in their position and increased in size. (C–C′′) Stage 16: all subunits of the AOTu increased further in size. The uAOTu remains the largest subunit throughout metamorphic development. Orientation bars: d, dorsal; m, medial; all scale bars: 100 µm.
The antennal lobes
The primary larval integration site for olfactory information, the larval antennal center (LAC) exhibits no glomerular organization in M. sexta (Figure 2
). The anti-synapsin staining resembles throughout AL development the anti-synaptotagmin staining described earlier (Dubuque et al., 2001
). At P4 the developing AL becomes first visible with the anti-synapsin staining. Note the ventral position of the AL, even with the complete subesophageal ganglion fused to the supraesophageal ganglion. From P7, spheroidal structures, the forming olfactory glomeruli become visible in the developing AL. The glomeruli enclose a central coarse neuropil. The whole AL gains volume and wanders in a more antero-dorsal position. At P9, single glomeruli become clearly discernible within the AL. The dorsal migration of the whole AL slows down and eventually stalls. The volume curve indicates for the AL three developmental phases, which correspond to earlier studies (Figure 7
; Oland and Tolbert, 1996
; Dubuque et al., 2001
; see Discussion).
The mushroom bodies
The larval (L5) mushroom body (MB) is characterized by rather thin α- and β-lobes (αL, βL) and a slender peduncle (Figure 3
). The peduncle in the larva is still oriented antero-ventrally, with a slight inclination of the calyces (Ca) to the dorsal midline. While the αL points antero-dorsally, the βL extends medially in the horizontal plane. Between stages P1 and P3 the pedunculi bend nearly 90 degree sidewards and the whole MB starts to rotate backwards from a ventro-dorsal orientation to an antero-posterior orientation (Figure 6
; Movie S1 in Supplementary Material). This rotation continues until P7, now the whole MB is oriented antero-posteriorly. Additionally to the αL and βL, the γ-lobe (γL) and the Y-lobe (YL, see in Figures 3D–D′′,E–E′′) can now be discerned.
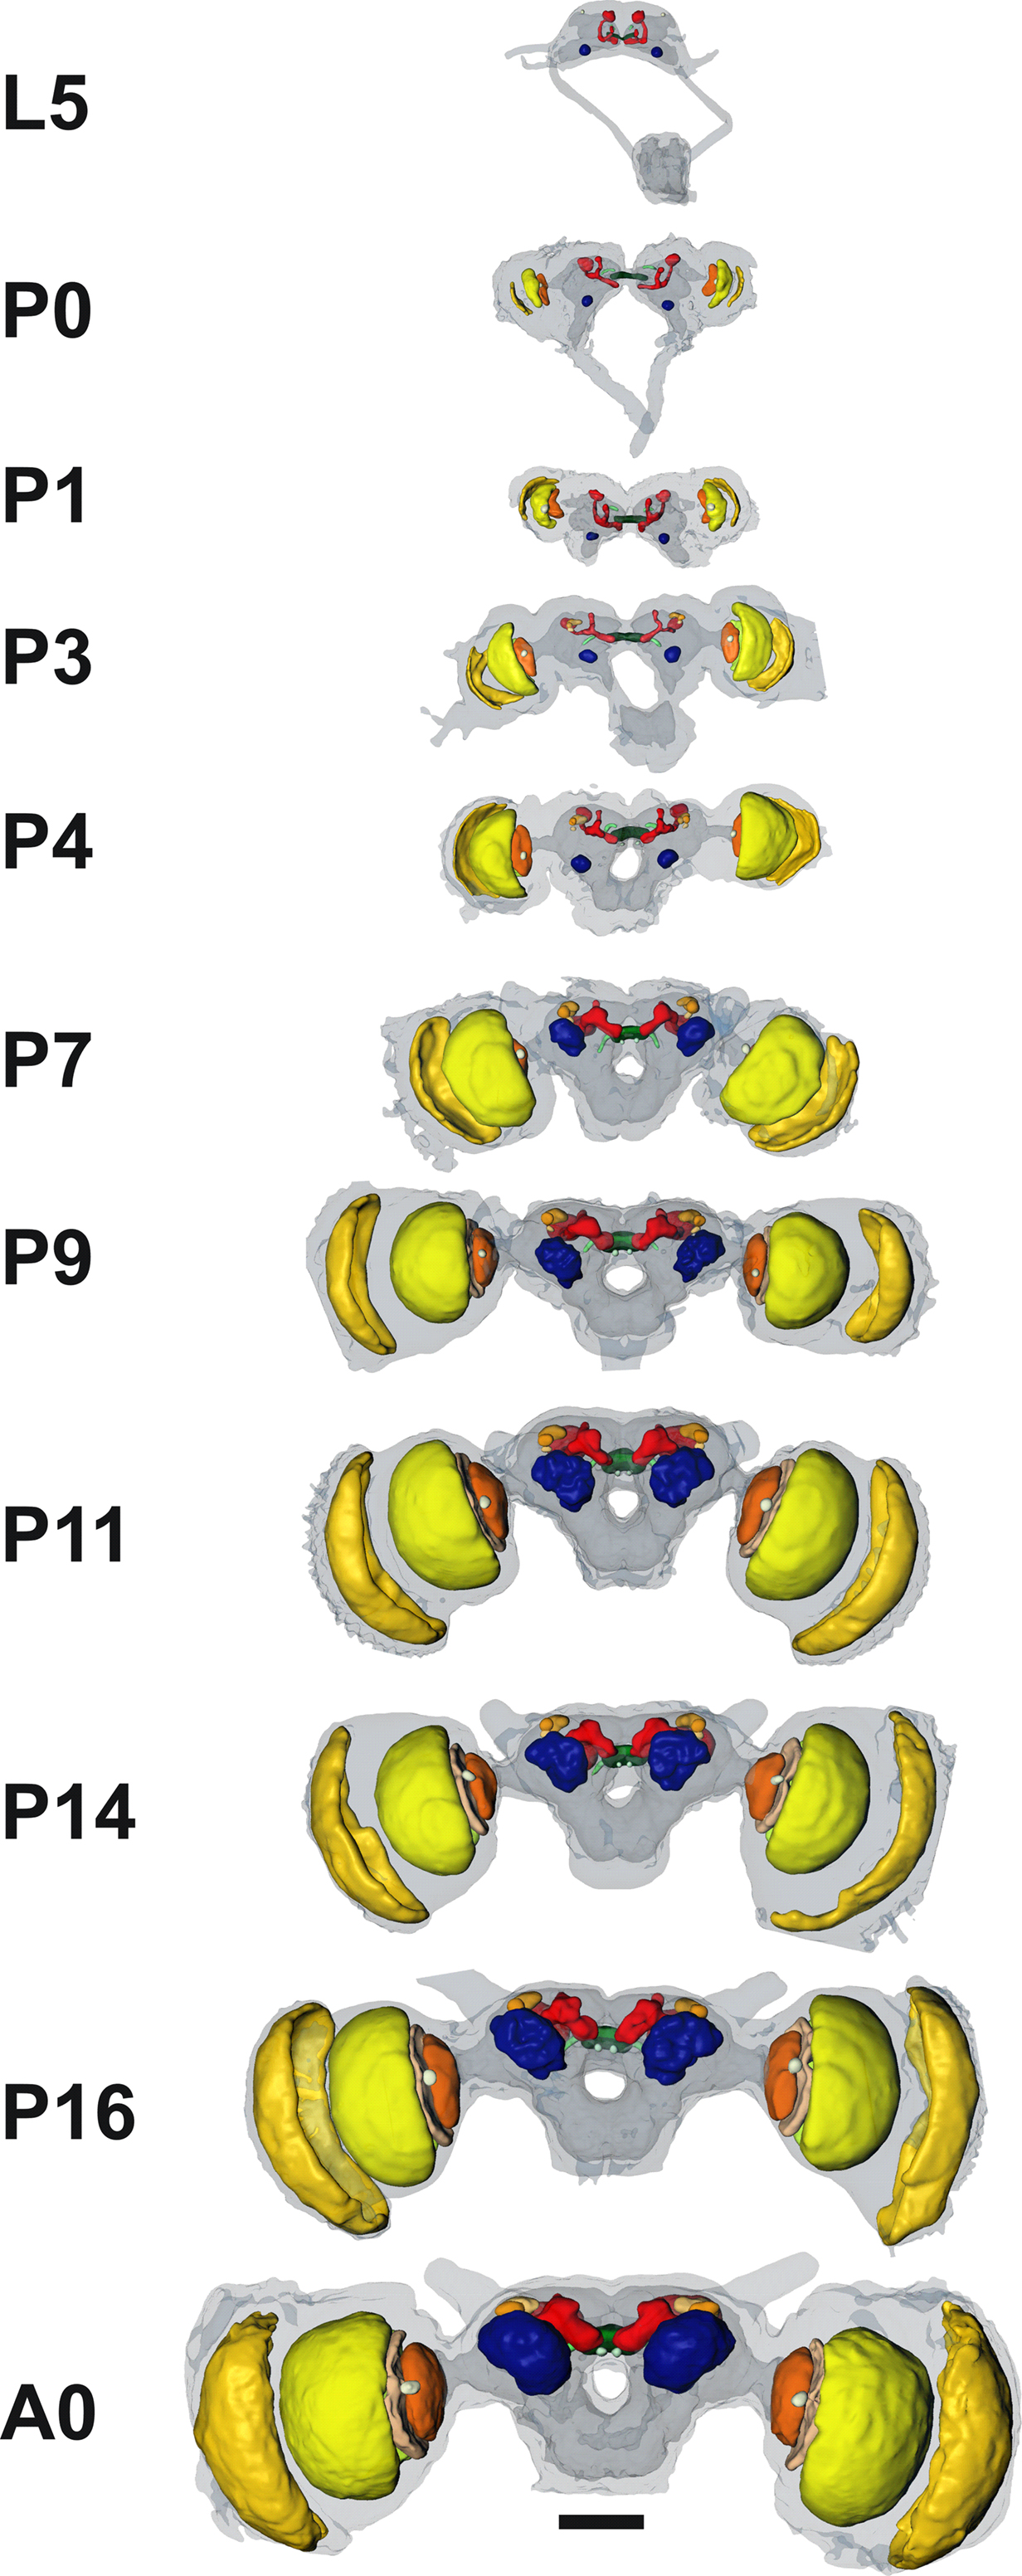
Figure 6. 3D brain reconstructions of representative developmental stages. Most conspicuous are the prominent overall size increases (especially in the optic lobes) and the fusion of the subesophageal and supraesophageal ganglion. Note the outward tilting movement of the mushroom bodies, together with a backward rotation. These brains represent the reference points for the 4D visualization (Movie S1 in Supplementary Material). Anterior view; scale bar: 500 µm.
Other neuropiles of the CNS
Both central body (CB) and protocerebral bridge (PB) are recognizable structures in the larva already (L5, Figure 4
). Based on anti- synapsin-immunoreactivity, the PB consists of two separate neuropils and retains this layout up to adulthood. At P3, the two parts of the PB elongate horizontally and also undergo the two main movements in the central brain (see Figure 3
). The CB thickens, but shows no signs of subdivisions. At P7 the two subdivisions of the CB, the lower (CBL) and upper (CBU) subunit can be discerned. Since the CB also underwent the rotation of the brain, the CBL is – now counter intuitively – in an antero-dorsal position to the CBU. The noduli (No) appear antero-ventrally to the CB. The two halves of the PB grow closer together, but stay untouched. Their lateral ends now point postero-ventrally in their final orientation. After P7 the central complex remains in its position and undergoes further size increase.
The larval brain houses no anterior optic tubercle (AOTu, not shown), its three subcompartments become discernible structures in the antero-dorso-lateral midbrain around P4 (Figure 5
): the upper (uAOTu), lower (lAOTu), and the nodular subunit (nAOTu). Also the characteristic four nodules of the nAOTu become visible at the same time (Figure 5
A). Interestingly, the brain rotation events around P7 leave all subunits of the AOTu relatively untouched; they remain in their position and increase in size. Further increasing in size, the uAOTu remains the largest subunit throughout metamorphic development.
The antennal mechanosensory and motor center (AMMC) is another neuropil region in the developing brain, but did not fulfill the criterion of clearly identifiable borders in all three dimensions, thus we refrained from including it into our reconstructions. The same is true for several other brain regions; most noteworthy are the dorsal and lateral protocerebrum. No clear-cut boundaries make a judgment on their developmental size increase and potential rotational movements rather ambiguous. In general, these brain regions tend to be underrepresented in the literature. This is a well-known problem of brain anatomy and has recently been addressed in the fruit fly (Otsuna and Ito, 2006
).
Time Course of Neuropil Development
The anti-synapsin based immunostainings clearly show different time scales for the development of the various neuropils (Figure 8
). Most neuropils including the aMe, the MB, the central body, and the protocerebral bridge were already present in the 5th larva. These neuropils changed during pupal development by (1) becoming more differentiated (e.g. the MBs obtain two additional lobes), (2) change of position (e.g. rotation of the MB), and (3) increase of volume. Other neuropils including the compartments of the optic lobes and the noduli are newly formed during this process. In the case of the first integration center for olfactory information, the LAC gets replaced by the AL (Kent et al., 1987
; Jefferis et al., 2004
).
The first wave of new neuropil development already starts in the larval stage including most neuropils of the optic lobe (La, Me, Loi). Those neuropils are laid out in the inner and outer optic anlagen, which slowly aquire anti-synapsin staining during continuous growth in the early pupal stages. The lobula plate and the AMMC gradually appear with the onset of pupal development, whereas the noduli and the subunits of the AOTu are not seen before P4 (Figure 8
). Between P4 and P7 the last structures which were included in this study appeared as separate neuropils. All are without exception subdivisions of already existing neuropils: the outer lobula separates from the inner lobula, the γ- and Y-lobe protrude from the mushroom body lobes, and the lower unit of the central body becomes discernible. Basically, after one third of metamorphic development all examined neuropils are already present. The ongoing two-thirds of pupal development exhibit neither major structural changes nor additional translational movements of neuropils, but rather massive increase in size.
Analysis of the volume increases of each of the examined neuropils reveals that all neuropils start with massive growth at around stage P3/P4 (Figure 7
). Thus, in contrast to the onset of the synapsin signal, which differed between the neuropils, the onset of the massive volume increase starts at about the same developmental time for all neuropils.
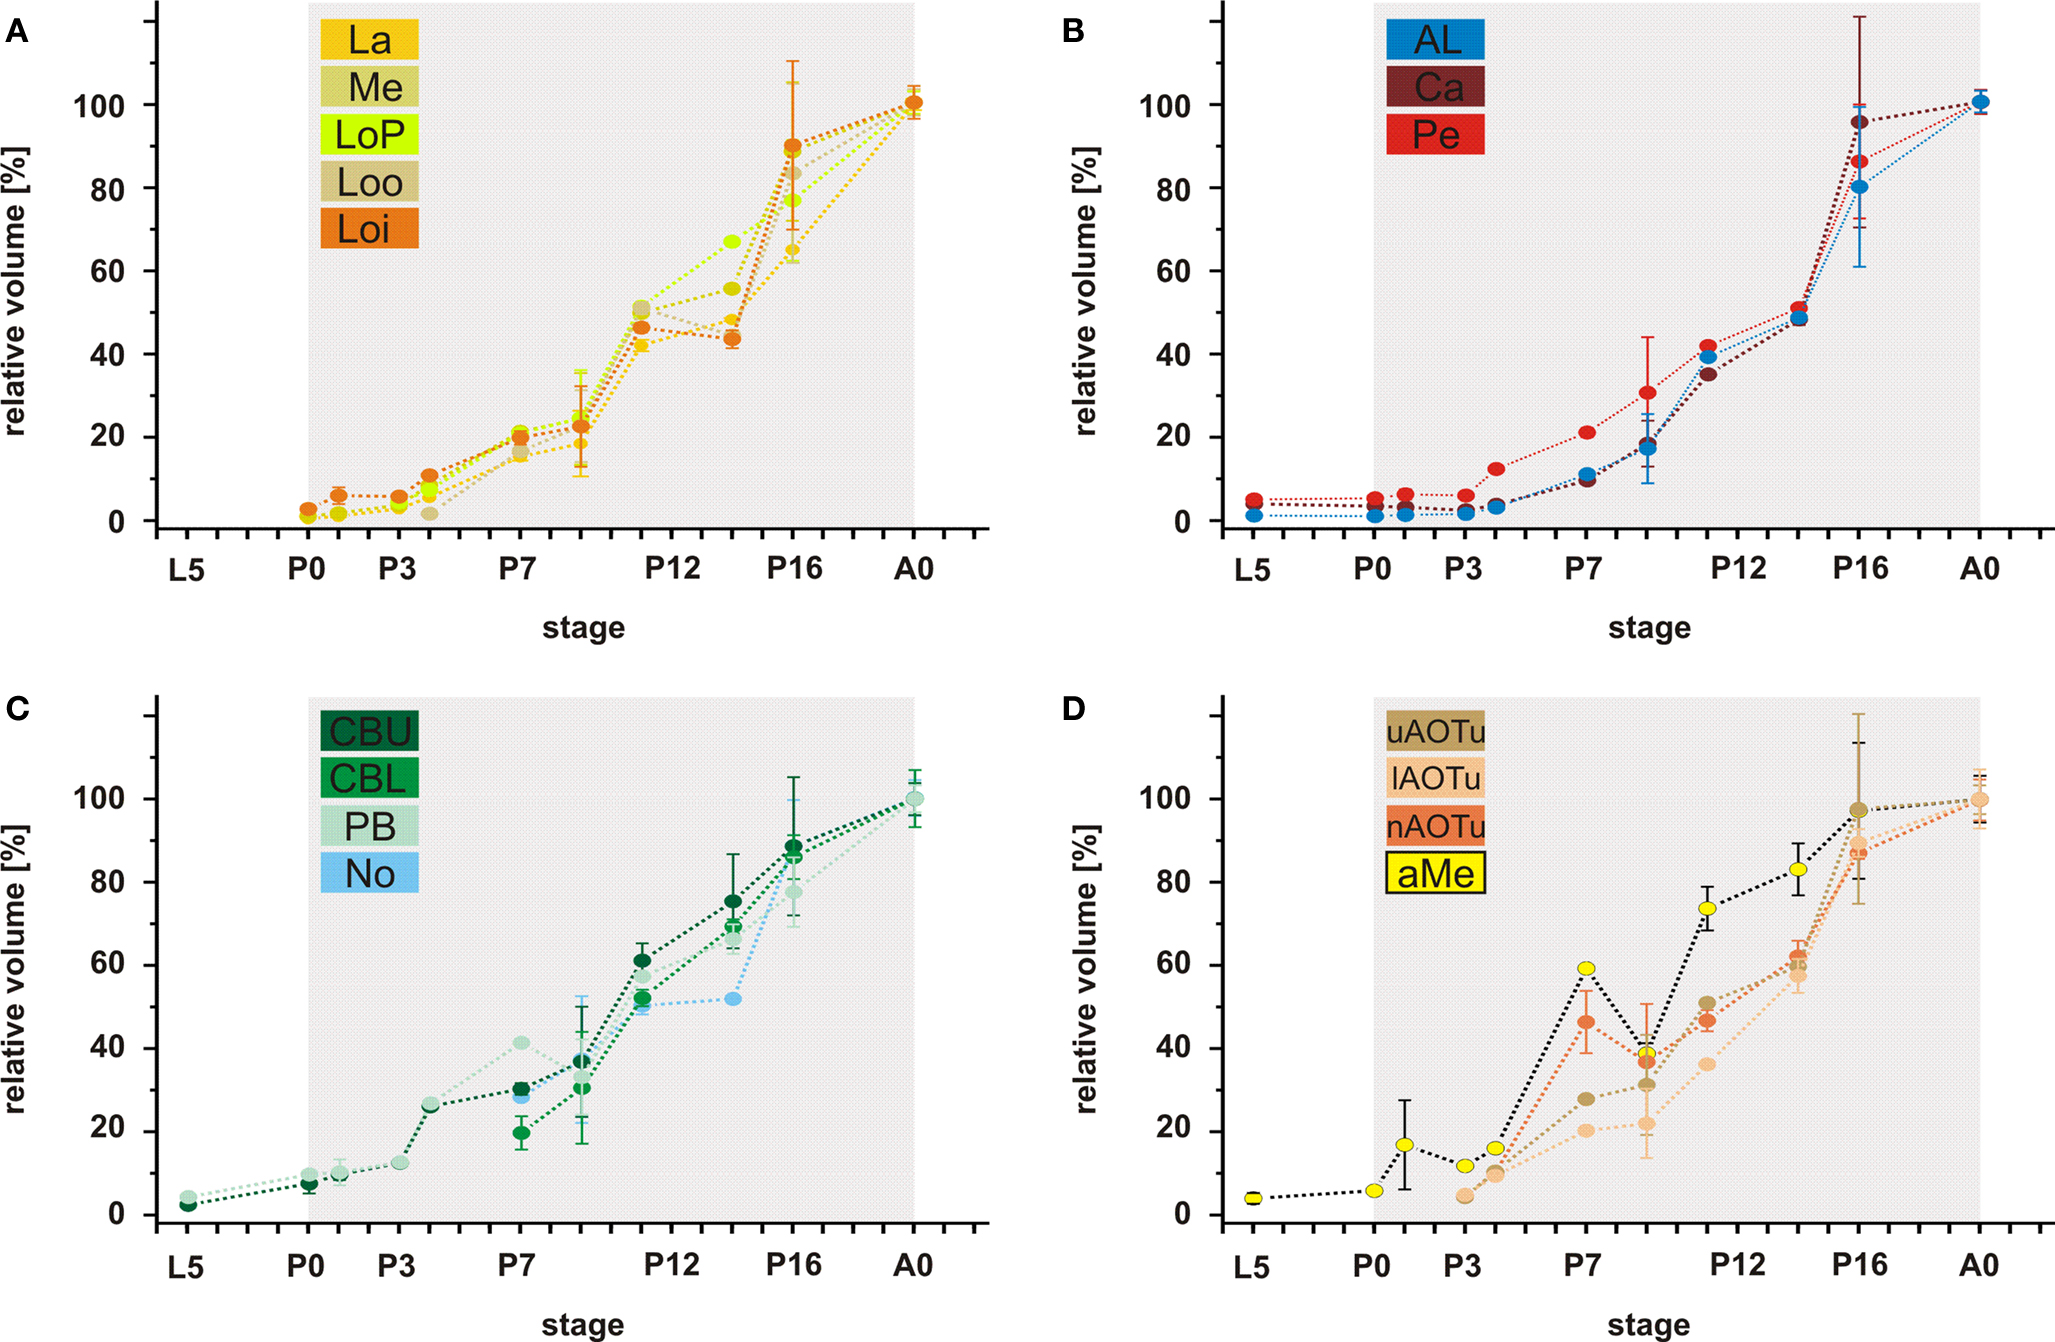
Figure 7. Relative volumes of the examined neuropils. (A) The optic lobe neuropils; (B) The antennal lobes and the mushroom bodies; (C) The central complex; (D) The anterior optic tubercle and the accessory medulla. For each data point values of two brains are used (only for P4; n = 1). For bilateral neuropils, the means of the volumes of the individual animal were used. Deviation bars, standard errors. La, lamina; Me, medulla; LoP, lobula plate; Loo, outer lobula; Loi, inner lobula; AL, antennal lobe; Ca, calyx; Pe, pedunculus; CBU, upper unit of the central body (CB); CBL, lower unit of the CB; PB, protocerebral bridge; No, nodule; uAOTu, upper anterior optic tubercle (AOTu); lAOTu, lower AOTu; nAOTu, nodular subunit of the AOTu; a Me, accessory medulla.
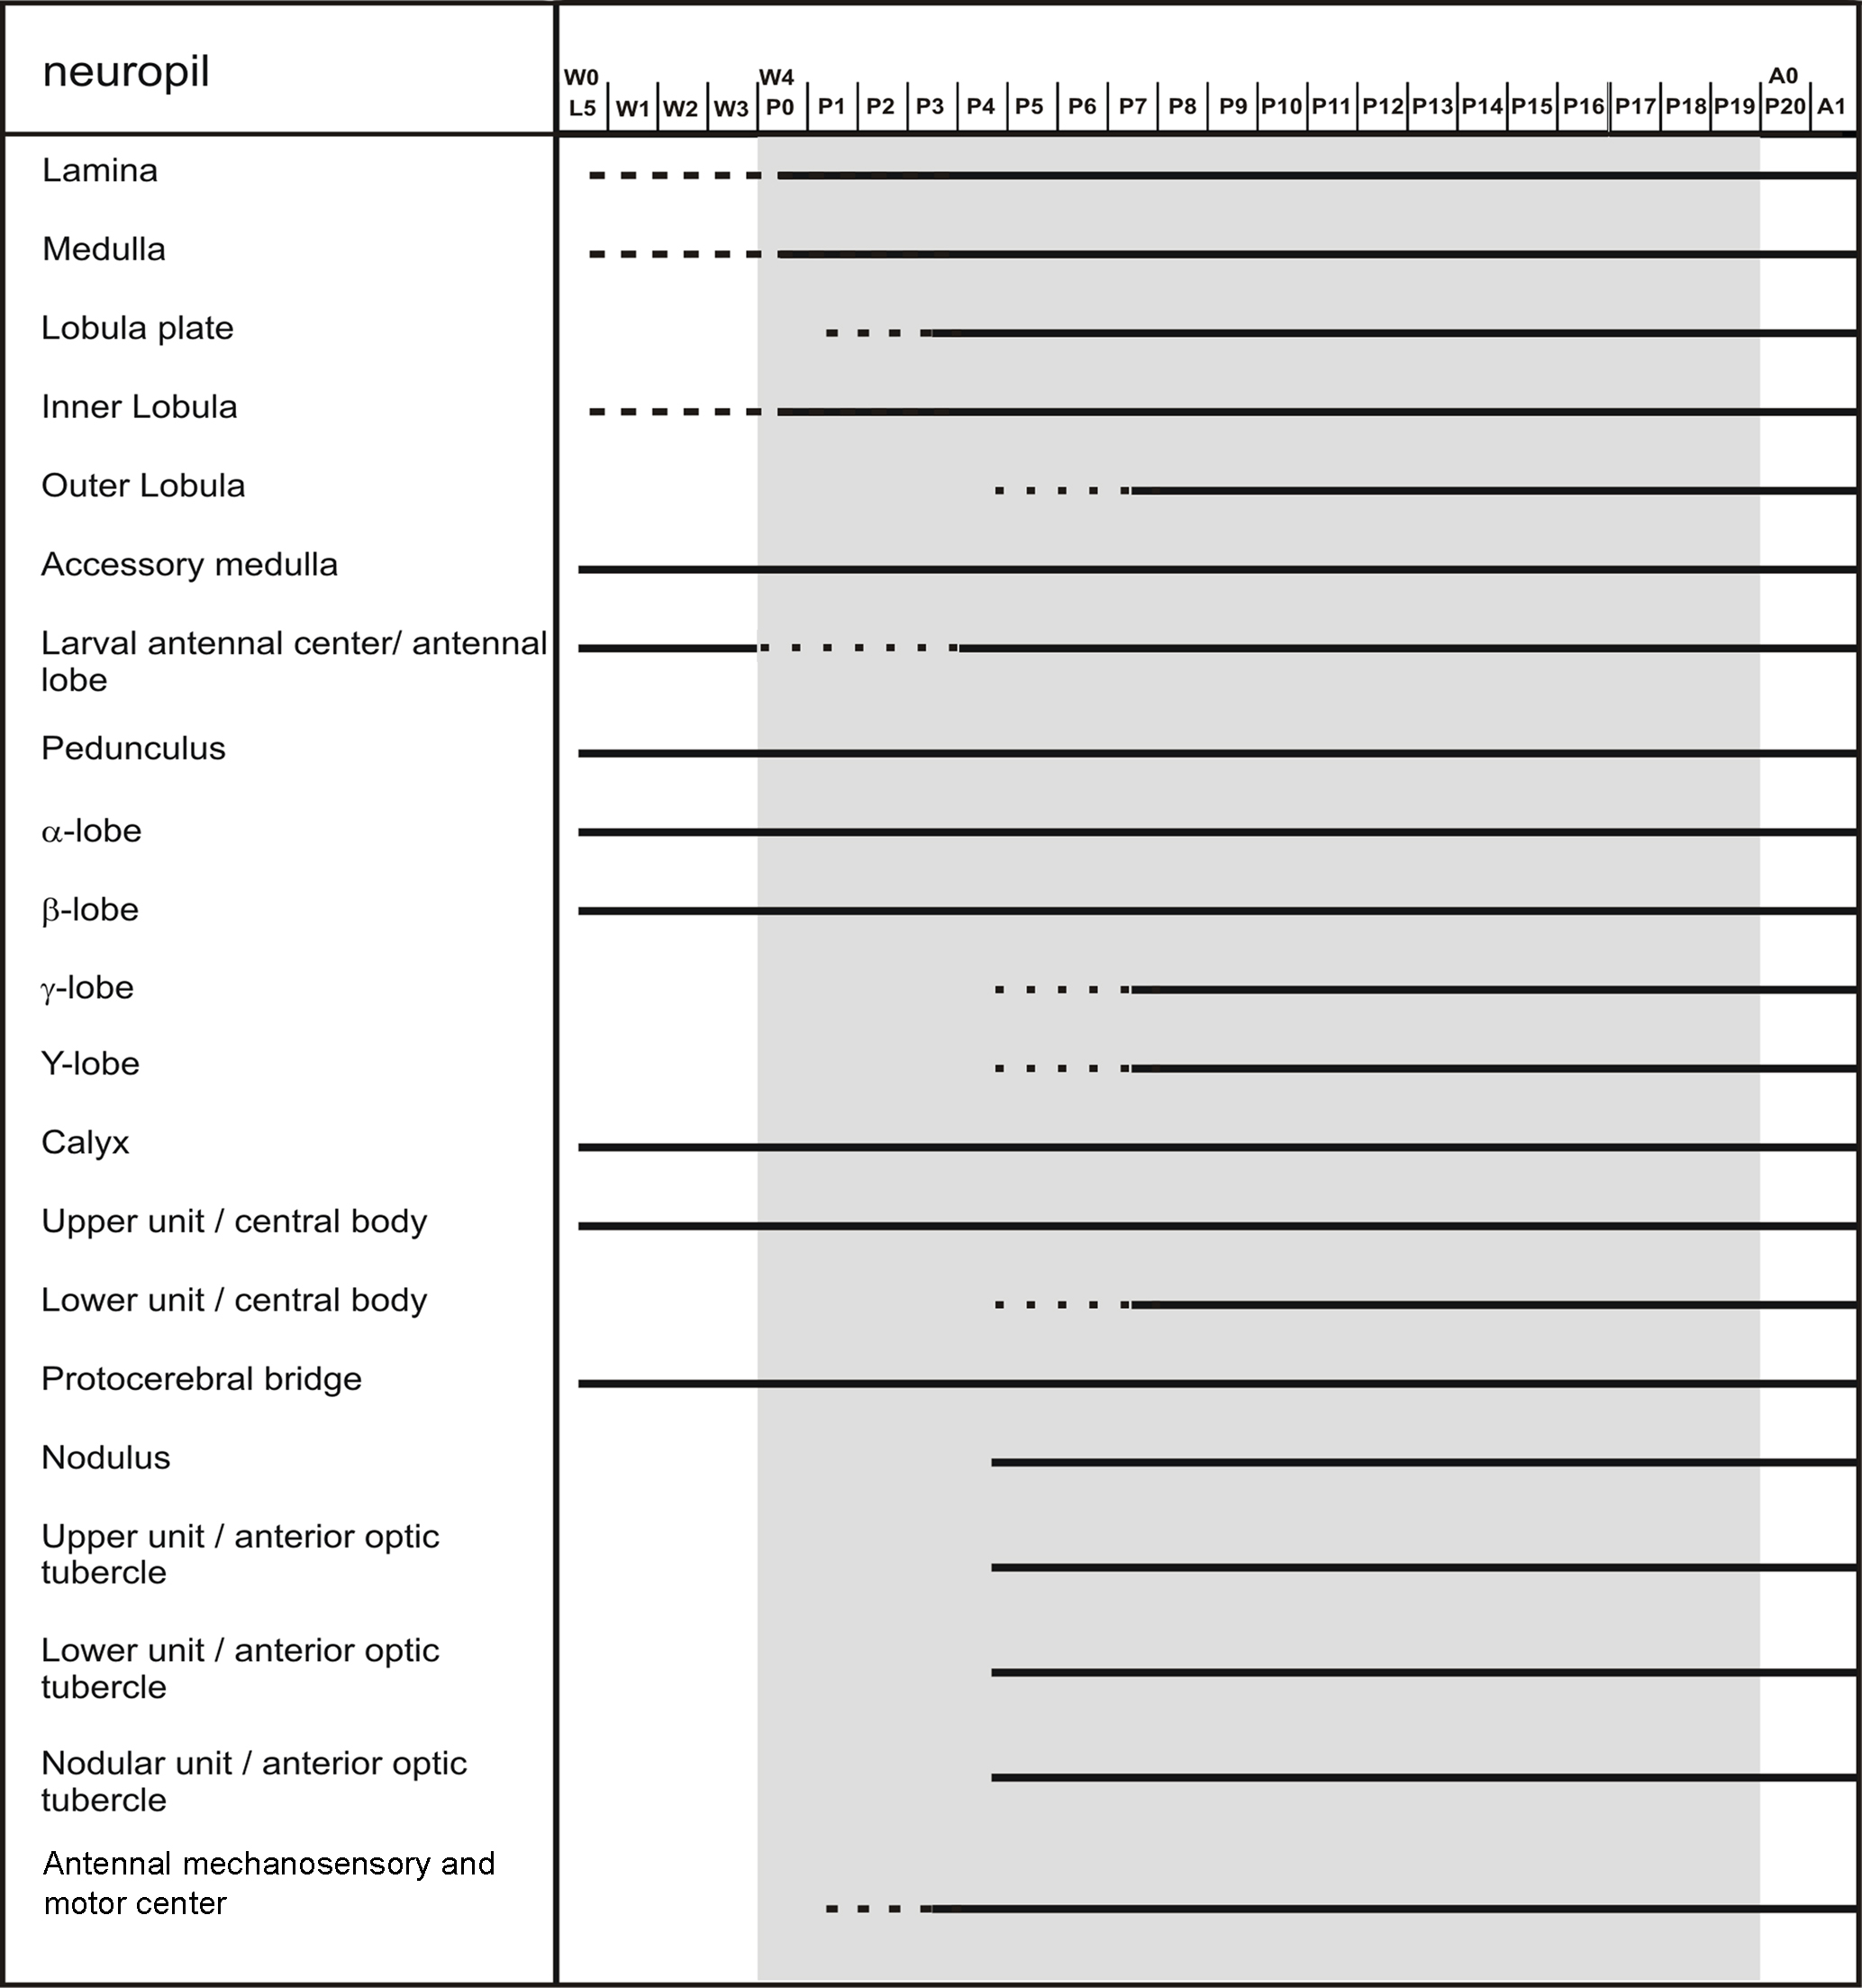
Figure 8. Scheme of brain neuropil development. The scheme, based on anti-synapsin immunostaining, reflects the developmental time course of the individual neuropils. Dotted lines represent the gradual appearance of a neuropil, or, in case of the larval antennal center, its transition into the antennal lobe.
4D Visualization in Cinema 4D
To summarize all described changes in relation to position, shape and size of the individual neuropils, we generated an animation of the metamorphosing M. sexta female brain (Movie S1 in Supplementary Material). As an initial point of the animation we choose the last instar brain (L5) and animated the development of the brain during metamorphosis until the adult stage A0. For the 4D visualization, we animated the development of the individual neuropils including their subunits and additionally the brain surfaces which we also labeled during 3D reconstructions and which were also standardized in the M. sexta standard brain (el Jundi et al., 2009
). For the animation of individual neuropils and the brain surface we used the 3D reconstructed surface models which were for each developmental stage created in Amira (Figure 9
). Beside these individual brains we also used as the final point of the animation the female standard brain of M. sexta (el Jundi et al., 2009
). To ease calculations we reduced the number of the polygons of the surface models in AMIRA and exported every brain as drawing exchange format (.dxf) file. The surface models or brain polygon models of the selected brains which are shown in Figure 6
were then imported in the software program Cinema 4D where the virtual animation of the brain development was generated. To further simplify the necessary calculations in the software, only one brain hemisphere of the bilateral symmetrical M. sexta brain (except the subunits of the central body) was animated and subsequently mirrored for the movie. Also, pedunculus and calyx were integrated to one polygonal model with the tool Connect. Next we defined the length of the animation using the taskbar Timeline (Figure 9
). To attribute crucial substages (i.e. P7/8), the timeline was subdivided in 41 “stages”, each 35 frames long, thus giving 1435 frames for the 4D animation. To define the L5 larval brain as the initial brain, we selected this brain and set a Key in the timeline at frame 0 (Figure 9
). Basic structures with only few polygons like a sphere can easily be morphed in a cube with the module Morph. Because of the complexity of the neuropil structures it was not possible to create the 4D visualization with this module. During the animation the program does not allow a change of the number of polygons. Because some adult neuropils are not present in the larval brain, we first scaled down the adult brain onto the larval brain and reduced non- existent neuropils to point-size. This downscaled brain, adapted to fit the shape of the L5 brain, was then used as a starting point for the subsequent morphing process. All neuropils of all brains were displayed as grid polygonal models using the tool Display, except of the starting brain which was displayed as a polygonal surface model (Figure 9
A). During the morphing process, only the starting brain, which was morphed from one stage to the next, and the brain of the next corresponding developmental step were visible. With the tool Model the localization of every neuropil of the starting brain was positioned approximately in the center of the corresponding neuropil in the brain of the next reconstructed developmental stage. These positional changes of individual neuropils were then saved by setting a Key in the Timetable to the adequate frame number. Then the polygon edges were made selectable with the tool Point Selection and with the tool Magnet the polygons of every neuropil of the starting brain were manually adapted to fit the polygons of the neuropil of the next reconstructed brain in the developmental time line. Changes in size and shape of the neuropils were again saved by a Key in the Timetable. Beside this changes in shape and size we also rotated the structures, for example the mushroom bodies. For every modification (scaling, rotating, positioning and shaping) a Key was set in the Timeline and the neuropils of the starting brain were slowly morphed step by step to eventually match the adult A0 brain. The temporal progress in relation to size, rotation and position of the structures between two Keys is sigmoid by default in Cinema 4D (Figure 9
B). The temporal progress of the rotation, scale and position of the animation between all Keys is visible in the Timeline window as f-curves. To better fit the observed developmental changes between the stages into the temporal progress, we used additional Keys between these Keys in the f-curves (Figure 9
B′). After creation of the 4D visualization we exported the 1435 images from Cinema 4D as Targa image file format (.tga). Thereby image data were rendered with 1280 × 1024 pixel resolution. To obtain a high-quality animation of brain development we imported these 1435 images in the freeware Virtual Dub (v. 1.9.7., http://www.virtualdub.org
) and created an Audio Video Interleave file (.avi) movie. Thereby we defined the frame rate to 25 frames per second, so that the 4D animation of the brain development has a length of 57.4 s. To reduce the file size of this movie we converted this movie with a DIVX-converter to a divx-video format. The 4D animation of the brain development of M. sexta from anterior is shown in Movie S1 in Supplementary Material.
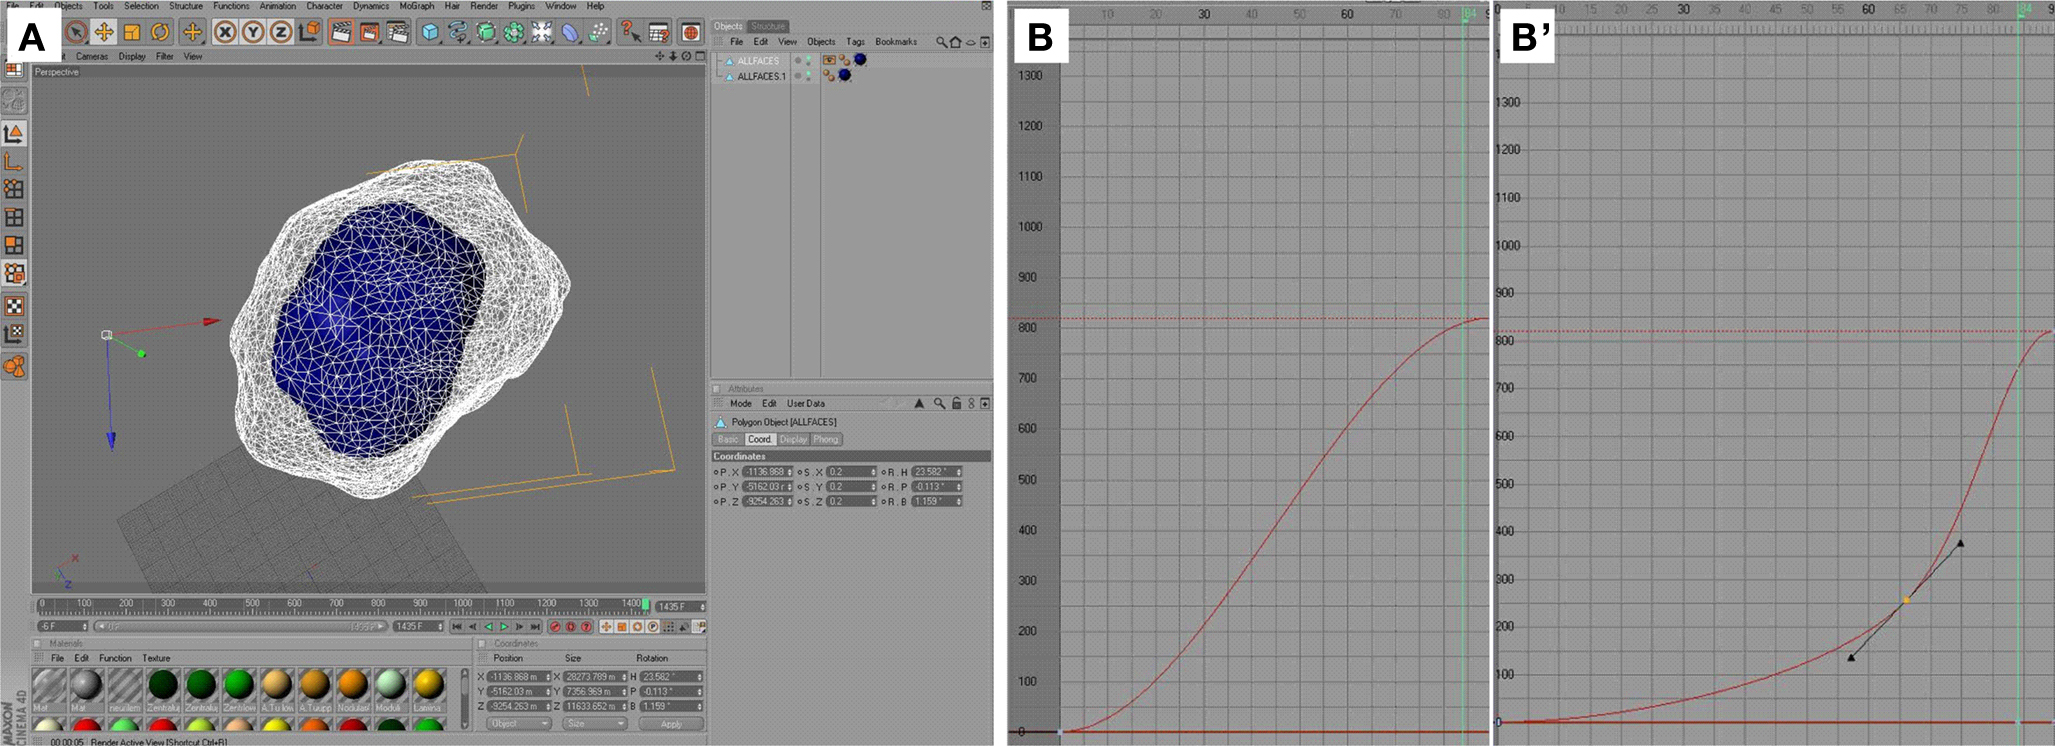
Figure 9. Cinema 4D user interface – animation of the visualization. (A) Interactive mode in Cinema 4D; the center of the adult antennal lobe (A0, white, polygon grid view) is registered semi-automatically with the center of the P16 antennal lobe (blue, polygon surface view). Subsequently, the polygons are adjusted manually to match the shape of the corresponding preceding neuropil. (B–B′) Detail of the timeline window; the f-curve (red) represents the relative position (y-axis) of a certain neuropil in relation to frame number (x-axis) between two key points. By default, this curve is sigmoidal (B) and needs to be adjusted manually by adding another key point (yellow, (B′)).
The development of a brain is a highly complex process in space and time. Eventually, all brain neuropils are formed, become located in their correct position and the connections between the neuropils are organized in a correct way. Owing to the amount of different neuropils and the different time lines, it is a challenge to envisage and may be even quantify such a process in its entirety. With the current paper, we present a feasibility study which offers a strategy to visualize the development of brain neuropils. For this purpose we 3D reconstructed selected brain neuropils of selected stages during brain metamorphosis of the sphinx moth M. sexta and transferred the 3D-surface data into the animation program Cinema 4D. Advances in imaging techniques, 3D reconstruction software, and computer power led to 3D reconstructions of many brain areas and especially in insects led in some cases even to standardized brains to relate individual variations (Drosophila melanogaster: Rein et al., 2002
; Jenett et al., 2006
; the honeybee Apis mellifera: Brandt et al., 2005
; the desert locust Schistocerca gregaria: Kurylas et al., 2008
; two moth species: M. sexta (el Jundi et al., 2009
) and Heliothis virescens (Kvello et al., 2009
); the red flour beetle Tribolium castaneum: Dreyer et al., 2010
). However, an animation of developing brain areas based on 3D-reconstructions from consecutive developmental stages has so far not been produced.
Development of most of the brain areas of M. sexta that we reconstructed has been described under various aspects in several publications over the years. In the following discussion, we first want to briefly compare the results of our study with the published data and then evaluate the used strategy and technique for a better understanding of developmental processes.
Optic Lobes
The optic lobe is a highly retinotopically ordered neuropil that consists of three distinguishable neuropils, most distally the lamina, followed by the medulla and the lobula complex (Bullock and Horridge, 1965
; Strausfeld, 1976
; Homberg, 1994
). In M. sexta, the optic anlagen, from which the optic lobes develop, are readily apparent in the third larval instar (Monsma and Booker, 1996
). Similar to other insects, the outer optic anlagen give rise to the neurons of the lamina and the medulla and the inner optic anlagen give rise to the neurons forming the lobula neuropils (Nordlander and Edwards, 1969
). Faint synapsin immunostaining revealed the presence of the lamina, medulla, and lobula at stage P0. As we did not reconstruct brains of late wandering larva, these neuropils could have been present already earlier. At stage P3 the lobula plate appears and additionally the intensity of the synapsin staining increased in all optic neuropils including clear layers within the medulla. This result suggests that massive synaptogenesis starts around P3 which is very likely correlated with the incoming axons of the photoreceptor cells starting at P2/3 (Monsma and Booker, 1996
). An earlier study, which postulated expression of superoxide dismutase (SOD) as an indicator for neurons forming their synapses, found high levels of transient SOD staining in many optic lobe neurons starting around stage P2/3 and ending at different times during metamorphic development (Schachtner et al., 2004a
). In parallel to the increasing synapsin and SOD signal, the optic neuropils start from stage P3 with a more or less linear growth up to adult size (A0, Figure 7
). Regulated by the increasing hemolymph titer of 20-hydroxyecdysone, mitotic activity in the outer optic anlagen abruptly ceases at P6 with some mitotic cells up to P10 and from P8 to P10 neuroblasts of the outer optic anlagen undergo programmed cell death (Monsma and Booker, 1996
; Champlin and Truman, 1998b
). Also, the last axons of retinal photoreceptor axons reach the lamina at stage P6 (Monsma and Booker, 1996
). In summary, these data suggest that the linear increase of the lamina and the medulla volumes between P3 and P6 is driven by several factors including ingrowing axons of photoreceptor cells from the retina, synaptogenesis between the different partners, general neuronal growth, and neurogenesis. The stop of photoreceptor axon arrival and the abrupt cease of neurogenesis are not mirrored in the observed growth rate. Thus, the linear growth following stage P6 must be driven by other mechanisms which reflect the maturation of the neuronal network within lamina and medulla.
The adult accessory medulla is connected to the adult remnants of the larval photoreceptors, the stemmata (Lampel et al., 2005
), pointing towards the larval optic neuropils as developmental origin of the accessory medulla. This larval origin was claimed for Papilio (Ichikawa, 1994
); an idea originally brought up for the accessory lamina and medulla in neuropteroids (Ehnborn, 1948
).
Antennal Lobes
The paired antennal lobes (ALs) are the first central integration centers for the odor information in the insect brain (reviewed in Schachtner et al., 2005
). During metamorphosis the adult ALs, which in M. sexta consist of about 60 olfactory glomeruli develop from an aglomerular larval antennal center (LAC; for a review see Tolbert et al., 2004
). In Drosophila and in M. sexta the LAC is replaced by the adult AL (Kent et al., 1987
; Jefferis et al., 2004
). In both species, neuron populations which innervate the LAC persist through metamorphosis and build together with new born neurons the adult AL circuit (Homberg and Hildebrand, 1994
; Schachtner et al., 2004b
; Marin et al., 2005
; Utz and Schachtner, 2005
; Utz et al., 2008
). In a recent study the metamorphic development of the M. sexta ALs has been monitored using an antiserum against synaptotagmin, another ubiquitous synaptic vesicle protein (Dubuque et al., 2001
). The findings of the current study using an anti- synapsin antiserum clearly resemble the findings of this earlier study. Dubuque et al. (2001)
divided AL development into three phases. The preparation phase (phase I) lasts about 7–8 days beginning at pupal formation. It includes the birth of all AL neurons, the arrival of the axons of the olfactory receptor neurons from stage P3 to P10 in the ALs, and the formation of the protoglomeruli, the sites where the glomeruli form during phase II. The glomeruli formation phase (phase II) lasts about 5 days and is characterized by massive synaptogenesis between the involved neurons. It is assumed, that during phase II a basic network of synaptic contacts within and between the glomeruli is established, which ensures the principal correlation of input and output components of the AL (Dubuque et al., 2001
). In contrast to phase II, in phase III, which lasts about 8 days up to adult eclosion, only little synaptogenesis occurs. During this last phase, the glomeruli grow in size between 40 and 130% (Huetteroth and Schachtner, 2005
). This is probably because of the increasing neurite diameters, and the synaptic wiring in the glomeruli is thought to undergo further refinement and maturation (Tolbert et al., 1983
; Tolbert, 1989
; Dubuque et al., 2001
). The volume curve mirrors the three phases (Figure 7
). Volume increase starts at stage P3. At stage P7 the growth rate goes up and after P11/12, there seems to be a reduction in growth rate which is then increasing again. We are aware that we only reconstructed two brains per stage and that the results have to be judged under this prerequisite. An upward movement of the antennal lobes beginning at stage P3 has been described by Homberg and Hildebrand (1994)
. Our study gives a much more exact time course for this movement of the developing antennal lobes which starts at P3 and ends at stage P9.
Mushroom Bodies
Mushroom bodies (MBs) are generally associated with higher integration processes and learning (e.g. Menzel, 2001
; Heisenberg, 2003
), but might also serve a general function in the control of behavior (e.g. Huber, 1955a
,b
; Erber et al., 1987
; Zars, 2000
; Strausfeld et al., 2009
). In Lepidoptera larva, the opening of the MB calyces point to the dorsal surface of the brain and the α-lobe is oriented frontally but in contrast to other insects the MBs rotate backwards during metamorphic development (Nordlander and Edwards, 1968
; Homberg and Hildebrand, 1994
). As expected from the description of Homberg and Hildebrand (1994)
, the dorsal rotation starts around stage P3. Our data reveal additionally that the MBs reach their adult position at P7. Growth of the pedunculi is nearly linear from P3 to adult eclosion. The calyces in contrast also start to increase their volumes, but cease growth between P9 and P14 before they reenter a growth rate similar to the growth rate before stage P9. Adult MBs are formed by adding new Kenyon cells to the larval MBs (e.g. Panov, 1957
; Nordlander and Edwards, 1970
; Technau and Heisenberg, 1982
; Ito and Hotta, 1992
; Lee et al., 1999
; Zhao et al., 2008
) and the larval Kenyon cells are reorganized during metamorphosis (e.g. Technau and Heisenberg, 1982
; Ito and Hotta, 1992
; Lee et al., 1999
). Metamorphic MB development has so far not been examined in M. sexta and thus, it is not known when neurogenesis and reorganization of larval neurons occur. Schachtner et al. (2004a)
described strong SOD expression starting around stage P3/4 and ending at stage P16. The SOD expression occurs in different Kenyon cell clusters and might indicate synapse formation between the different Kenyon cells during this time. After P16, other factors than synaptogenesis might be responsible for the neuropil growth.
Other Neuropils of the CNS
The role of the central complex still remains elusive, but is probably best described as a central coordinating center in sensory and motor integration (for reviews see Strauss, 2002
; Wessnitzer and Webb, 2006
; Homberg, 2008
). The central complex consists of the central body (CB) and the protocerebral bridge (PB), which are both already present in the M. sexta larva (Granger et al., 1989
; Homberg and Hildebrand, 1994
). However, the metamorphic development of the central complex in M. sexta has not been described so far. In contrast to adults, the larval CB consists only of an upper unit (CBU; Homberg and Hildebrand, 1994
). This is consistent with larval CB morphology in other insects, including e.g. another moth, the honey bee (Antheraea pernyi, Apis mellifera: Panov, 1959
) and two beetles (Tenebrio molitor: Panov, 1959
; Wegerhoff and Breidbach, 1991
; Tribolium castaneum: personal observation). Our reconstructions clearly show that the lower unit of the CB (CBL) forms between P4 and P7. Additionally, the CB and the PB rotate backwards, thus positioning the CBL anteriorly to the CBU and the PB behind the CB. This orientation is eventually reached at stage P7 and remains up to adulthood. Like other examined neuropils, the volumes of all central complex neuropils start their metamorphic growth around stage P3.
The anterior optic tubercle (AOTu) including all subunits forms around stage P4. To date, only sparse information about the functional role of the AOTu is present, but in locusts it receives input from the optic lobes (Homberg et al., 2003
). Since optic lobe development precedes AOTu development, the formation of the AOTu might be initiated by subsequent afferent innervation from there.
Hormonal Regulation of Metamorphic Brain Development
The major developmental hormones in insects are the juvenile hormones and the ecdysteroids. Interaction between these hormones causes the switch from larval to pupal development in holometabolous insects (for a recent review see Truman, 2009
). In M. sexta, the major circulating ecdysteroid during metamorphosis is 20-hydroxyecdysone (20E; Warren and Gilbert, 1986
). Effects of 20E on metamorphic development of the nervous system of M. sexta have been shown in several studies: the pupal 20E peak regulates the fusion of thoracic and abdominal ganglia (Amos et al., 1996
), it controls cell proliferation during genesis of the optic lobes and the retina but also programmed cell death of optic lobe neuroblasts (Champlin and Truman, 1998a
,b
, 2000
), and the onset of the formation of the olfactory glomeruli (Schachtner et al., 2004a
). The pupal 20E peak also regulates the pupal expression of tyramine β-hydroxylase, an essential enzyme for octopamine biosynthesis (Lehmann et al., 2000
) and the expression of several neuropeptides in the developing AL (Schachtner et al., 2004b
; Utz and Schachtner, 2005
; Utz et al., 2008
). The start of massive volume increase of all examined neuropils parallels the 20E hemolymph titer which starts to increase from stage P3 (Figure 7
; Warren and Gilbert, 1986
). This suggests that a low threshold of 20E is sufficient for the onset of differentiation and growth of most brain neuropils including newly formed neuropils but also persistent larval neuropils. In addition to the presence of 20E other signals are needed to coordinate the development of brain neuropils. For example, in Manduca and Drosophila ingrowing photoreceptor axons stimulate proliferation in the outer optic anlagen (Selleck and Steller, 1991
; Huang and Kunes, 1996
) and in the antennal lobe, ingrowing axons of the receptor neurons are needed to form the protoglomeruli, the templates for the later developing olfactory glomeruli (Oland and Tolbert, 1996
). During ongoing pupal development, higher 20E thresholds are needed for further neuropil specific differentiation like the stop of mitosis and the start of neuroblast apoptosis in the outer optic anlagen (Champlin and Truman, 1998b
) or the onset of glomerulus formation in the AL (Schachtner et al., 2004b
).
3D Digital Brain Atlases and 4D Animation
This study provides 3D reconstructions of defined neuropils at different stages during metamorphosis of the sphinx moth brain. These 3D reconstructions were then used to produce a digital animation which visualizes the development of the individual neuropils in context to each other. M. sexta has been used for decades as a model to study metamorphic brain development but so far no anatomical atlases comparing form, volume, and position of neuropils at different metamorphic stages were available. Our study adds this anatomical information in a digital form and the 3D data sets can be provided on request. A comparison between published data on metamorphic brain development (see above) and our study clearly revealed additional new information e.g. detailed positional information and information on volume increases along the developmental timeline. Data sets like the one we provided here can be used as a basis for a growing digital framework in which all available information on different developmental steps can be provided. This can include anatomical data, ranging from gross anatomy to single cells, but also experimental data of any kind including physiological and even genetical data. The advantage of digital brain atlases or databases has been recognized by the research community and meanwhile such atlases have been introduced for vertebrate and invertebrate brains serving a wide range of purposes in basic research, but its importance also in applied medicine are obvious. For example, digital brain atlases of the human brain are available mainly based on MRI but also an increasing set of other data sources, storing information on brain variations across age and gender, comparing brains in health and disease, and providing data in large human populations (for recent reviews see Toga and Thompson, 2001
; Toga et al., 2006
). Among other interesting approaches including e.g. pest control and evolutionary questions, insects have a long tradition as models for basic questions in neuroscience ranging from the development of the nervous system to plasticity and memory formation. In this context digital atlases of certain insect models have been provided including standardized brains to relate individual variations. These atlases are intended as frameworks to allow the mapping of neurons provided by different researchers (Brandt et al., 2005
; Kurylas et al., 2008
; Kvello et al., 2009
; el Jundi et al., 2010
), to study genetical variations (Rein et al., 2002
; Jenett et al., 2006
), and in general developmental and adult plasticity (el Jundi et al., 2009
; Dreyer et al., 2010
). One example which nicely demonstrates the usefulness of such atlases are maps of the olfactory glomeruli of certain insects which serve as tools to study development, function and plasticity of the glomerular network (e.g. Galizia et al., 1999
; Sachse and Galizia, 2003
; Fishilevich and Vosshall, 2005
; Skiri et al., 2005
; Deisig et al., 2006
; Zhang et al., 2006
; Root et al., 2007
; Sachse et al., 2007
; Riffell et al., 2009
; Staudacher et al., 2009
; Varela et al., 2009
).
One major advantage of 4D visualization is clearly the didactical value; watching the animated brain development allows for better comprehension of neuropil growth and movement in its temporal context. This is not only helpful for researchers coming from a different organism and who want to compare developmental processes, but also for beginners in the field and last but not least for students. Owing to increasing computer power, internet bandwidth, and accessibility, digital databases of brain architecture and function including development and 4D visualization will in the future be accessible in an interactive way via web based access. Ideally, this access is then provided via ontologies, which allows the use of these data bases not only for the specialists but also for other researchers and students.
The authors declare that the research was conducted in the absence of any commercial or financial relationship that could be construed as a potential conflict of interest.
The authors thank Dr. Erich Buchner (University of Würzburg, Germany) for kindly providing the anti-synapsin antibody. The authors are also grateful to Dr. Uwe Homberg for many fruitful discussions, and Martina Kern and Torsten Bauschke for expert technical assistance. This work was supported by a DFG grant (SCHA 678/3-3) to Joachim Schachtner.
The Supplementary Material for this article can be found online at http://www.frontiersin.org/systemsneuroscience/paper/10.3389/fnsys.2010.00007/
Dreyer, D., Vitt, H., Dippel, S., Goetz, B., el Jundi, B., Kollmann, M., Huetteroth, W., and Schachtner, J. (2010). 3D standard brain of the red flour beetle Tribolium castaneum: a tool to study metamorphic development and adult plasticity. Front. Syst. Neurosci. 4:3. doi: 10.3389/neuro.06.003.2010.