
- 1 Machine Learning Laboratory, Berlin Institute of Technology, Berlin, Germany
- 2 Bernstein Center for Computational Neuroscience, Berlin, Germany
Representing an intuitive spelling interface for brain–computer interfaces (BCI) in the auditory domain is not straight-forward. In consequence, all existing approaches based on event-related potentials (ERP) rely at least partially on a visual representation of the interface. This online study introduces an auditory spelling interface that eliminates the necessity for such a visualization. In up to two sessions, a group of healthy subjects (N = 21) was asked to use a text entry application, utilizing the spatial cues of the AMUSE paradigm (Auditory Multi-class Spatial ERP). The speller relies on the auditory sense both for stimulation and the core feedback. Without prior BCI experience, 76% of the participants were able to write a full sentence during the first session. By exploiting the advantages of a newly introduced dynamic stopping method, a maximum writing speed of 1.41 char/min (7.55 bits/min) could be reached during the second session (average: 0.94 char/min, 5.26 bits/min). For the first time, the presented work shows that an auditory BCI can reach performances similar to state-of-the-art visual BCIs based on covert attention. These results represent an important step toward a purely auditory BCI.
Introduction
Recent successes have been booked in the application of brain–computer interface (BCI) technology at the end-user’s home, both for communication (Nijboer et al., 2008b; Sellers et al., 2010) and other purposes (Münssinger et al., 2010). BCIs allow for a direct connection between the brain and the external world. Interpretation of the brain signals is generally performed in realtime and users can thus interact with a device by changing their brain state. Apart from applications for healthy users (Nijholt et al., 2009; Tangermann et al., 2009; Blankertz et al., 2010), BCI technology was ultimately meant to allow otherwise paralyzed people to communicate and interact with their environment again.
Most of the aforementioned studies are based on visual event-related potentials (ERP). Their use in BCI was introduced by Farwell and Donchin (1988) and they have been a major focus in BCI research. This study describes a BCI that is based on auditory ERPs, which may extend the work on visual ERPs in several important aspects.
In an exploratory study (Huggins et al., 2011), 61 people suffering from mid-stage amyotrophic lateral sclerosis (ALS) were included with ALSFRS-R ratings ranging from 18 to 33 (Cedarbaum et al., 1999). The authors found that a larger portion of their population suffered from auditory (42%) than visual (25%) deficits. On the other hand, a recent study which followed a patient with ALS through the late stages of the disease, reported that a disease-resistant BCI may only be possible through the auditory or proprioceptive pathways (Murguialday et al., 2010). Indeed, several studies show that the traditional visual BCI paradigms may not function well when eye-gaze control is limited (Brunner et al., 2010; Treder and Blankertz, 2010). A user group with such heterogeneous abilities and needs clearly stipulates the necessity for a range of diverse BCI systems. For these reasons, the interest in additional BCI paradigms has grown in recent years.
Some studies report that by using a different interface, a visual ERP BCI can be realized that does not depend on eye-gaze control (Acqualagna et al., 2010; Liu et al., 2011; Treder et al., 2011). Another approach could be to switch to a different sensory domain altogether, by using auditory- (Hinterberger et al., 2004; Kanoh et al., 2008; Nijboer et al., 2008a; Kim et al., 2011; Vlek et al., 2011) or vibrotactile cues (Cincotti et al., 2007; Brouwer and van Erp, 2010) for feedback or stimulation. Auditory stimulation usually involves an oddball paradigm where the user is exposed to stimuli that differ from each other on some property. The user is required to focus attention to one of them. Such paradigms generally involve tones with differences in pitch, resulting in a binary BCI (Hill et al., 2005; Halder et al., 2010). Multi-class approaches have been described using different environmental sounds (Klobassa et al., 2009) or spoken words or numbers (Sellers and Donchin, 2006; Furdea et al., 2009; Kübler et al., 2009; Guo et al., 2010). Though this increases the number of options per selection, presentation of such stimuli is inherently slower. Furthermore, the mapping is often not intuitive, so that the matrix is still shown (albeit not flashed).
Of special interest is a recent study (Kübler et al., 2009), which describes a patient trial with the paradigm previously reported in (Furdea et al., 2009). Four subjects suffering from ALS received extensive training with the auditory BCI. Three of them were close to, or in the locked-in state (LIS, only residual eye-movement), whereas the forth was entering the totally LIS (TLIS, no residual eye-movement). Though all four subjects had control over a visual BCI, they performed poorly on the auditory BCI. The authors acknowledge however the importance of the auditory modality for BCI. One of their suggestions for improvement is a spatial distribution of the stimuli.
Several studies indeed show that using stimuli with spatial features can improve performance (Schreuder et al., 2009; Höhne et al., 2010). In offline studies, adding spatial information to an auditory stimulus was beneficial to the recognition, both expressed in reaction times or accuracy (Belitski et al., 2011) and classification performance (Schreuder et al., 2010). Furthermore, it allows for an intuitive multi-class auditory BCI without sacrificing speed. Such paradigms could even be used to extend traditional (visual) BCIs to improve performance or facilitate training during the late stages of ALS (Belitski et al., 2011).
The current study is an extension of Schreuder et al. (2010), where the principle of a paradigm using spatial auditory stimuli was first shown (it was later called Auditory Multi-class Spatial ERP, or AMUSE). Here, AMUSE drives a spelling interface in online mode. Using six spatial locations and a two-step, hex-o-spell like speller interface (Blankertz et al., 2006), subjects were enabled to write by attending tones in space.
It is shown here that AMUSE, combined with the speller interface, allows for reliable online spelling for a majority of healthy subjects. The proposed speller interface is intuitive and easy to learn. Its core components (stimulation, spelling tree navigation, and result feedback) are realized in the auditory domain. Average spelling performance was high, out-performing current auditory BCIs. Furthermore, a new method for dynamically changing the number of stimuli was introduced. Based on the data gathered, a trial could thus either be stopped if a threshold was reached, or continued. This method further increased the performance significantly by reducing trial length.
Materials and Methods
Participants
Participants were 21 subjects that had never worked with a BCI before (BCI naïve). They reported no current or prior neurological disorder and normal hearing. The latter was not formally tested. Subjects were financially compensated for their participation. Age ranged from 20 to 57 (m = 34.1, SD = 11.4). Procedures were approved by the Ethics Committee of the Charité University Hospital. All subjects provided verbal and written informed consent and subsequent analysis and presentation of data was anonymized.
Data Acquisition
EEG was recorded using a fixed set of 56 Ag/AgCl electrodes and BrainAmp amplifiers (Brain Products, Munich, Germany). Channels were referenced to the nose. Electrooculogram (EOG) was co-recorded with two bipolar channels. All impedances were kept below 15 kΩ. Only for subject VPfce did the impedance exceeded this threshold at the end of the session. The signals were sampled at 1 kHz and filtered by a hardware analog band-pass filter between 0.1 and 250 Hz before being digitized and stored for offline analyses. For online use, the signal was low-pass filtered below 40 Hz, down sampled to 100 Hz and streamed to the online Berlin BCI system.
The stimulus presentation, the online Berlin BCI system and the offline analyses were implemented in Matlab (MathWorks), making use of the Psychophysics Toolbox (Brainard, 1997) for multichannel audio presentation and the open-source text-to-speech system Mary (Schröder and Trouvain, 2003). A multichannel, low-latency firewire soundcard from M-Audio (M-Audio FireWire 410) was used to individually control the active, off-the-shelf computer speakers (type Sony SRS-A201).
Parameter Screening
A dependence of ERP amplitude and latency on stimulus amplitude and duration, particularly in the early components, has previously been reported (Gonsalvez et al., 2007). To investigate this for the AMUSE paradigm, two parameter screenings were conducted, testing for the influence of stimulus loudness and duration on classification performance. The studies were performed with six and seven healthy subjects, respectively.
Results of both the parameter screening did not expose a systematic influence on the classification performance. Also, the subjectively reported favorite condition could not be matched with the condition giving the highest score. Parameters were therefore fixed to those used in Schreuder et al. (2010; ∼58 dB and 40 ms).
Stimuli
The localization of a stimulus in the azimuth plane depends mainly on two principles, interaural timing differences (ITD) and interaural level differences (ILD), which both have their own optimal frequency range (Middlebrooks and Green, 1991). Where the ITD effect is most efficient for frequencies up to 1–1.3 KHz, the ILD effect provides the localization information for higher frequencies, roughly >3 KHz. Offline analyses showed that spatial location as a discriminative feature is enough to reliably elicit a P3 response (Schreuder et al., 2009, 2010). However, to optimally exploit both effects, stimuli consisted of a low frequent tone with harmonics and a high frequent, band-pass filtered noise overlay (see Table 1). To further increase resolution, each of the six directions was associated with a unique combination of tone and noise to add an additional cue property. Stimuli can be found in Data Sheet 1 of the supplementary data.
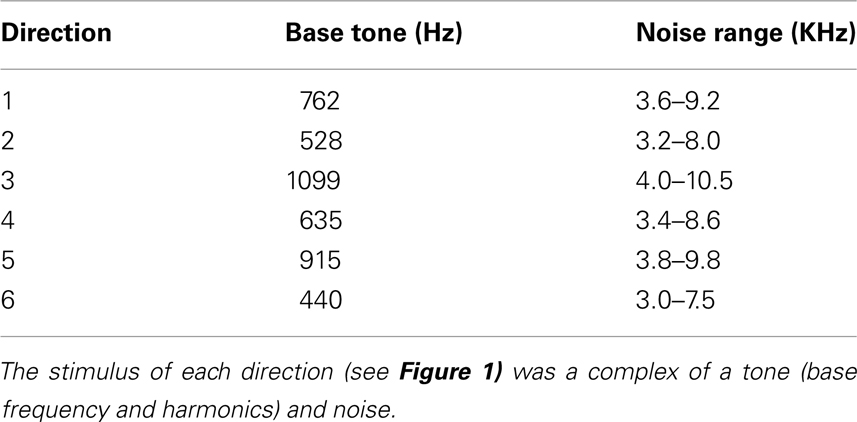
Table 1. Stimulus properties.
Procedure
Subjects sat in a reclining chair, facing a screen with a fixation cross at ∼1 m. They were surrounded by six speakers at ear height, evenly distributed in a circle with 60° distance between them (see Figure 1A) which is well over the resolution of spatial hearing in the azimuth plane (Grantham et al., 2003). Circle radius was ∼65 cm and speakers were calibrated to a common stimulus intensity of ∼58 dB. The room was neither electromagnetically shielded, nor were extensive sound attenuating precautions taken. Before the experiments, subjects were asked to minimize eye movements and muscle contractions during recording periods.
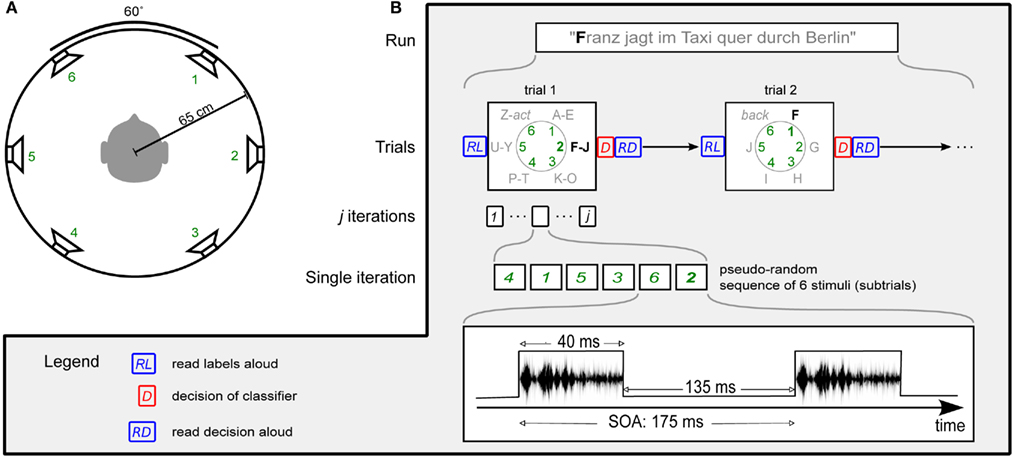
Figure 1. Experimental protocol. (A) Subjects were surrounded by six speakers at ear height. Speakers were equally spaced with 60° angle between neighbors, with a circle diameter of 65 cm. (B) Visualization of the experimental protocol in the online phase. In Session 1, the number of iterations j was set to 15. For Session 2, j was determined by the dynamic stopping method. No labels were read aloud (RL) in Session 2.
The experimental protocol is visualized in Figure 1B. A run, or sentence, consisted of several trials. Each trial, or selection, consisted of several iterations. During one iteration all speaker locations were stimulated exactly once in a pseudo-random order, before proceeding to the next iteration. This pseudo-random sequence was generated such that (1) between two stimuli from one speaker, there were at least two other stimuli and, (2) two successive stimuli never came from neighboring speakers. A single stimulus is hereafter referred to as a subtrial. The stimulus onset asynchrony (SOA) was set to 175 ms.
The amount of iterations/trial influences the efficiency of the system. A high number is likely to increase the accuracy, but at the same time it increases the time needed for a selection. Vice versa, a low number will allow for quicker selections, but they are likely to contain more errors. Therefore, two settings were tested: (1) a fixed number of 15 iterations and, (2) a method which allows for determining the number of iterations on runtime.
During a trial, the subject’s task was to focus attention to one (target) of the six directions and mentally count the number of appearances. During the calibration phase the target was given to the subject explicitly. During the writing phase the target direction was not given explicitly, but had to be inferred from the spelling interface.
All 21 subjects performed a first session (Session 1), and those that reached a performance level that allowed them to write the given sentence were invited for a second session (Session 2).
Spelling Interface
For online writing, an adapted version of the hex-o-spell speller (Blankertz et al., 2006) was created in which a character can be selected in two steps. First a group of characters is selected (group “F–J” in Figure 1B) by focusing on the corresponding direction. In the second step the characters of this group are divided over five of the directions and an individual letter can be selected. Choosing the sixth direction returns the user back to the first selection step, thus preventing a wrong letter selection. Which (group of) letter(s) corresponds to a direction – and which direction had been selected – could be read out to the user using speech synthesis (Schröder and Trouvain, 2003). The copy text and progress were presented visually.
Session 1
First, subjects were familiarized with the sounds, after which about 30 min of calibration data were recorded. Subjects performed 48 trials, 8 for each direction. At the start of a trial the target direction was indicated both visually (one of six on-screen dots highlighted) and auditory (by playing the direction specific cue from the target location). After that, stimulation was purely auditory and subjects were asked to count the number of target appearances in the trial and report them. Each calibration trial consisted of 15 iterations. However, in order to have a varying number of targets and thus have a more challenging task, a prequel consisting of varying length (1–3 iterations) was added. That the visual target presentation was not necessary was proven in a session with a single, blind subject.
Then, subjects were asked to write word for word one of two sentences: “FRANZ JAGT IM TAXI DURCH BERLIN” or “SYLVIA WAGT QUICK DEN JUX BEI PFORZHEIM.” Sentence assignment was random. Wrong letters had to be corrected by the user by performing a backspace action, requiring two selections. No prequel was included. The stimulation sequence and the overhead of label, and result presentation for a single trial took around 34 s. With a two-step letter selection process, the maximum theoretical speed is thus 0.89 char/min.
Session 2
Subjects who were able to successfully write with the system in Session 1 came back for Session 2. This session consisted of a calibration phase – equal to Session 1 – and the online writing of two German sentences. For Session 2 the protocol was adjusted in several ways. First, a dynamic stopping method was introduced which could stop a trial after 4–15 iterations when enough evidence for a correct selection was found (see below). Second, subjects were asked to study the selections that are needed for each character at home. They were no longer provided with auditory labels prior to a trial, which reduced the trial time by about 6.2 s. The maximum theoretical speed with 15 iterations was thus 1.10 char/min.
During the first sentence, subjects got visual information on the labels to familiarize them again with the interface. During the second sentence this was turned off, thus relying exclusively on the auditory sense. During both sentences, subjects still received auditory information after a selection to know their current location in the spelling tree. The first sentence was the remaining sentence from Session 1, whereas the second sentence could be chosen by the subject but should be at least five words long.
Features and Classifier
Classification was done on each subtrial, thus reducing the problem to a binary task, i.e., to classify each subtrial as a target or non-target. Spatio-temporal features for classification were extracted according to the following procedure. First the data were baselined, using the 150-ms pre stimulus data as reference. Then, the sample-wise r2 coefficient was calculated for targets vs. non-targets. Based on this, a set of two to four intervals with high discriminative information content were hand-picked, such that both early and late components were represented. All samples within each interval were then averaged, so that one interval was represented by one feature per channel. This resulted in an overall dimensionality of 112–224 features.
The benefit of this method over conventional sub sampling (Krusienski et al., 2006; Schreuder et al., 2010) is a relatively small number of features per channel which capture most of the discriminative information. Furthermore, by combining consecutive samples instead of picking individual samples, as is the case in step-wise linear discriminant analysis (Farwell and Donchin, 1988), the interpretation of the chosen features is straight-forward and a priori knowledge can be included during the selection. Using this feature vector, a linear, binary classifier was trained. In order to prevent overfitting, the classifier was conditioned using shrinkage regularization (Ledoit and Wolf, 2004; Blankertz et al., 2011).
Decision Making
The classifier was trained to assign negative scores to target subtrials and positive scores to non-target subtrials. Let X ∈ ℝC × J be a matrix of classifier scores of a trial, where C is the number of classes (six in our case), and J the number of performed iterations. If c = {1,…,C}, then let  be a row vector, where
  denotes the median value of classifier scores for class c. The winning class c* can be described as
  i.e., the class with the lowest median value. For Session 1 J was fixed to 15.
In order to further optimize the spelling speed, a dynamic stopping method was introduced in Session 2. Such a method allows for trials with less than 15 iterations, when the obtained data support an early stop. Different methods for tackling this have been introduced to BCI before (Serby et al., 2005; Lenhardt et al., 2008; Zhang et al., 2008; Liu et al., 2010), and were mainly tested in the context of visual ERP based BCI and one-step interfaces.
It can be assumed that at a low number of iterations the quality of a decision will be susceptible to sporadic outlying classifier scores, and that the influence of these will decrease with an increasing number of iterations. In line with this assumption, an approach which uses iteration-specific thresholds was designed. Thresholds are based on the calibration data, and are thus subject specific.
The variable p is defined as the distance from  to the second lowest value in
  It represents a confidence measure of the winning class. Note that, as this is a relative value, it is robust to linear biases that might arise when moving from the calibration phase to the online phase. In the online setting, the BCI checks after each iteration j ∈ {1,…,J} if pj – based on the data gathered thus far – exceeds threshold
  (see below). If so, the trial is stopped and class c* is selected.
Heuristic for decision threshold determination
For finding the decision thresholds  the trained classifier is re-applied to the complete calibration data. Although this can be considered overfitting and might lead to an overestimation of the class distances, it is not consider as a caveat when finding a conservative threshold.
For calculating  we consider all calibration data collected within a trial, up to iteration j. First, the winning class for this iteration
  and the confidence pj are calculated and pj is assigned a label; true
  if
if  corresponds to the target direction, and false
  otherwise. This is repeated for each trial n ∈ {1,…, N} and iteration j, and results are collected in the matrices
  and
and  . In order to approximate a smooth upper error bound, a third order polynomial F is fitted to the upper limit of P−. Then, if fj refers to the value of F at iteration j, the iteration-specific threshold Tj is defined as the maximum of fj and the product of the median of column j in P+ and R. The hyperparameter R is used to control the number of false negative stops. In this study, R was set to 1, which means that maximally only 50% of possible correct early stops is recognized. The above is visualized in Figure 2.
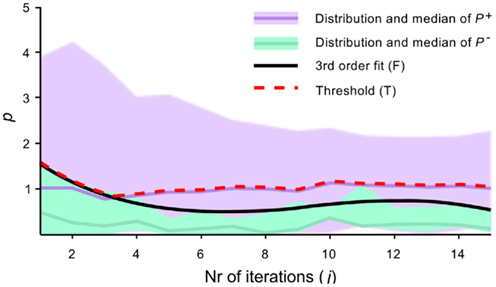
Figure 2. Visualization of iteration-specific decision threshold. The confidence measure p is plotted for correct (P+) and incorrect (P−) decisions as a function of the number of iterations j. The black line F is fitted to the maximum values of P−. The decision threshold T is defined as the maximum of F and the median of P+.
The threshold is rather conservative, as it is biased away from false positives (incorrect early stops). The rational behind such a conservative threshold is that any false positive is costly, as correcting an error takes up to four selections. For applications where a false selection is less costly, the threshold can be set less conservative by taking a smaller value for R.
Data Analyses
The BCI performance evaluation was done online, unless stated otherwise. Three evaluation metrics were calculated for each subject and each sentence: accuracy (acc), characters per minute (char/min), and information transfer rate (ITR; Schlögl et al., 2007). We define accuracy as the number of correct selections divided by the total amount of selections. Accuracy assesses the performance of the BCI, irrespective of the application interface.
For assessing the BCI in combination with the spelling application we used char/min as the preferred metric for writing proficiency. Char/min is defined as the number of correctly written letters divided by the time it took to write all letters (including incorrect letters). Here, it gives a particular conservative estimate, as subjects had to correct any mistakes. Thus, all letters are in the end correct at the cost of longer writing time (and lower char/min). This is a more realistic assessment of the system’s usefulness, as it includes the error recovery strategy. In a real user setting, errors will occur and may have to be corrected.
For the sake of comparison, the ITR is also reported. We use the calculation method proposed by Schlögl et al. (2007), as there are systematic confusions between directions. ITR combines the accuracy, number of possible decisions, and the number of selections per minute into a single number. Originating from information theory, it assesses information transfer over a noisy channel. Although often used in BCI, it is a theoretical measure and its interpretability in terms of practical relevance of a BCI is difficult.
Directional Preference
The confusion matrix (CM) provides a lot of information about the discriminability of the different classes. From it, the pairwise F-scores were calculated to assess the confusion between each pair of directions. This should expose any systematic directional preference, if present.
Given a confusion matrix CMN × N, where N is the number of classes and each row is normalized, we define the sensitivity and recall for pairs of classes i, j ∈ {1,…,6} as follows
The matrix FN × N of pairwise F-scores is then defined as
where 1 ≤ i ≤ C and 1 ≤ j ≤ C. It is thus the harmonic mean of sensitivity (the ability to identify a target) and recall (the ability to reject a non-target).
Results
Of the 21 subjects, 16 subjects (or 76%) were able to write a full German sentence at first try (Session 1). The other five subjects got at most one word correct, before their experiment was stopped. In Session 2, 14 out of 15 returning subjects wrote both full German sentences. Subject VPfch was able to write the first sentence, but took so long that the session had to be aborted after this. Subject VPfax was unable to return for the second session, although successful in the first session. In the following, sentence 1 refers to the sentence written in the first session, and sentence 2a and 2b to those written in the second session. Individual performance measures for each subject can be found in Table 2. Movie S1 in Supplementary Material shows an example of a user operating the system.
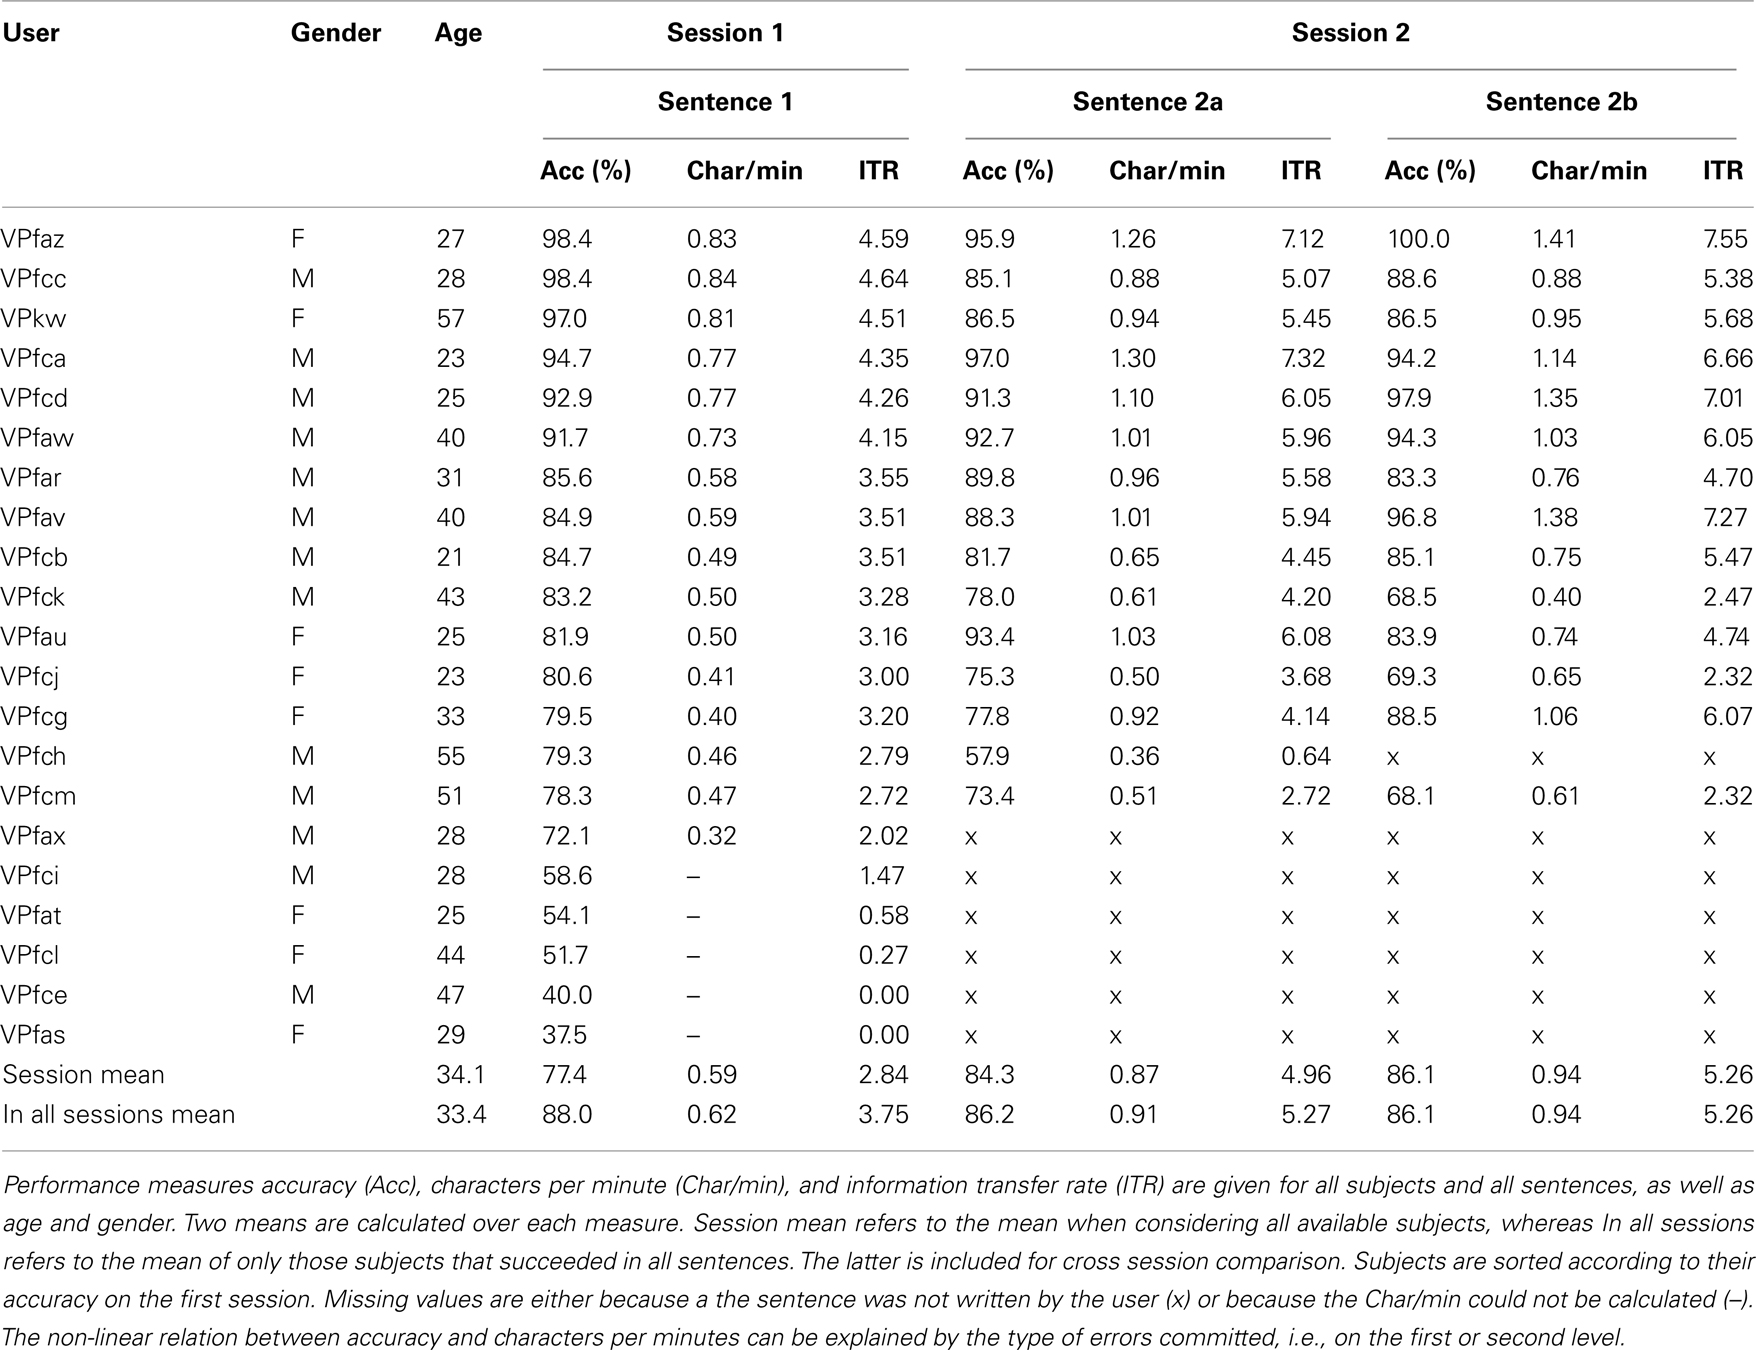
Table 2. Performance summary.
BCI Performance
Brain–computer interface performance did neither correlate with age (r < 0.01, p = 0.75), nor with gender (Kolmogorov–Smirnov test: p = 0.42). Average accuracy per sentence was 77.4, 84.3, and 86.1% for sentence 1, 2a, and 2b, respectively. The increase in performance from Session 1 to Session 2 is due to the drop out of less-performing subjects. This is shown in Figure 3A, which gives the overall accuracy for each subject and each session. Three means were calculated; first, the black line indicates the mean when considering all subjects for a session, as given above. However, as those subjects that were unable to write in the first session did not participate in the second session, the gray line includes only those subjects (N = 14) that finished all three sentences, which is a fairer comparison of the sessions (0.88, 0.86, and 0.86 for sentence 1, 2a, and 2b respectively). No significant difference existed (p = 0.97) between performance in sentence 2a (m = 0.86, SD = 0.08) and 2b (m = 0.86, SD = 0.11). The difference between these conditions is that for sentence 2b the visually presented support labels were switched off. This shows that the spelling tree can easily be learned and thus need not be presented visually.
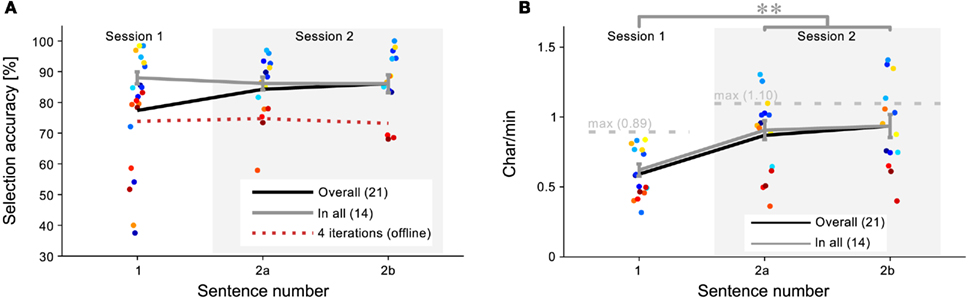
Figure 3. Session differences. Session differences in accuracy (A) and char/min (B) are plotted for all subjects. The black line represents the mean of all subjects in a session and the gray line represents the mean of the 14 subjects that succeeded on all three sentences. (A) No significant difference was found between sessions in the accuracy. No learning effect was found even when the number of iterations was reduced to four, as represented by the red, dotted line. (B) The char/min for Session 2 was significantly better than for Session 1, which is due to early stopping and less label vocalization. Some subjects performed higher than the theoretic maximum char/min, indicating a particular benefit from the dynamic stopping mechanism. Points are slightly displaced on the horizontal axis to prevent clutter.
As the number of iterations varied in Session 2, an offline analysis was performed to objectively assess any learning effect between session. For each sentence, the online classification scores of the first four iterations were used to take a decision (the minimum number of iterations in Session 2 was 4). The red, dotted line in Figure 3A shows these results. No systematic learning effect was present. As sentence 1 (m = 0.88, SD = 0.07) and sentence 2b showed no significant performance difference (p = 0.40), it can thus be concluded that early stopping did not introduce additional errors. Statistical testing was done using two-sided paired t-tests.
Figure 4 shows the accuracy for each subject as a function of the word written in the first sentence, which we take as an approximation of time. Considering only those subjects that were able to finish the session, the slope of the linear least-squares fit between performance and the word number is close to 0, implying that subjects are able to use the interface straight away.
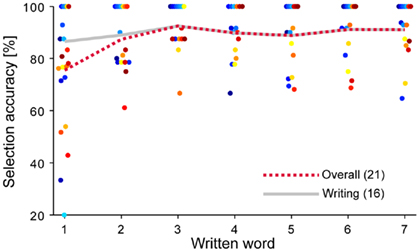
Figure 4. Accuracy over time. Selection accuracy of Session 1 is plotted for each subject as a function of the word written, which approximates time. The gray line represents the mean over the subjects that finished the entire sentence, which shows no significant slope. The red dotted line represents the mean over all subjects.
The average ITR over all 21 subjects of Session 1 was 2.84 bits/min (maximum 4.59 bits/min), which includes also subjects that did not reach a performance level appropriate for writing (see Table 2). When considering only those subjects that performed well on all sentences, the average ITR over Session 1 was 3.75 bits/min. During the second session this increased by 40% to an average of 5.26 bits/min, with a maximum of 7.55 bits/min.
Writing Efficiency
Figure 3B presents the writing proficiency for each subject and each session in terms of characters per minute (char/min). The black line represents the sentence-wise mean for all subjects who finished that sentence. The gray line represents the sentence-wise mean for only those subjects that finished all sentences (N = 14), which will be considered for further analyses. As expected from the accuracy, there is no significant difference between sentence 2a (m = 0.91, SD = 0.25) and sentence 2b (m = 0.94, SD = 0.31) of Session 2 (p = 0.57). However, when comparing sentence 1 (m = 0.62, SD = 0.16) with sentence 2b, a significant increase of 52% can be observed (t = 4.68; p < 0.001). As the accuracy was equal, the increase must be due to improvements in the interface’s efficiency. These were twofold: (1) dynamic stopping was introduced and (2) the vocalization of the labels was omitted. To assess the influence of the dynamic stopping method independently, the 6.2-s time gain from the second modification was added again to sentence 2b in an offline simulation. A significant increase of 37% remains from sentence 1 to the simulated sentence 2b (m = 0.85, SD = 0.26; t = 4.05; p = 0.001). Thus, the dynamic stopping method increases performance significantly by itself. Statistical testing was done using two-sided paired t-tests.
Dynamic Stopping Method
Over all subjects, a total of 3297 online trials were recorded in Session 2. The dynamic method produced early stops in 41.3% of these trials. The maximum number of 15 iterations (full trial) was reached in the remaining 58.7% of the trials. This was in cases where the threshold was not exceeded in iterations 4–14. Early stops before the fourth iteration were not allowed.
About 12.6% of early stops resulted in an incorrect decisions, which is only 5.2% of the overall number of trials. This reflects the conservative threshold policy as described in the methods. At 23.5%, the percentage of errors was almost twice as high for full trials. An obvious explanation is that mostly the “difficult-to-decide-trials” reach the full number of iterations.
As depicted in Figure 5A, the majority of early stops is performed directly at the fourth iteration, with the number of stops decreasing until finally remaining trials are stopped at the 15th trial. At each individual iteration the percentage of incorrect decisions is lower than for full trials.
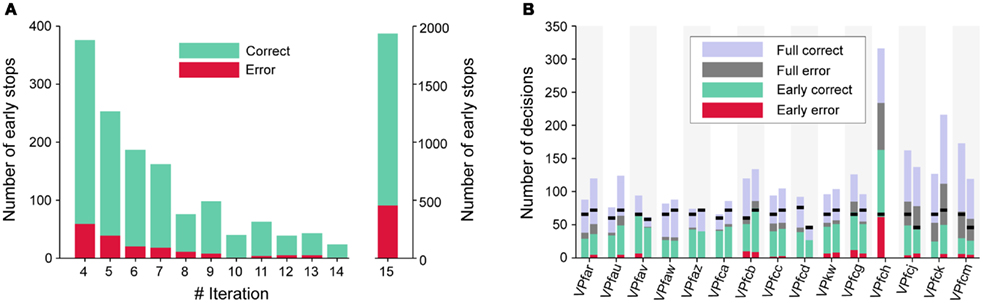
Figure 5. Early stopping performance. For (A), data is collapsed over all subjects that participated in Session 2. The number of correct and incorrect trials are plotted as a function of the iteration in which a trial was stopped. Accuracy is high in general, and particularly for those trials that were stopped before the 15th iteration. The same data is plotted in (B), but separately for each subject and for sentences 2a and 2b. The black markers indicate the minimum number of selections necessary for writing a sentence. Subject VPfch did not perform sentence 2b.
Figure 5B gives the different errors for each subject and sentence 2a and 2b. It shows that the error rate for early stops is relatively low, and similar for all subjects. Only subject VPfch had such a high error rate – both for early stops and full trials – that there was no time left for writing the second sentence. The black lines indicate the minimum number of decisions necessary for writing the particular sentence.
Physiology
Calibration data from the first session of all subjects was pooled and the grand-average calculated. Artifacts were rejected according to a fixed variance criterium and a peak-to-peak difference criterium. Figure 6A shows the grand-average time series for channel Cz. An early component is consistently present, peaking about 130 ms after each stimulus. This causes a rhythmic perturbation of the EEG signal, thereby masking the generally described ERP components. Although present in both target and non-target trials, it is more negative for target trials, i.e., it is attention modulated. An interval from 95 to 200 ms was selected to capture this peak.
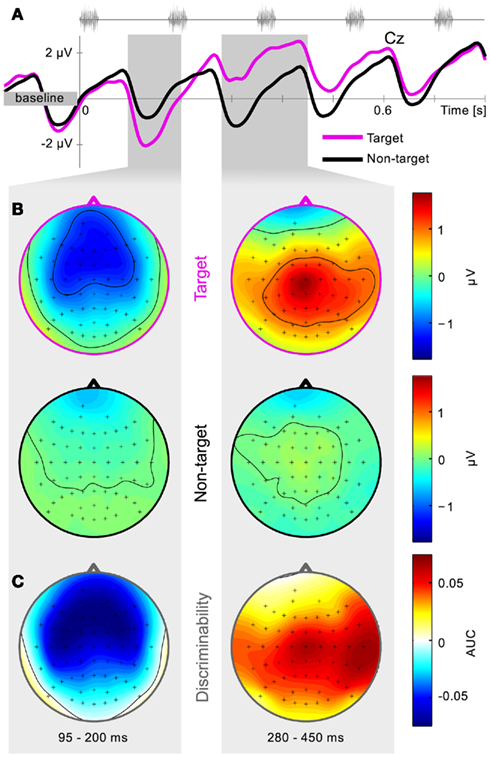
Figure 6. Grand-average physiology. Calibration data of the first session is collapsed over subjects and trials. Average time series for channel Cz are plotted together with the positions of five consecutive stimuli (A). Scalp potential distributions for target and non-target trials are shown in (B) and distributions of class-discriminative information in (C). Two intervals were hand-picked based on the signed AUC values, and are represented by the shaded gray areas. Early negative components over frontal and temporal regions are followed by a positive component over centro-parietal areas.
A positive component is found for target trials, captured in the interval from 280 to 450 ms. Due to both timing and scalp location, we consider this to be what is described as the P3 component.
Figure 6B shows the grand-average scalp topography for both target and non-target trials for both selected intervals, whereas Figure 6C displays the discriminability between those, expressed in signed AUC values (Schreuder et al., 2010). Low voltage amplitude and AUC values are due to inter subject differences. Online data are similar and thus not presented here. It is apparent that the early negative component is found mainly over the frontal and bilateral auditory cortical areas. The later positive component is focused over the central mid-line electrodes and toward the temporal areas. This is in line with previous offline results (Schreuder et al., 2010). It can be noted that in the manual feature extraction procedure, different intervals can be assessed based on this physiological plausibility before being included for online use.
Directional Preference
The grand-average CM can be found in Table 3. Figure 7 displays matrix F of the pairwise F-scores, where high values indicate a good separability between the indicated classes. Diagonal values are irrelevant and marked X. Other elements are marked as location neighbors (l), sound neighbors with 1.5 tone pitch difference (s) and locations that are symmetric in the front–back plane (fb); all are expected to hamper separability. Tone locations were optimized such that no entry has two such labels.
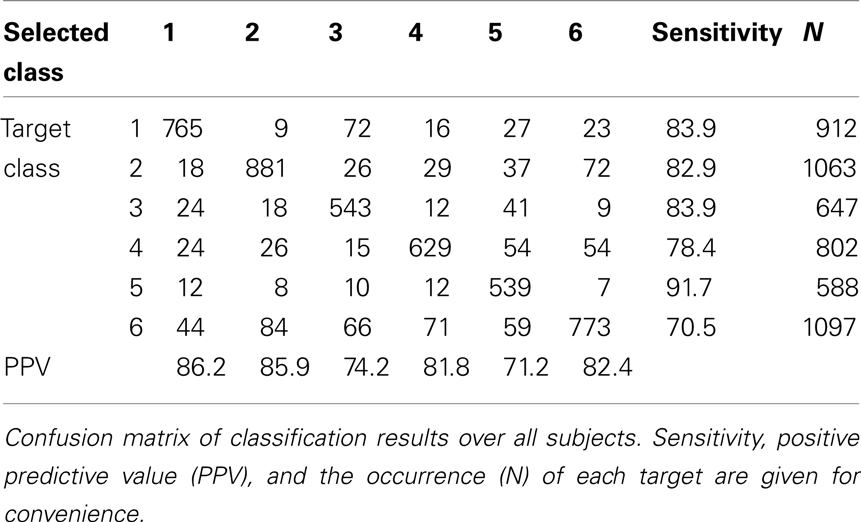
Table 3. Grand-average confusion matrix.
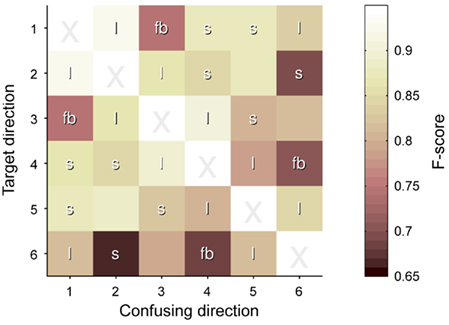
Figure 7. Pairwise F-scores between speaker locations. The matrix visualizes the pairwise confusions between an intended location (y axis) and a distracting location (x axis), expressed in F-scores. Lighter colors mean better discrimination. Entries are labeled as l = location neighbor, s = sound neighbor, and fb = front–back symmetric location.
Directions without any degrading factor had an average pairwise F-score of 0.89 (SD: 0.15). This was only slightly degraded for spatial neighbors (0.87, SD: 0.16), but both pitch neighbors (0.82, SD: 0.19) and especially the front–back confusion (0.76, SD: 0.22) had a larger effect on pairwise discriminability. These effects were investigated by performing pairwise t-tests on the F-scores of each degrading factor with those pairs without degrading factors. After Bonferroni correction, the front–back confusion showed a trend of negative influence on recognition (p = 0.056).
From the pitch neighbors, the highest and lowest pair were most often confused. All this was in line with subjective reporting of the subjects, and gives indicators for future improvements.
Discussion
A previous offline study already showed the potential of the AMUSE paradigm (Schreuder et al., 2009, 2010). Now, coupled to a spelling interface, it allowed a majority of healthy subjects to write a full sentence with an average speed of 0.59 char/min on the first session, and up to a maximum speed of 1.41 char/min in the second session. To our knowledge, this is the fastest online auditory BCI speller described in literature. For the sake of comparison, it is important to emphasize once more the conservative nature of the protocol.
In the first session, 16 out of 21 subjects (or 76%) were able to write a full German sentence. According to Guger et al. (2009) over 90% of people is “able to control a P300-based BCI.” However, as both their tested conditions were overt visual paradigms this may be a too optimistic estimate. The selected BCI paradigms are most prevalent in literature, but may not match fully with the user’s needs and abilities (Brunner et al., 2010; Murguialday et al., 2010; Treder and Blankertz, 2010). Furthermore, for such overt ERP BCI paradigms the learning effect is generally small and average performance is high and consistent over subsequent trials. However, recently Klobassa et al. (2009) showed that for their auditory P3 paradigm the performance increased significantly after 11 sessions. With subjects performing only up to two sessions, such an increase was not observed here. However, with more training the percentage of people able to use the setup could increase.
Performance
To assess the practical relevance of a BCI speller, the most intuitive metric is the number of characters that a user can write per minute. However, as this is not uniformly utilized in BCI literature, it makes direct comparison troublesome. For this reason, the ITR as defined by (Schlögl et al., 2007) was reported. The current setup without any dynamic stopping (Session 1) shows ITR values that are en par with the online results of the state-of-the-art auditory BCI systems (Sellers and Donchin, 2006; Furdea et al., 2009; Klobassa et al., 2009; Höhne et al., 2010), all of which showed the spelling tree through the visual domain. Owing to the intuitive mapping, this need was eliminated here.
With the use of the dynamic stopping method in Session 2, the ITR increased to an average of 5.26 bits/min and a maximum of 7.55 bits/min, which comes close to currently available covert visual BCI systems (Liu et al., 2011; Treder et al., 2011).
Front–Back Confusion
Learning from Schreuder et al. (2010, 2009), the stimuli were optimized for better performance. As shown in Figure 7, the number of detrimental factors was limited. However, speakers with the same angle from the frontal and posterior mid-line – speakers 1 and 3 or speakers 4 and 6 in Figure 1 – were confused relatively often. This type of error is well known in hearing research as the front–back confusion and results from an ambiguity in primary interaural differences, ITD in particular (Wightman and Kistler, 1999).
It was shown that differentiation in the front–back plane relies on at least two features: (1) spectral cues in the range from 8 to 16 kHz, referred to as the extended high frequency range (EHF; Langendijk and Bronkhorst, 2002) and (2) small head movements (Wightman and Kistler, 1999). Bearing in mind the potential end-user and the short stimulus length, the latter may be out of reach. However, for the first feature the noise component of the stimuli used in the current study could be considered suboptimal. Though with aging the sensitivity to this EHF is reduced for a considerable number of people (Fozard and Gordon-Salant, 2001), the upper bound on the noise filter should be increased to 20 kHz to provide a more optimal range.
Furthermore, it is known that for posterior sound sources the intensity of high frequencies is reduced when compared to frontal sources (Blauert, 1983). In this study, the frontal speakers (1 and 6) both had lower frequency ranges in the stimulus complex than their respective confusers in the back (speakers 3 and 4), which may also account for some of the front–back confusion.
As shown in (Carlile et al., 1997), most front–back errors occur for locations within 30° of the median plane. Unfortunately, the before mentioned speakers in this study fall exactly within this range, which introduces a tertiary source for the found confusion.
A simple remedy could be to restrict all speakers to the frontal half, as done offline before (Schreuder et al., 2010; Belitski et al., 2011). When strictly adhering to the azimuth plane, this leads to a decreased angle between neighboring speakers. For a large number of classes it would be an interesting extension to use the vertical plane as an additional dimension to sustain the number of classes without compromising the spatial resolution of human hearing (Grantham et al., 2003). This is however not without caveats itself, as up–down localization may suffer from similar problems as front–back localization.
Dynamic Stopping Method
Increase in performance due to any dynamic stopping method is promising but largely neglected in literature. Though several methods have been introduced before (Serby et al., 2005; Lenhardt et al., 2008; Zhang et al., 2008; Liu et al., 2010), they seldom find their way into online studies other than for the purpose of validating the methods themselves. With an early decision in 41% of all trials and a false positive rate of 5%, we succeeded in constructing a conservative yet effective method for dynamic stopping. The method is loosely based on Lenhardt et al. (2008). However, instead of one global threshold, subject- and iteration-specific thresholds are used. By taking a relative confidence measure (p), the method is robust against biases. The results show again that dynamic stopping can significantly increase performance.
Performance in traditional visual ERP application is generally good even at a low number of iterations. However, things get more difficult when overt attention is impossible (Brunner et al., 2010; Treder and Blankertz, 2010), where performance breaks down and a quality check as provided by a dynamic stopping method may be desirable. The same can be said for auditory paradigms, where covert attention is the standard and the resulting ERPs are less strong. Dynamic stopping methods should thus find their way into BCI research and applications.
Here a decision is enforced after 15 iterations, but an additional benefit of dynamic stopping methods could be to refrain from any decision if no threshold is surpassed. It might prove useful to allow for trials were no decisions is made, to implement a no-control state or to simply refrain from taking uncertain decisions. This could be particularly useful in long-term use of a system, where at times the user may be in a no-control state (Huggins et al., 2011).
Toward a Purely Auditory Modality
Most auditory BCI spellers described in literature depend to a certain extend on the visual modality for presenting a helping matrix (Furdea et al., 2009; Klobassa et al., 2009; Kübler et al., 2009; Höhne et al., 2010; Belitski et al., 2011) to the user. By designing an intuitive interface, presentations of such a (static) matrix was not necessary in the current study. Users could easily learn the required steps for writing a letter. Sentence 1 and 2b were written without any visual feedback other than the writing progress. Although this requires some additional time to present to the user his current position in the spelling tree, it represents a new step toward a purely auditory BCI. Though not presented here, it is worth noting that the system has been used successfully by a blind collaborator to spell a sentence, using exclusively the auditory cues.
Of course, a completely auditory BCI is not always required. Residual eye control may not suffice for a visual BCI, but could be good enough for presenting a static matrix. Furthermore, there are cases imaginable where auditory stimulation may be preferable over visual ones even when the visual modality is in tact. For instance, auditory stimuli may be easier to ignore and less intrusive when the user is engaged in a (primary) visual task such as reading.
In a recent study it was shown that auditory distraction has no effect on BCI systems based on mental tasks Friedrich et al. (2011). It is not clear if this holds true for auditory ERP BCI systems, as interaction in the same modality occurs. The level of distraction could depend on the relative loudness and the user’s ability to concentrate. That this is not necessarily a problem became obvious when subject VPkw helped us out in a demonstration for the local television. She performed a near-perfect spelling session, whilst TV cameras were being set up in the room and the crew was talking.
Though not explicitly tested here, the current setup with added pitch cues may be particularly suited for patients that are practiced musicians, as their improved tone hearing can increase the benefit from these pitch cues (Micheyl et al., 2006).
Future Recommendations
Although the AMUSE paradigm was now embedded in a speller system, it may proof useful in other domains. For instance, the speaker distribution on the azimuth plane could provide a user with an intuitive set of commands for spatial navigation. Also, by including secondary ERP signals such as the ErrP (Schalk et al., 2000; Schmidt et al., 2011) for post hoc analysis of a decision, the system could be expected to increase in usability.
The SOA of 175 ms used in this study was not optimized. Any SOA represents a trade-off between single-subtrial SNR and the number of repetitions needed. On the one hand, each subtrial is expected to contribute more class-discriminant information with a longer SOA. This can be explained by changed average amplitudes of target components, e.g., increased target P3 and N2, due to larger target-to-target distances (Gonsalvez and Polich, 2002; Allison and Pineda, 2006) and longer inter-stimulus intervals (Polich et al., 1991). But even other non-target ERPs can have an influence on the classification accuracy, e.g., the sensitivity of N1 and P2 to SOA and target-to-target distances (Budd et al., 1998; Allison and Pineda, 2006). On the other hand, the BCI system agglomerates evidence over time by repeated presentation of the stimuli. With a fast SOA, more repetitions can be performed within the same time, which compensates for the lower information content in each individual subtrial. Due to increased overlap in fast paradigms, this interaction has to be considered carefully. As the best SOA value is probably subject dependent, an individualization for patients or other long-term users seems advisable.
Investigations of the basic ERP characteristics of ALS patients report a decrease of amplitude not only for the P3(a) (Silvoni et al., 2009) component, but also for the N1 and MMN (N2) components (Raggi et al., 2008) in auditory and visual oddball paradigms. An increase of P3 latency has also been described (Hanagasi et al., 2002; Paulus et al., 2002), even in direct correlation with ALS severity and months from disease onset (Raggi et al., 2008). Still, reports on ERP based BCI systems for patients are encouraging. Silvoni et al. (2009) found no correlation between clinical data and BCI performance for 21 early and mid-stage ALS patients in an auditory ERP BCI, even though the P3 amplitude was reduced when compared to healthy controls. Furthermore, several applications for ALS patients have been published that show the feasibility of visual and auditory ERP paradigms (Sellers and Donchin, 2006; Nijboer et al., 2008b). The question if ERP paradigms are suited for late stage ALS patients still remains open.
Recently an alternative auditory method was introduced, called PASS2D (Höhne et al., 2011), which is based on (Schreuder et al., 2010). Instead of using a free-field setup, a headphone setup was tested using cues differing in two dimensions (tone and location). The PASS2D and AMUSE paradigm have similarly high performances, which are competitive with state-of-the-art visual, covert attention BCIs. They furthermore complement each other in several interesting aspects. A headphone setup is portable, small, and requires very little alteration to the home environment. It may be better suited for mobile user. On the downside, headphones may lead to social exclusion as the user might have limited perception of environmental sounds. The AMUSE paradigm is less mobile and requires an initial mechanical setup to position the speakers around the user. However, no social exclusion occurs, as the user can perceive stimuli and environmental sound at the same time. As end-users might be relatively immobile, the choice between AMUSE and PASS2D depends on the user’s liking.
In conclusion, the AMUSE paradigm complements the current visual BCI systems with a realistic and high performing alternative. The majority of users can successfully control the system and concrete steps of improvement have been offered. Furthermore, a method for dynamic trial stopping was introduced, which significantly increased performance.
Conflict of Interest Statement
The authors declare that the research was conducted in the absence of any commercial or financial relationships that could be construed as a potential conflict of interest.
Acknowledgments
The authors would like to thank Thomas Denck, David List and Larissa Queda for their help with performing the experiments. Furthermore, they thank Klaus-Robert Müller and Benjamin Blankertz for their fruitful discussions on the methodology. This work was partly supported by the European Information and Communication Technologies (ICT) Programme Project FP7-224631 and 216886, by grants of the Deutsche Forschungsgemeinschaft (DFG; MU 987/3-2) and Bundesministerium fur Bildung und Forschung (BMBF; FKZ 01IB001A, 01GQ0850) and by the FP7-ICT Programme of the European Community, under the PASCAL2 Network of Excellence, ICT-216886. This publication only reflects the authors’ views. Funding agencies are not liable for any use that may be made of the information contained herein.
Supplementary Material
The Data Sheet 1 and Video 1 for this article can be found online at http://www.frontiersin.org/neuroprosthetics/10.3389/fnins.2011.00112/abstract
References
Acqualagna, L., Treder, M. S., Schreuder, M., and Blankertz, B. (2010). A novel brain-computer interface based on the rapid serial visual presentation paradigm. Conf. Proc. IEEE Eng. Med. Biol. Soc. 1, 2686–2689.
Allison, B. Z., and Pineda, J. A. (2006). Effects of SOA and flash pattern manipulations on ERPs, performance, and preference: implications for a BCI system. Int. J. Psychophysiol. 59, 127–140.
Belitski, A., Farquhar, J., and Desain, P. (2011). P300 audio-visual speller. J. Neural Eng. 8, 025022.
Blankertz, B., Dornhege, G., Krauledat, M., Schröder, M., Williamson, J., Murray-Smith, R., and Müller, K.-R. (2006). “The Berlin brain-computer interface presents the novel mental typewriter Hex-o-Spell,” in Proceedings of the 3rd International Brain-Computer Interface Workshop and Training Course 2006 (Graz: Verlag der Technischen Universität Graz), 108–109.
Blankertz, B., Lemm, S., Treder, M. S., Haufe, S., and Müller, K.-R. (2011). Single-trial analysis and classification of ERP components – a tutorial. Neuroimage 56, 814–825.
Blankertz, B., Tangermann, M., Vidaurre, C., Fazli, S., Sannelli, C., Haufe, S., Maeder, C., Ramsey, L. E., Sturm, I., Curio, G., and Müller, K.-R. (2010). The Berlin brain-computer interface: non-medical uses of BCI technology. Front. Neurosci. 4:198. doi: 10.3389/fnins.2010.00198
Blauert, J. (1983). Spatial Hearing: The Psychophysics of Human Sound Localization. Cambridge, MA: MIT Press.
Brouwer, A.-M., and van Erp, J. B. F. (2010). A tactile P300 brain-computer interface. Front. Neurosci. 4:19. doi: 10.3389/fnins.2010.00019
Brunner, P., Joshi, S., Briskin, S., Wolpaw, J. R., Bischof, H., and Schalk, G. (2010). Does the “P300” speller depend on eye gaze? J. Neural Eng. 7, 056013.
Budd, T. W., Barry, R. J., Gordon, E., Rennie, C., and Michie, P. T. (1998). Decrement of the N1 auditory event-related potential with stimulus repetition: habituation vs. refractoriness. Int. J. Psychophysiol. 31, 51–68.
Carlile, S., Leong, P., and Hyams, S. (1997). The nature and distribution of errors in sound localization by human listeners. Hear. Res. 114, 179–196.
Cedarbaum, J. M., Stambler, N., Malta, E., Fuller, C., Hilt, D., Thurmond, B., and Nakanishi, A. (1999). The ALSFRS-R: a revised als functional rating scale that incorporates assessments of respiratory function. J. Neurol. Sci. 169, 13–21.
Cincotti, F., Kauhanen, L., Aloise, F., Palomäki, T., Caporusso, N., Jylänki, P., Mattia, D., Babiloni, F., Vanacker, G., Nuttin, M., Marciani, M. G., and Millán, J. R. (2007). Vibrotactile feedback for brain-computer interface operation. Intell. Neurosci. 2007, 12.
Farwell, L., and Donchin, E. (1988). Talking off the top of your head: toward a mental prosthesis utilizing event-related brain potentials. Electroencephalogr. Clin. Neurophysiol. 70, 510–523.
Fozard, J., and Gordon-Salant, S. (2001). Handbook of the Psychology of Aging, Chapter Changes in Vision and Hearing with Aging, 5th Edn. San Diego, CA: Academic Press, 241–266
Friedrich, E. V., Scherer, R., Sonnleitner, K., and Neuper, C. (2011). Impact of auditory distraction on user performance in a brain-computer interface driven by different mental tasks. Clin. Neurophysiol. 122, 2003–2009.
Furdea, A., Halder, S., Krusienski, D. J., Bross, D., Nijboer, F., Birbaumer, N., and Kübler, A. (2009). An auditory oddball (P300) spelling system for brain-computer interfaces. Psychophysiology 46, 617–625.
Gonsalvez, C., and Polich, J. (2002). P300 amplitude is determined by target-to-target interval. Psychophysiology 39, 388–396.
Gonsalvez, C. J., Barry, R. J., Rushby, J. A., and Polich, J. (2007). Target-to-target interval, intensity, and P300 from an auditory single-stimulus task. Psychophysiology 44, 245–250.
Grantham, D. W., Hornsby, B. W. Y., and Erpenbeck, E. A. (2003). Auditory spatial resolution in horizontal, vertical, and diagonal planes. J. Acoust. Soc. Am. 114, 1009–1022.
Guger, C., Daban, S., Sellers, E., Holzner, C., Krausz, G., Carabalona, R., Gramatica, F., and Edlinger, G. (2009). How many people are able to control a P300-based brain-computer interface (BCI)? Neurosci. Lett. 462, 94–98.
Guo, J., Gao, S., and Hong, B. (2010). An auditory brain-computer interface using active mental response. IEEE Trans. Neural Syst. Rehabil. Eng. 18, 230–235.
Halder, S., Rea, M., Andreoni, R., Nijboer, F., Hammer, E. M., Kleih, S. C., Birbaumer, N., and Kübler, A. (2010). An auditory oddball brain-computer interface for binary choices. Clin. Neurophysiol. 121, 516–523.
Hanagasi, H. A., Gurvit, I. H., Ermutlu, N., Kaptanoglu, G., Karamursel, S., Idrisoglu, H. A., Emre, M., and Demiralp, T. (2002). Cognitive impairment in amyotrophic lateral sclerosis: evidence from neuropsychological investigation and event-related potentials. Brain Res. Cogn. Brain Res. 14, 234–244.
Hill, N., Lal, T., Bierig, K., Birbaumer, N., and Schölkopf, B. (2005). “An auditory paradigm for brain–computer interfaces,” in Advances in Neural Information Processing Systems, Vol. 17, eds L. K. Saul, Y. Weiss, and L. Bottou (Cambridge, MA: MIT Press), 569–576.
Hinterberger, T., Neumann, N., Pham, M., Kübler, A., Grether, A., Hofmayer, N., Wilhelm, B., Flor, H., and Birbaumer, N. (2004). A multimodal brain-based feedback and communication system. Exp. Brain Res. 154, 521–526.
Höhne, J., Schreuder, M., Blankertz, B., and Tangermann, M. (2010). Two-dimensional auditory P300 speller with predictive text system. Conf. Proc. IEEE Eng. Med. Biol. Soc. 1, 4185–4188.
Höhne, J., Schreuder, M., Blankertz, B., and Tangermann, M. (2011). A novel 9-class auditory erp paradigm driving a predictive text entry system. Front. Neurosci. 5:99. doi: 10.3389/fnins.2011.00099
Huggins, J. E., Wren, P. A., and Gruis, K. L. (2011). What would brain-computer interface users want? opinions and priorities of potential users with amyotrophic lateral sclerosis. Amyotroph. Lateral Scler. doi: 10.3109/17482968.2011.572978. [Epub ahead of print].
Kanoh, S., Miyamoto, K., and Yoshinobu, T. (2008). A brain-computer interface (BCI) system based on auditory stream segregation. Conf. Proc. IEEE Eng. Med. Biol. Soc. 642–645. doi: 10.1109/IEMBS.2008.4649234
Kim, D.-W., Hwang, H.-J., Lim, J.-H., Lee, Y.-H., Jung, K.-Y., and Im, C.-H. (2011). Classification of selective attention to auditory stimuli: toward vision-free brain-computer interfacing. J. Neurosci. Methods 197, 180–185.
Klobassa, D. S., Vaughan, T. M., Brunner, P., Schwartz, N. E., Wolpaw, J. R., Neuper, C., and Sellers, E. W. (2009). Toward a high-throughput auditory P300-based brain-computer interface. Clin. Neurophysiol. 120, 1252–1261.
Krusienski, D. J., Sellers, E. W., Cabestaing, F., Bayoudh, S., McFarland, D. J., Vaughan, T. M., and Wolpaw, J. R. (2006). A comparison of classification techniques for the P300 speller. J. Neural Eng. 3, 299–305.
Kübler, A., Furdea, A., Halder, S., Hammer, E. M., Nijboer, F., and Kotchoubey, B. (2009). A brain-computer interface controlled auditory event-related potential (p300) spelling system for locked-in patients. Ann. N. Y. Acad. Sci. 1157, 90–100.
Langendijk, E. H. A., and Bronkhorst, A. W. (2002). Contribution of spectral cues to human sound localization. J. Acoust. Soc. Am. 112, 1583–1596.
Ledoit, O., and Wolf, M. (2004). A well-conditioned estimator for large-dimensional covariance matrices. J. Multivar. Anal. 88, 365–411.
Lenhardt, A., Kaper, M., and Ritter, H. (2008). An adaptive P300-based online brain-computer interface. IEEE Trans. Neural Syst. Rehabil. Eng. 16, 121–130.
Liu, T., Goldberg, L., Gao, S., and Hong, B. (2010). An online brain-computer interface using non-flashing visual evoked potentials. J. Neural Eng. 7, 036003.
Liu, Y., Zhou, Z., and Hu, D. (2011). Gaze independent brain-computer speller with covert visual search tasks. Clin. Neurophysiol. 122, 1127–1136.
Micheyl, C., Delhommeau, K., Perrot, X., and Oxenham, A. J. (2006). Influence of musical and psychoacoustical training on pitch discrimination. Hear. Res. 219, 36–47.
Middlebrooks, J. C., and Green, D. M. (1991). Sound localization by human listeners. Annu. Rev. Psychol. 42, 135–159.
Münssinger, J. I., Halder, S., Kleih, S. C., Furdea, A., Raco, V., Hösle, A., and Kübler, A. (2010). Brain painting: first evaluation of a new brain-computer interface application with ALS patients and healthy volunteers. Front. Neurosci. 4:182. doi: 10.3389/fnins.2010.00182
Murguialday, A. R., Hill, J., Bensch, M., Martens, S., Halder, S., Nijboer, F., Schölkopf, B., Birbaumer, N., and Gharabaghi, A. (2010). Transition from the locked in to the completely locked-in state: a physiological analysis. Clin. Neurophysiol. 122, 925–933.
Nijboer, F., Furdea, A., Gunst, I., Mellinger, J., McFarland, D., Birbaumer, N., and Kübler, A. (2008a). An auditory brain-computer interface (BCI). J. Neurosci. Methods 167, 43–50.
Nijboer, F., Sellers, E. W., Mellinger, J., Jordan, M. A., Matuz, T., Furdea, A., Halder, S., Mochty, U., Krusienski, D. J., Vaughan, T. M., Wolpaw, J. R., Birbaumer, N., and Kübler, A. (2008b). A P300-based brain-computer interface for people with amyotrophic lateral sclerosis. Clin. Neurophysiol. 119, 1909–1916.
Nijholt, A., Bos, D. P.-O., and Reuderink, B. (2009). Turning shortcomings into challenges: brain-computer interfaces for games. Entertainment Comput. 1, 85–94.
Paulus, K. S., Magnano, I., Piras, M. R., Solinas, M. A., Solinas, G., Sau, G. D., and Aiello, I. (2002). Visual and auditory event-related potentials in sporadic amyotrophic lateral sclerosis. Clin. Neurophysiol. 113, 853–861.
Polich, J., Brock, T., and Geisler, M. W. (1991). P300 from auditory and somatosensory stimuli: probability and inter-stimulus interval. Int. J. Psychophysiol. 11, 219–223.
Raggi, A., Consonni, M., Iannaccone, S., Perani, D., Zamboni, M., Sferrazza, B., and Cappa, S. F. (2008). Auditory event-related potentials in non-demented patients with sporadic amyotrophic lateral sclerosis. Clin. Neurophysiol. 119, 342–350.
Schalk, G., Wolpaw, J. R., McFarland, D. J., and Pfurtscheller, G. (2000). EEG-based communication: presence of an error potential. Clin. Neurophysiol. 111, 2138–2144.
Schlögl, A., Kronegg, J., Huggins, J., and Mason, S. G. (2007). “Evaluation criteria for BCI research,” in Towards Brain-Computer Interfacing, eds G. Dornhege, R. del, J. Millán, T. Hinterberger, D. McFarland, and K.-R. Müller (Cambridge, MA: MIT press), 297–312.
Schmidt, N., Blankertz, B., and Treder, M. S. (2011). Online detection of error potentials increases information throughput in a brain-computer interface. Neurosci. Lett. 500(Suppl.), e19–e20.
Schreuder, M., Blankertz, B., and Tangermann, M. (2010). A new auditory multi-class brain-computer interface paradigm: spatial hearing as an informative cue. PLoS ONE 5, e9813. doi: 10.1371/journal.pone.0009813
Schreuder, M., Tangermann, M., and Blankertz, B. (2009). Initial results of a high-speed spatial auditory BCI. Int. J. Bioelectromagn. 11, 105–109.
Schröder, M., and Trouvain, J. (2003). The German text-to-speech synthesis system MARY: a tool for research, development and teaching. Int. J. Speech Tech. 6, 365–377.
Sellers, E. W., and Donchin, E. (2006). A P300-based brain-computer interface: initial tests by ALS patients. Clin. Neurophysiol. 117, 538–548.
Sellers, E. W., Vaughan, T. M., and Wolpaw, J. R. (2010). A brain-computer interface for long-term independent home use. Amyotroph. Lateral Scler. 11, 449–455.
Serby, H., Yom-Tov, E., and Inbar, G. (2005). An improved P300-based brain-computer interface. IEEE Trans. Neural Syst. Rehabil. Eng. 13, 89–98.
Silvoni, S., Volpato, C., Cavinato, M., Marchetti, M., Priftis, K., Merico, A., Tonin, P., Koutsikos, K., Beverina, F., and Piccione, F. (2009). P300-based brain-computer interface communication: evaluation and follow-up in amyotrophic lateral sclerosis. Front. Neurosci. 3:60. doi: 10.3389/neuro.20.001.2009
Tangermann, M., Krauledat, M., Grzeska, K., Sagebaum, M., Blankertz, B., Vidaurre, C., and Müller, K.-R. (2009). “Playing pinball with non-invasive BCI,” in Advances in Neural Information Processing Systems, eds D. Koller, D. Schuurmans, Y. Bengio, and L. Bottou (Cambridge, MA: MIT Press), 1641–1648.
Treder, M. S., and Blankertz, B. (2010). (C)overt attention and visual speller design in an ERP-based brain-computer interface. Behav. Brain Funct. 6, 28.
Treder, M. S., Schmidt, N. M., and Blankertz, B. (2011). Gaze-independent brain-computer interfaces based on covert attention and feature attention. J. Neural Eng. (in press).
Vlek, R., Schaefer, R., Gielen, C., Farquhar, J., and Desain, P. (2011). Sequenced subjective accents for brain-computer interfaces. J. Neural Eng. 8, 036002.
Wightman, F., and Kistler, D. (1999). Resolution of front-back ambiguity in spatial hearing by listener and source movement. J. Acoust. Soc. Am. 105, 2841.
Keywords: brain–computer interface, directional hearing, auditory event-related potentials, P300, N200, dynamic subtrials
Citation: Schreuder M, Rost T and Tangermann M (2011) Listen, you are writing! Speeding up online spelling with a dynamic auditory BCI. Front. Neurosci. 5:112. doi: 10.3389/fnins.2011.00112
Received: 20 May 2011; Accepted: 01 September 2011;
Published online: 14 October 2011.
Edited by:
Leonardo Cohen, National Institutes of Health, USAReviewed by:
Kenji Kansaku, Research Institute of National Rehabilitation Center for Persons with Disabilities, JapanMichal Lavidor, Bar Ilan University, Israel
Surjo R. Soekadar, National Institutes of Health, USA
Copyright: © 2011 Schreuder, Rost and Tangermann. This is an open-access article subject to a non-exclusive license between the authors and Frontiers Media SA, which permits use, distribution and reproduction in other forums, provided the original authors and source are credited and other Frontiers conditions are complied with.
*Correspondence: Martijn Schreuder, Machine Learning Laboratory, Berlin Institute of Technology, FR6-9, Franklinstraße 28/29, 10587 Berlin, Germany. e-mail: schreuder@tu-berlin.de