Liquefaction Characteristics of Sand With Polypropylene Fiber at Low Confining Stress
 Sudhir K. Tripathi
  Prabir K. Kolay
- Department of Civil and Environmental Engineering, Southern Illinois University Carbondale, Carbondale, IL, United States
The present study evaluates the liquefaction characteristics of Ottawa sand with polypropylene fiber using cyclic triaxial test. A series of stress-controlled cyclic triaxial tests were performed at 34.47 kPa (5 psi) effective confining pressure. Specimens of clean Ottawa sand, and sand containing 0.05, 0.075, 0.1, and 0.3% polypropylene fiber by dry weight of sand were tested at 0.2, 0.25, 0.3, and 0.4 Cyclic Stress Ratio (CSR). Results show a significant improvement in liquefaction resistance when the polypropylene fiber content exceeded beyond 0.075% at 34.47 kPa effective confining stress.
Introduction
Generally, earthquake damages are depicted based on structural and non-structural failures of superstructures and substructures; but the underlying ground on which a structure is founded has a fundamental role in extents of damage. One of the effects of earthquake to the underlying ground is liquefaction of soil. Liquefaction of saturated soil deposit is an important phenomenon, which governs the behavior of ground and the structure overlying on it. Liquefaction occurs when a saturated soil deposit undergoes significant reduction in strength and bearing capacity when pore pressure rises and equals effective confining pressure due to undrained loading condition created by transient strong shaking during earthquake. Liquefaction phenomenon received major attention after 9.2 Richter scale magnitude earthquake in Nigata, Japan (1964) and 7.5 Richter scale magnitude earthquake in Anchorage, Alaska (1964). In both earthquakes, liquefaction induced damages such as slope failures, bridge and building foundation failures, and floatation of structures were observed (Dobry et al., 1982). In addition, Kramer (1996) also observed liquefaction induced excessive settlement and tilting of buildings. The initial laboratory studies during 1960–80 mainly focused liquefaction of clean sands. However, later, Standard Penetration Tests (SPT), Cone Penetration Test (CPT) to evaluate liquefaction potential revealed that liquefaction may also occur in sands containing fines. This fact was supported by the liquefaction damages that occurred during Central Chile earthquake (1985) (de Alba et al., 1988); Saguenay earthquake (1988) (Tuttle et al., 1990), Superstition hills earthquake, California (1987) (Holzer et al., 1989).
The liquefaction potential is influenced by many parameters, which directly or indirectly affect the behavior of soil, viz. degree of saturation, relative density, earthquake magnitude, ground motion characteristics, fines content, and effective overburden pressure. Several researchers e.g., Seed and Lee (1966), Castro (1969), Youd and Hoose (1977), Ishihara (1984), and Evans and Seed (1987) have investigated the effect of those and several other parameters. Lee and Aurelio (1974), Tatsuoka et al. (1984), Tokimatsu and Seed (1987) have studied earthquake induced settlements and found that significant hazard may result from the dissipation of developed pore pressure after liquefaction. Meanwhile, several research works are focused on measures to prevent or reduce liquefaction potential. One of the techniques that has gained significant interest is the use of geofibers to improve potentially liquefiable soils. While some research suggests that the use of geofiber in soil improves the static characteristics of sands, and sands with fines, some research works suggest otherwise. On the dynamic characteristics part, Noorany and Uzdavines (1989), and Maher and Woods (1990) observed an increase in soil shear strength and cyclic resistance with the addition of geofibers.
The main purpose of this research is to study the effect of polypropylene fiber on liquefaction characteristics of sand at low confining stress. This study presents the results obtained from cyclic triaxial tests carried out on mixtures of sand with various percentages of polypropylene fibers. The sand-fiber specimens contained 0.05, 0.075, 0.1, and 0.3% of fiber by dry weight of sand. The results from cyclic triaxial tests are evaluated in terms of deformation and pore pressure generation characteristics with respect to application of cyclic loads. The Cyclic Stress Ratio (CSR) for the tests varied from 0.2 to 0.4.
Materials and Methods
Materials
The materials used for the cyclic triaxial test specimens are Ottawa 20–30 ASTM C 778 sand and Monofilament Polypropylene fibers. Ottawa sand is naturally occurring silica sand passing through sieve no. 20 (0.84 mm) and retained on sieve no. 30 (0.60 mm) supplied by Humboldt. Quanta chrome gas pycnometer was used to determine the specific gravity of sand tested in accordance with ASTM D5550-14 (2014) and the value was found to be 2.69. The properties of sand are presented in Table 1.
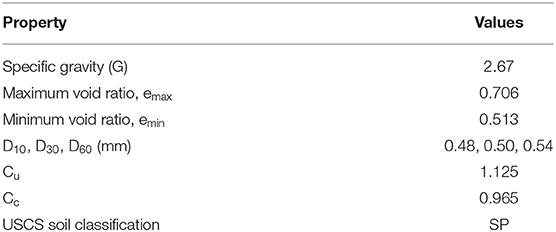
Table 1. Index properties of sand.
The fiber used in this research is Virgin Homopolymer polypropylene monofilament supplied by FORTA corporation, USA. Each fiber is 6 mm in length. These fibers are surface treated with special chemical, which resist moisture and aging. Because of their durability, polypropylene fibers have gained popularity in geotechnical application. The properties of fiber are listed in Table 2.
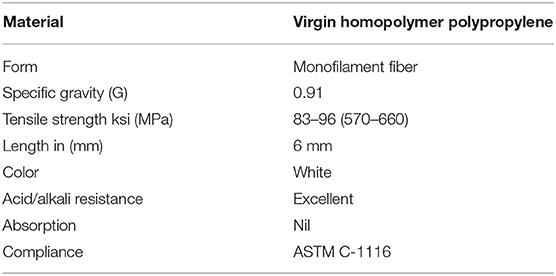
Table 2. Properties of polypropylene fibers.
Methods
The maximum and minimum void ratio were determined in accordance with ASTM D4254-16 (2016) and ASTM D4253-16e1 (2016), respectively. The maximum and minimum void ratio of sand was found to be 0.706 and 0.513, respectively. ASTM method 1a was used to perform the test. ASTM D422-63 (2007)e2 (2007) was used to perform sieve analysis of Ottawa sand; and, the grain size distribution was plotted. The sand is classified as poorly graded sand (SP) under Unified Soil Classification System (USCS). The values of D10, D30, and D60 were obtained from the particle size analysis graph as 0.48, 0.50, 0.54 mm, respectively. The value of coefficient of uniformity, Cu, and coefficient of curvature Cc were found to be 1.125 and 0.965, respectively.
Sample Preparation
The sand-fiber mixture was prepared by selecting various percentages of fiber by dry weight of sand. The percentage of fibers that were tested in this study were 0, 0.05, 0.075, 0.1, and 0.3%. The fibers were mixed in sand by dry mixing. The fiber strands were separated manually by hand and mixed in sand in small proportions to ensure uniform distribution of fibers within sand. Proper care was taken to avoid segregation of fibers in sand-fiber mixture.
Quanta chrome gas pycnometer was used to determine specific gravity of sand fiber mixture based on ASTM D5550-14 (2014) standard. The tests were repeated until the specific gravity was within standard deviation of 0.005%. The decrease in specific gravity of sand-fiber mix was observed with the increase in percentage of fiber. Table 3 presents the specific gravity of various percentages of fibers mixed with sand.
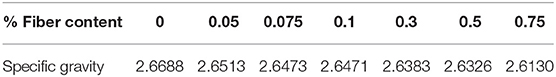
Table 3. Specific gravity of sand with various percentages of fiber mixtures.
Cylindrical samples for cyclic triaxial test had length and diameter of 5.7′′ and 2.85′′, respectively. The samples were prepared at the relative density of 30% and degree of saturation of 30%. Dry and wet unit weight of samples were calculated by using void ratio, specific gravity, water content, and degree of saturation. The sample was compacted in six layers. Method of undercompaction suggested by Ladd (1978) was used to prepare specimens at constant relative density of 30%.
The height of each layer was then calculated based on the percentage of undercompaction that was needed. The percent of undercompaction for each layer was as follows:
Percent under compaction for nth layer can be calculated using Equation (1) (Ladd, 1978).
Where, Uni = Percent under compaction for the first layer
nt = total number of layer
n = number of layer being considered.
The height of compacted layer is calculated using Equation (2) (Ladd, 1978). The compacted height for bottom most layer was 26.16 and 23.62 mm for all other layers
Where, ht = total height of sample
hn = height of specimen at the top of the nth layer.
Test Results
The results and findings of cyclic triaxial test with fiber reinforced sand specimens are presented in this section. First, the details of tests conducted during study are presented in the form of table. Finally, the results of cyclic triaxial test on clean sands and sands with various percentages of fiber i.e., 0.05, 0.075, 0.1, and 0.3% at 34.48 kPa confining pressure have been discussed.
Test Details
In this study, numerous cyclic triaxial tests were carried out in clean sand, and sand-fiber mixtures containing 0.05, 0.075, 0.1, and 0.3% fiber by dry weight of sand. All the samples were prepared at 30% relative density. The samples were tested at 34.48 kPa confining pressure and CSR was varied from 0.2 to 0.4. Table 4 presents all the tests that had been conducted in this study.
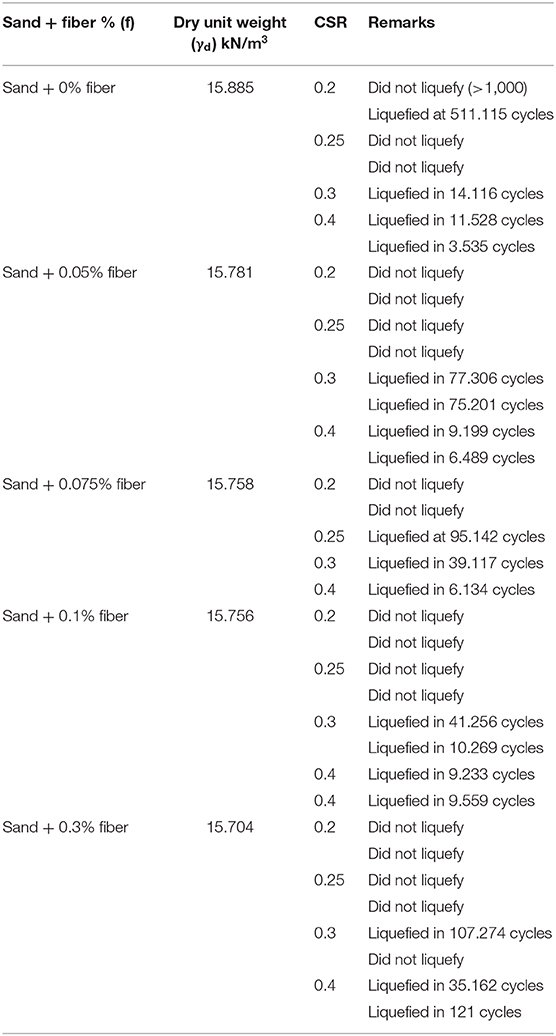
Table 4. Cyclic triaxial tests on sand-fiber mixtures at initial effective confining pressure of 34.48 kPa.
Effect of Fiber on Liquefaction Resistance
To evaluate the effect of inclusion of fiber in Ottawa sand with respect to liquefaction, several tests were conducted on clean sand, and sand containing 0.05, 0.075, 0.1, and 0.3% fiber, respectively. The tests were conducted at 34.48 kPa confining pressure. The initial liquefaction is based on the pore pressure generation criteria i.e., initial liquefaction is considered to have taken place when pore pressure equals the effective confining pressure. In terms of deformation, number of cycles required to trigger 2.5 and 5% of DA strain have been taken into account to compare resistance against liquefaction.
Figure 1 presents a plot of cyclic stress ratio against loading cycles required for initial liquefaction for clean sand and sand containing various percentages of fiber. It can be observed that the initial liquefaction resistance tends to increase and then decrease with the addition of 0.05 and 0.075% fiber, respectively; beyond 0.075% fiber content, initial liquefaction resistance tends to increase with further increase of fiber content. This may be ascribed to the fact that the voids in the sand-fiber matrix decrease with the increase of fibers which leads to some densification of sand-fiber matrix. Numerically, for initial liquefaction of clean sand, sand containing 0.05, 0.075, 0.1, and 0.3% fiber at 50 loading cycles, it would require CSR values of 0.31, 0.33, 0.30, 0.323, and 0.385, respectively.
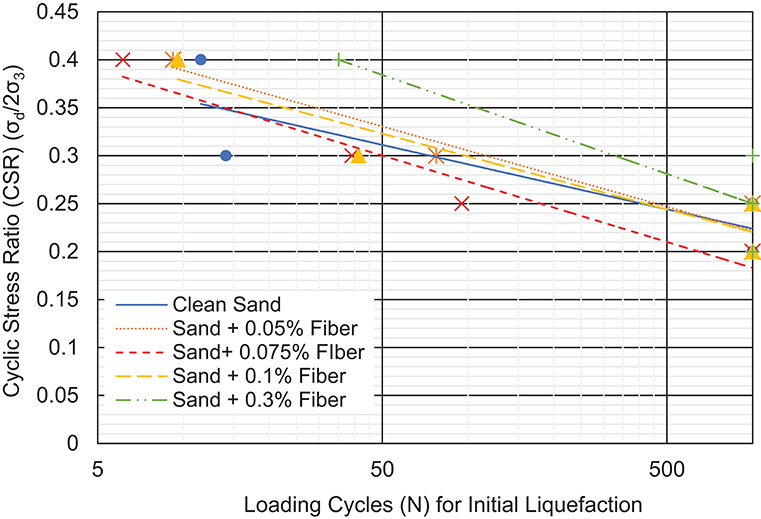
Figure 1. Initial liquefaction resistance of sand containing various percentages of fiber at 34.48 kPa effective confining pressure.
Similarly, Figure 2 presents the graphs of CSR against loading cycles for 2.5% strain. It can be observed that when the fiber content increases beyond 0.075%, the 2.5% DA lines plot higher than 2.5% DA line at 0.05% fiber content. Numerically, CSR values of 0.3123, 0.33, 0.3267, 0.323, and 0.385 would be required to trigger 2.5% DA strain at 50 loading cycles in clean sands, and sands containing 0.05, 0.075, 0.1, and 0.3% fiber.
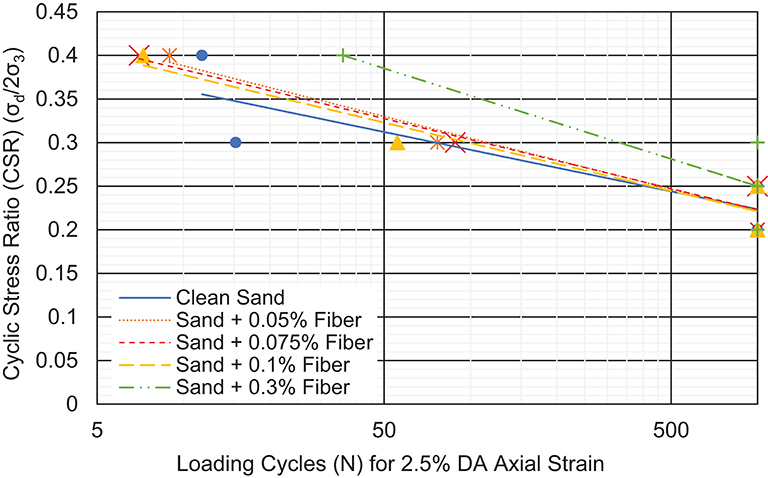
Figure 2. Liquefaction resistance of sand containing various percentages of fibers at 34.48 kPa effective confining pressure in terms of 2.5% DA.
Finally, Figure 3 presents the plot of cyclic stress ratio (CSR) against loading cycles for 5% DA strain. From the Figure 3, it can be observed that CSR required to cause 5% DA strain tends to increase and then decrease with addition of fiber up to 0.075% fiber, and consequently, required CSR increases again beyond fiber content of 0.075%. Numerically, it requires CSR values of 0.312, 0.33, 0.3, 0.324, and 0.385, to trigger 5% DA strain 50 cycles for clean sands and sand containing 0.05, 0.075, 0.1, and 0.3% fiber. The addition of fiber may provide reinforcing effect on sand which is the main reason for increase liquefaction resistance.
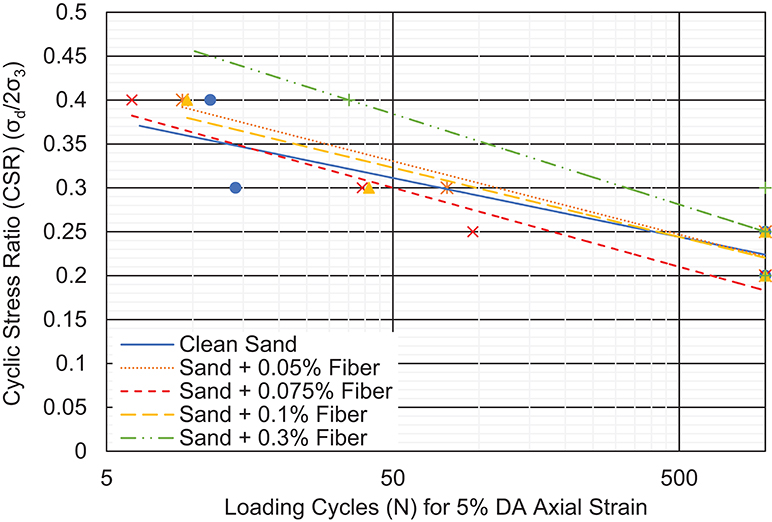
Figure 3. Liquefaction resistance of sand containing various percentages of fibers at 34.48 kPa effective confining pressure in terms of 5% DA.
Performance of Fiber
Figure 4 presents the plot of CSR against percentage fiber content for initial liquefaction at 10 cycles at 34.48 kPa confining pressure. It can be observed that for 34.48 kPa effective confining pressure the CSR required for initial liquefaction at 10 cycles increases with increment in percentage fiber by dry weight of sand. With further increment of fiber content, the CSR required for initial liquefaction at 0.1 and 0.3% fiber content is 0.4 and 0.458 at 34.48 kPa effective confining pressure.
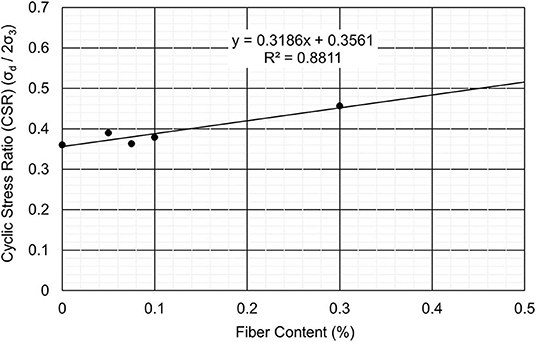
Figure 4. Variation of liquefaction resistance (initial liquefaction at N = 10) of sand with fiber contents at effective confining pressures of 34.48 kPa.
Figure 5 presents the plot of CSR against percentage fiber content for 2.5% DA strain at 10 cycles at 34.48 kPa confining pressure. It can be observed that for 34.48 kPa effective confining pressure the CSR required for 2.5% DA strain at 10 cycles increases with increase in fiber percentage by dry weight of sand. With further increment in fiber content, the CSR required to get 2.5% DA strain at 0.1 and 0.3% fiber content is 0.4 and 0.457 at 34.48 kPa effective confining pressure.
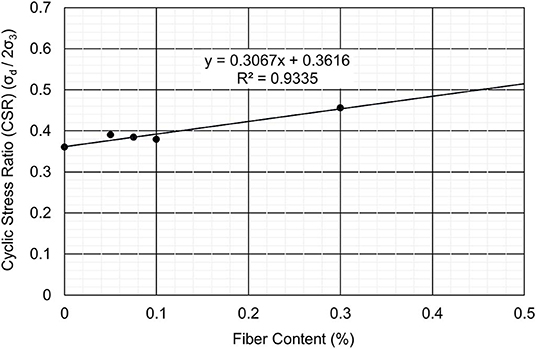
Figure 5. Variation of liquefaction resistance (2.5% DA deformation at N = 10) of sand with fiber contents at effective confining pressures of 34.48 kPa.
Figure 6 presents the plot of CSR against percentage fiber content for 5% DA strain at 10 cycles at 34.48 kPa confining pressure. It can be observed that for 34.48 kPa effective confining pressure the CSR required for 5% DA strain at 10 cycles increases with increment in percentage of fiber by dry weight of sand. With further increment in fiber content, the CSR required to get 5% DA strain at 0.1 and 0.3% fiber content is 0.39 and 0.458 at 34.48 kPa effective confining pressure.
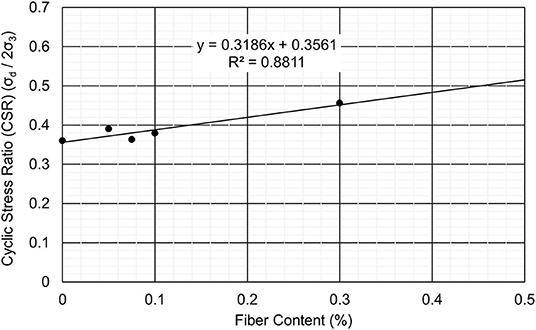
Figure 6. Variation of liquefaction resistance (5% DA deformation at N = 10) of sand with fiber contents at effective confining pressures of 34.48 kPa.
Summary
In this study, results of cyclic triaxial test performed on sand and sand containing various percentages of fiber were analyzed and discussed. The specimens comprised clean sand, and sand mixed with 0.05, 0.075, 0.1, and 0.3% fiber by dry weight of sand. To study the effect of cyclic stress ratio (CSR), the specimens were tested at 0.2, 0.25, 0.3, and 0.4 CSR. Also, to identify the effect of confining pressure, specimens were tested at 34.48 kPa initial effective confining pressure. The results for clean sand based on pore pressure generation, 2.5 and 5.0% DA strain were presented first, followed by results of sand specimen containing 0.05, 0.075, 0.1, and 0.3%, respectively. Next, the results discussing the effect of fiber content were presented based on confining stress and cyclic stress criteria.
The results revealed that the liquefaction susceptibility increases with increase in cyclic stress ratio (CSR). For instance, it required fewer loading cycles for all specimens to liquefy as the cyclic stress ratio increased. Next, at 34.48 kPa initial effective confining pressure, the addition of fiber seemed to improve the liquefaction resistance at fiber contents beyond 0.075%. This is evident from the Figures 1–3, which shows that the liquefaction resistance initially decreases with addition of fiber up to 0.075% fiber content beyond which it significantly improves liquefaction resistance. This finding is consistent with the observation made by Noorzad and Amini (2014) on Babolsar sand.
Conclusions
The present study summarizes the results obtained from number of cyclic triaxial tests conducted on 20–30 Ottawa sand with various percentages of monofilament polypropylene fibers. The tests were undertaken with the aim to investigate the liquefaction characteristics of Ottawa sand with the addition of monofilament polypropylene fibers. Based on the series of cyclic triaxial tests on clean sand and sand containing various percentages of fiber the following conclusions can be drawn:
• For a given confining pressure, the liquefaction resistance tends to decrease with the increasing Cyclic Stress Ratio (CSR).
• The liquefaction resistance of sand-fiber specimen decreases as the cyclic stress ratio (CSR) increases.
• At 34.48 kPa initial effective confining pressure, the liquefaction resistance increased with the fiber content. Resistance to liquefaction was maximum when the fiber content was increased to 0.3%. The resistance to liquefaction in terms of CSR improved by 26% at 0.3% fiber content compared to clean sand.
Data Availability Statement
The datasets generated for this study are available on request to the corresponding author.
Author Contributions
All authors listed have made a substantial, direct and intellectual contribution to the work, and approved it for publication.
Conflict of Interest
The authors declare that the research was conducted in the absence of any commercial or financial relationships that could be construed as a potential conflict of interest.
References
ASTM D422-63 (2007)e2 (2007). Standard Test Method for Particle-Size Analysis of Soils (Withdrawn 2016). West Conshohocken, PA: ASTM International.
ASTM D4253-16e1 (2016). Standard Test Methods for Maximum Index Density and Unit Weight of Soils Using a Vibratory Table. West Conshohocken, PA: ASTM International. doi: 10.1520/D4253-16E01
ASTM D4254-16 (2016). Standard Test Methods for Minimum Index Density and Unit Weight of Soils and Calculation of Relative Density. West Conshohocken, PA: ASTM International. doi: 10.1520/D4254-16
ASTM D5550-14 (2014). Standard Test Method for Specific Gravity of Soil Solids by Gas Pycnometer. West Conshohocken, PA: ASTM International.
Castro, G. (1969). Liquefaction of Sands (Ph.D. thesis). Cambridge University, Cambridge, MA, United States.
de Alba, P. A., Seed, H. B., Retamal, E., and Seed, R. B. (1988). Analyses of dam failures in 1985 chilean earthquake. J. Geotech. Eng. 114, 1414–1434. doi: 10.1061/(ASCE)0733-9410(1988)114:12(1414)
Dobry, R., Ladd, R. S., Yokel, F. Y., Chung, R. M., and Powell, D. (1982). Prediction of Pore Water Pressure Buildup and Liquefaction of Sands During Earthquakes by the Cyclic Strain Method, Building Science Series. National Bureau of Standards, US Department of Commerce, US Governmental Printing Office, Washington, DC.
Evans, M. D., and Seed, H. B. (1987). Undrained Cyclic Triaxial Testing of Gravels: The Effect of Membrane Compliance. College of Engineering, University of California.
Holzer, T. L., Hanks, T. C., and Youd, T. L. (1989). Dynamics of liquefaction during the 1987 superstition hills, California, earthquake. Science 244, 56–59. doi: 10.1126/science.244.4900.56
Ishihara, K. (1984). “Post-earthquake failure of a tailings dam due to liquefaction of pond deposit,” in International Conference on Case Histories in Geotechnical Engineering. Available online at: https://scholarsmine.mst.edu/icchge/1icchge/1icchge-theme5/13
Ladd, R. S. (1978). Preparing test specimens using undercompaction. Geotech. Test J. 1, 16–23. doi: 10.1520/GTJ10364J
Lee, K. L., and Aurelio, A. (1974). Earthquake induced settlements in saturated sands: 9F, 2T, 29R. J. Geotech. Engng. Div. 100, 387–406.
Maher, M. H., and Woods, R. D. (1990). Dynamic-response of sand reinforced with randomly distributed fibers. J. Geotech. Geoenviron. 116, 1116–1131. doi: 10.1061/(ASCE)0733-9410(1990)116:7(1116)
Noorany, I., and Uzdavines, M. (1989). “Dynamic behavior of saturated sand reinforced with geosynthetic fabrics,” in Proceedings Geosynthetics 89 Conference, Vol. 2 (San Diego, CA: IFAI), 385–396.
Noorzad, R., and Amini, P. F. (2014). Liquefaction resistance of babolsar sand reinforced with randomly distributed fibers under cyclic loading. Soil Dyn. Earthquake Eng. 66, 281–292. doi: 10.1016/j.soildyn.2014.07.011
Seed, H. B., and Lee, K. L. (1966). Liquefaction of saturated sands during cyclic loading. J. Soil Mech. Found. Div. 92, 105–134.
Tatsuoka, F., Sasaki, T., and Yamada, S. (1984). “Settlement in saturated sand induced by cyclic undrained simple shear,” in Proceedings, 8th World Conference on Earthquake Engineering, Vol. 3 (San Francisco, CA: Prentice-Hall), 95–102.
Tokimatsu, K., and Seed, H. B. (1987). Evaluation of settlements in sands due to earthquake shaking. J. Geotech. Geoenviron. 113, 861–878. doi: 10.1061/(ASCE)0733-9410(1987)113:8(861)
Tuttle, M., Law, K. T., Seeber, L., and Jacob, K. (1990). Liquefaction and ground failure induced by the 1988 Saguenay, Quebec, earthquake. Can. Geotech. J. 27, 580–589. doi: 10.1139/t90-073
Keywords: sand, polypropylene fiber, cyclic triaxial, liquefaction, cyclic stress ratio
Citation: Tripathi SK, Kolay PK, Puri VK and Kumar S (2020) Liquefaction Characteristics of Sand With Polypropylene Fiber at Low Confining Stress. Front. Built Environ. 6:28. doi: 10.3389/fbuil.2020.00028
Received: 14 June 2019; Accepted: 28 February 2020;
Published: 17 March 2020.
Edited by:
Sakdirat Kaewunruen, University of Birmingham, United KingdomReviewed by:
Sujit Kumar Dash, Indian Institute of Technology Kharagpur, IndiaNhlanganiso Mlilo, Coventry University, United Kingdom
Copyright © 2020 Tripathi, Kolay, Puri and Kumar. This is an open-access article distributed under the terms of the Creative Commons Attribution License (CC BY). The use, distribution or reproduction in other forums is permitted, provided the original author(s) and the copyright owner(s) are credited and that the original publication in this journal is cited, in accordance with accepted academic practice. No use, distribution or reproduction is permitted which does not comply with these terms.
*Correspondence: Prabir K. Kolay, pkolay@siu.edu