Fe3+-Sensitive Carbon Dots for Detection of Fe3+ in Aqueous Solution and Intracellular Imaging of Fe3+ Inside Fungal Cells
 Yanqiu Chen
 Xiaobo Sun
 Wei Pan
  Jinping Wang
- College of Chemical and Pharmaceutical Sciences, Qingdao Agricultural University, Qingdao, China
In this article, the Fe3+-sensitive carbon dots were obtained by means of a microwave-assisted method using glutamic acid and ethylenediamine as reactants. The carbon dots exhibited selective response to Fe3+ ions in aqueous solution with a turn-off mode, and a good linear relationship was found between (F0-F)/F0 and the concentration of Fe3+ in the range of 8–80 μM. As a result, the as-synthesized carbon dots can be developed as a fluorescent chemosensor for Fe3+ in aqueous solution. Moreover, the carbon dots can be applied as a fluorescent agent for fungal bioimaging since the fungal cells stained by the carbon dots were brightly illuminated on a confocal microscopy excited at 405 nm. Furthermore, an increase in the concentration of intracellular Fe3+ could result in fluorescence quenching of the carbon dots in the fungal cells when incubated in the Tris-HCl buffer solution containing Fe3+. However, due to EDTA might hinder Fe(III) to enter the fungal cells, incubation in Fe(III)-EDTA complex solution exerted negligible effect on the fluorescence of fungal cells labeled by the carbon dots. Therefore, the carbon dots can serve as a potential probe for intracellular imaging of Fe3+ inside fungal cells.
Introduction
As the most abundant transition metal in cellular systems, iron with its chemical versatility plays indispensable roles in physiological processes (Gao R. et al., 2019) such as oxygen transport (Aisen et al., 1999), electron transfer (Lucas et al., 2011), and enzymatic catalysis (Eisenstein, 2000). Excess or deficiency will cause damages to live systems (Bischof et al., 2019). Therefore, it is of great significance to detect iron ions with high sensitivity and selectivity in both environmental and biological systems.
Fluorescent sensors have attracted increasing attention for the detection of metal ions, owing to their simplicity, high selectivity and sensitivity, high spatial resolution, and possibility for real-time, rapid monitoring (Dean and Palmer, 2014; Huang et al., 2014; Li and Liu, 2014). Moreover, metal ions monitoring in cells and organisms can be visually achieved by imaging based on fluorescent sensors. Generally, most widely used fluorescent sensors include fluorescent metal nanoclusters (Shang et al., 2011), organic dyes (Wang et al., 2019), semiconductor quantum dots (QD) (Wu et al., 2003), fluorescent metal organic frameworks (Ma et al., 2014). But concerns may come from their photo instability, complex equipment and treatment processes, high costs, environmental unfriendliness, and cytotoxicity in their practical applications.
Recently, carbon dots have interested the research community as bioimaging labels and sensors due to their high performances, including bright fluorescence (Zhu et al., 2013), excellent photostability (Zhang et al., 2019), tunable fluorescence emission (Sun et al., 2006), favorable biocompatibility (Deng et al., 2019), low toxicity (Ye et al., 2019), and good water solubility (Gao Y. et al., 2019). As presented in the available documents, most of carbon dots showed great potential in bioimaging of different types of cells. For instance, imaging of bacterial cells, including Escherichia coli, and Mycobacterium tuberculosis, Pseudomonas aeruginosa, even visualization of physiological processes such as cell division, were achieved using carbon dots as fluorescent label (Mehta et al., 2015; Nandi et al., 2015; Shi D. et al., 2015). Lots of carbon dots synthesized by various carbon sources and surface modified by different soft molecules showed bright fluorescence, and have been successfully applied in imaging of various human cells with low cytotoxicity, such as A193, SCC-7, A549, Hep-2, and MCF-7 cells (Shi L. et al., 2015; Wang et al., 2015; Zheng et al., 2015; Zhu et al., 2015; Zhuo et al., 2015). On the other hand, a variety of methods based on carbon dots with high sensitivity and selectivity have been reported for chemically sensing Hg2+ (Yan et al., 2016), Cu2+ (Zhu et al., 2017), Fe3+ (Tian et al., 2017), Pb2+ (Xiong et al., 2016), Cr(VI) (Wang et al., 2017), and Ag+ (Jiang et al., 2015). Furthermore, it is of great interest for intracellular imaging, and even quantitatively detecting specific metal ions in cells with high sensitivity and selectivity using carbon dots as fluorescent probes. For example, the nitrogen and phosphorus doped carbon dots had been reported for the detection of Fe3+ ions in cancer cells (Teng et al., 2014). And a dual-emission nanosensor based on carbon dots exhibited high performance for the detection and ratiometric fluorescence imaging of Cu2+ in cells (Qu et al., 2012).
Iron also plays an important role in physiological activities of fungal cells. To image and detect intracellular Fe(III), the physiological and pathological processes of the cells will be better understood. Cell imaging and visualizing intracellular pH variation of fungi had been achieved by our group using carbon dots as a fluorescent probe prepared by facile one-pot hydrothermal pyrolysis of threonine (Zhou et al., 2015). However, to our knowledge, no reports were found to apply carbon dots as probes in the bioimaging of intracellular Fe3+ inside living fungal cells. In this article, the microwave-assisted method were applied to prepare Fe3+ sensitive carbon dots using glutamic acid and ethylenediamine as reactants without any further modification. The as-synthesized carbon dots will be a potential candidate for optical detection of Fe3+ in aqueous solution, bioimaging of fungal cells, and intracellular imaging of Fe3+ inside fungal cells.
Experimental
Synthesis of the Carbon Dots
Materials, characterization methods and cytotoxicity to the fungus of the carbon dots are shown in the Supplementary Material.
The carbon dots were prepared by microwave assisted pyrolysis of L - glutamic acid and anhydrous ethylenediamine as raw materials (Lu et al., 2015; Li et al., 2016). Briefly, 500 mg of L - glutamic acid was dissolved in 20 mL ultrapure water to get homogeneous solution, into which 1.65 mL anhydrous ethylenediamine was slowly added. Subsequently, the resulting mixture was heated by a domestic microwave oven for 4 min. Then, another 10 mL of ultrapure water was added to dissolve the product after it naturally cooled down to room temperature. Thereafter, the obtained solution purified by dialyzing against ultrapure water through a dialysis membrane (MWCO 500) for 2 days. The purified solution was concentrated by means of rotary evaporation at 50 °C. Finally, the solid carbon dots were obtained by freeze drying under vacuum at ambient temperature for 48 h.
Detection of Metal Ions
Typically, 0.15 mg/mL of the carbon dots were mixed with Fe3+ at various concentrations in Tris-HCl buffer (0.1 M, pH 7.0) solution, then their fluorescence spectra were collected at room temperature. The relative fluorescence intensity (F0-F)/F0 was calculated to be the signal output value, in which F0 and F represent the fluorescence intensities at 460 nm of the carbon dots in the absence and presence of Fe3+, respectively.
Detection of Fe3+ in Real Samples
To evaluate the feasibility of the carbon dots based sensor for the detection of Fe3+ in real samples, tap water samples obtained from our lab were analyzed using the present method. All water samples were spiked with Fe3+ at different concentrations without any pretreatment.
Imaging of Fungal Cells
Fungal fermentation was carried out in liquid medium at 27 ± 2 °C for 3 days. Thereafter, the selected young vigorous mycelia washed by distilled water for three times were incubated in the Tris-HCl buffer solution containing the as-synthesized carbon dots at a certain concentration for another 36 h in a constant temperature incubator. The stained mycelia were imaged on a laser scanning confocal microscopy (Lieca, Germany) after washed three times with distilled water. Three drops of 0.005 M Fe3+, Fe(III)-EDTA, Cu2+, and Ca2+ were added from one side of the chink between the cover glass and the slide glass for intracellular imaging of metal ions.
Results and Discussion
Characterization
TEM image of the as-synthesized carbon dots is shown in Figure 1A. The morphology of the carbon dots is nearly spherical, and their average diameter is 4.5 nm. The measured XRD pattern of the carbon dots showed an obvious peak centered at 2θ = 23.3° with d = 0.381 nm (Figure 1B), which is corresponding to the (002) lattice spacing of carbon based materials (Vikneswaran et al., 2014). And the functional groups on the surface of the carbon dots were identified by FTIR. As demonstrated in Figure 1C, the broad band centered at 3,263 cm−1 was contributed by the stretching vibrations of –OH and –NH2. The absorption at 3,074 cm−1 was attributed to the stretching vibration of C=C (Dong et al., 2012). The peaks at 1,682, 1,585, 1,250, and 1,101 cm−1 belonged to C=O stretching vibration, N-H bending vibration, C-OH stretching vibration and C-N stretching vibration. The FTIR information suggests that there are carboxyl and amine groups on the surface of the as-synthesized carbon dots.
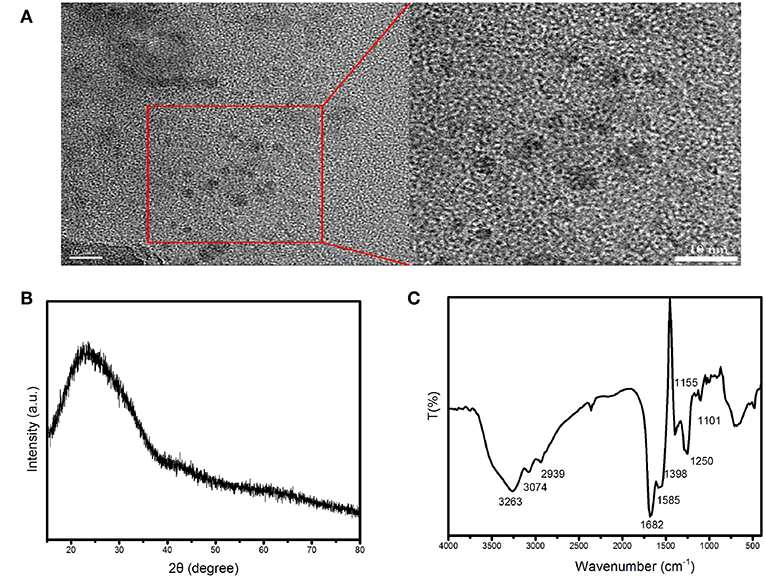
Figure 1. (A) TEM image, (B) XRD pattern, and (C) FTIR spectrum of the as-synthesized carbon dots.
As shown in Figure 2, an characteristic absorption band at 310–330 nm in the absorption spectrum of the carbon dots was attributed to n–π* transition (Teng et al., 2014). The fluorescent spectra in Figure 2 exhibited an excitation-dependence feature (i.e., the emission was red-shifted with excitation wavelength increasing). The emission peak intensity firstly increased, and then decreased remarkably as excitation shifted to longer wavelength (see Figure S1). The optimum emission was revealed at 459 nm under excitation at 360 nm. Therefore, the emission of the carbon dots are controlled by surface states. And different emission centers on the surface result in excitation dependent emission (Chen et al., 2015; Dai et al., 2016; Kim et al., 2018). The fluorescent quantum yield of the carbon dots is 12.45% referencing to quinine sulfate (quantum yield 54.6%).
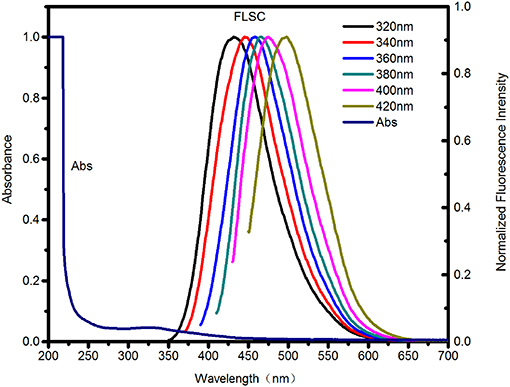
Figure 2. UV-Vis absorption spectra (Abs) and Fluorescence spectra (FLSC, excitation wavelengths as indicated) of the as-synthesized C-dots in aqueous solution.
Photostability of the as-synthesized carbon dots was measured under continuous illumination at 360 nm with a 150 W Xe lamp in a fluorescence spectrophotometer. The fluorescence intensity exhibited negligible change within 50 min (Figure S2), suggesting that the as-synthesized carbon dots can keep photostable under light irradiation during detection and imaging.
The effect of pH on the fluorescence of the carbon dots was shown in Figure 3A. Fluorescence intensity decreased significantly as pH increased in the range of 5–7 and pH > 10. But fluorescence intensity of the carbon dots was independent on pH in the ranges of 2–4 and 7–9. Protonation–deprotonation occurring on the surface of the carbon dots with pH variation induced the changes in the surface charges, resulting in pH-dependence (Hu et al., 2014; Yuan et al., 2016; Liu et al., 2017). Therefore, if the carbon dots are used as bioimaging agents under the physiological pH condition, fluorescence intensity will hardly suffer from the pH variation.
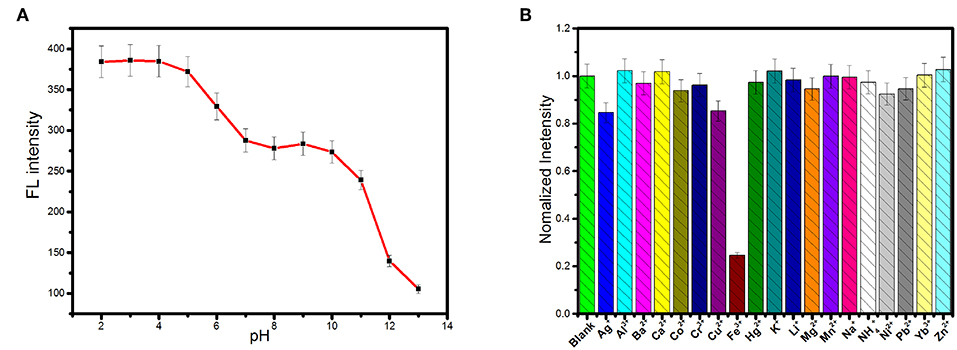
Figure 3. (A) The influence of pH on the fluorescence intensity of the as-synthesized carbon dots (λex = 360 nm). (B) Fluorescence responses of 0.15 mg.mL−1 the as-synthesized carbon dots in Tris-HCl (0.1 M pH 7.0) upon the addition of various metal ions at the concentration of 0.5 mM.
Nineteen kinds of cations, including Li+, Na+, K+, , Al3+, Ag+, Ca2+, Fe3+, Ba2+, Co2+, Cr3+, Cu2+, Zn2+, Hg2+, Mg2+, Mn2+, Ni2+, Pb2+, and Yb3+, were selected as representatives to evaluate the effects of cations on the fluorescence of the carbon dots. As exhibited in Figure 3B, the fluorescence emission of the carbon dots could be significantly quenched by Fe3+ while the other cations exerted negligible effects. Therefore, the carbon dots respond to Fe3+ selectively in the system containing cations. In order to test the selectivity of the carbon dots to Fe3+ in complex environment, the other potential interferences from anions, biomolecules, and ionic strength were further tested. Figure S3 shows the results of the interferences of anions (Ac−, Br−, Cl−, , F−, , , , and ) on fluorescence intensity of the carbon dots, from which no obvious changes were found in the presence of different anions by comparison with the blank. Furthermore, negligible influences of amino acids and glucose on fluorescence intensity of the carbon dots were found (see Figure S4). Additionally, an increase in ionic strength would not fluctuate the fluorescence of the carbon dots (Figure S5), suggesting that the detection of Fe3+ will not be affected by the variation of ionic strength. Overall, the carbon dots showed an excellent selectivity toward Fe3+ under complex condition.
The responsive time of the carbon dots toward Fe3+ ions was measured and the result is shown in Figure S6, which indicates that the response the carbon dots toward Fe3+ ions is balanced within 4 min.
The absorption spectra of the carbon dots in the presence of Fe3+ ions were collected in Figure S7A, which exhibits that absorbance at about 320 nm increases upon addition of Fe3+. Combined with the FT-IR results that there are hydroxyl, carboxyl, and amine groups on the surface of the as-synthesized carbon dots, it can infer that carbon dots can form stable complex with Fe3+ ions through carboxyl, resulting in fluorescence quenching due to photo-induced electron transfer and high selectivity of the carbon dots to Fe3+ (Chen et al., 2016; Li et al., 2017). The fluorescence lifetimes of the carbon dots in absence and presence Fe3+ ions were measured for the investigation of the mechanism of fluorescence quenching of Fe3+ ions toward carbon dots. As shown in Figure S7B, the fluorescence lifetime of the carbon dots ions nearly did not change upon addition of Fe3+, suggesting that the mechanism of fluorescence quenching of Fe3+ ions toward carbon dots can be attributed to static quenching (Jiang et al., 2019).
Detection of Fe3+ in Aqueous Solution
The fluorescence intensities of the carbon dots in Tris-HCl buffer solutions at pH = 7.0 containing Fe3+ at various concentrations were measured to study the detection sensitivity. As shown in Figure 4A, the emission of the carbon dots showed a decrease in intensity upon addition of Fe3+ with concentration increasing from 0 to 800 μM. A good linear relationship (Figure 4B) between (F0-F)/F0 and the concentration was found in the range of 8–80 μM (R2 = 0.9936). The linear equation was fitted as (F0-F)/F0 = 0.00358 c−0.00875 (c representing the concentration of Fe3+), and the limit of detection (LOD) was calculated to be 3.8 μM based on three times the standard deviation rule (LOD = 3Sd/s).
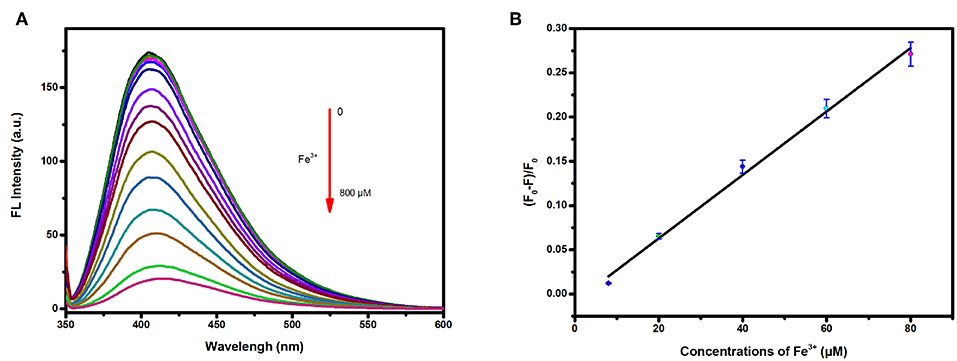
Figure 4. (A) Fluorescence response of the carbon dots in presence of tap water containing different concentrations of Fe3+ (from top to bottom: 0, 2, 4, 6, 8, 20, 40, 60, 80, 150, 200, 300, 400, 600, and 800 μM); (B) Corresponding relationship between (F0-F)/F0 and the concentrations of Fe3+ of tap water.
A comparison between the proposed method based on the carbon dots with the previously reported methods are listed in Table S1, which suggests that this method based on the carbon dots for the detections of Fe3+ is comparable or even better than those previously reported in literatures.
The carbon dots with high sensitivity and selectivity to Fe3+ might be directly applied for the detection of Fe3+ ions in real water samples. Therefore, quantitative detection of Fe3+ in tap water was conducted for evaluation the practical application of the carbon dots as a Fe3+ sensor. The tap water samples which were taken from our lab and spiked with Fe3+ at different concentrations without any pre-treatment. Then, the spiked Fe3+ was analyzed by the proposed method. As presented in Table 1, the recoveries of the spiked water samples are in the range from 90.6 to 107%, suggesting that the as-synthesized carbon dots can be employed as a promising sensor for Fe3+ in real water samples.

Table 1. Results for the detection of Fe3+ in tap water.
Bioimaging of Fungal Cells and Intracellular Imaging of Fe3+ Inside Fungal Cells
The cytotoxicity of the as-synthesized carbon dots to C. gloeosporioides fungus was tested by the method of growth rate. As shown in Figure 5A, fungal mycelia growing on the PDA media containing the as-synthesized carbon dots at the concentrations of 0.2, 0.5, 0.8, 1.0, 1.2 mg/mL, respectively, show no obvious difference compared with the control. The fungal viability is slightly reduced at the concentration of 1.2 mg/mL (Figure 5B). Therefore, the as-synthesized carbon dots are a kind of excellent biocompatible label for bioimaging of C. gloeosporioides fungus.
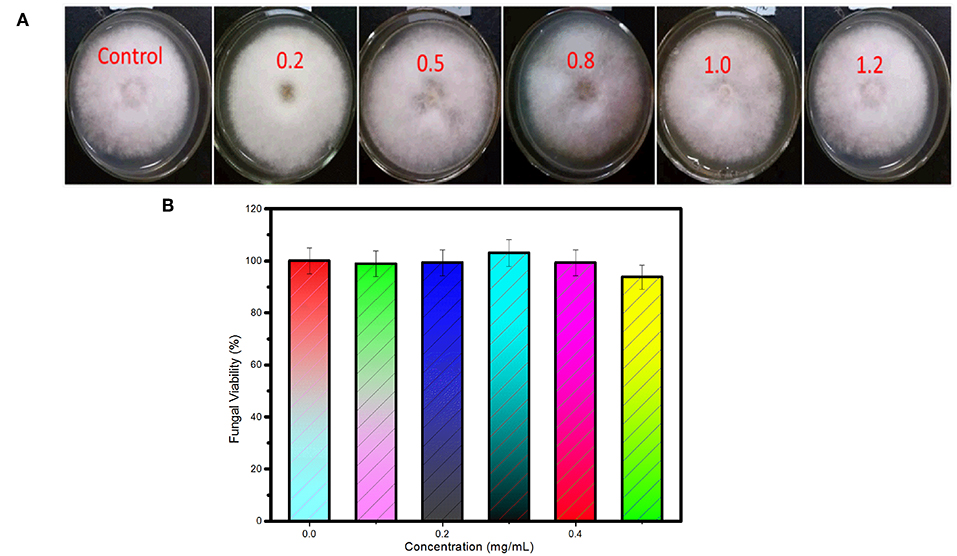
Figure 5. Cytotoxicity of the as-synthesized carbon dots to C. gloeosporioides. (A) Photos and (B) viability of the fungus growing on the medium containing the as-synthesized carbon dots at the concentrations of 0.2, 0.5, 0.8, 1.0, 1.2 mg/ml, respectively.
The potential of the as-synthesized carbon dots to be label agents for fluorescently imaging pathogenic fungal cells (C. gloeosporioides) on a confocal microscopy was explored. The isolated mycelia from liquid medium were incubated in the Tris-HCl buffer solutions in the presence of the as-synthesized carbon dots at different concentrations. After 36 h incubation at the room temperature, brightly illuminating fungal cells were observed by the confocal microscopy under excitation at 405 nm, which suggests that the carbon dots can readily enter the fungal cells and stain mycelia for imaging (see Figure S8). By analysis of the fluorescent intensity of the fluorescent images of the fungal cells, the internalization of the carbon dots into fungal cells exhibited dose dependence (Figure S8). The strongest fluorescent intensity of the fluorescent images was observed for the fungal cells incubated in the Tris-HCl buffer solution containing the as-synthesized carbon dots in the concentration range from 0.4 to 0.5 mg/mL. Thus, 0.4 mg/mL was chosen as the optimum concentration for subsequent cell labeling.
In order to evaluate the feasibility of the as-synthesized carbon dots as fluorescent agent for detecting Fe3+ inside fungal cells, imaging was carried out on a confocal microscopy with the carbon dots labeled mycelia being incubated in Tris-HCl buffer solution containing 0.005 M Fe3+, and in Tris-HCl buffer solution containing 0.005 M EDTA-Fe(III) complex, Cu2+ and Ca2+ as comparison. As shown in Figure 6, the fungal cells incubated in blank Tris-HCl buffer solution showed strong intracellular fluorescence (control). But the intracellular fluorescence was significantly reduced in its intensity while the fungal cells were incubated in Tris-HCl buffer solution containing 0.005 M Fe3+ for 2 and 5 min. And incubation time had no obvious effect on the intracellular fluorescence intensity of the fungal cells (confocal photo taken at 5 min is not significantly different with that taken at 2 min), indicating that free Fe3+ can readily enter the fungal cells and effectively quench the fluorescence of the internalized carbon dots. Hence, the carbon dots show selective fluorescent response not only to free Fe3+ but also to the Fe(III) complex. However, the intracellular fluorescence intensity of the fungal cells incubated in Tris-HCl buffer solution containing the Fe(III) complex at a concentration of 0.005 M had not obvious change compared with that incubated in blank Tris-HCl buffer solution (Figure 6). Thus it can be speculated that EDTA may hinder Fe(III) to enter the fungal cells because iron uptake of fungal cells involves the use of iron siderophores secreted by fungi (David et al., 1992).
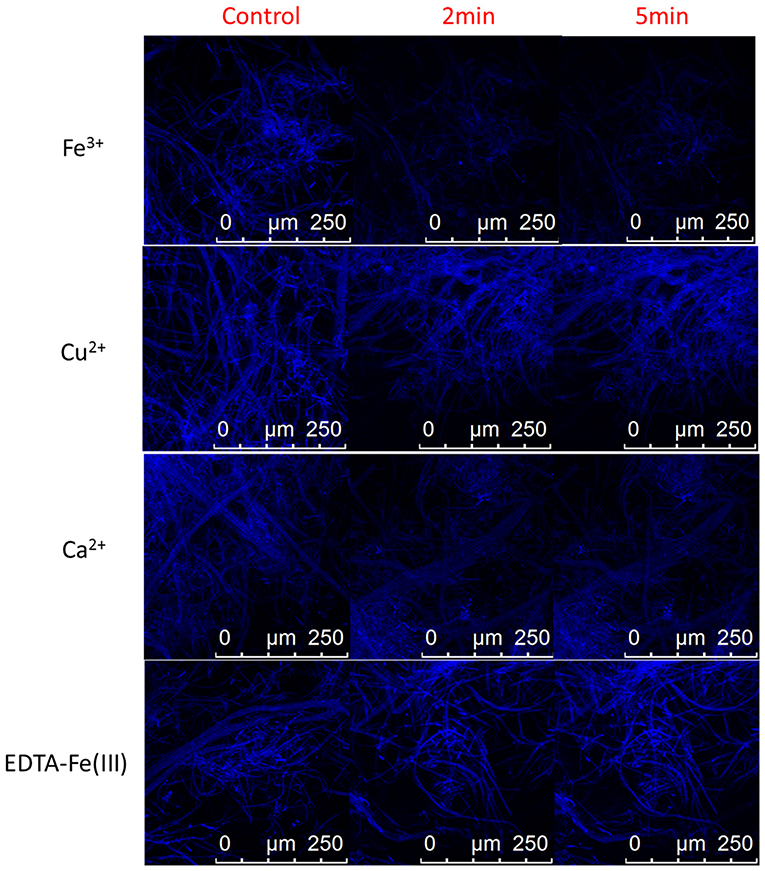
Figure 6. Representative confocal fluorescence images of plant pathogenic fungal cells (C. gloeosporioides) labeled with the carbon dots in Tris-HCl buffer solution (control) and Tris-HCl buffer solutions of 0.005 M Fe3+, Cu2+, Ca2+, and EDTA-Fe(III) complex.
As discussed above, Cu2+ and Ca2+ have negligible effect on the fluorescence of the carbon dots in the Tris-HCl buffer solution. Herein, Cu2+ and Ca2+ were selected as the representative metal ions to evaluate the selectivity of the carbon dots for intracellular imaging of Fe3+ inside fungal cells. As presented in Figure 6, there was not obvious change in intracellular fluorescence intensity of the fungal cells incubated in Tris-HCl buffer solutions containing Cu2+ and Ca2+ compared with that in blank Tris-HCl buffer solution. Therefore, the other metal ions, such as Cu2+ and Ca2+, will not exert effect on the fluorescence of the internalized carbon dots in fungal cells during intracellular imaging of Fe3+. The as-synthesized carbon dots with high selectivity to Fe3+ have the potential to be developed as fluorescent probe for detection of Fe3+ inside fungal cells.
Conclusion
The Fe3+-sensitive carbon dots can be synthesized by means of a microwave-assisted method using glutamic acid and ethylenediamine as reactants. The as-syntheszied carbon dots have the potential to be developed as a fluorescent chemosensor for detection of Fe3+ ions in aqueous solution because the dots showed selective response to Fe3+ ions in aqueous solution with a turn-off mode, and a good linear relationship was observed between (F0-F)/F0 and the Fe3+ concentrations of in the range of 8–80 μM. Furthermore, the carbon dots can act as fluorescent agent for fungal bioimaging since the fungal cells labeled by the carbon dots were brightly illuminated when imaged on the confocal microscopy with excitation by 405 nm laser pulses. In addition, the as-synthesized carbon dots can be explored as a probe with high selectivity for intracellular imaging of not only free Fe3+ but also Fe(III) complex inside fungal cells. Incubation in buffer solution with high concentration of Fe3+ will result in an increase in intracellular Fe3+ and fluorescence quenching of the carbon dots internalized in fungal cells, while extracellular incubation buffer solution of Fe(III)-EDTA complex will not exert obvious effect on the intracellular fluorescence intensity because EDTA might hinder Fe(III) to enter the fungal cells. In conclusion, the as-synthesized carbon dots can be a potential candidate for optical detection of Fe3+ in aqueous solution, bioimaging of fungal cells and intracellular imaging of Fe3+ inside fungal cells.
Data Availability Statement
All datasets generated for this study are included in the article/Supplementary Material.
Author Contributions
YC conceived and designed the experiments, performed the data analysis, and wrote the manuscript. XS played an important role in interpreting the results and contributed significantly to manuscript preparation. WP contributed reagents, materials, analysis tools. GY contributed to data analysis. JW contributed to the conception of the study, revised the manuscript, and approved the final version.
Funding
This work was financially supported by National Key R&D Program of China (No. 2017YFE0105200), National Natural Science Foundation of China (No. 31572181), Key Research and Development Project of Shandong Province (Nos. 2018GNC110006, 2016GSF116007).
Conflict of Interest
The authors declare that the research was conducted in the absence of any commercial or financial relationships that could be construed as a potential conflict of interest.
Supplementary Material
The Supplementary Material for this article can be found online at: https://www.frontiersin.org/articles/10.3389/fchem.2019.00911/full#supplementary-material
References
Aisen, P., Wessling-Resnick, M., and Leibold, E. A. (1999). Iron metabolism. Curr. Opin. Chem. Biol. 3, 200–206. doi: 10.1016/S1367-5931(99)80033-7
Bischof, H., Burgstaller, S., Waldeck-Weiermair, M., Rauter, T., Schinagl, M., Ramadani-Muja, J., et al. (2019). Live-cell imaging of physiologically relevant metal ions using genetically encoded FRET-based probes. Cells 8:492. doi: 10.3390/cells8050492
Chen, J., Li, Y., Lv, K., Zhong, W., Wang, H., Wu, Z., et al. (2016). Cyclam-functionalized carbon dots sensor for sensitive and selective detection of copper(II) ion and sulfide anion in aqueous media and its imaging in live cells. Sens. Actuators B Chem. 224, 298–306. doi: 10.1016/j.snb.2015.10.046
Chen, Y., Zheng, M., Xiao, Y., Dong, H., Zhang, H., Zhuang, J., et al. (2015). A self-quenching-resistant carbon-dot powder with tunable solid-state fluorescence and construction of dual-fluorescence morphologies for white light-emission. Adv. Mater. 28, 312–318. doi: 10.1002/adma.201503380
Dai, B., Deng, D., Yu, H., Lei, L., Li, Y., Li, C., et al. (2016). Eu3+-doped ionogel-functionalized carbon dot monoliths with bright white photoluminescence. RSC Adv. 6, 72149–72154. doi: 10.1039/C6RA07029A
David, E., Sandra, D. K., Ina, J., David, S., and Jerry, K. (1992). Regulation of iron uptake in Saccharomyces cereuisiae- the ferrireductase and Fe(II) transporter are regulated independently. J. Biol. Chem. 267, 20774–20781.
Dean, K. M., and Palmer, A. E. (2014). Advances in fluorescence labeling strategies for dynamic cellular imaging. Nat. Chem. Biol. 10, 512–523. doi: 10.1038/nchembio.1556
Deng, Z., Liu, C., Jin, Y., Pu, J., Wang, B., and Chen, J. (2019). High quantum yield blue- and orange-emitting carbon dots: one-step microwave synthesis and applications as fluorescent films and in fingerprint and cellular imaging. Analyst 144, 4569–4574. doi: 10.1039/C9AN00672A
Dong, Y., Wang, R., Li, G., Chen, C., Chi, Y., and Chen, G. (2012). Polyamine-functionalized carbon quantum dots as fluorescent probes for selective and sensitive detection of copper ions. Anal. Chem. 84, 6220–6224. doi: 10.1021/ac3012126
Eisenstein, R. S. (2000). Iron regulatory proteins and the molecular control of mammalian iron metabolism. Annu. Rev. Nutr. 20, 627–662. doi: 10.1146/annurev.nutr.20.1.627
Gao, R., Xu, L., Hao, C., Xu, C., and Kuang, H. (2019). Circular polarized light activated chiral satellite nanoprobes for the imaging and analysis of multiple metal ions in living cells. Angew. Chem. Int. Ed Engl. 58, 3913–3917. doi: 10.1002/anie.201814282
Gao, Y., Zhang, H., Jiao, Y., Lu, W., Liu, Y., Han, H., et al. (2019). Strategy for activating room-temperature phosphorescence of carbon dots in aqueous environments. Chem. Mater. 31, 7979–7986. doi: 10.1021/acs.chemmater.9b02176
Hu, M., Yang, Y., Gu, X. Y., Hu, Y., Huang, J., and Wang, C. Y. (2014). One-pot synthesis of photoluminescent carbon nanodots by carbonization of cyclodextrin and their application in Ag+ detection. RSC Adv. 4, 62446–62452. doi: 10.1039/C4RA11491D
Huang, C., Jia, T., Tang, M., Yin, Q., Zhu, W., Zhang, C., et al. (2014). Selective and ratiometric fluorescent trapping and quantification of protein vicinal dithiols and in situ dynamic tracing in living cells. J. Am. Chem. Soc. 136, 14237–14244. doi: 10.1021/ja5079656
Jiang, K., Sun, S., Zhang, L., Wang, Y., Cai, C., and Lin, H. (2015). Bright-yellow-emissive N-doped carbon dots: preparation, cellular imaging, and bifunctional sensing. ACS Appl. Mater. Interfaces 7, 23231–23238. doi: 10.1021/acsami.5b07255
Jiang, X., Qin, D., Mo, G., Feng, J., Yu, C., Mo, W., et al. (2019). Ginkgo leaf-based synthesis of nitrogen-doped carbon quantum dots for highly sensitive detection of salazosulfapyridine in mouse plasma. J. Pharm. Biomed. Anal. 164, 514–519. doi: 10.1016/j.jpba.2018.11.025
Kim, S., Yoo, B. K., Choi, Y., Kim, B. S., and Kwon, O. H. (2018). Time-resolved spectroscopy of the ensembled photoluminescence of nitrogen- and boron/nitrogen-doped carbon dots. Phys. Chem. Chem. Phys. 20, 11673–11681. doi: 10.1039/C8CP01619D
Li, C., Liu, W., Ren, Y., Sun, X., Pan, W., and Wang, J. (2017). The selectivity of the carboxylate groups terminated carbon dots switched by buffer solutions for the detection of multi-metal ions. Sens. Actuators B Chem. 240, 941–948. doi: 10.1016/j.snb.2016.09.068
Li, K., and Liu, B. (2014). Polymer-encapsulated organic nanoparticles for fluorescence and photoacoustic imaging. Chem. Soc. Rev. 43, 6570–6597. doi: 10.1039/C4CS00014E
Li, W., Liu, Q., Zhang, P., and Liu, L. (2016). Zwitterionic nanogels crosslinked by fluorescent carbon dots for targeted drug delivery and simultaneous bioimaging. Acta Biomater. 40, 254–262. doi: 10.1016/j.actbio.2016.04.006
Liu, W., Li, C., Sun, X., Pan, W., Yu, G., and Wang, J. (2017). Highly crystalline carbon dots from fresh tomato: UV emission and quantum confinement. Nanotechnology 28:485705. doi: 10.1088/1361-6528/aa900b
Lu, W., Gong, X., Nan, M., Liu, Y., Shuang, S., and Dong, C. (2015). Comparative study for N and S doped carbon dots: synthesis, characterization and applications for Fe3+ probe and cellular imaging. Anal. Chim. Acta 898, 116–127. doi: 10.1016/j.aca.2015.09.050
Lucas, M. F., Rousseau, D. L., and Guallar, V. (2011). Electron transfer pathways in cytochrome c oxidase. Biochim. Biophys. Acta 1807, 1305–1313. doi: 10.1016/j.bbabio.2011.03.003
Ma, Y., Su, H., Kuang, X., Li, X., Zhang, T., and Tang, B. (2014). Heterogeneous nano metal-organic framework fluorescence probe for highly selective and sensitive detection of hydrogen sulfide in living cells. Anal. Chem. 86, 11459–11463. doi: 10.1021/ac503622n
Mehta, V. N., Jha, S., Basu, H., Singhal, R. K., and Kailasa, S. K. (2015). One-step hydrothermal approach to fabricate carbon dots from apple juice for imaging of mycobacterium and fungal cells. Sens. Actuators B Chem. 213, 434–443. doi: 10.1016/j.snb.2015.02.104
Nandi, S., Ritenberg, M., and Jelinek, R. (2015). Bacterial detection with amphiphilic carbon dots. Analyst 140, 4232–4237. doi: 10.1039/C5AN00471C
Qu, Q., Zhu, A., Shao, X., Shi, G., and Tian, Y. (2012). Development of a carbon quantum dots-based fluorescent Cu2+ probe suitable for living cell imaging. Chem. Commun. 48, 5473–5475. doi: 10.1039/c2cc31000g
Shang, L., Dong, S., and Nienhaus, G. U. (2011). Ultra-small fluorescent metal nanoclusters: synthesis and biological applications. Nano Today 6, 401–418. doi: 10.1016/j.nantod.2011.06.004
Shi, D., Yan, F., Zheng, T., Wang, Y., Zhou, X., and Chen, L. (2015). P-doped carbon dots act as a nanosensor for trace 2,4,6-trinitrophenol detection and a fluorescent reagent for biological imaging. RSC Adv. 5, 98492–98499. doi: 10.1039/C5RA18800H
Shi, L., Li, Y., Li, X., Wen, X., Zhang, G., Yang, J., et al. (2015). Facile and eco-friendly synthesis of green fluorescent carbon nanodots for applications in bioimaging, patterning and staining. Nanoscale 7, 7394–7401. doi: 10.1039/C5NR00783F
Sun, Y. P., Zhou, B., Lin, Y., Wang, W., Fernando, K. A., Pathak, P., et al. (2006). Quantum-sized carbon dots for bright and colorful photoluminescence. J. Am. Chem. Soc. 128, 7756–7757. doi: 10.1021/ja062677d
Teng, X., Ma, C., Ge, C., Yan, M., Yang, J., Zhang, Y., et al. (2014). Green synthesis of nitrogen-doped carbon dots from konjac flour with “off–on” fluorescence by Fe3+ and l-lysine for bioimaging. J. Mater. Chem. B 2:4631. doi: 10.1039/c4tb00368c
Tian, T., Zhong, Y., Deng, C., Wang, H., He, Y., Ge, Y., et al. (2017). Brightly near-infrared to blue emission tunable silver-carbon dot nanohybrid for sensing of ascorbic acid and construction of logic gate. Talanta 162, 135–142. doi: 10.1016/j.talanta.2016.10.021
Vikneswaran, R., Ramesh, S., and Yahya, R. (2014). Green synthesized carbon nanodots as a fluorescent probe for selective and sensitive detection of iron(III) ions. Mater. Lett. 136, 179–182. doi: 10.1016/j.matlet.2014.08.063
Wang, J., Qiu, F., Li, X., Wu, H., Xu, J., Niu, X., et al. (2017). A facile one-pot synthesis of fluorescent carbon dots from degrease cotton for the selective determination of chromium ions in water and soil samples. J. Lumin. 188, 230–237. doi: 10.1016/j.jlumin.2017.04.035
Wang, W. J., Hai, X., Mao, Q. X., Chen, M. L., and Wang, J. H. (2015). Polyhedral oligomeric silsesquioxane functionalized carbon dots for cell imaging. ACS Appl. Mater. Interfaces 7, 16609–16616. doi: 10.1021/acsami.5b04172
Wang, Y., Wu, H., Wu, W. N., Mao, X. J., Zhao, X. L., Xu, Z. Q., et al. (2019). Novel rhodamine-based colorimetric and fluorescent sensor for the dual-channel detection of Cu2+ and Co2+ trivalent metal ions and its AIRE activities. Spectrochim. Acta A Mol. Biomol. Spectrosc. 212, 1–9. doi: 10.1016/j.saa.2018.12.017
Wu, X., Liu, H., Liu, J., Haley, K. N., Treadway, J. A., Larson, J. P., et al. (2003). Immunofluorescent labeling of cancer marker Her2 and other cellular targets with semiconductor quantum dots. Nat. Biotechnol. 21, 41–46. doi: 10.1038/nbt764
Xiong, C., Liang, W., Wang, H., Zheng, Y., Zhuo, Y., Chai, Y., et al. (2016). In situ electro-polymerization of nitrogen doped carbon dots and their application in an electrochemiluminescence biosensor for the detection of intracellular lead ions. Chem. Commun. 52, 5589–5592. doi: 10.1039/C6CC01078D
Yan, F., Shi, D., Zheng, T., Yun, K., Zhou, X., and Chen, L. (2016). Carbon dots as nanosensor for sensitive and selective detection of Hg2+ and l-cysteine by means of fluorescence “Off–On” switching. Sens. Actuators B Chem. 224, 926–935. doi: 10.1016/j.snb.2015.09.057
Ye, X., Xiang, Y., Wang, Q., Li, Z., and Liu, Z. (2019). A red emissive two-photon fluorescence probe based on carbon dots for intracellular pH detection. Small 15:1901673. doi: 10.1002/smll.201901673
Yuan, Y. H., Liu, Z. X., Li, R. S., Zou, H. Y., Lin, M., Liu, H., et al. (2016). Synthesis of nitrogen-doping carbon dots with different photoluminescence properties by controlling the surface states. Nanoscale 8, 6770–6776. doi: 10.1039/C6NR00402D
Zhang, S., Zhang, D., Ding, Y., Hua, J., Tang, B., Ji, X., et al. (2019). Bacteria-derived fluorescent carbon dots for highly selective detection of p-nitrophenol and bioimaging. Analyst 144, 5497–5503. doi: 10.1039/C9AN01103J
Zheng, Y., Yang, D., Wu, X., Yan, H., Zhao, Y., Feng, B., et al. (2015). A facile approach for the synthesis of highly luminescent carbon dots using vitamin-based small organic molecules with benzene ring structure as precursors. RSC Adv. 5, 90245–90254. doi: 10.1039/C5RA14720D
Zhou, Z., Wang, Q., Wang, J., and Zhang, C. C. (2015). Imaging two targets in live cells based on rational design of lanthanide organic structure appended carbon dots. Carbon 93, 671–680. doi: 10.1016/j.carbon.2015.05.107
Zhu, J. H., Li, M. M., Liu, S. P., Liu, Z. F., Li, Y. F., and Hu, X. L. (2015). Fluorescent carbon dots for auramine O determination and logic gate operation. Sens. Actuators B Chem. 219, 261–267. doi: 10.1016/j.snb.2015.05.032
Zhu, S., Meng, Q., Wang, L., Zhang, J., Song, Y., Jin, H., et al. (2013). Highly photoluminescent carbon dots for multicolor patterning, sensors, and bioimaging. Angew. Chem. Int. Ed. 52, 3953–3957. doi: 10.1002/anie.201300519
Zhu, X., Jin, H., Gao, C., Gui, R., and Wang, Z. (2017). Ratiometric, visual, dual-signal fluorescent sensing and imaging of pH/copper ions in real samples based on carbon dots-fluorescein isothiocyanate composites. Talanta 162, 65–71. doi: 10.1016/j.talanta.2016.10.015
Keywords: carbon dots, Fe3+, fungal cells, bioimaging, detection
Citation: Chen Y, Sun X, Pan W, Yu G and Wang J (2020) Fe3+-Sensitive Carbon Dots for Detection of Fe3+ in Aqueous Solution and Intracellular Imaging of Fe3+ Inside Fungal Cells. Front. Chem. 7:911. doi: 10.3389/fchem.2019.00911
Received: 12 October 2019; Accepted: 16 December 2019;
Published: 15 January 2020.
Edited by:
Dong-Wook Han, Pusan National University, South KoreaReviewed by:
Fengjuan Chen, Lanzhou University, ChinaShu-Pao Wu, National Chiao Tung University, Taiwan
Copyright © 2020 Chen, Sun, Pan, Yu and Wang. This is an open-access article distributed under the terms of the Creative Commons Attribution License (CC BY). The use, distribution or reproduction in other forums is permitted, provided the original author(s) and the copyright owner(s) are credited and that the original publication in this journal is cited, in accordance with accepted academic practice. No use, distribution or reproduction is permitted which does not comply with these terms.
*Correspondence: Jinping Wang, jpwang@qau.edu.cn
†These authors share first authorship