The Effects of NaI, KBr, and KI Salts on the Vapor-Liquid Equilibrium of the H2O+CH3OH System
 Xianzhen Xu
 Na Zhang2
  Yu Zhou
- 1Shandong Sino-Japanese Center for Collaborative Research of Carbon Nanomaterials, College of Chemistry and Chemical Engineering, Qingdao University, Qingdao, China
- 2Department of Avionics Engineering, Navel Aeronautical University Qingdao Branch, Qingdao, China
The vapor–liquid equilibrium (VLE) in chemical engineering is indispensable for the design of equilibrium separation processes such as distillation, absorption, extraction, and crystallization. VLE data were measured for H2O+CH3OH+NaI, H2O+CH3OH+KBr, and H2O+CH3OH+KI systems. By analyzing and summarizing the results of H2O+Methanol+Alkali metal halide systems, the salt effects of NaI, KBr, and KI on the vapor–liquid equilibrium were obtained. Simultaneously, a model based on the NRTL equation (non-random two liquid) was proposed to correlate and calculate the VLE for the systems. In addition, the assumption of solvation based on hydration was introduced in this model. The proposed model can be successfully used to calculate the VLE for H2O+Methanol+Alkali metal halide systems.
Introduction
Vapor–liquid equilibrium (VLE), solid–liquid equilibrium (SLE), and liquid–liquid equilibrium (LLE) are important in industry, natural processes, chemistry, and other fields. The VLE for electrolyte systems and, more specifically, for mixed solvent electrolyte mixtures (such methanol-water-salt systems) are of considerable importance to a variety of fields, such as the extractive distillation of salt-containing liquids (Iliuta et al., 2000). There has been an increase in the amount of research into the phase equilibrium of electrolyte and non-electrolyte solutions.
Phase equilibrium and the thermodynamics of electrolyte solutions have been studied for decades, including activity coefficient, phase equilibrium data, and activity coefficient models. The Wilson model (Aebischer et al., 2018), NRTL model (Farajnezhad et al., 2016), and UNIQUAC model (Pereira et al., 2019) can be used to accurately calculate thermodynamic properties of non-electrolyte solutions. The Lu–Maurer model (Qian et al., 2011; Kontogeorgis et al., 2018), homsen's model (Pitzer, 2018), Pitzer's model (Hossain et al., 2016), ElecNRTL model (Puentes et al., 2018; Das et al., 2019), OLI model (Xu et al., 2016), and Xu's model (Yuan et al., 2019) have been successfully used to calculate the thermodynamic properties and the phase equilibrium for electrolyte solutions. In recent years, many researchers have begun to study the VLE of mixed-solvent electrolytes, and the VLE is important in the design of separation processes. Yang and Lee (1998) studied the VLE of H2O+CH3OH+NaCl, H2O+CH3OH+NaBr, and H2O+CH3OH+KCl through an experiment. The LIQUAC model (Li et al., 2010; Mohs and Gmehling, 2013) has been proposed to calculate the phase equilibria of mixed-solvent electrolyte solutions. In this model, Yan et al. treated the solutes as non-electrolyte solution interactions. Zhong et al. (2017) combined the UNIFAC model with the LIQUAC model and then developed the LIFAC model. Chen and Song (2004) proposed a modified model based the electrolyte NRTL model; it can be used to calculate the ionic activity coefficients of mixed-solvent electrolyte systems. These studies reported some experimental data and modified models. Experimental data were relatively abundant for single or mixed electrolyte aqueous systems (Yang and Lee, 1998), but the phase equilibrium data of the methanol-water-salt system with a wide range of pressures and temperatures were still rare. Such systems may be of practical importance or of interest to the development of a general electrolyte solution model. The models combine local composition activity coefficient models with either Debye-Hückel's law or the modifications of Debye-Hückel's law. Researchers have expanded the range of applications. The models can be used to calculate binary, multi-component electrolyte solutions at high temperatures and high concentrations. In general, there are great challenges in the research of mixed-solvent electrolytes, such as unavailable experimental data, unobtained salt–salt interaction parameters, and limited predictive capability.
In this work, we measured the VLE data of H2O+CH3OH+NaI, H2O+CH3OH+KBr, and H2O+CH3OH+KI systems. Then, a modified model was proposed to correlate the VLE of mixed solvent electrolyte systems.
Experimental Section
Materials
The NaI (AR, 99.5%), KBr (AR, 99.5%), KI (AR, 99%), and CH3OH (AR, 99.5%) of the solute are anhydrous, and they were purchased from Sinopharm Chemical Reagent Co. Ltd, Shanghai, China. Distilled water (18.2 Ω cm) was used for the preparation of solutions.
Apparatus and Procedures
We used a circulation glass ebulliometer to measure the VLE, and the capacity of the ebulliometer was 40 cm3, as shown in Figure 1 (Wang et al., 2019). The main experimental instruments included a vacuum pump in the ebulliometer (40 cm3, Tianjin Wuqing Beiyang Chemical Factory), a pressure controller (Ruska Series 7000, Ruska Instrument Corp., Houston), a heating mantle, and a temperature controller (Model SRS13A, SHIMADEN, Japan).
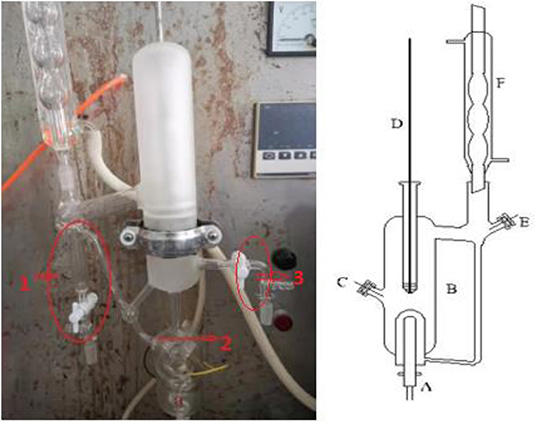
Figure 1. Schematic diagram of the VLE apparatus used in this work: (1) vapor sampling port, (2) Sample level, (3) liquid sampling port, (A) heating mantle, (B) equilibrium still, (C) sampling port, (D) thermometer well, (E) sampling port, (F) condenser, REPRODUCED from the Wang et al. (2019) under the Creative Commons CC-BY license.
During the experiments, the sample was placed into the glass ebulliometer, and the sample was added to the height of mark 2, as shown in Figure 1. The sample was then heated by the heating mantle controlled by the temperature controller. The operation pressure was controlled by the vacuum pump, the pressure sensor, and control valve. The vapor sample was condensed in a spherical condenser (length 40 cm) and then returned to the mixing chamber for recirculation. The time was 0.5–1 h in the first equilibrium, and the following equilibrium time was 10–20 min. The judging standard of the VLE is an important factor. The condensate reflux of the ebulliometer was controlled at 2–3 drops per second and was stably refluxed for approximately 15 min to establish an equilibrium state. After the VLE was reached, we recorded the temperature and pressure. At last, the component results of the vapor sample were tested through the gas chromatography with a TCD detector and a FFAP capillary chromatogram column.
The reliability of measurement has been verified in literature (Xu et al., 2018, 2019) (i.e., H2O+CaCl2 and H2O+C2H5OH). The experimental VLE data for three ternary systems (i.e., H2O+CH3OH+NaI, H2O+CH3OH+KBr, and H2O+CH3OH+KI) were listed in Tables 1–3. In the tables, x and y are the components in the liquid phase and in the vapor phase, respectively.
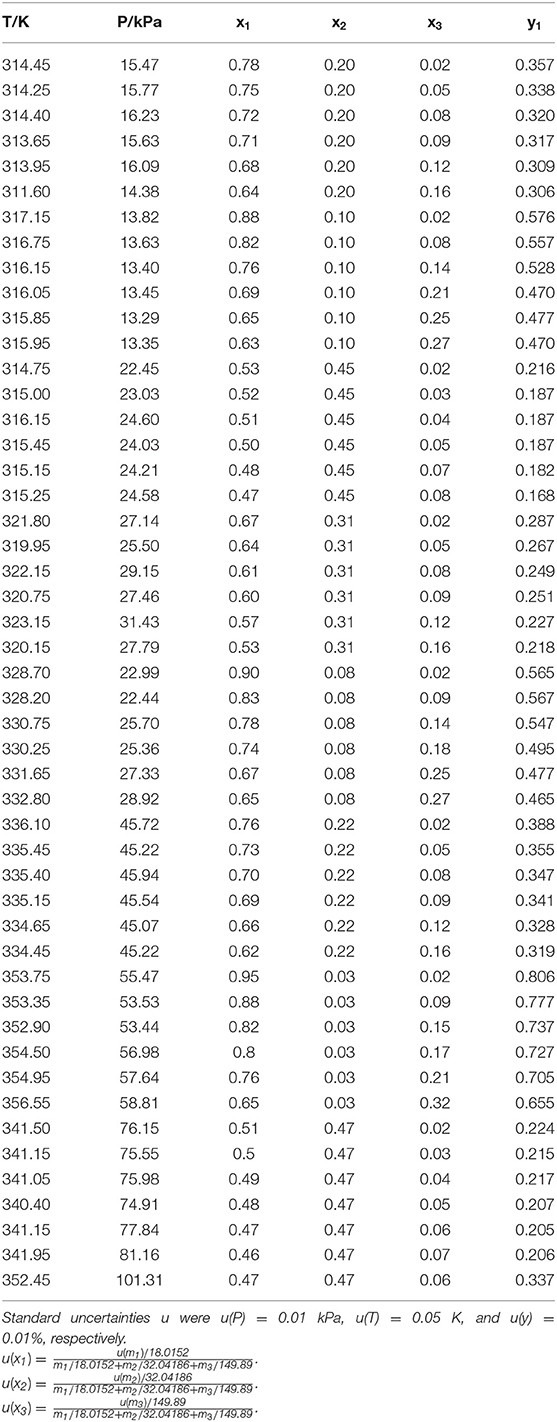
Table 1. Experimental VLE data for the H2O(1)+CH3OH(2)+NaI(3) system.
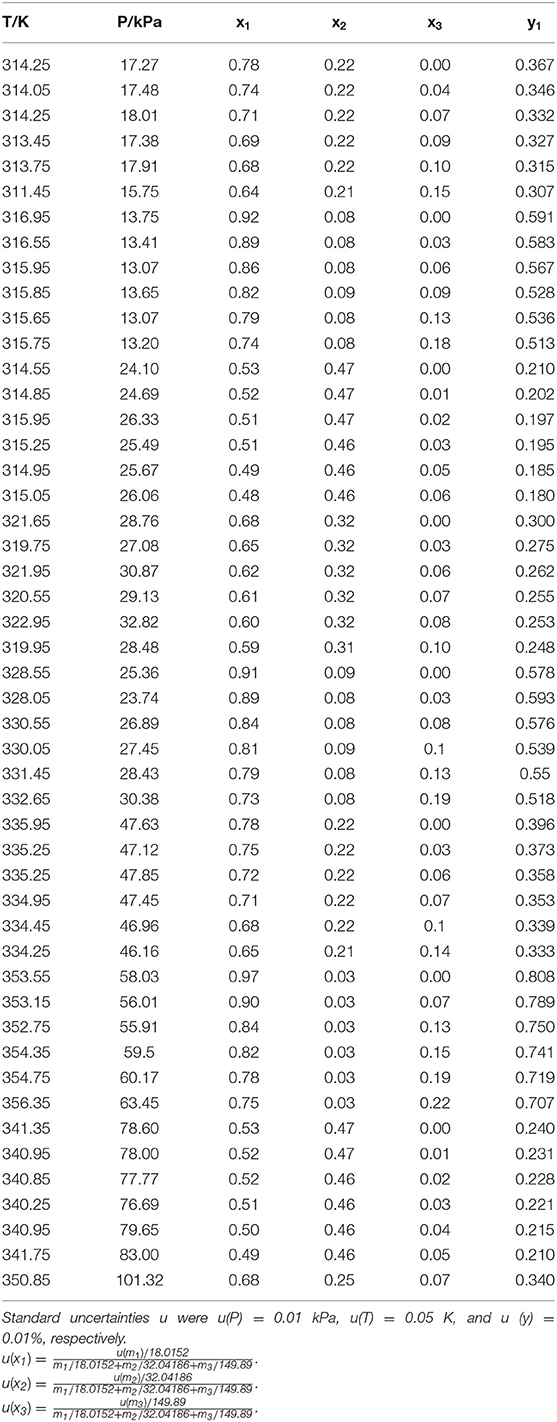
Table 2. Experimental VLE data of the H2O(1)+CH3OH(2)+KBr(3) system.
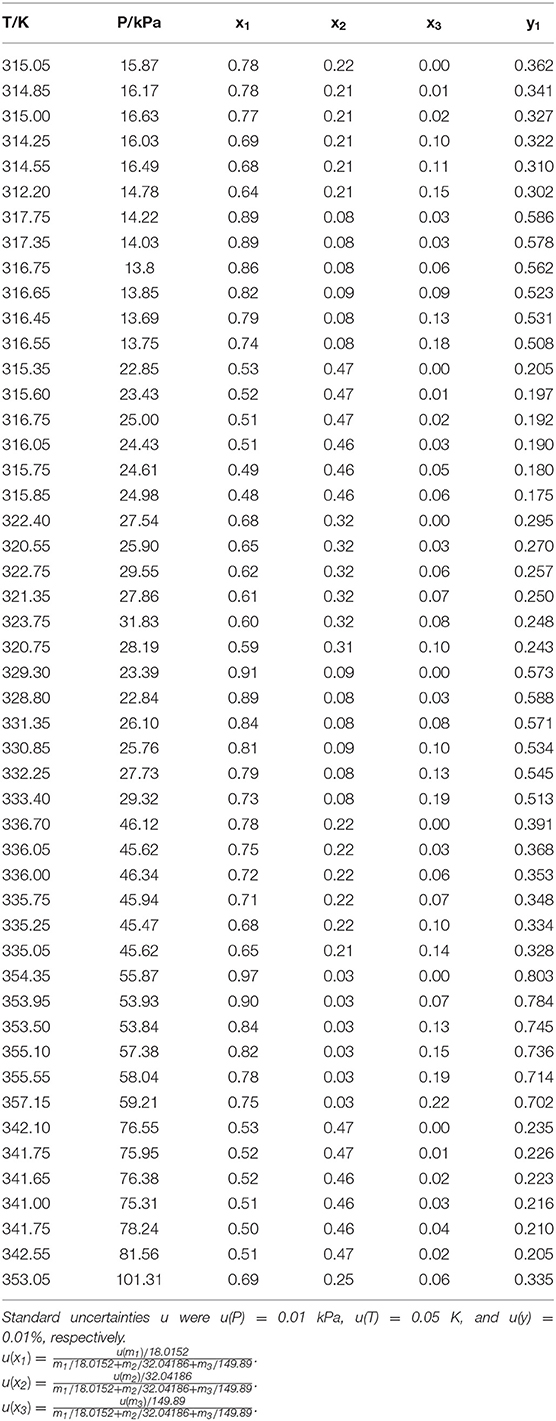
Table 3. Experimental VLE data of the H2O(1)+CH3OH(2)+KI(3) system.
Model Description
Modification of Xu's Model for Mixed Solvent Electrolyte Systems
Xu's model (Yuan et al., 2019) can be employed to correlate and predict the VLE for electrolyte solution systems. In this work, a modified Xu's model was proposed to be used to calculate the VLE for mixed solvent electrolyte systems. The model for the excess Gibbs energy was expressed by the NRTL term. For mixed solvent electrolyte system, we added the solvent-salt terms and the solvent-solvent terms in the proposed model (Xu et al., 2016). Then, the activity coefficients were calculated by the excess Gibbs energy of the solvent-salt term and solvent-solvent term. For example, in a solvent 1-solvent 2-salt system
This approach has been used to calculate activity coefficient between 298 and 355 K. For correlating data at different temperatures, a temperature dependence of the parameters τi, j and τi, j was used in which
where subscript 1, 2, and 3 are solvent 1, solvent 2, and salt, respectively; nt is the molar of solute; and solvent mx is the total molality of solute, α = 0.3. The reference state of the activity coefficients in the excess Gibbs energy model is γi → 1 as xi (=ni/nt) → 1.
In Equation 10, the solvation of solvent based on the hydration of Xu's model was introduced:
where n1, n2, and n3 are active contents; , , and are actual contents; and Z1 and Z2 are solvation parameters.
The final equation can be deduced:
In the final model (Equations 7 and 8), parameters, , , , , , , , , Z1, and Z2 were fitted to the literature data, and the parameters can be used to calculate the activity coefficient for mixed solvent electrolyte systems between 298 and 355 K. Eight model parameters were used to fit the VLE data for one mixed electrolyte system at one temperature. The calculation software of this work was 1stopt 7.0 (7D-Soft High Technology Inc.), and the calculation algorithm was Universal Global Algorithm.
Results and Discussion
The experimental data for three ternary systems (i.e., H2O+CH3OH+NaI, H2O+CH3OH+KBr, and H2O+CH3OH+KI) at different molality are listed in Tables 1–3. Meanwhile, we analyzed and summarized the results of H2O+CH3OH+NaCl (Yang and Lee, 1998), H2O+CH3OH+NaBr (Xu et al., 2018), H2O+CH3OH+NaI, H2O+CH3OH+KCl (Xu et al., 2018), H2O+CH3OH+KBr, and H2O+CH3OH+KI shown in Figures 2, 3, and we obtained the possible relationship between the solubility of salt and the VLE.
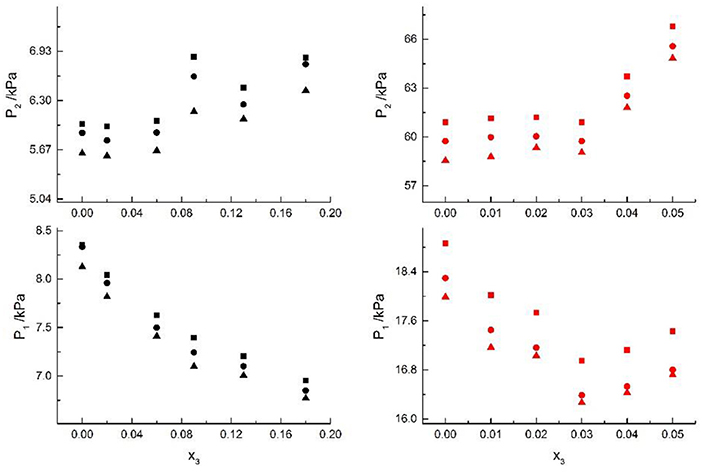
Figure 2. VLE of H2O (1)+CH3OH (2)+NaCl (3): ■ indicates the Literature data (Yang and Lee, 1998); H2O (1)+CH3OH (2)+NaBr (3): • indicates the Literature data (Xu et al., 2018); H2O(1)+CH3OH(2)+NaI(3): ▲. Filled symbols (Black: x2 = 0.08 and T = 316 K; Red: x2 = 0.46 and T = 341K) indicate the experimental data.
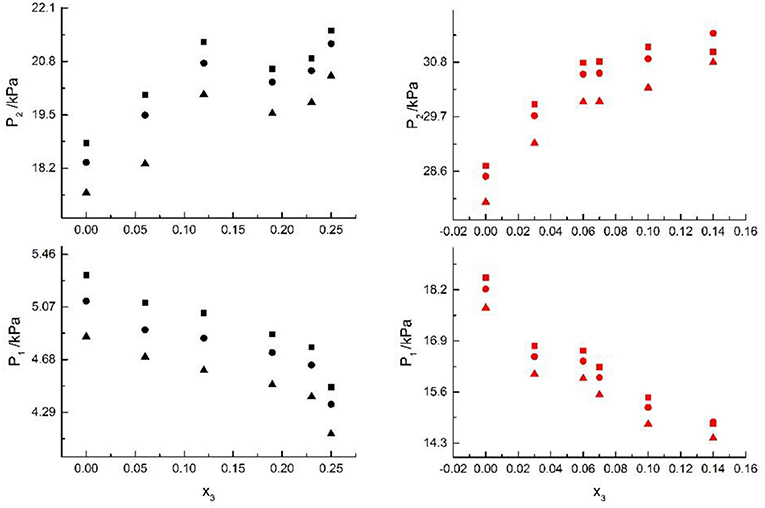
Figure 3. VLE of H2O(1)+ CH3OH(2)+KCl(3): ■ indicate the Literature data (Xu et al., 2018); H2O(1)+ CH3OH(2)+KBr(3): • indicate experimental data; H2O(1)+ CH3OH(2)+KI(3): ▲. Filled symbols (black: x2 = 0.45 and T = 315 K; red: x2 = 0.22 and T = 335 K) indicate experimental data.
We then studied the thermodynamic model for mixed solvent electrolyte systems and proposed the modified NRTL model to correlate the VLE for the systems. Equations (7) and (8), the Yang's model (Yang and Lee, 1998), the Iliuta's model (Kumagae et al., 1992), the Kumagae's model (Robinson and Stokes, 2012), and Xu's model (Xu et al., 2018) were used to correlate VLE data in mixed-solvent electrolyte systems. Seven salts (i.e., NaCl, NaBr, NaI, KCl, KBr, KI, and CaCl2) and four solvents (i.e., water, methanol, ethanol, and 1-propanol) were chosen, and the VLE behaviors of 11 mixed-solvent electrolyte ternary systems were researched.
H2O+CH3OH+NaCl (Yang and Lee, 1998), H2O+CH3OH+NaBr (Xu et al., 2018), H2O+CH3OH+NaI, H2O+CH3OH+KCl (Xu et al., 2018), H2O+CH3OH+KBr, and H2O+CH3OH+KI systems were chosen to study the VLE of H2O+methanol+alkali metal halide systems, as shown in Figures 2, 3.
From the Tables and Figures, we can see that the VLE are similar in the alkali metal systems. For the H2O+CH3OH+NaCl, H2O+CH3OH+NaBr, and H2O+CH3OH+NaI systems, as the salt concentration x3 increased under the condition (x2 = 0.08 and T = 316 K), P1 of water decreased, and P2 of methanol rose regularly. As the salt concentration x3 increased under the condition (x2 = 0.46 and T = 341K), P1 of water decreased first and then rose, and P2 of methanol rose regularly. For the H2O+CH3OH+KCl, H2O+CH3OH+KBr, and H2O+CH3OH+KI systems, as the salt concentration x3 increased under the condition (x2 = 0.45 and T = 315K), P1 of water decreased, and P2 of methanol rose regularly. As the salt concentration x3 increased under the condition (x2 = 0.22 and T = 335K), P1 of water decreased, and P2 of methanol rose. Through the above analysis, we found that the solubility of salt is an important factor affecting the VLE.
Results of the New Model
Parameters, , , , , , , , , Z1, and Z2were obtained from the correlation of the experimental and literature data, as listed in Table 4. The results of correlation for 11 mixed solvent electrolyte systems were listed in Table 5 in the form of mean deviation between literature and calculated value. It can be seen from Table 5 that dY ≤ 0.24 kPa, and the mean value of dY = 0.11 kPa; dP ≤ 3.79%, and the mean value of dP = 2.38%. dY and dP were calculated via equations:
where N is the data point number, and Pexp and Pcal are experimental vapor pressure and calculated vapor pressure, respectively.
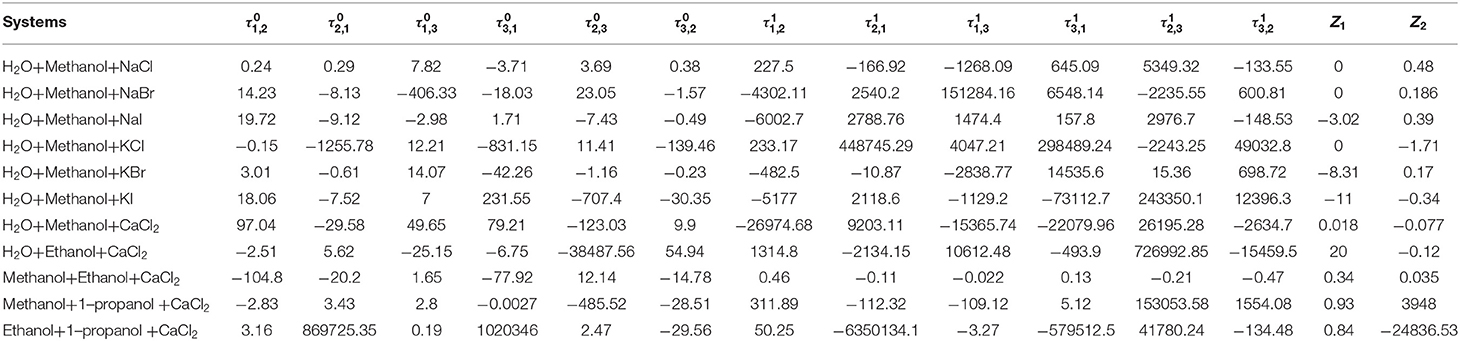
Table 4. Model parameters of some solvents-salt systems.
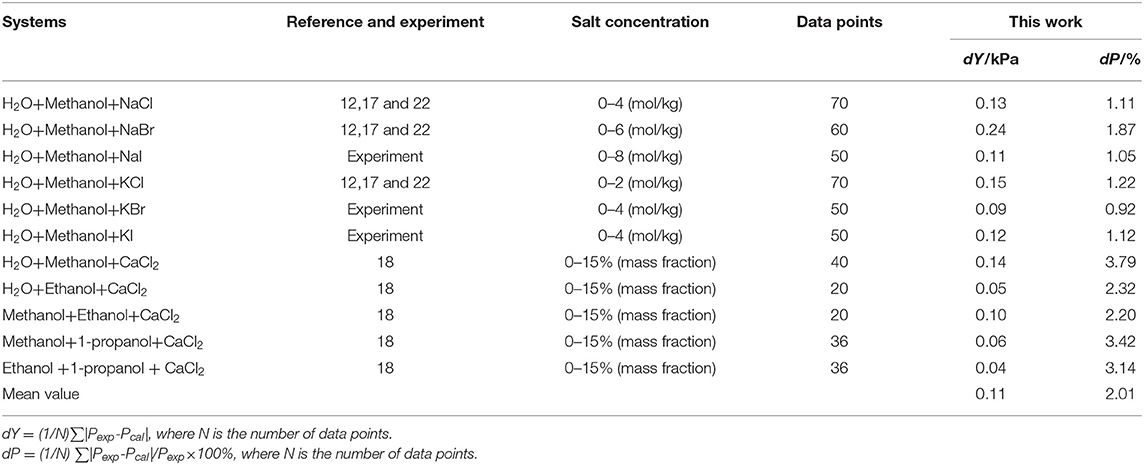
Table 5. Correlation of VLE data for mixed-solvent systems at 298.15 K.
Seven salts (i.e., NaCl, NaBr, NaI, KCl, KBr, KI, and CaCl2) in water, methanol, ethanol, and normal propyl solvent systems were chosen to correlate the proposed new model, as shown in Table 5 and Figures 4–10. From the tables and Figures, small deviations can be found between literature data and calculated value, indicating a good accuracy of the proposed model for correlating the VLE behavior in mixed solvent electrolyte systems. The result indicates that model assumptions and derivations process are suitable for mixed solvent electrolyte systems.
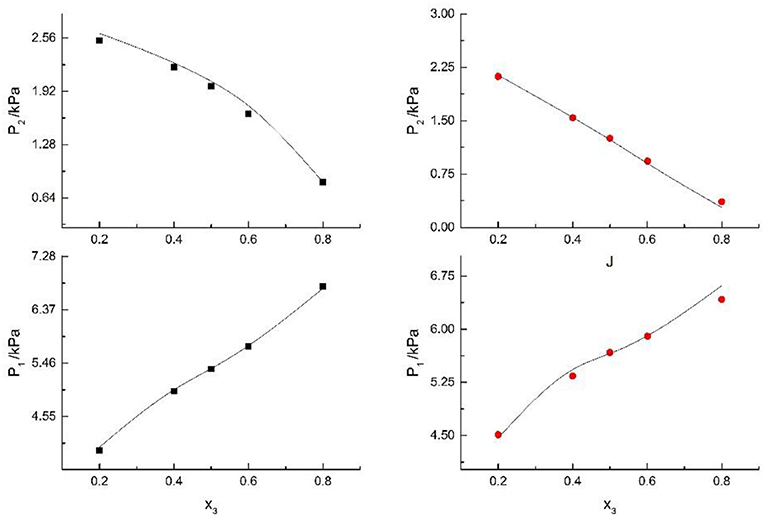
Figure 4. Correlation of VLE data of H2O(1)+ CH3OH(2)+ CaCl2(3) system. Filled symbols (■x2 = 0.05 and T = 298.15 K; x2 = 0.15 and T = 298.15 K) indicate literature data (Kumagae et al., 1992); curves indicate correlation of the model.

Figure 5. Correlation of VLE data of H2O(1)+ CH3OH(2)+NaCl(3) system. Filled symbols (■x2 = 0.45, T = 315 K; x2 = 0.22, T = 335 K) indicate Literature data (Yang and Lee, 1998). Curves indicate correlation of the model.
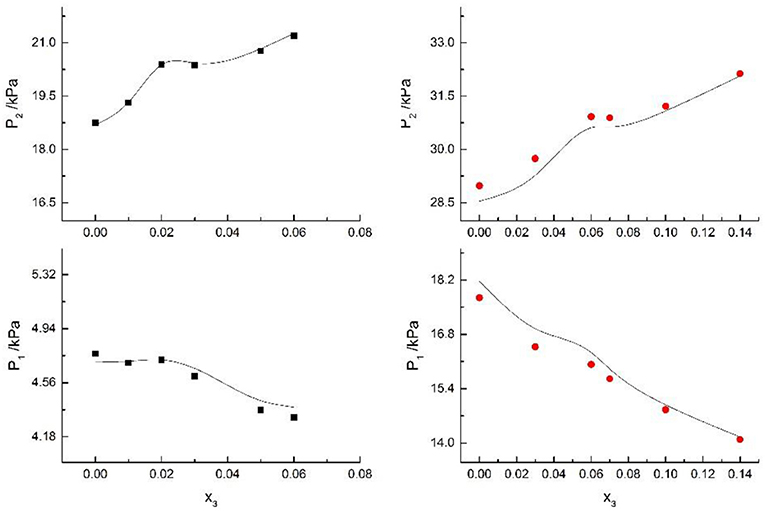
Figure 6. Correlation of VLE data of H2O(1)+ CH3OH(2)+NaBr(3) system. Filled symbols (■x2 = 0.45 and T = 315 K; x2 = 0.22 and T = 335 K) indicate Literature data (Xu et al., 2018); curves indicate correlation of the model.
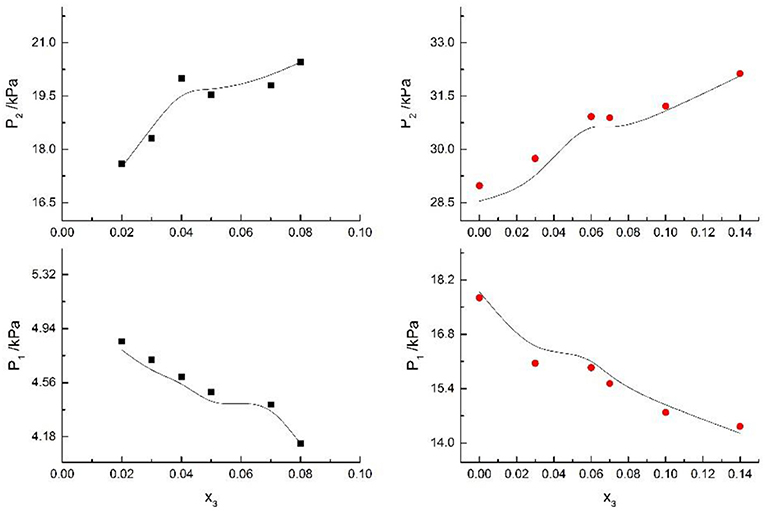
Figure 7. Correlation of VLE data of H2O(1)+ CH3OH(2)+NaI(3) system. Filled symbols (■x2 = 0.45 and T = 315 K; x2 = 0.22 and T = 335 K) indicate experimental data; curves indicate correlation of the model.
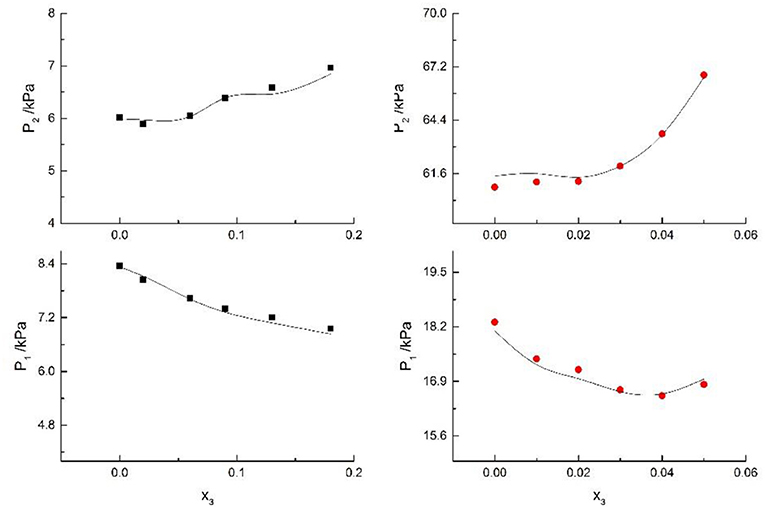
Figure 8. Correlation of VLE data for H2O(1)+ CH3OH(2)+KCl(3) system. Filled symbols (■x2 = 0.08 and T≈316 K; x2 = 0.46 and T = 341 K) indicate Literature data (Xu et al., 2018); curves indicate correlation of the model.
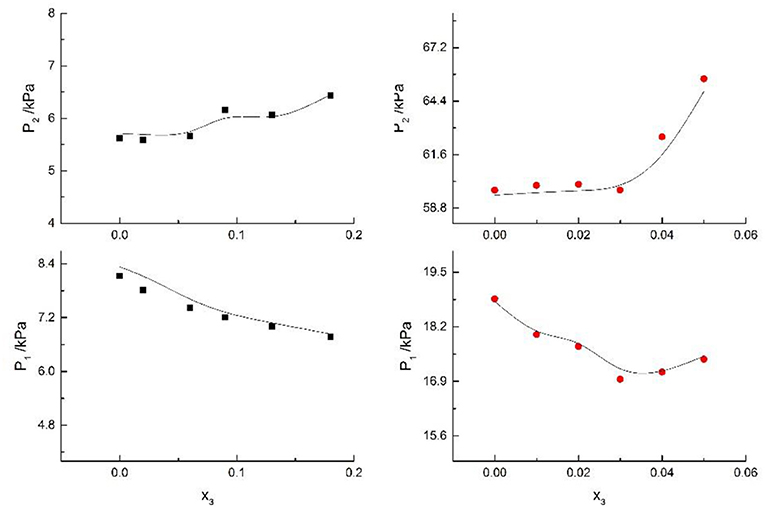
Figure 9. Correlation of VLE data for H2O(1)+ CH3OH(2)+KBr(3) system. Filled symbols (■x2 = 0.08 and T = 316 K; x2 = 0.46 and T = 341 K) indicate experimental data; curves indicate correlation of the model.
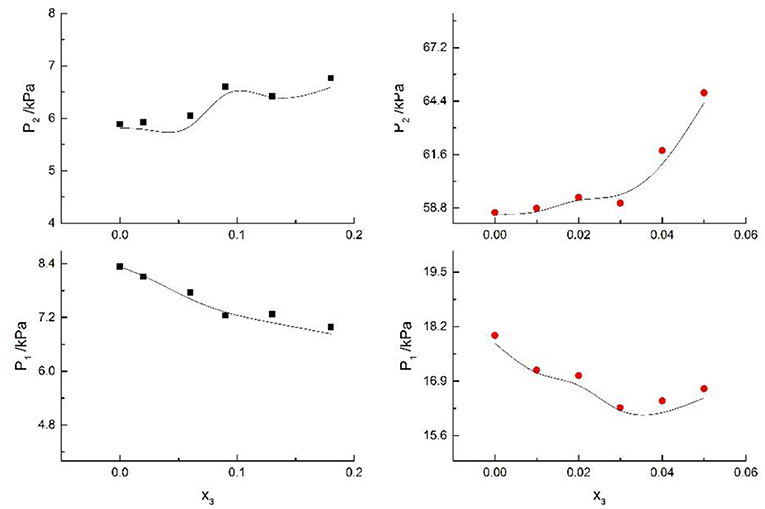
Figure 10. Correlation of VLE data for H2O(1)+ CH3OH(2)+KI(3) system. Filled symbols (■x2 = 0.08 and T = 316 K; x2 = 0.46 and T = 341 K) indicate experimental data; curves indicate correlation of the model.
Comparison With Other Methods
We selected eight systems for comparing Yang's model (Yang and Lee, 1998), Iliuta's model (Kumagae et al., 1992), Kumagae's model (Robinson and Stokes, 2012), and Xu's model (Xu et al., 2018) with the proposed model in this work. Comparison results are shown in Tables 6, 7.
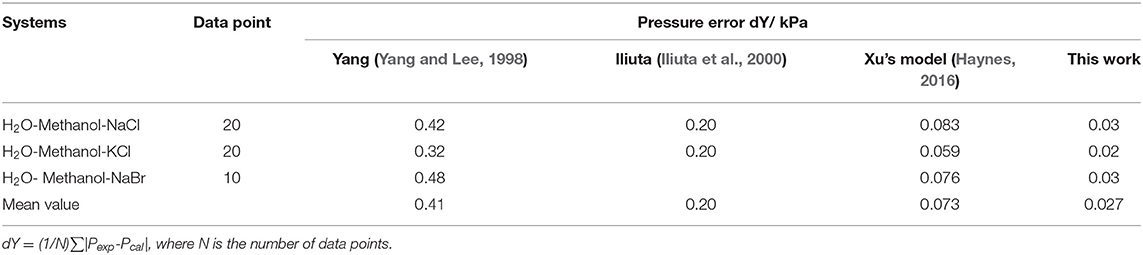
Table 6. Comparison of VLE for H2O-methanol-salt systems at 298.15 K.
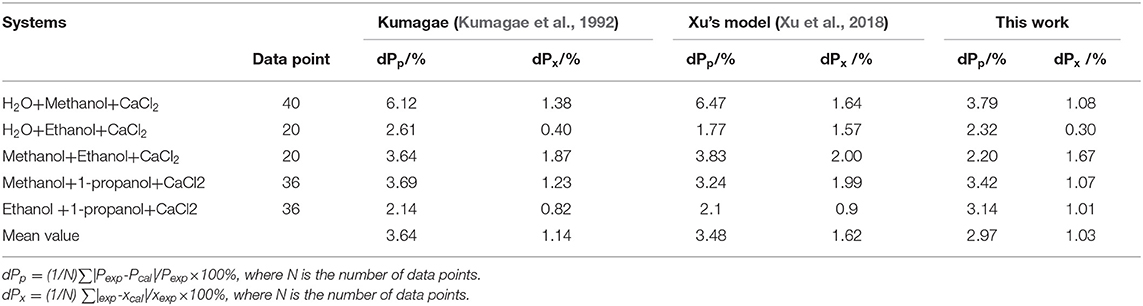
Table 7. Comparison of VLE for systems containing CaCl2 at 298.15K.
For water-methanol-salt systems (Table 6), the dY maximum value (dY = 0.03 kPa) of the proposed model in this work was less than that of Yang's model (dY = 0.42 kPa), Iliuta's model (dY = 0.2 kPa), and Xu's model (dY = 0.083 kPa). Likewise, the mean value dY (0.027 kPa) of the model in this work was less than that of Yang's model (dY = 0.41 kPa), Iliuta's model (dY = 0.2 kPa), and Xu's model (dY = 0.073 kPa). The specific assumptions and theoretical derivations for mixed solvent electrolyte systems were not introduced in Yang's model and Iliuta's model, which may have resulted in inaccurate model calculations for certain systems. The model in this work for the excess Gibbs energy was derived from the NRTL equation, and the activity coefficients were calculated by solvent-salt terms and solvent-solvent terms, respectively. In comparison with Yang's model and Iliuta's model, the assumption of solvation for mixed solvent electrolyte systems was introduced in this work. Due to the assumptions and theoretical derivations in this work, the proposed model in this work was considered to be more comprehensive and accurate.
For the systems containing CaCl2 in Table 7, the maximum value dPp and dPx of the proposed model were 3.79 and 1.67%, respectively. The maximum value dPp and dPx of Kumagae's model were 6.12 and 1.87%, respectively, and the maximum value dPp and dPx of Xu's model were 6.47 and 2.00%, respectively. The mean value dPp and dPx of the proposed model were 2.97 and 1.03%, respectively. The mean value dPp and dPx of Kumagae's model were 3.64 and 1.14%, respectively, and the mean value dPp and dPx of Xu's model were 3.48 and 1.62%, respectively. In this section, dPp and dPx were calculated via two equations:
From the results in Table 7, correlations of the proposed model in this work were better than Kumagae's model and Xu's model. Kumagae's model is a semi-empirical model based on Hála's model, and the model in this work simplified the calculation procedure as compared to Kumagae's model. In addition, Kumagae calculated the VLE of CaCl2+CH3OH+H2O and CaCl2+CH3CH2OH+H2O to be at 298.15K in the model. However, the developed model in this work was demonstrated as suitable for a broader range of temperature and pressure conditions. In summary, the proposed model was superior to other models in terms of the calculation results, calculation process, model comprehensibility, and scope of application.
Conclusions
In this paper, the VLE data for H2O+CH3OH+NaI, H2O+CH3OH+KBr, and H2O+CH3OH+KI systems were reported. The reliability of measurements was verified by comparing our experimental data in two binary systems (i.e., H2O+CaCl2 and H2O+C2H5OH). Through the analysis, it has been shown that the solubility of salt is an important factor affecting the VLE.
Contemporaneously, a modified model was developed for calculating the VLE of mixed solvent electrolyte systems. The proposed model introduced a new excess Gibbs energy equation that is based on the NRTL model and Xu's model. We obtained the new model's parameters by correlating the experimental and literature data. The calculation results were compared to Yang's model, Iliuta's model, Kumagae's model, and Xu's model. In general, the model in this work can be used to successfully calculate VLE data for mixed solvent electrolyte systems.
Data Availability Statement
All datasets generated for this study are included in the article/supplementary material.
Author Contributions
XX and ZW: overall planning of the article and modeling. NZ: experimental design and data processing. YZ: experimental design and experimental equipment assembly. YW: experimental operation and data processing.
Funding
This work was supported by the National Natural Science Foundation of China (no. 21703115).
Conflict of Interest
The authors declare that the research was conducted in the absence of any commercial or financial relationships that could be construed as a potential conflict of interest.
References
Aebischer, J., Brivio, I., Celis, A., Evans, J. A., Jiang, Y., Kumar, J., et al. (2018). WCxf: an exchange format for Wilson coefficients beyond the standard model. Comput. Phys. Commun. 232, 71–83. doi: 10.1016/j.cpc.2018.05.022
Chen, C. C., and Song, Y. (2004). Generalized electrolyte-NRTL model for mixed-solvent electrolyte systems. AIChE J. 50, 1928–1941. doi: 10.1002/aic.10151
Das, G., Lencka, M. M., Eslamimanesh, A., Wang, P., Anderko, A., Riman, R. E., et al. (2019). Rare earth sulfates in aqueous systems: thermodynamic modeling of binary and multicomponent systems over wide concentration and temperature ranges. J. Chem. Thermodyn. 131 49–79. doi: 10.1016/j.jct.2018.10.020
Farajnezhad, A., Afshar, O. A., Khansary, M. A., Shirazian, S., and Ghadiri, M. (2016). Correlation of interaction parameters in Wilson, NRTL and UNIQUAC models using theoretical methods. Fluid Phase Equilib. 417, 181–186. doi: 10.1016/j.fluid.2016.02.041
Hossain, N., Bhattacharia, S. K., and Chen, C. C. (2016). Temperature dependence of interaction parameters in electrolyte NRTL model. AIChE J. 62, 1244–1253. doi: 10.1002/aic.15080
Iliuta, M. C., Thomsen, K., and Rasmussen, P. (2000). Extended UNIQUAC model for correlation and prediction of vapour–liquid–solid equilibria in aqueous salt systems containing non-electrolytes. part A. methanol–water–salt systems. Chem. Eng. Sci. 55, 2673–2686. doi: 10.1016/S0009-2509(99)00534-5
Kontogeorgis, G. M., Maribo-Mogensen, B., and Thomsen, K. (2018). The Debye-Hückel theory and its importance in modeling electrolyte solutions. Fluid Phase Equilib. 462, 130–152. doi: 10.1016/j.fluid.2018.01.004
Kumagae, Y., Mishima, K., Hongo, M., Kusunoki, M., and Arai, Y. (1992). Effect of calcium chloride on vapor-liquid equilibria of alcohol-alcohol and alcohol-water binary systems. Can. J. Chem. Eng. 70, 1180–1185. doi: 10.1002/cjce.5450700619
Li, M., Constantinescu, D., Wang, L., Mohs, A., and Gmehling, J. R. (2010). Solubilities of NaCl, KCl, LiCl, and LiBr in methanol, ethanol, acetone, and mixed solvents and correlation using the LIQUAC model. Ind. Eng. Chem. Res. 49, 4981–4988. doi: 10.1021/ie100027c
Mohs, A., and Gmehling, J. (2013). A revised LIQUAC and LIFAC model (LIQUAC*/LIFAC*) for the prediction of properties of electrolyte containing solutions. Fluid Phase Equilib. 337, 311–322. doi: 10.1016/j.fluid.2012.09.023
Pereira, E., Junqueira, F. T., de Almeida Meirelles, A. J., and Maximo, G. J. (2019). Prediction of the melting behavior of edible fats using UNIFAC and UNIQUAC models. Fluid Phase Equilib. 493, 58–66. doi: 10.1016/j.fluid.2019.04.004
Pitzer, K. S. (2018). Activity Coefficients in Electrolyte Solutions. Boca Raton, FL: CRC press. doi: 10.1201/9781351069472
Puentes, C., Joulia, X., Athès, V., and Esteban-Decloux, M. (2018). Review and thermodynamic modeling with NRTL model of Vapor–Liquid Equilibria (VLE) of aroma compounds highly diluted in ethanol–water mixtures at 101.3 kPa. Ind. Eng. Chem. Res.. 57, 3443–3470. doi: 10.1021/acs.iecr.7b03857
Qian, S., Wang, C., Liu, W., Zhu, Y., Yao, W., and Lu, X. (2011). An enhanced CdS/TiO 2 photocatalyst with high stability and activity: effect of mesoporous substrate and bifunctional linking molecule. J. Mater. Chem. 21, 4945–4952. doi: 10.1039/c0jm03508d
Robinson, R. A., and Stokes, R. H. (2012). Electrolyte Solutions. 2nd Revised Edn. London: Courier Dover Publications.
Wang, H., Chen, H., Chen, W., Sun, H., and Xu, X. (2019). Vapor–liquid equilibrium study of LiBr+ H2O and LiBr+ CaCl2+ H2O systems. Front. Chem. 7:890. doi: 10.3389/fchem.2019.00890
Xu, X., Hu, Y., Wang, X., and Wu, L. (2016). Experimental and modeling of vapor–liquid equilibria for mixed electrolyte solution systems. J. Chem. Eng. Data. 61, 2311–2320. doi: 10.1021/acs.jced.5b01028
Xu, X., Wang, Y., Sun, X., and Zhou, Y. (2019). Vapor–liquid equilibria study of the LiCl+ CaCl2+ H2O System. ACS Omega 4, 4390–4396. doi: 10.1021/acsomega.8b03570
Xu, X., Zhou, Y., Wang, Z., and Wang, X. (2018). Experiment and modeling of vapor–liquid equilibria for H2O+ CH3OH+ KCl and H2O+ CH3OH+ NaBr systems. Calphad 63, 134–141. doi: 10.1016/j.calphad.2018.09.003
Yang, S.-O., and Lee, C. S. (1998). Vapor– liquid equilibria of water+ methanol in the presence of mixed salts. J. Chem. Eng. Data 43, 558–561. doi: 10.1021/je970286w
Yuan, Y., Xu, X., Xia, J., Zhang, F., Wang, Z., and Liu, Q. (2019). A hybrid material composed of reduced graphene oxide and porous carbon prepared by carbonization of a zeolitic imidazolate framework (type ZIF-8) for voltammetric determination of chloramphenicol. Microchimica Acta. 186:191. doi: 10.1007/s00604-019-3298-8
Zhong, J., Tang, N., Asadzadeh, B., and Yan, W. (2017). Measurement and correlation of solubility of theobromine, theophylline, and caffeine in water and organic solvents at various temperatures. J. Chem. Eng. Data 62, 2570–2577. doi: 10.1021/acs.jced.7b00065
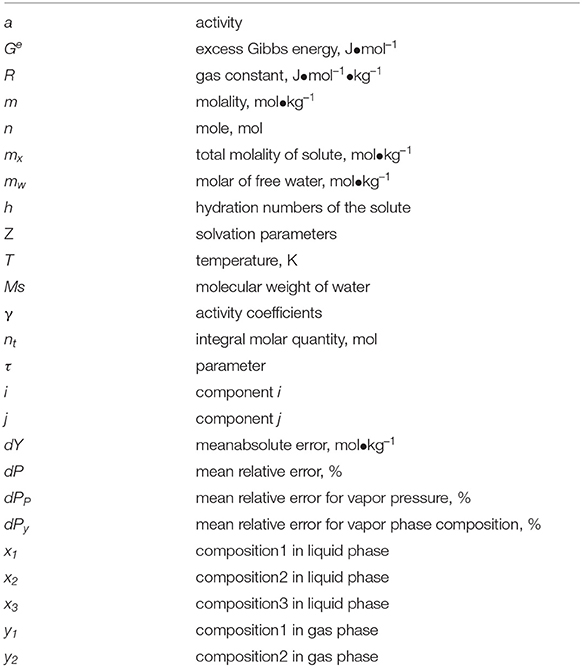
Nomenclature
Keywords: water-methanol-salt, electrolyte solution, vapor–liquid equilibrium (VLE), thermodynamic, modeling
Citation: Xu X, Zhang N, Zhou Y, Wang Y and Wang Z (2020) The Effects of NaI, KBr, and KI Salts on the Vapor-Liquid Equilibrium of the H2O+CH3OH System. Front. Chem. 8:192. doi: 10.3389/fchem.2020.00192
Received: 10 January 2020; Accepted: 02 March 2020;
Published: 07 April 2020.
Edited by:
Doo Soo Chung, Seoul National University, South KoreaReviewed by:
Jun Gao, Shandong University of Science and Technology, ChinaImran Khan, Sultan Qaboos University, Oman
Copyright © 2020 Xu, Zhang, Zhou, Wang and Wang. This is an open-access article distributed under the terms of the Creative Commons Attribution License (CC BY). The use, distribution or reproduction in other forums is permitted, provided the original author(s) and the copyright owner(s) are credited and that the original publication in this journal is cited, in accordance with accepted academic practice. No use, distribution or reproduction is permitted which does not comply with these terms.
*Correspondence: Zonghua Wang, wangzonghua@qdu.edu.cn