Exploring the Use of Compound-Induced Transcriptomic Data Generated From Cell Lines to Predict Compound Activity Toward Molecular Targets
 Benoît Baillif
 Joerg Wichard2
  Oscar Méndez-Lucio
 David Rouquié
- 1Bayer SAS, Bayer CropScience, Sophia Antipolis, France
- 2Department of Genetic Toxicology, Bayer AG, Berlin, Germany
- 3Bloomoon, Villeurbanne, France
Pharmaceutical or phytopharmaceutical molecules rely on the interaction with one or more specific molecular targets to induce their anticipated biological responses. Nonetheless, these compounds are also prone to interact with many other non-intended biological targets, also known as off-targets. Unfortunately, off-target identification is difficult and expensive. Consequently, QSAR models predicting the activity on a target have gained importance in drug discovery or in the de-risking of chemicals. However, a restricted number of targets are well characterized and hold enough data to build such in silico models. A good alternative to individual target evaluations is to use integrative evaluations such as transcriptomics obtained from compound-induced gene expression measurements derived from cell cultures. The advantage of these particular experiments is to capture the consequences of the interaction of compounds on many possible molecular targets and biological pathways, without having any constraints concerning the chemical space. In this work, we assessed the value of a large public dataset of compound-induced transcriptomic data, to predict compound activity on a selection of 69 molecular targets. We compared such descriptors with other QSAR descriptors, namely the Morgan fingerprints (similar to extended-connectivity fingerprints). Depending on the target, active compounds could show similar signatures in one or multiple cell lines, whether these active compounds shared similar or different chemical structures. Random forest models using gene expression signatures were able to perform similarly or better than counterpart models built with Morgan fingerprints for 25% of the target prediction tasks. These performances occurred mostly using signatures produced in cell lines showing similar signatures for active compounds toward the considered target. We show that compound-induced transcriptomic data could represent a great opportunity for target prediction, allowing to overcome the chemical space limitation of QSAR models.
Introduction
Biologically active molecules rely on the interaction with one or more molecular targets (Hughes et al., 2000). In the context of hit discovery both in pharmaceutical or in phytopharmaceutical industries, a major objective is to be able to screen molecule candidates for their activity toward a target of interest, and assessing compound activity toward off-targets, that can cause adverse effects in vivo (Rouquié et al., 2015). Testing activity of every candidate on a battery of targets represent a complex task that requires major R&D costs. A potential solution to predict candidate's activity with a lower cost is to perform computational methods using more general measured or calculated descriptors (Chen et al., 2016; Vamathevan et al., 2019).
A commonly used technique is to compute descriptors from chemical structures, like the extended-connectivity fingerprints (ECFPs) and use them for prediction, relying on the quantitative structure-activity relationship (QSAR) principle, i.e., molecules sharing a similar structure may share a similar activity profile (Rogers and Hahn, 2010; Cherkasov et al., 2014). However, such molecule descriptors show limitations: they do not perform well for all target prediction tasks depending on the quantity and quality of available activity data, prediction is limited to the applicability domain (depending on the training set used), and a small change in chemical structure can lead to a large change in biological response (activity cliffs) (Cruz-Monteagudo et al., 2014).
Additional descriptors have been proposed to circumvent such QSAR drawbacks, such as measurements from large scale biological assays (Petrone et al., 2012; Laufkötter et al., 2019). Results from high throughput screening (HTS) assays, such as bioactivity experiments, can be used as fingerprints (HTSFPs) in predictive models for specific targets. Petrone et al. (2012) showed that models using HTSFPs were outperforming models using ECFPs for certain targets, and that HTSFP models' predictions were covering a large structural diversity. The main limiting factor of such models is the sparsity of available activity data. Besides bioactivity data, more integrative large-scale biological measurements, like transcriptomics or cell morphology readouts can be used for target prediction (Aliper et al., 2016; Pabon et al., 2018; Scheeder et al., 2018; Simm et al., 2018; Hofmarcher et al., 2019; Kuthuru et al., 2019; Lapins and Spjuth, 2019).
Compound-induced gene expression data are gathered from biological experiments reflecting how the compound acted on one or multiple targets in a specific biological context. Cancer cell lines, being easily cultured, are a commonly used model to generate gene expression data. Hughes et al. (2000) proved that enough data allows to use pattern-matching algorithms to study similarity between signatures coming from drug induction (Hughes et al., 2000). Lamb et al. (2006) invented the concept of Connectivity Map (CMAP), creating relationships between small molecules, genes and diseases (Lamb et al., 2006). Since then, transcriptomics data have been shown to be useful to identify new molecules with biological activity (Hieronymus et al., 2006; Wei et al., 2006). Recently, a large public CMAP L1000 dataset was released representing more than 300,000 Gene Expression Signatures (GESs) of cell line responses to so-called perturbagens (Subramanian et al., 2017). GESs were produced for more than 20,000 compounds in 80 human cancer cell lines, tested at various concentration and exposition time. The large scale of this dataset allows the use of GESs in machine learning models for target prediction or drug repurposing (Lee et al., 2016; De Wolf et al., 2018).
In the current work, we investigated whether we could predict compound activity toward a larger number of molecular targets based on their GESs extracted from the CMAP L1000 dataset. In addition, we were interested to reveal how machine learning models using GESs perform compared to models using more traditional QSAR descriptors, such as the Morgan fingerprints.
We show that random forest models built using compound-induced GES were able to effectively predict targets, especially if they were produced from a cell line showing similar GESs between active compounds on the evaluated target. For 25% of the target prediction tasks, GESs models had similar or higher performances than models using Morgan fingerprints, offering an opportunity to escape from the chemical space limitation associated with QSAR approaches.
Materials and Methods
Gene Expression Signatures (GESs) Acquisition
The CMAP L1000 dataset was obtained from two GEO repositories: GSE92742, corresponding to the first phase of L1000 (pilot, 2012–2015) and GSE70138, which is the second phase (production, on-going). GESs generation was described by Subramanian et al. (2017).
For this study, we only used Level 5 GESs meaning that each GES is represented by an instance, that is a combination of a perturbagen (chemical or gene deletion), cell line, concentration and time point, and is composed by the plate-normalized expression z-scores of the whole genome, inferred from 978 landmark genes (measured gene that can be used for whole transcriptome inference). We focused on landmark signatures of compound perturbagens, which comprises 333,273 GESs for 21,300 unique compounds. GESs obtained in the exact same condition were averaged, to have one signature per condition.
Among all obtained GESs, the ones generated at a 10 μM and 24 h time point were selected (as shown in Figure 1), as this condition was the most represented in the dataset and facilitate the comparison of results. GESs from the 8 most profiled cell lines were used; cell line and number of GESs are presented in Table 1. Also, only GESs generated by compounds with known structure were selected. In total, the working dataset contains 39,544 GESs obtained from 9,035 compounds.
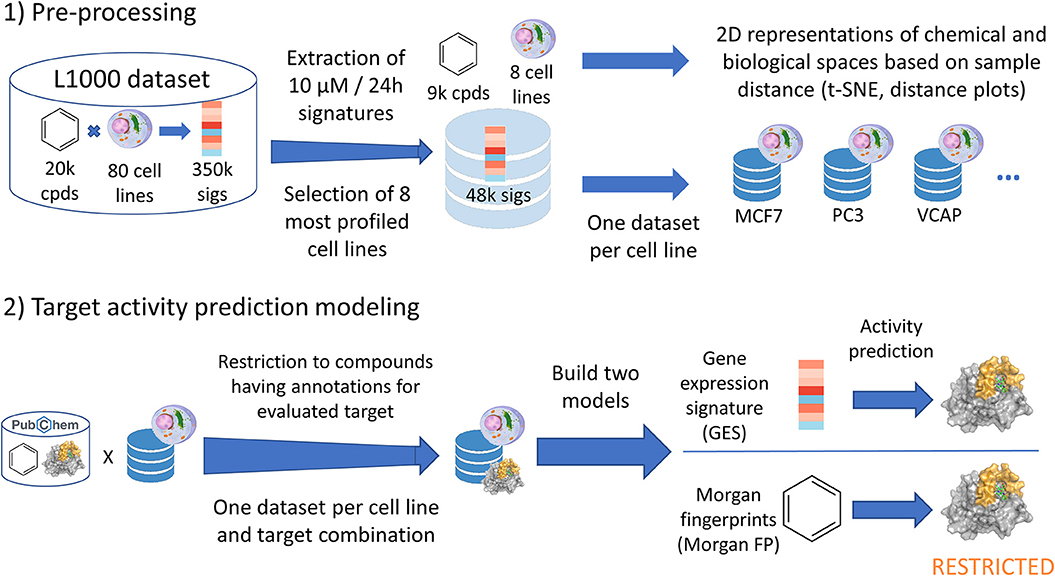
Figure 1. Data analysis pipeline performed in current work. Starting from the CMAP L1000 dataset, signatures produced at 10 μM and 24 h from 8 cell lines were extracted and used in t-SNE and distance plots. One dataset was built per cell line (GES and corresponding compound structure), and each of these datasets were restricted to compounds having known annotations (active or inactive) for the evaluated target. For each target—cell line dataset, a first model was built using the gene expression signatures (GES model). Alongside, a second counterpart model was built using the Morgan fingerprints of compounds whose signatures were used in the first model (Morgan FP model).
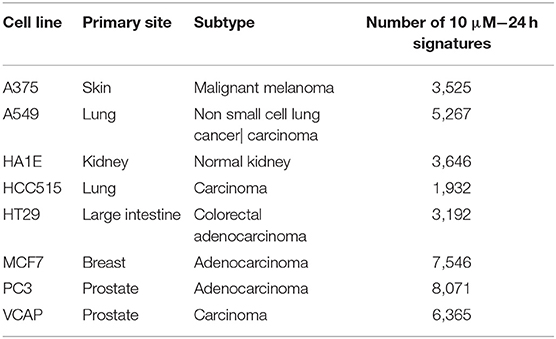
Table 1. The 8 core cell lines used in this work, with their corresponding number of GESs for compounds with known structure tested at 10 μM/24 h.
Activity Data Acquisition
Annotations about activity or inactivity was retrieved from the PubChem BioAssay database, using available CIDs documented in the L1000 signature metadata, excepted for TUBB actives, that were extracted from the Drug Repurposing Hub of the LINCS (Wang et al., 2014; Corsello et al., 2017). Activity data were compiled in a binary activity matrix (1 for active, 0 for inactive, empty if unknown). At least one annotation among 1,388 targets was found for 7,804 of the 9,035 compounds (512,406 annotations were found, representing 4.8% of the full activity matrix).
Representation of Chemical and Biological Spaces
For each compound, binary Morgan fingerprints were computed. The Morgan fingerprints were employed as input of a t-SNE (t-distributed stochastic neighbor embedding) algorithm (using the sklearn implementation) using Dice distance as metric, to reduce the data to a two-dimensional output that can be plotted to represent the chemical space (Van Der Maaten and Hinton, 2008; Pedregosa et al., 2011). Information of the number of targets per compound was included as color-code using a blue gradient in the plot.
The whole extracted 10 μM/24 h signature dataset was used as input for a second t-SNE using the cosine distance metric, representing the overall biological (response) space wherein each cell line was color-coded in the plot. For every cell line, a t-SNE using the cosine distance metric was performed using all GESs profiled in the cell line, generating 2D biological space.
Machine Learning Modeling
Targets for which we know at least 50 active compounds (representing between 1 and 63% of active per target) were selected for machine learning modeling in order to have a minimum number of actives in test sets to evaluate the model performances, and for computational time purposes. Complete information on the number of active and inactive compounds for these selected targets is listed in Table 2.
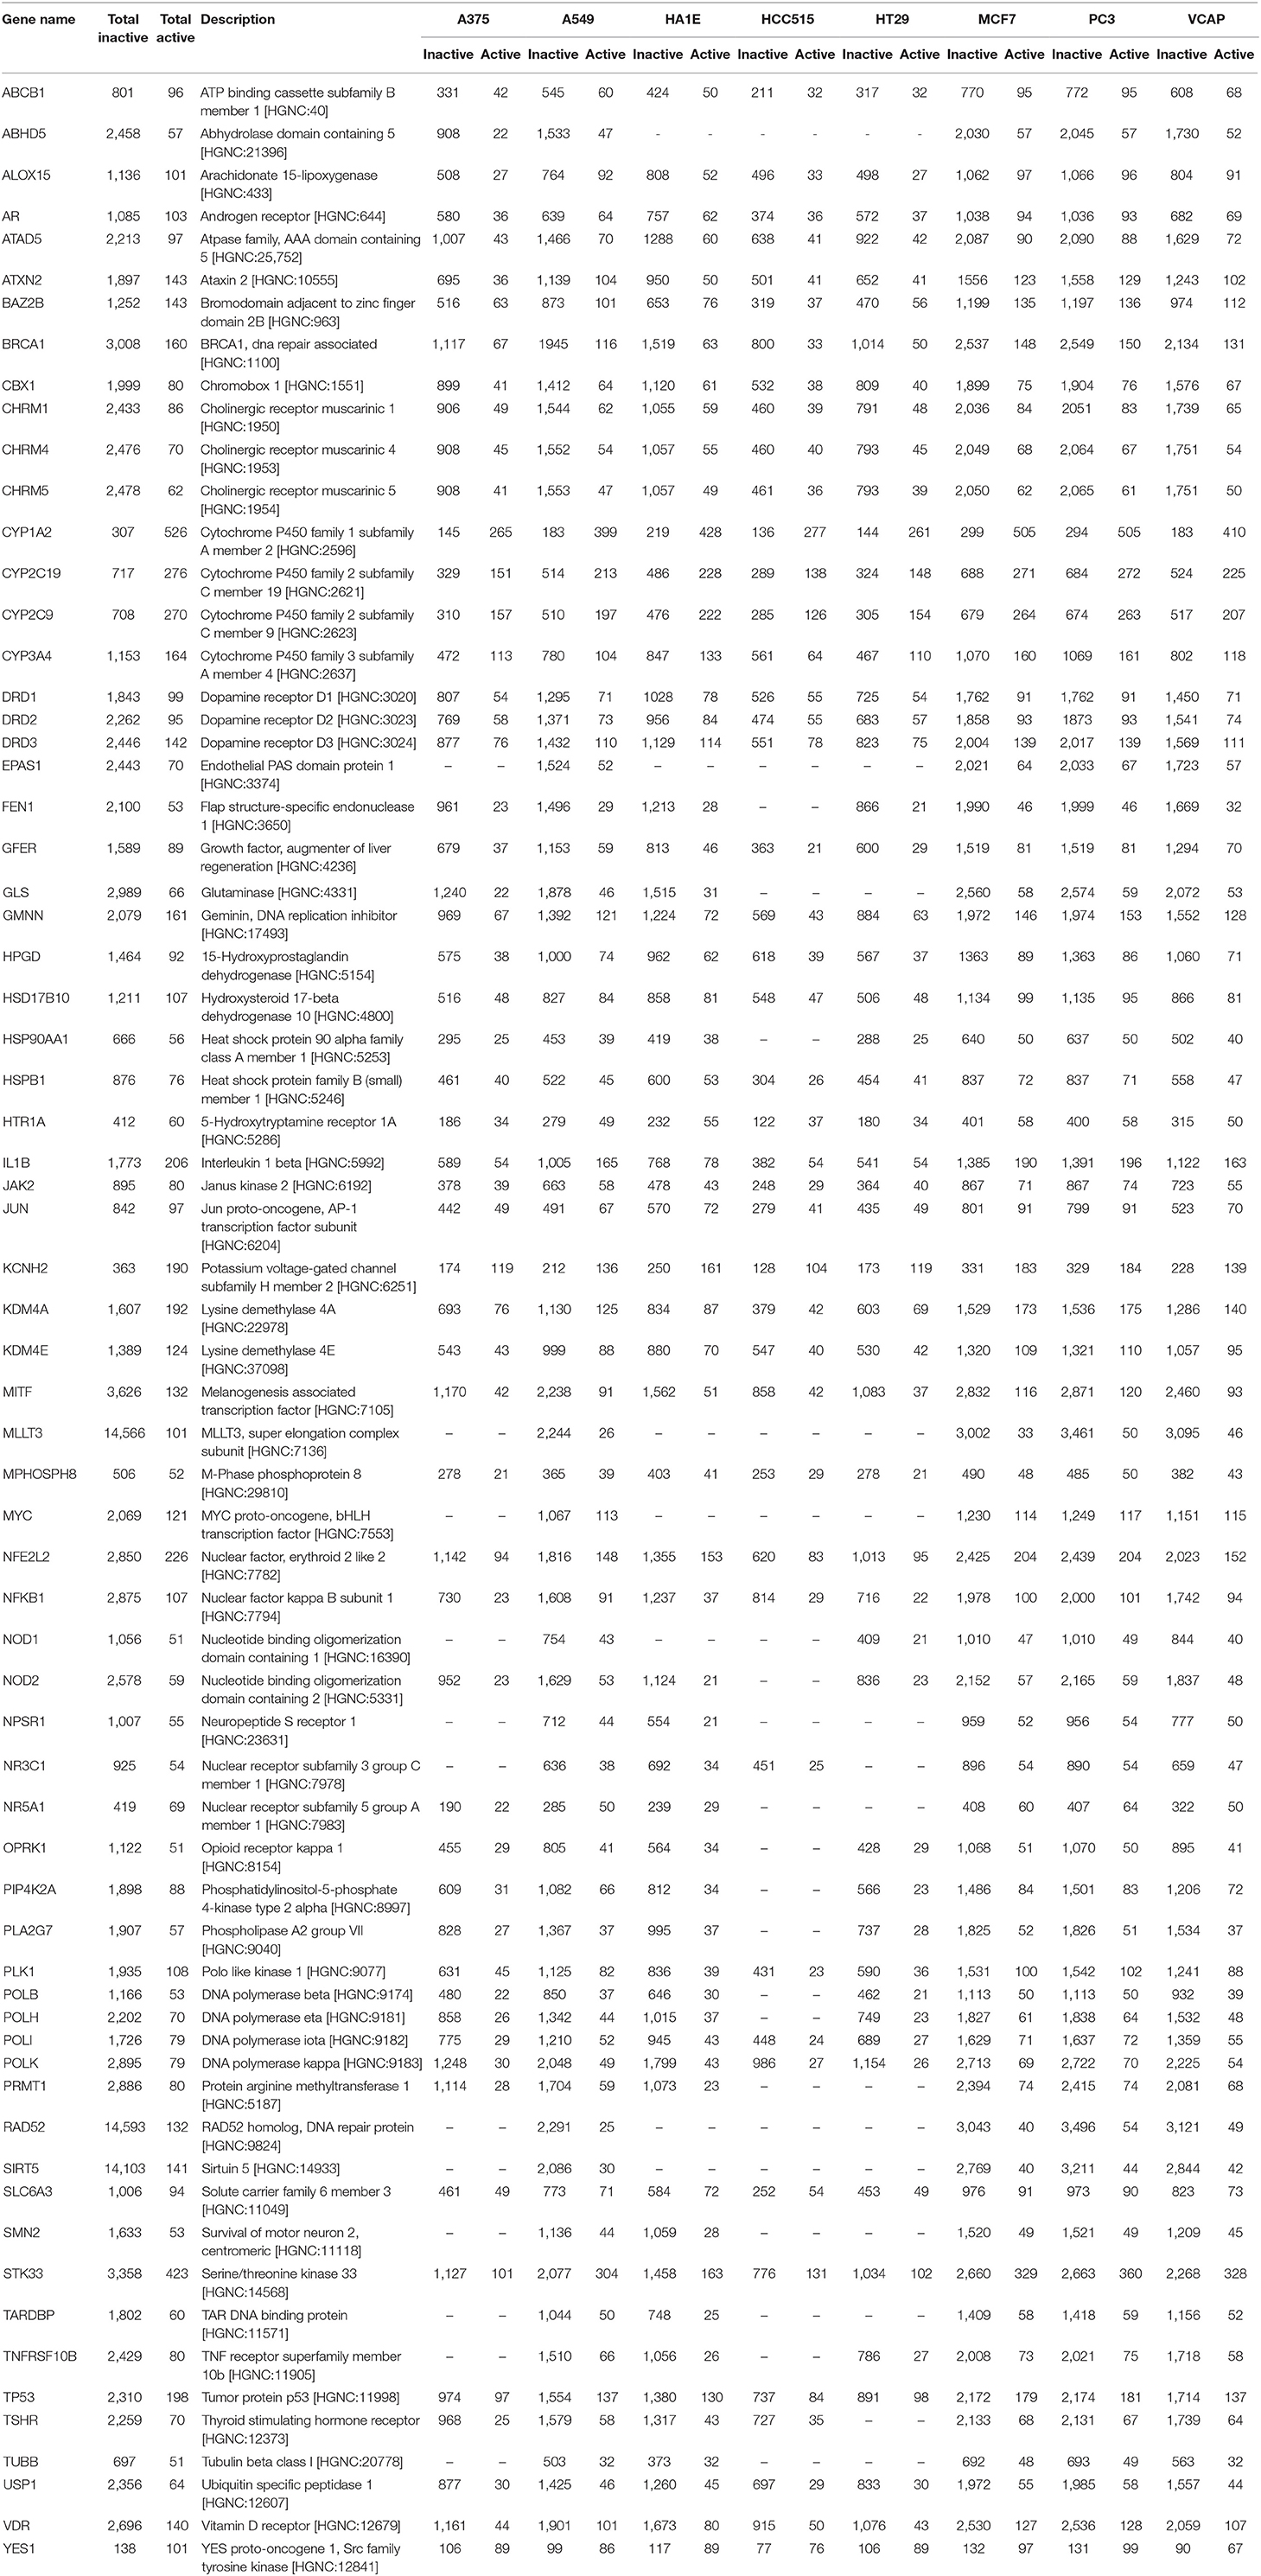
Table 2. Molecular targets used in this work, with number of active and inactive compounds in total, and in each cell line GES dataset.
Subsequently, for each cell line GES dataset, we created a target—cell line GES dataset, restricting to compounds for which target activity was known as shown in Figure 1 (this step caused the number of possible models to drop from 1,104 to 990). Datasets for each target prediction task were split into a training set (67% of the data) and a test set (remaining 33% of the data). Two models for target activity prediction were trained using each subset: a first model used the 978-landmark GES as input (referred as GES models), and the second one used the Morgan fingerprints of corresponding compounds to fairly compare model performances (referred as Morgan FP models). Models were trained using random forest classifiers (Breiman, 2001).
The training was performed using a 4-fold cross-validation on training set to tune the maximum depth of tree, before assessing prediction performances on the test set. The number of trees per model was set to 200. Models were built in Python 2.7 using the sklearn package: to account for unbalanced dataset, the “class_weight” parameter was set to “balanced_subsample,” to increase the weight of the under-represented class samples when training the trees (Pedregosa et al., 2011). A first step of feature selection was performed using an initial random forest classifier, computing the feature importance (Breiman, 2001). Sum of importance of all feature was 1, with each feature importance between 0 (non-important) and 1 (important). This step was performed 5 times, feature importance was averaged by feature, and only the 20 most important features were selected to be loaded into a final random forest model. This whole modeling pipeline, from train-test split to final model was performed 10 times per task, to account for variable performances depending on the dataset split.
Models were evaluated by counting the numbers of true positive (TP), true negative (TN), false positive (FP) and false negative (FN). These parameters were combined in the following metrics in order to compare model performances:
Balanced accuracy allows for a fair evaluation of model performances when using unbalanced datasets, by averaging accuracy for each class (here active and inactives).
Quadrant Plots
Between each possible pair of compounds active on the same target and in each cell line, Dice distance between Morgan fingerprints, and cosine distance between GESs in given cell line were computed. These 2 distances were plotted in a 2D plot (referred as distance plot), Dice distance on X-axis and cosine distance on Y-axis. These plots were theoretically split in 4 quadrants.
Quadrant I in the top-right corner contains active compound pairs having different structures (Morgan fingerprints Dice distance >0.5) and presenting different GESs (cosine distance >0.5); quadrant II in top-left corner contains active compound pairs having similar structures (Morgan fingerprints Dice distance <0.5) and presenting different GESs (cosine distance >0.5); quadrant III in bottom-left corner contains active compound pairs having similar structures (Morgan fingerprints Dice distance <0.5) and presenting similar GESs (cosine distance <0.5); quadrant IV in bottom-right corner contains active compound pairs having different structures (Morgan fingerprints Dice distance >0.5) and presenting similar GESs (cosine distance <0.5). Number of active compound pairs in each quadrant were counted for each distance plot. Similar calculations were made using not only active compounds, but all compounds having an annotation (active or inactive) for considered target and profiled in the same cell line.
Results
In the present work, we investigated the link between compound structure information (n = 9,035) and their corresponding induced biological responses captured by GESs (n = 39,544) in human tumor cell lines and evaluated the potential of machine learning approaches to infer about molecular targets involved in the compound bioactivity. In addition, we compared these machine learning models using GESs with counterpart models using Morgan fingerprints.
Exploration of Chemical and Biological Spaces
As a first step, to observe the diversity of the 9,035 compounds profiled in the 10 μM/24 h L1000 signature dataset, the corresponding chemical space was visualized. Figure 2A is a 2-dimensional t-SNE representation of the chemical space, illustrating the variability in terms of Morgan fingerprints. The 9,035 compounds form a broad chemical space, with a mean Dice distance between compound pairs of 0.81 (ChEMBL has a mean pairwise Dice distance of 0.82). The center of the chemical space is mostly composed by small molecules having on average a molecular weight lower than 500 Da whereas the outer part is populated by clusters of compounds with higher molecular weights (>500 Da). Overall, we were able to retrieve, in the public domain, at least one activity information for 7,837 compounds, from which 4,872 were active in at least one target. The majority of those compounds were found active in a low number of targets, on average 6 per compound, with a median of 2. Not surprisingly, a set of 23 kinase inhibitors were found to be active in more than 100 targets.
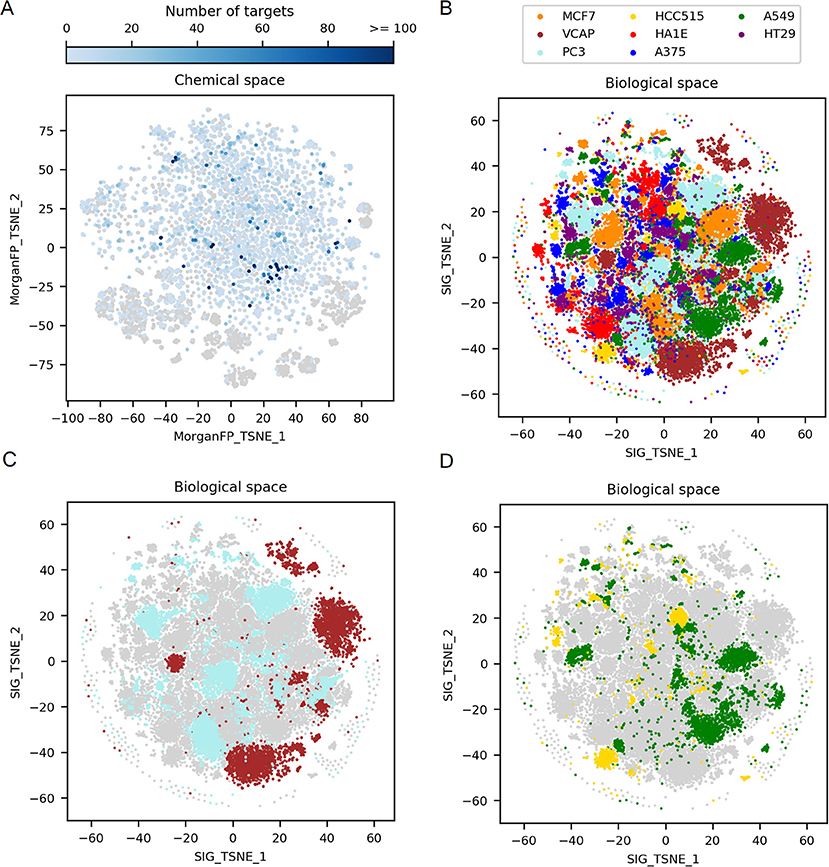
Figure 2. Exploration of the 2D chemical space, along with the corresponding 2D biological space formed by all GES. (A) t-SNE on Morgan fingerprints from the 9,035 compounds in working dataset, representing the chemical space. Points corresponding to compounds for which there is no known target are represented by gray points (n = 4,163). Points corresponding to compounds for which there is at least one known target are in blue (n = 4,872), with darker blue depending on the increasing number of targets. (B) t-SNE on all GESs in the working dataset, representing the biological (transcriptomic response) space. Points corresponding to GESs are colored by cell line. (C) Biological space highlighting only PC3 and VCAP signatures, 2 cell lines originating from prostate cancer. (D) Biological space highlighting only A549 and HCC515 signatures, 2 cell lines originating from lung cancer.
Figure 2B shows a t-SNE plot created using all GESs induced by the 9,035 compounds in the different cell lines to examine the complete biological space. This t-SNE is color coded by the different cell lines used to generate the gene signatures. Each cell line is represented by a set of 4 to 5 main clusters of GESs differing in size and some overlap of the cluster indicates similar GESs derived from different cell lines. In order to better appreciated the differences and communalities in GESs obtained with the selected compounds, t-SNE plots were created highlighting the clusters derived for cell lines originating from the same tumor type namely prostate tumor (VCAP and PC3 in Figure 2C) and lung tumor (A549 and HCC515 in Figure 2D). GESs derived from cell lines coming from the same tissue present very little overlap as can be observed in Figures 2C,D.
These results illustrate the variability in the cellular modifications occurring during carcinogenesis (Hanahan and Weinberg, 2011) and show that each cell line represent a distinct biological space even if the cell lines are derived from the same tissue type. Interestingly, when comparing, for a set of compounds showing GESs in a single cluster in VCAP, GESs of these compounds in PC3 are spread across various clusters from the PC3 biological space (data not shown). This shows that each cell line explores different biological responses to compounds.
After having described the global variability of GESs in the different cell lines, we explored the chemical and biological spaces corresponding to active and inactive compounds on different targets. Since each compound-induced GES obtained in each cell line was shown to represent a unique biological space, t-SNE plots were computed per cell line in order to further explore the link between the different biological spaces and the corresponding chemical ones. For this, we decided to focus on three cell lines derived from different tissues and among the largest GES dataset generated that is to say A549 (lung cancer), MCF7 (breast cancer) and PC3 (prostate cancer). In addition, we selected 3 representative molecular targets showing different chemical and biological space profiles: compounds active on the glucocorticoid receptor (NR3C1) have similar structures, and similar GESs in some cell lines (Figures 3A–D); tubulin beta I (TUBB) actives have more diverse structures but show similar GESs in each cell line considered in this work (Figures 4A–D); and dopamine receptor D1 (DRD1) actives have diverse structure and GESs in every used cell line (Figures 5A–D).
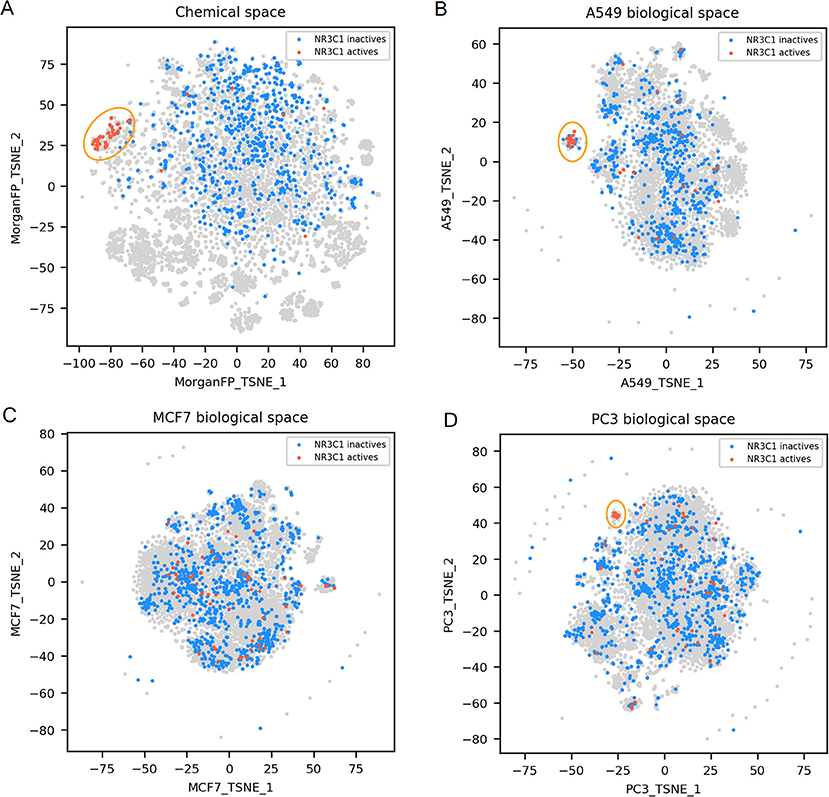
Figure 3. NR3C1 active and inactives compounds in the chemical space and the different biological spaces formed by GES produced in a single cell line. (A) Chemical space; (B) t-SNE on all A549 signatures (A549 biological space); (C) t-SNE on all MCF7 signatures (MCF7 biological space); (D) t-SNE on all PC3 signatures (PC3 biological space). Points corresponding to NR3C1 actives are red (n = 54), NR3C1 inactives (n = 925) are blue, gray points have no available label concerning NR3C1 activity. Orange circles point out clustering of active compounds.
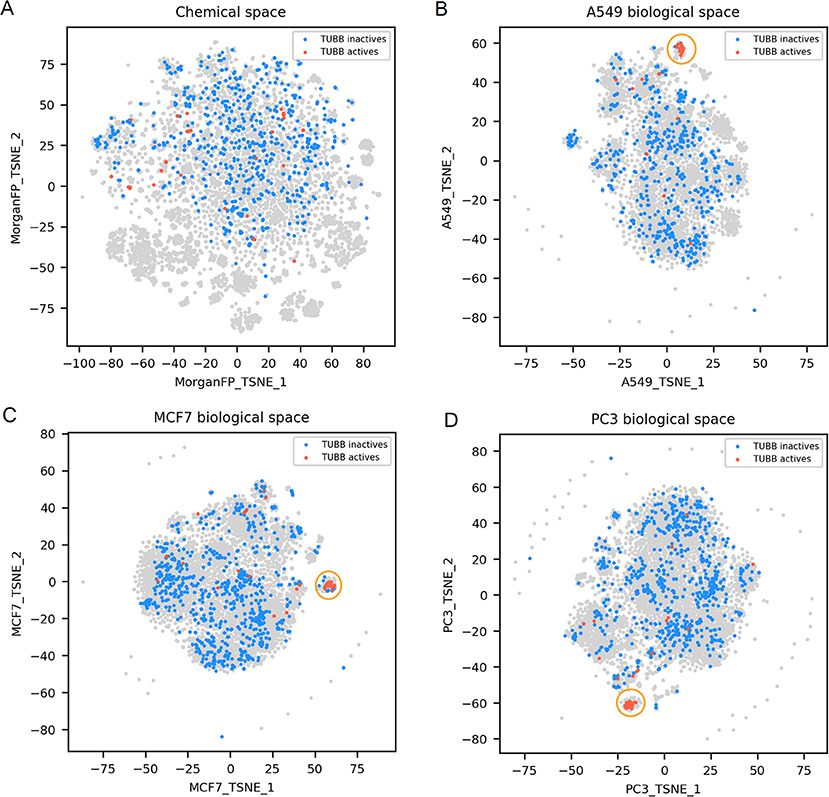
Figure 4. TUBB active and inactives compounds in the chemical space and the different biological spaces formed by GES produced in a single cell line. (A) Chemical space; (B) A549 biological space; (C) MCF7 biological space; (D) PC3 biological space. Points corresponding to TUBB actives (n = 51) are red, TUBB inactives (n = 697) are blue, gray points have no available label concerning TUBB activity. Orange circles point out clustering of active compounds.
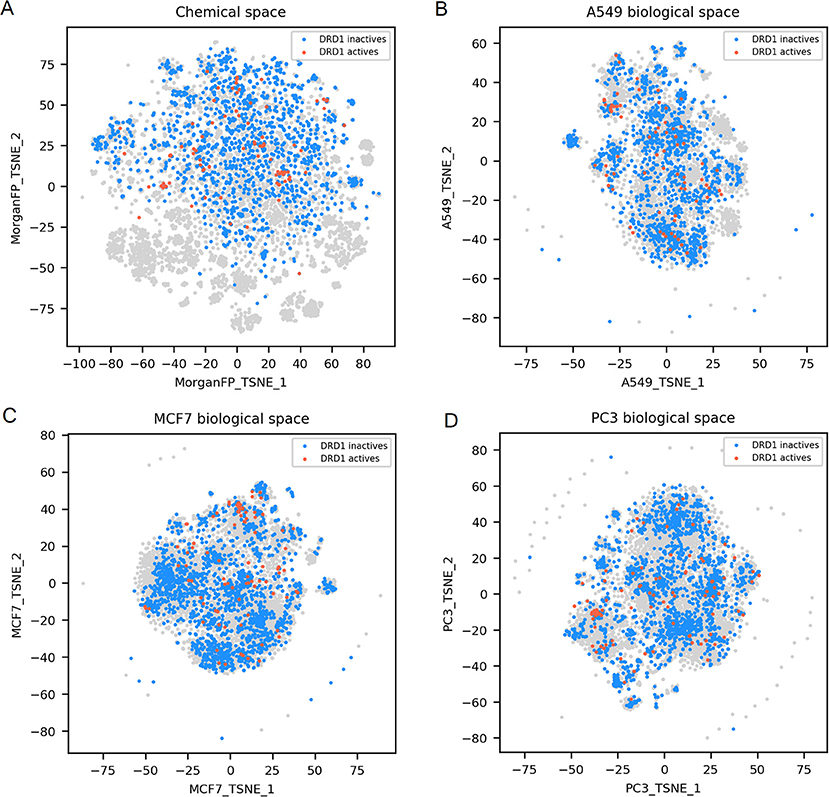
Figure 5. DRD1 active and inactives compounds in the chemical space and the different biological spaces formed by GES produced in a single cell line. (A) Chemical space; (B) A549 biological space; (C) MCF7 biological space; (D) PC3 biological space. Points corresponding to DRD1 actives (n = 99) are red, DRD1 inactives (n = 1843) are blue, gray points have no available label concerning DRD1 activity.
NR3C1 actives compounds are mostly grouped together in the chemical space, as shown in Figure 3A (n = 54; mean Dice distance = 0.67). Most of NR3C1 active GESs are also grouped in a cluster in the A549 biological space (n = 38; mean cosine distance = 0.76), visible in Figure 3B, and remaining NR3C1 active GESs are spread across this biological space. Following the similarity principle, we could conjecture that other GESs that are close to this cluster are responses from other NR3C1 actives, especially in the PC3 biological space where the cluster contains compounds known to be active. The same phenomenon can be observed in the biological space of PC3 (Figure 3D), HCC515, HA1E and VCAP (data not shown). Surprisingly, the GES clusters populated by numerous known NR3C1 actives in the biological spaces of A549 and PC3 also contain some known inactive compounds. In the biological spaces of MCF7, A375 and HT29, there is no such clustering, like shown in Figure 3C representing the MCF7 biological space (n = 54; mean cosine distance = 0.92). Overall, these results show that compounds that are known to be active on the NR3C1 target can show a similar response in only certain cellular contexts.
TUBB actives compounds are spread in the chemical space (represented in Figure 4A), indicating that they have diverse chemical structures (n = 51; mean Dice distance = 0.76). Most importantly, in each cell lines used in this work, GESs induced by TUBB actives compounds were similar (as illustrated in Figures 4B–D), with a rather low mean cosine distance between active compounds ranging between 0.61 and 0.75 depending on the cell line dataset. Moreover, GESs of TUBB actives tend to be similar across all cell lines used in this work (highlighted in Supplementary Figure 1). This conserved pattern in GESs induced by tubulin binding compounds likely illustrate certainly the ubiquitous role of tubulin polymerization of the eukaryotic cytoskeleton (Chaaban and Brouhard, 2017).
Finally, DRD1 actives compounds, that are represented in the chemical space t-SNE, have diverse chemical structures (n = 99; mean Dice distance = 0.81), associated with diverse GESs for the 3 cell lines presented (mean cosine distance between 0.88 and 0.92 depending on the cell line), as illustrated in Figures 5A–D. Since GESs of active compounds in any cell lines are not similar, nor their chemical structures, actives cannot be easily discriminated from inactives using these two types of descriptors, as opposed to what was observed with NR3C1 actives that have similar structures, or TUBB actives having similar GESs in every cell line used in this study.
Model Performances: GES Vs. Morgan Fingerprints
Based on the observed GES similarity of compounds sharing target activity in appropriate cellular contexts, we tested building predictive machine learning models using GESs as descriptors and compare their performances with the ones of the models using Morgan fingerprints.
In order to avoid building models with too unbalanced datasets and to ensure a minimum of active compounds when testing model performances, we first pre-selected targets having at least 50 active compounds in the total dataset (representing between 1 and 63% of active compounds per target). We obtained one dataset per cell line—target combination (restricted to compounds having signatures in the considered cell line, as shown in Figure 1) and carried out a second selection by performing prediction tasks using datasets containing at least 20 active compounds for the considered target (representing between 1 and 69% of active compounds per dataset). For each selected cell line—target dataset, one model using GESs (referred as GES model) was computed. In order to perform a fair comparison per task, one counterpart model using corresponding compound Morgan fingerprints (referred as Morgan FP model) was built using the same set of compounds as the one used in the corresponding GES models. Performances of models were evaluated using the balanced accuracy (BA) metric on a test set, to account for class imbalance in datasets. In total, 990 models were built for a total of 69 different targets. BAs of all built models are presented in Table 3. MCC of all built models are presented in Supplementary Table 1.
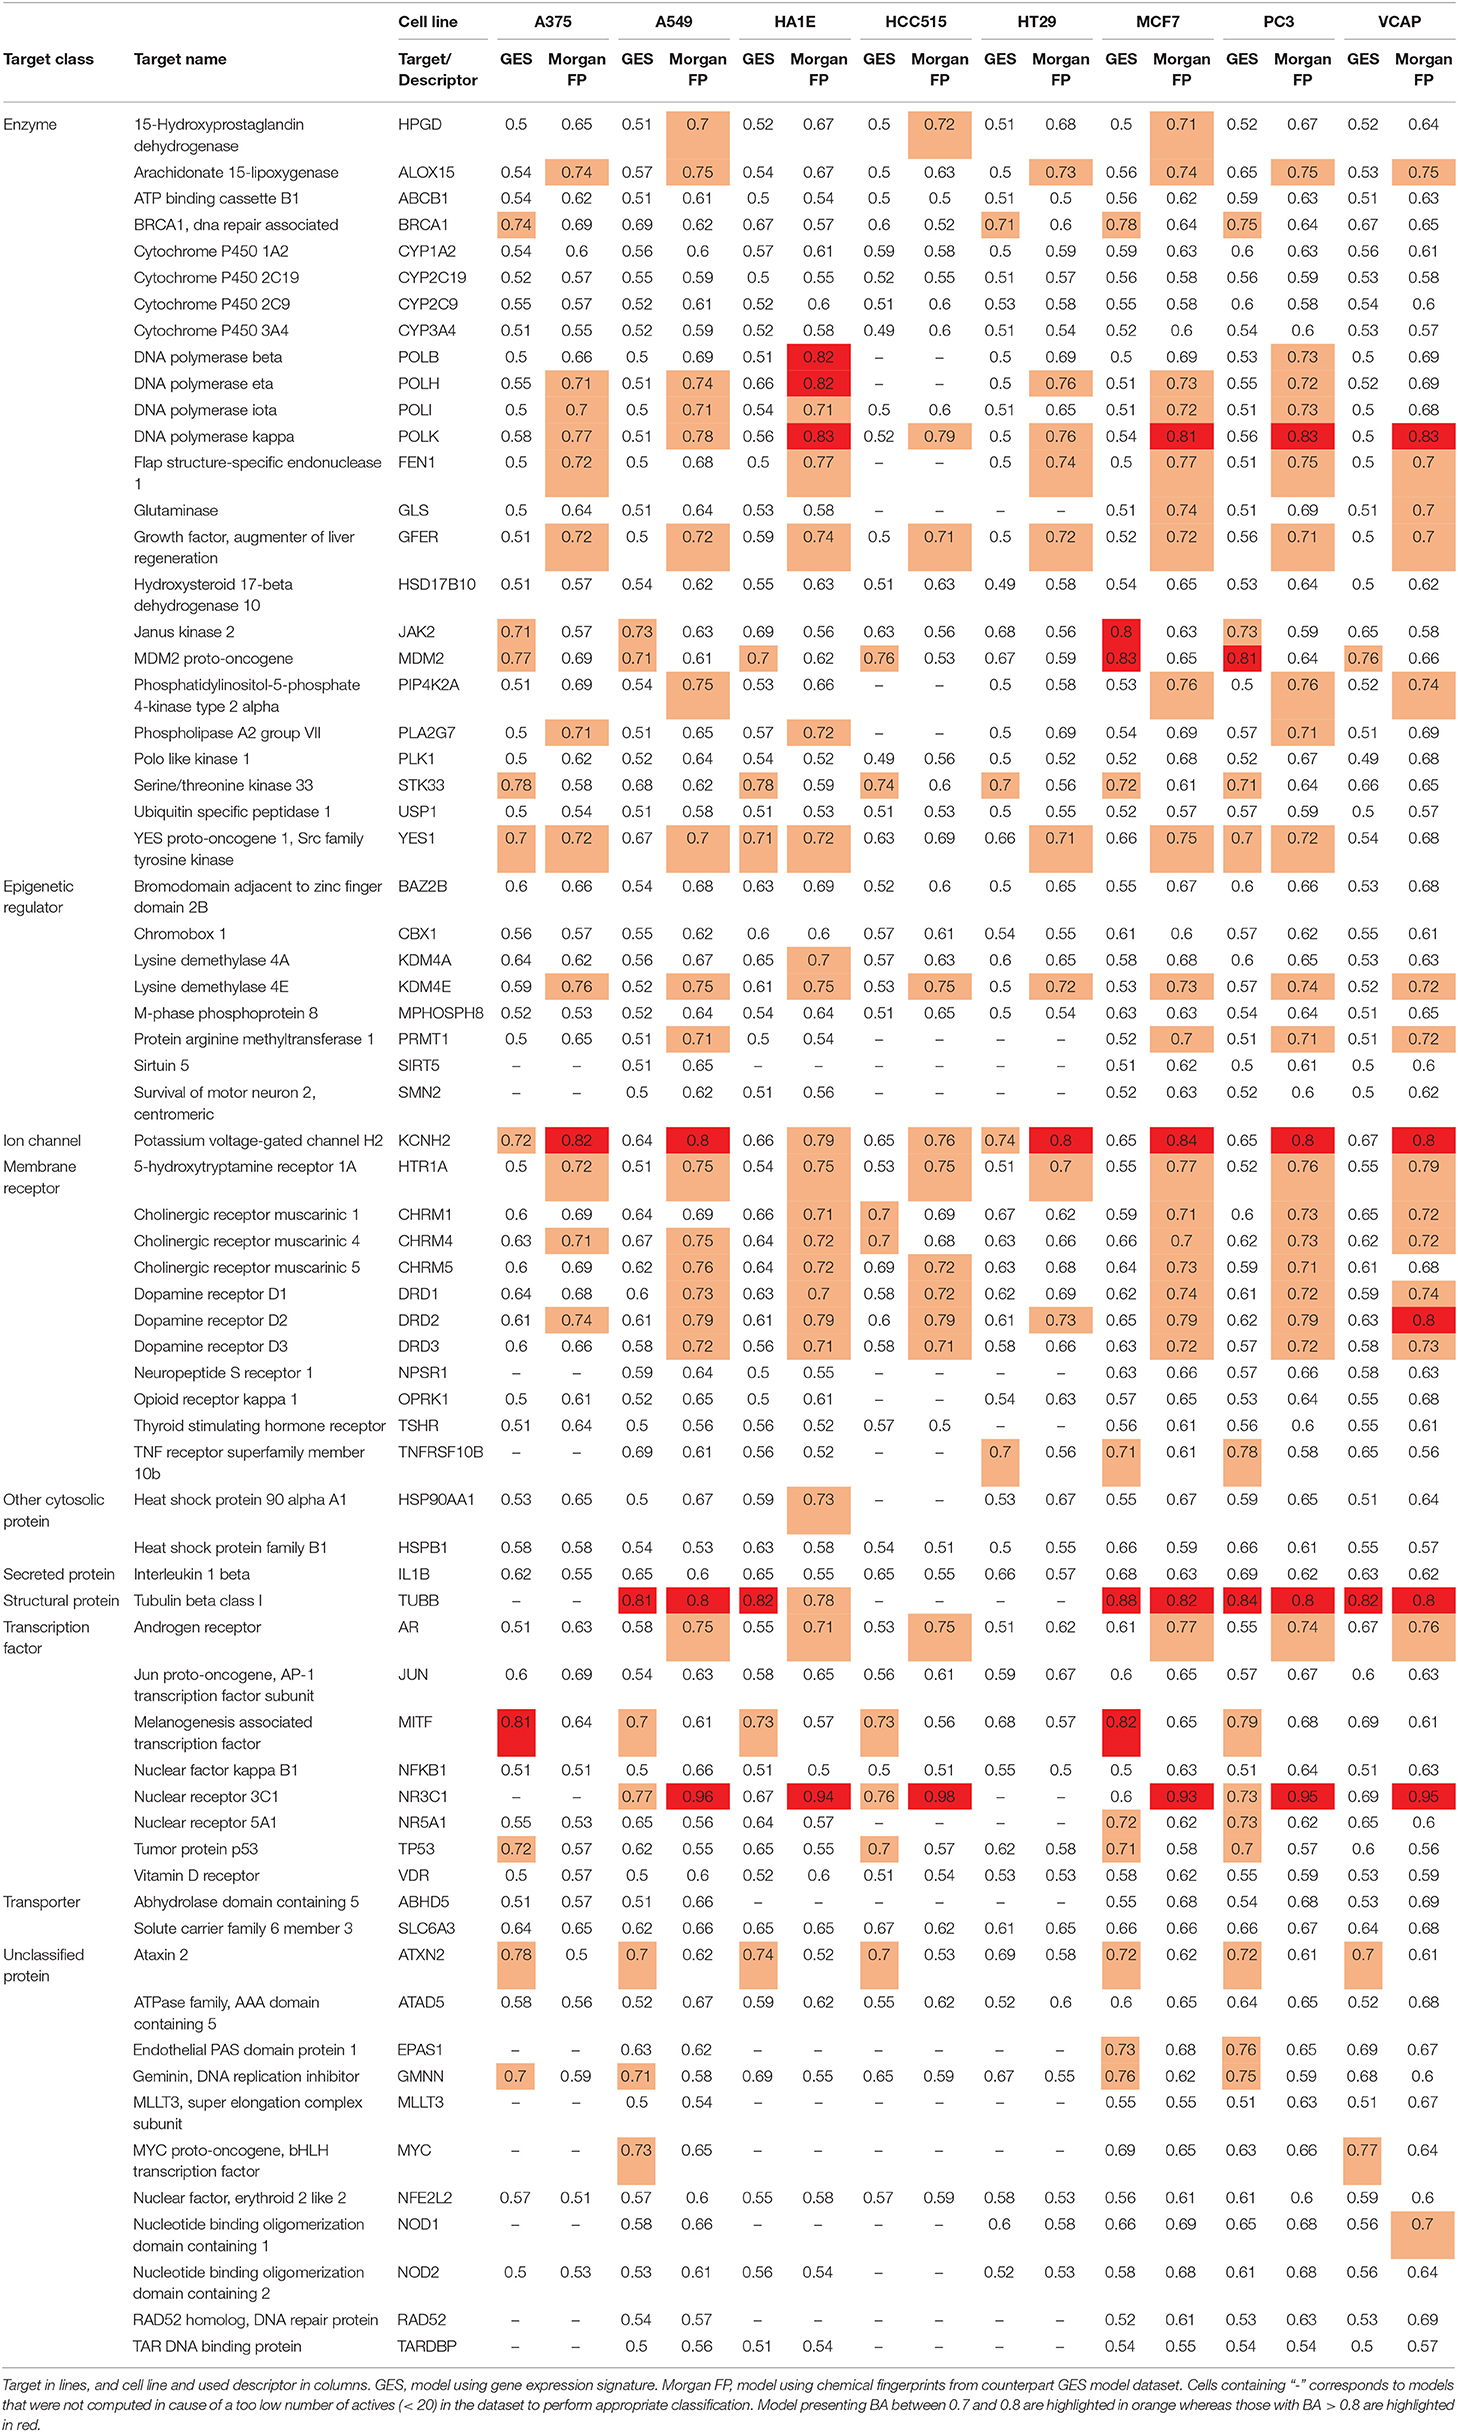
Table 3. Mean BAs of models (mean per condition).
Overall, GES model performances appeared to be variable depending on the predicted target and on the cell line that was used to generate the GESs, with a BA ranging from 0.49 to 0.88. Counterpart models trained with Morgan fingerprints also had variable performances, with a BA ranging from 0.50 to 0.98. On average, Morgan FP models (mean BA = 0.65) yielded better performances for the target activity prediction than their counterpart GES models (mean BA = 0.58). On the 495 cell line—target combinations, BA of GES models was higher than BA of counterpart Morgan FP models for 124 combinations (25%).
On the 990 models, 208 models reached a BA higher than 0.7 (21%) for 40 targets (59 GES models for 18 targets; 138 Morgan FP models for 28 targets), and 33 models reached a BA higher than 0.8 (3%) for 10 targets (10 GES models for 4 targets; 21 Morgan FP models for 7 targets). For all 138 Morgan FP models reaching BA higher than 0.7, BA was superior to counterpart GES models, and for the 59 GES models reaching BA higher than 0.7, only 6 had counterpart Morgan FP model with higher BA.
For NR3C1 activity prediction, Morgan FP models yielded a BA between 0.93 and 0.98 depending on the cell line dataset. It is not surprising considering that that NR3C1 actives have similar structure as shown in Figure 3A. On the GES models, a BA of 0.77 was reached using the A549 signature dataset, correlating to similar GESs that were observed in the A549 biological space (Figure 3B), whereas a BA of 0.6 was obtained using the MCF7 signature dataset (no GES cluster in MCF7 biological space, shown in Figure 3C). A549 and MCF7 signature model performances cannot be fairly compared because they were built using different sets of compounds. In fact, performances of different GES models cannot be compared across cell lines nor across targets, performances can only be compared to observed similarity between active compounds in either chemical and biological space plots for a given target.
For TUBB activity prediction, GES models yielded BA between 0.81 and 0.88 depending on the cell line dataset, which was among the 10 best GES models. Interestingly, their counterpart Morgan FP models were not significantly underperforming (BA ranging from 0.78 to 0.82). Even though the TUBB active structures are diverse, the models still managed to identify structural fragments that could produce such predictive performance.
For DRD1 activity prediction, Morgan FP models yielded BA between 0.68 and 0.74 depending on the cell line dataset, and were always better than their counterpart GES model, with a BA ranging from 0.58 to 0.64.
Overall, we conclude that it was possible to build GES models with acceptable performances, performing similarly or better than their counterpart Morgan FP models in 25% of the target prediction tasks. Moreover, we see an important advantage in the GES models: they are theoretically performing independently of the chemical space considered, allowing target identification of new compounds even if their corresponding structural diversity is not represented in the training set.
Rationalizing Model Performances Using Distance Plots
To further describe and understand the reasons for the differences in performances between GES model and Morgan FP model, for every dataset used in each cell line—target combinations, Morgan fingerprints Dice distance was plotted against GES cosine distance between each pair of active compounds in the given dataset.
Generated distance plots were split in 4 quadrants separated by a 0.5 threshold for Dice distance (dotted vertical line) and a 0.5 threshold for cosine distance (dotted horizontal line). Data points in top right (Quadrant I) represent pairs of active compounds showing diverse structures and different GESs in the considered cell line and contains most of compound pairs (average of 95.1%). Data points in top left (Quadrant II) represent pairs of active compounds showing similar structures while showing diverse GESs in the considered cell line (average of 1.9%). Data points in bottom left (Quadrant III) represents pairs of active compounds showing similar structures and similar GESs in the considered cell line and contains least compound pairs (average of 0.5%). Data points in bottom right (Quadrant IV) represents pairs of active compounds showing similar GESs while having different structures (average of 2.5%). Intuitively, we think that sample similarity within the same class (here: actives) is a good indicator to know if a machine learning model will be able to properly predict samples from this class.
Overall, the mean percentage of compound pairs (active and inactives) were 99.3, 0.3, 0.01 and 0.4% for quadrants I, II, III and IV respectively. Based on this dataset, compounds active toward a molecular target have on average more similar structures and GESs than the totality of the compounds.
We expected to reach good Morgan FP model prediction for combinations having a high proportion of points in quadrants II and III (similar structures), and good GES model prediction for combinations having a high proportion of points in quadrants III and IV (similar GESs). We evaluated the use of distance plots on the three targets and three cell lines used in previous space plots (Figures 3, 5). Similar work was performed using not only active compounds, but all compounds having at least one annotation for each of the three previously described targets, shown in Supplementary Figure 2.
For NR3C1 distance plots, there are approximately 10% of compound pairs in quadrants II and III of the 3 plots (Figures 6A–C), coherent with good Morgan FP model performances. However, depending on which cell line the GESs were generated from, there were different proportions of compound pairs in quadrants III and IV: there are 20% of pairs for A549, and only 1% of pairs in MCF7. This is in agreement with what was observed in model performances: performance of GES models using the A549 dataset (BA = 0.77) was much better than performances using MCF7 dataset (BA = 0.60). Surprisingly, prediction using GESs from the PC3 dataset showed good performances (BA = 0.73), even though the proportion of active compound pairs in quadrants III and IV was around 1% (similar to the proportion observed for the MCF7 dataset that showed worse performances). This suggests that the GES model built with PC3 was able to capture a subset of genes to discriminate active compounds from inactives, even with active compounds showing different GESs.
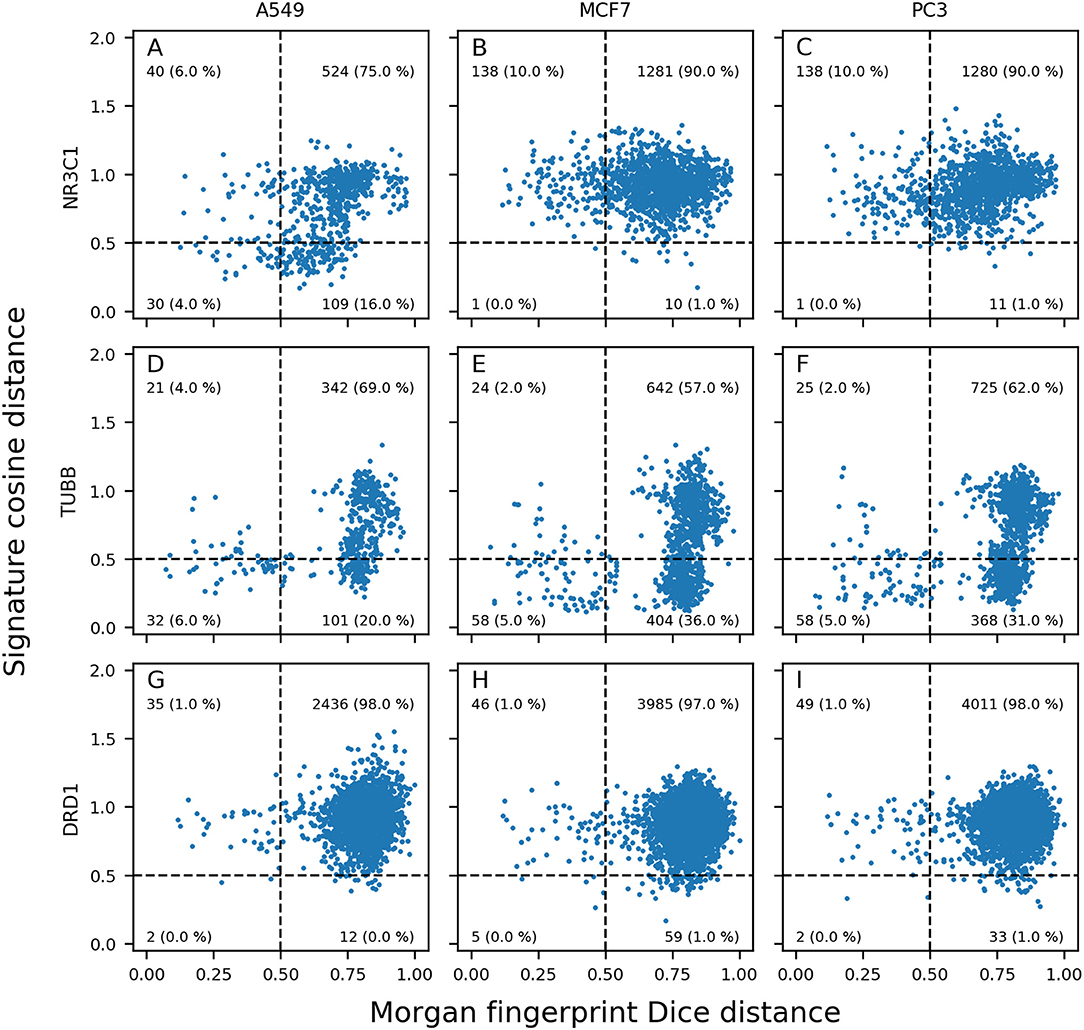
Figure 6. Morgan fingerprints Dice distance vs. GES cosine distance (distance plots). Different panels show information for pairs of NR3C1 (A–C), TUBB (D–F), and DRD1 (G–I); active compounds in A549 (A,D,G), MCF7 (B,E,H), and PC3 (C,F,I) cell lines.
For TUBB distance plots (Figures 6D–F), between 7 and 10% of compound pairs was observed in quadrants II and III, matching the good Morgan FP model performances with the 3 cell line datasets (BA ranging from 0.80 to 0.82). Most importantly, there are between 26 and 40% of compound pairs in quadrants III and IV, echoing the better performances of the GES models in these cell lines (BA ranging from 0.81 to 0.88).
For DRD1 distance plots (Figures 6G–I), 98% of compound pairs are in quadrant I, leaving low number of active compound pairs in the other quadrants (with similar Morgan fingerprints and/or GESs). This is coherent with the average performances of GES (BA ranging from 0.68 to 0.74) and Morgan FP models (BA ranging from 0.58 to 0.64) built for this target.
Among the 50 best GES models, the mean percentage of active pairs in quadrants III and IV was 5.2% (vs. 2.3% in quadrants II and III). For the 50 best Morgan FP models, the mean percentage of active pairs in quadrants II and III was 4.0% (vs. 2.2% in quadrants III and IV). This suggests a positive relationship between sample similarity between active compounds using a given set of descriptors for active compounds and performances of models using these descriptors.
In the current work, GESs were shown to be effective descriptors to predict compound activity toward molecular targets. In 25% of target prediction tasks, GES models outperformed their counterpart Morgan FP models, especially when using GES produced in a cell line exhibiting similar GESs between compounds active toward the target of interest. Such GES models performs independently of the structural diversity of compounds that were used to produce GESs, offering a great opportunity to escape the classical chemical space limitations associated with QSAR models. In addition, t-SNE plots, along with 2D distance plots, can give insights to assess the predictive power of GESs and Morgan fingerprints for target prediction, based on a limited dataset depending on biological (GES and bioactivity assay) data availability.
Discussion
Our results show that compound-induced transcriptomic responses derived from cell lines have the potential to support target prediction of unknown compounds with large structural diversity. Interestingly, we observed that compound induced biological responses are mostly cell line specific even when cell lines are derived from the same tissue. Nevertheless, machine learning models using GESs were shown to perform well as long as the appropriate cell line was used. Exploring biological spaces can help to overcome the limitations derived from a restricted chemical space when using traditional QSAR. To improve the predictivity of GES models, we have identified several limitations, and discuss possible improvements.
Data Acquisition
First limitations come from gene expression data preprocessing. Gene expression values were obtained through multiple preprocessing steps from the initial generated raw data. For instance, there is a first peak deconvolution step to determine the gene expression levels, that as well as the plate-normalized z-scoring to obtain the normalized (“Level 5”) can still be improved as already stated by Li et al. (2017). Using GESs obtained with different preprocessing methods could potentially give more accurate normalized values leading to increased performances in machine learning models.
Secondly, the CMAP L1000 technology relies on the measurement of 978 landmark genes, representing about 5% of the human transcriptome (Pertea, 2012). The gene values of the remaining transcriptome can be inferred through different computational methods (Subramanian et al. (2017) method reached good prediction for 81% of inferred genes), that are still under improvement (Blasco et al., 2019). We decided to only use the 978 landmarks as input data for the machine models generated, to reflect real measured gene expression. Doing so, we might have missed some valuable information captured by a change of expression of the non-measured genes. Therefore, it would be interesting to explore the potential added value of expanding the number of descriptors by adding the inferred gene information to the target prediction models.
Data Restrictions
Another limitation is also coming with the activity dataset that was used. Since compound activity is a selective interaction, there is for each target a low number of active compounds compared to the number of inactive compounds. As a consequence, the training sets used for model building were highly unbalanced favorizing the prediction of the category inactive. Moreover, not every compound was tested for activity in all targets, leading to a sparse dataset (5% of total compound target interactions are known).
On top of this activity data limitation, not all available compounds were profiled in all the 8 cell lines used in this work. There were only about 600 compounds profiled in all the cell lines, which is too limited to build predictive models, with regard to available activity data. Consequently, one dataset per cell line was created, formed by compounds profiled in this cell line and resulting GESs. For each target prediction, the cell line datasets were restricted to compounds having a known label for the target of interest. Since each task used a different dataset, performances of models across cell lines or targets the comparison across GES models was not possible. The difference in dataset sizes is explaining at least partly the variation of performances of GES models across targets, ranging from models close to a random predictor (BA = 0.50) to good GES models (BA = 0.88), as well as the variation of performances of counterpart Morgan FP models (BA ranging from 0.50 to 0.98).
Biological Response Constraints
Biologically, variation of GES model performances can also be caused by the difference in the pathway representation in the cell lines and consequently to compound induced signatures. Compounds active on a given target might show GESs with different degree of similarity or no similarity among the considered cell lines. as illustrated by the cases of NR3C1, TUBB and DRD1. Gene expression responses depend on the cellular context as shown in this work and elsewhere (Chen et al., 2013; Yu et al., 2019). Thus, the biological system in which the GESs are generated is of utmost importance for target prediction.
Due to practical aspects (scalability, low price, etc.), biological systems such as in vitro immortalized cell cultures (like cancer cell lines used in this work) are widely used, but they come with some disadvantages: they show limited physiological representativity and have been shown to drift along passages (Hughes et al., 2007). Even within the same cell line, it was shown that strains show different responses to the same compounds, indicating a reduced reproducibility between generated GESs (Ben-David et al., 2018). Ideally, the GESs should be derived from biological systems mimicking as much as possible the biological responses observed in the corresponding target organ.
The advantage of transcriptomic evaluations over single endpoint assays is that in theory they have the potential to capture integrative responses from compound treatments, ranging from on target activity at high potency to off-target activities at lower potencies, depending on the tested concentrations. GESs responses are also known to be variable depending on time exposition (Aguayo-Orozco et al., 2018). That is the reason why we selected data sets originating from the same study design. GESs measured at a concentration of 10 μM after 24 h of treatment of the cell lines were extracted, as this is the most represented experimental condition (De Wolf et al., 2016; Lv et al., 2017).
GES Models Versus Morgan FP Models
We showed that using GES datasets produced by the Broad Institute with the CMAP L1000 technique (Subramanian et al., 2017), random forest models outperformed counterpart Morgan FP models for target prediction in 25% of the cases. Evidently, the outcome of this comparison is depending on the available data for the different targets to build the models as illustrated by the wide range of differences of BA between the two types of predictive models. Practically, both QSAR and transcriptomic descriptors represent good opportunities for target prediction, but each come with advantages and constraints that needs to be considered when building predictive models.
QSAR models for target prediction are widely used because of the wide dataset available, with existing databases like PubChem or ChEMBL. Most QSAR descriptors are discrete unambiguous values extracted from the chemical formula of compounds, thus easily computed. In the context of hit discovery, a major drawback of QSAR models is that they show significant error rate when trying to predict activity for compounds that are too structurally different from the training set (Cherkasov et al., 2014). Using a new set of descriptors, like compound bioactivity such as GESs extracted from in vitro experiments, can help in target prediction while escaping from the classical chemical space limitation observed in QSAR approaches.
On the other hand, GESs represents a number of changes on a certain number of genes (the 978 landmarks), capturing the effect of compounds. These data could be used to make inference about biology (i.e., finding targets or biomarkers). Each cell line shows a unique biological space that can be explored. However, these biological experiment data are prone to technical and biological variability like discussed earlier. Gene expression can be measured in different dose and time conditions, adding dimensions to explore in order to find the conditions reaching best performances in GES models. Finally, the gene expression measurements are more and more cost effective, making the use of such data at a large scale possible.
When exploring a new chemical class in hit discovery, evaluating chemical-induced biological responses in appropriate cell-lines using transcriptomic profiling can support chemical prioritization. This biologically-based approach present the advantage in a given biological space of being in principle chemical space independent as opposed to QSAR modeling that is constrained by the chemical space of the training set. Furthermore, during lead optimization, biological spaces inform about the direct activity of candidates, which can help fine-tuning their desired activity profile, by optimizing the on-target activity. It has been recently shown that this type of data can be used for de novo chemical design fulfilling a specific GES (Méndez-Lucio et al., 2020). In a chemical safety approach, it can be used to detect compound interaction with off-targets. However, a difference between these 2 applications would be the conditions in which the GESs are generated: on-target effects are observable at low concentrations (Kd often in the nanomolar range), while off-target effect are known to typically appear at higher concentration as illustrated by Li et al. (2019).
In conclusion, in this work, we evaluated the use of a large public dataset of compound-induced transcriptomic data, to predict compound activity on 69 molecular targets. We compared machine learning models built with transcriptomics data with counterpart models built using Morgan fingerprints. Active compounds on a given target could exhibit similar signatures in one or multiple cell lines, independent from the chemical structure similarity between these active compounds. For 25% of the tasks, random forest models using transcriptomics signatures performed similarly or better than counterpart models built with Morgan fingerprints, occurring mostly using signatures produced in cell lines that showed similar signatures for active compounds on a given target. Compound-induced transcriptomic data could offer a great opportunity for target prediction based on cell response similarity and allows to circumvent the applicability domain limitation of QSAR models.
Data Availability Statement
Publicly available datasets were analyzed in this study. This data can be found in the Gene Expression Omnibus https://www.ncbi.nlm.nih.gov/gds (GEO IDs GSE92742 and GSE70138).
Author Contributions
BB, OM-L, and DR contributed to the conception of the work. BB performed the workflow with the help of OM-L. BB wrote the first draft of the manuscript. JW, OM-L, and DR provided guidance and helped with the manuscript preparation and contributed to manuscript revision, read and approved the submitted version. DR and OM-L wrote sections of the manuscript.
Conflict of Interest
JW is employee of Bayer AG. OM-L, BB, and DR work directly or indirectly for Bayer SAS.
Acknowledgments
Authors thank Karen Tilmant for proof reading the text and for her useful comments. We are also grateful to Arwa Al-Dilaimi, Djork-Arne Clevert and Angela Becker for supporting the project and for insightful discussions.
Supplementary Material
The Supplementary Material for this article can be found online at: https://www.frontiersin.org/articles/10.3389/fchem.2020.00296/full#supplementary-material
References
Aguayo-Orozco, A., Bois, F. Y., Brunak, S., and Taboureau, O. (2018). Analysis of time-series gene expression data to explore mechanisms of chemical-induced hepatic steatosis toxicity. Front. Genet. 9:396. doi: 10.3389/fgene.2018.00396
Aliper, A., Plis, S., Artemov, A., Ulloa, A., Mamoshina, P., and Zhavoronkov, A. (2016). Deep learning applications for predicting pharmacological properties of drugs and drug repurposing using transcriptomic data. Mol. Pharm. 13, 2524–2530. doi: 10.1021/acs.molpharmaceut.6b00248
Ben-David, U., Siranosian, B., Ha, G., Tang, H., Oren, Y., Hinohara, K., et al. (2018). Genetic and transcriptional evolution alters cancer cell line drug response. Nature 560, 325–330. doi: 10.1038/s41586-018-0409-3
Blasco, A., Endres, M. G., Sergeev, R. A., Jonchhe, A., Macaluso, N. J. M., Narayan, R., et al. (2019). Advancing computational biology and bioinformatics research through open innovation competitions. PLoS ONE 14:e0222165. doi: 10.1371/journal.pone.0222165
Chaaban, S., and Brouhard, G. J. (2017). A microtubule bestiary: structural diversity in tubulin polymers. Mol. Biol. Cell 28, 2924–2931. doi: 10.1091/mbc.E16-05-0271
Chen, M., Xiao, J., Zhang, Z., Liu, J., Wu, J., and Yu, J. (2013). Identification of human HK genes and gene expression regulation study in cancer from transcriptomics data analysis. PLoS ONE 8:e54082. doi: 10.1371/journal.pone.0054082
Chen, X., Yan, C. C., Zhang, X., Zhang, X., Dai, F., Yin, J., et al. (2016). Drug-target interaction prediction: databases, web servers and computational models. Brief Bioinform. 17, 696–712. doi: 10.1093/bib/bbv066
Cherkasov, A., Muratov, E. N., Fourches, D., Varnek, A., Baskin, I. I., Cronin, M., et al. (2014). QSAR modeling: where have you been? where are you going to?. J. Med. Chem. 57, 4977–5010. doi: 10.1021/jm4004285
Corsello, S. M., Bittker, J. A., Liu, Z., Gould, J., McCarren, P., Hirschman, J. E., et al. (2017). The drug repurposing hub: a next-generation drug library and information resource. Nat. Med. 23, 405–408. doi: 10.1038/nm.4306
Cruz-Monteagudo, M., Medina-Franco, J. L., Pérez-Castillo, Y., Nicolotti, O., Cordeiro, M. N. D. S., and Borges, F. (2014). Activity cliffs in drug discovery: Dr Jekyll or Mr Hyde? Drug Discov. Today 19, 109–1080. doi: 10.1016/j.drudis.2014.02.003
De Wolf, H., Cougnaud, L., Van Hoorde, K., De Bondt, A., Wegner, J. K., Ceulemans, H., et al. (2018). High-throughput gene expression profiles to define drug similarity and predict compound activity. Assay Drug Dev. Technol. 16, 162–176. doi: 10.1089/adt.2018.845
De Wolf, H., De Bondt, A., Turner, H., and Göhlmann, H. W. H. (2016). Transcriptional characterization of compounds: lessons learned from the public LINCS data. Assay Drug Dev. Technol. 14, 252–260. doi: 10.1089/adt.2016.715
Hanahan, D., and Weinberg, R. A. (2011). Hallmarks of cancer: the next generation. Cell 144, 646–674. doi: 10.1016/j.cell.2011.02.013
Hieronymus, H., Lamb, J., Ross, K. N., Peng, X. P., Clement, C., Rodina, A., et al. (2006). Gene expression signature-based chemical genomic prediction identifies a novel class of HSP90 pathway modulators. Cancer Cell 10, 321–330. doi: 10.1016/j.ccr.2006.09.005
Hofmarcher, M., Rumetshofer, E., Clevert, D. A., Hochreiter, S., and Klambauer, G. (2019). Accurate prediction of biological assays with high-throughput microscopy images and convolutional networks. J. Chem. Inf. Model 59, 1163–1171. doi: 10.1021/acs.jcim.8b00670
Hughes, P., Marshall, D., Reid, Y., Parkes, H., and Gelber, C. (2007). The costs of using unauthenticated, over-passaged cell lines: how much more data do we need? BioTechniques. 43, 575, 577–578, 581–582. doi: 10.2144/000112598
Hughes, T. R., Marton, M. J., Jones, A. R., Roberts, C. J., Stoughton, R., Armour, C. D., et al. (2000). Functional discovery via a compendium of expression profiles. Cell 102, 109–126. doi: 10.1016/S0092-8674(00)00015-5
Kuthuru, S., Szafran, A. T., Stossi, F., Mancini, M. A., and Rao, A. (2019). Leveraging image-derived phenotypic measurements for drug-target interaction predictions. Cancer Inform. 18:1176935119856595. doi: 10.1177/1176935119856595
Lamb, J., Crawford, E. D., Peck, D., Modell, J. W., Blat, I. C., Wrobel, M. J., et al. (2006). The connectivity map: using gene-expression signatures to connect small molecules, genes, and disease. Science 313, 1929–1935. doi: 10.1126/science.1132939
Lapins, M., and Spjuth, O. (2019). Evaluation of gene expression and phenotypic profiling data as quantitative descriptors for predicting drug targets and mechanisms of action. Biorxiv. doi: 10.1101/580654. [Epub ahead of print].
Laufkötter, O., Sturm, N., Bajorath, J., Chen, H., and Engkvist, O. (2019). Combining structural and bioactivity-based fingerprints improves prediction performance and scaffold hopping capability. J. Cheminform. 11:54. doi: 10.1186/s13321-019-0376-1
Lee, H., Kang, S., and Kim, W. (2016). Drug repositioning for cancer therapy based on large-scale drug-induced transcriptional signatures. PLoS ONE 11:e0150460. doi: 10.1371/journal.pone.0150460
Li, A., Lu, X., Natoli, T., Bittker, J., Sipes, N. S., Subramanian, A., et al. (2019). The carcinogenome project: in vitro gene expression profiling of chemical perturbations to predict long-term carcinogenicity. Environ. Health Perspect. 127:47002. doi: 10.1289/EHP3986
Li, Z., Li, J., and Yu, P. (2017). l1kdeconv: an R package for peak calling analysis with LINCS L1000 data. BMC Bioinformatics 18:356. doi: 10.1186/s12859-017-1767-9
Lv, C., Wu, X., Wang, X., Su, J., Zeng, H., Zhao, J., et al. (2017). The gene expression profiles in response to 102 traditional Chinese medicine (TCM) components: a general template for research on TCMs. Sci. Rep. 7:352. doi: 10.1038/s41598-017-00535-8
Méndez-Lucio, O., Baillif, B., Clevert, D. A., Rouquié, D., and Wichard, J. (2020). De novo generation of hit-like molecules from gene expression signatures using artificial intelligence. Nat. Commun. 11:10. doi: 10.1038/s41467-019-13807-w
Pabon, N. A., Xia, Y., Estabrooks, S. K., Ye, Z., Herbrand, A. K., Süß, E., et al. (2018). Predicting protein targets for drug-like compounds using transcriptomics. PLoS Comput. Biol. 14:e1006651. doi: 10.1371/journal.pcbi.1006651
Pedregosa, F., Varoquaux, G., Gramfort, A., Michel, V., Thirion, B., Grisel, O., et al. (2011). Scikit-learn: machine learning in python. J. Mach. Learn. Res. 12, 2825–2830. Available online at: http://jmlr.org/papers/v12/pedregosa11a.html
Pertea, M. (2012). The human transcriptome: an unfinished story. Genes 3, 344–360. doi: 10.3390/genes3030344
Petrone, P. M., Simms, B., Nigsch, F., Lounkine, E., Kutchukian, P., Cornett, A., et al. (2012). Rethinking molecular similarity: Comparing compounds on the basis of biological activity. ACS Chem. Biol. 7, 1399–1409. doi: 10.1021/cb3001028
Rogers, D., and Hahn, M. (2010). Extended-connectivity fingerprints. J. Chem. Inf. Model. 50, 742–754. doi: 10.1021/ci100050t
Rouquié, D., Heneweer, M., Botham, J., Ketelslegers, H., Markell, L., Pfister, T., et al. (2015). Contribution of new technologies to characterization and prediction of adverse effects. Crit. Rev. Toxicol. 45, 172–183. doi: 10.3109/10408444.2014.986054
Scheeder, C., Heigwer, F., and Boutros, M. (2018). Machine learning and image-based profiling in drug discovery. Curr. Opin. Syst. Biol. 10, 43–52. doi: 10.1016/j.coisb.2018.05.004
Simm, J., Klambauer, G., Arany, A., Steijaert, M., Wegner, J. K., Gustin, E., et al. (2018). Repurposing high-throughput image assays enables biological activity prediction for drug discovery. Cell Chem. Biol. 25, 611-618. doi: 10.1016/j.chembiol.2018.01.015
Subramanian, A., Narayan, R., Corsello, S. M., Peck, D. D., Natoli, T. E., Lu, X., et al. (2017). A Next Generation Connectivity Map: L1000 Platform and the First 1,000,000 Profiles. Cell 171, 1437–1452 e17. doi: 10.1016/j.cell.2017.10.049
Vamathevan, J., Clark, D., Czodrowski, P., Dunham, I., Ferran, E., Lee, G., et al. (2019). Applications of machine learning in drug discovery and development. Nat. Rev. Drug Discov. 18, 463–477. doi: 10.1038/s41573-019-0024-5
Van Der Maaten, L., and Hinton, G. (2008). Visualizing data using t-SNE. J. Mach. Learn. Res. 9, 2579–2605. Available online at: http://www.jmlr.org/papers/v9/vandermaaten08a.html
Wang, Y., Suzek, T., Zhang, J., Wang, J., He, S., Cheng, T., et al. (2014). PubChem Bioassay: 2014 update. Nucleic Acids Res. 1, D1075–D1082. doi: 10.1093/nar/gkt978
Wei, G., Twomey, D., Lamb, J., Schlis, K., Agarwal, J., Stam, R. W., et al. (2006). Gene expression-based chemical genomics identifies rapamycin as a modulator of MCL1 and glucocorticoid resistance. Cancer Cell 10, 331–342. doi: 10.1016/j.ccr.2006.09.006
Keywords: target prediction, compound-induced transcriptomic data, QSAR, machine learning, cellular context
Citation: Baillif B, Wichard J, Méndez-Lucio O and Rouquié D (2020) Exploring the Use of Compound-Induced Transcriptomic Data Generated From Cell Lines to Predict Compound Activity Toward Molecular Targets. Front. Chem. 8:296. doi: 10.3389/fchem.2020.00296
Received: 02 December 2019; Accepted: 25 March 2020;
Published: 23 April 2020.
Edited by:
Kamil Kuca, University of Hradec Králové, CzechiaReviewed by:
Chanin Nantasenamat, Mahidol University, ThailandRajeev K. Singla, West China Hospital, Sichuan University, China
Copyright © 2020 Baillif, Wichard, Méndez-Lucio and Rouquié. This is an open-access article distributed under the terms of the Creative Commons Attribution License (CC BY). The use, distribution or reproduction in other forums is permitted, provided the original author(s) and the copyright owner(s) are credited and that the original publication in this journal is cited, in accordance with accepted academic practice. No use, distribution or reproduction is permitted which does not comply with these terms.
*Correspondence: David Rouquié, david.rouquie@bayer.com
†These authors jointly supervised this work