Transcriptomic Profiling of High-Density Giardia Foci Encysting in the Murine Proximal Intestine
 Jonathan K. Pham1
  Christopher Nosala1
  Erica Y. Scott2
  Kristofer F. Nguyen1
  Kari D. Hagen1
  Hannah N. Starcevich1
  Scott C. Dawson1*
- 1Department of Microbiology and Molecular Genetics, University of California, Davis, Davis, CA, United States
- 2Department of Animal Science, University of California, Davis, Davis, CA, United States
Giardia is a highly prevalent, understudied protistan parasite causing significant diarrheal disease worldwide. Its life cycle consists of two stages: infectious cysts ingested from contaminated food or water sources, and motile trophozoites that colonize and attach to the gut epithelium, later encysting to form new cysts that are excreted into the environment. Current understanding of parasite physiology in the host is largely inferred from transcriptomic studies using Giardia grown axenically or in co-culture with mammalian cell lines. The dearth of information about the diversity of host-parasite interactions occurring within distinct regions of the gastrointestinal tract has been exacerbated by a lack of methods to directly and non-invasively interrogate disease progression and parasite physiology in live animal hosts. By visualizing Giardia infections in the mouse gastrointestinal tract using bioluminescent imaging (BLI) of tagged parasites, we recently showed that parasites colonize the gut in high-density foci. Encystation is initiated in these foci throughout the entire course of infection, yet how the physiology of parasites within high-density foci in the host gut differs from that of cells in laboratory culture is unclear. Here we use BLI to precisely select parasite samples from high-density foci in the proximal intestine to interrogate in vivo Giardia gene expression in the host. Relative to axenic culture, we noted significantly higher expression (>10-fold) of oxidative stress, membrane transporter, and metabolic and structural genes associated with encystation in the high-density foci. These differences in gene expression within parasite foci in the host may reflect physiological changes associated with high-density growth in localized regions of the gut. We also identified and verified six novel cyst-specific proteins, including new components of the cyst wall that were highly expressed in these foci. Our in vivo transcriptome data support an emerging view that parasites encyst early in localized regions in the gut, possibly as a consequence of nutrient limitation, and also impact local metabolism and physiology.
Introduction
Giardia lamblia is a zoonotic protozoan parasite that causes acute and chronic diarrheal disease, primarily in areas lacking adequate sanitation and water treatment (Savioli et al., 2006; Troeger et al., 2007), and commonly affects travelers and immunosuppressed individuals (Adam, 2001). Giardiasis is a serious disease of children, who may experience substantial morbidity including diarrhea, malnutrition, wasting, and developmental delay (Solaymani-Mohammadi and Singer, 2010; Bartelt et al., 2013; DuPont, 2013). New therapeutic treatments for this widespread and neglected diarrheal disease are needed as there are estimated failure rates of up to 20% for standard treatments (Upcroft and Upcroft, 2001) and reports of drug resistance (Upcroft et al., 1996; Barat and Bloland, 1997; Land and Johnson, 1999).
Giardiasis may be either acute and/or chronic, and infection is generally accompanied by abdominal cramps, gas, nausea, and weight loss. Giardiasis may also result in a severe form of malabsorptive diarrhea presenting as a fatty, watery stool (Nosala and Dawson, 2015). Trophozoites are not invasive and giardiasis does not produce a florid inflammatory response; however, giardiasis is associated with villus shortening, enterocyte apoptosis, hypermobility, and intestinal barrier dysfunction (Halliez and Buret, 2013). The mechanisms by which Giardia colonization of the gastrointestinal tract induces diarrheal disease remain unclear.
Giardia differentiates into two morphological forms during its life cycle: a motile, multi-flagellated trophozoite that colonizes the host small intestine, and an infective cyst that is shed into the environment (Heyworth, 2014). The Giardia cyst is characterized by four nuclei and a thick outer cell wall consisting of cyst wall proteins 1, 2, and 3 and a unique β-1,3- linked N-acetylgalactosamine homopolymer. Other components of the cyst include protein disulfide isomerases (Davids et al., 2004), high cysteine membrane proteins (HCMPs), and EGFP family proteins (Davids et al., 2006). The structure of the cyst wall allows cysts to persist in the environment until ingested by a compatible host (Gillin et al., 1989; Lujan et al., 1996, 1997; Lauwaet et al., 2007; Faso and Hehl, 2011). Following ingestion, cysts transform into motile trophozoites as they pass into the gastrointestinal tract. Trophozoites navigate the lumen of the small intestine and attach to the microvilli of the small intestine via the ventral disc, yet do not invade the epithelium (Adam, 2001). Attachment to the gut epithelium allows Giardia to resist peristaltic flow and proliferate in this low oxygen, nutrient rich environment. Encystation can be induced in vitro by increasing pH and decreasing cholesterol, or by increasing bile and lactic acid in the medium (Gillin et al., 1988, 1989; Lujan et al., 1997). However, cysts produced by in vitro methods tend to excyst less efficiently (Boucher and Gillin, 1990) and are less robust at establishing infections in animal models than cysts harvested directly from feces. Determining the additional factors required for robust differentiation to in vivo cysts is critical toward understanding in vivo host-parasite interactions associated with giardiasis (Morf et al., 2010; Faso et al., 2013; Sulemana et al., 2014).
The lack of accessibility to the gastrointestinal tract (Lujan et al., 1996, 1997, 1998) has limited our understanding of in situ Giardia physiology in the host. Parasite physiology and metabolism have been inferred from axenic laboratory culture in a non-defined medium (Keister, 1983) or from co-culture with intestinal epithelial cell lines (Inge et al., 1988; Lujan et al., 1996, 1998). However, co-incubation studies of trophozoites with intestinal cell lines may not accurately reflect in vivo parasite physiology. Giardia infects many mammalian hosts, and animal models of giardiasis include adult (Byrd et al., 1994; Singer, 2016) or suckling mice (Mayrhofer et al., 1992) or adult gerbils (Rivero et al., 2010) infected with either Giardia lamblia or G. muris isolates (Aggarwal and Nash, 1987). While the adult mouse model of giardiasis is commonly used to evaluate anti-giardial drugs (Miyamoto and Eckmann, 2015), previous in vivo parasite studies lack precision due to tissue sampling throughout the intestinal tracts of infected animals without corresponding knowledge of Giardia colonization.
Our recent development of methods for non-invasive imaging of bioluminescent Giardia parasites permits unprecedented access to real-time host-parasite interactions, allowing us to reexamine decades-old assumptions about Giardia infection and encystation dynamics in living hosts (Barash et al., 2017b). BLI enables sensitive quantification and live reporting of transcriptional activity with promoter-luciferase fusions (Weissleder and Ntziachristos, 2003; Welsh and Kay, 2005; Luo et al., 2006) and protein abundance and stability with protein-luciferase fusions (Stacer et al., 2013). BLI is used commonly to monitor parasitic infection dynamics during malaria, leishmaniasis, trypanosomiasis, and toxoplasmosis (Saeij et al., 2005; D'Archivio et al., 2013; Reimao et al., 2013), as well as bacterial colonization of the intestine (Hutchens and Luker, 2007). The use of imaging methods to evaluate in vivo giardiasis has allowed the precise longitudinal and spatial monitoring of the dynamics of infection, and provides an improved method to evaluate anti-giardial drugs in a relevant animal model of giardiasis.
Recently we used non-invasive imaging of bioluminescent Giardia parasites to evaluate real-time parasite physiology in the host, and confirmed early observations of G. muris and G. lamblia colonization of the proximal small intestine of mice (Owen et al., 1979), gerbils (Campbell and Faubert, 1994), and humans (Oberhuber et al., 1997). By imaging mice infected with Giardia expressing firefly luciferase under the control of encystation-specific promoters (Wiles et al., 2006; Hutchens and Luker, 2007; Andreu et al., 2011; Gourguechon and Cande, 2011; Rhee et al., 2011) we determined that encystation is initiated early in the course of infection and is correlated to high-density regions, or foci. These foci persist in the gastrointestinal tract throughout the course of infection.
Here we interrogate the in vivo physiology of high-density Giardia foci in the proximal small intestine and compare this to physiology in axenic culture. We also demonstrate that parasite metabolism in the foci is defined by the upregulation of encystation genes and of genes involved in oxidative stress responses. Furthermore, we observe that the expression profiles of encysting trophozoites in high-density foci are similar to profiles seen during mid-to-late encystation (7–22 h in in vitro encystation medium) (Einarsson et al., 2016). Finally, we identify and confirm six new encystation genes that are highly expressed in the foci.
Materials and Methods
Giardia Trophozoite and Encystation Culture Conditions
The G. lamblia (ATCC 50803) bioluminescent reporter PGDH-Fluc strain (Barash et al., 2017b) all C-terminal GFP-fusion strains, and the wild type WBC6 strain were cultured in modified TYDK medium (also known as TYI-S-33 or Keister's medium; Keister, 1983) supplemented with bovine bile and 5% adult and 5% fetal bovine serum (Trapnell et al., 2010) in sterile 16 ml screw-capped disposable tubes (BD Falcon), and incubated upright at 37°C without shaking. Encystation was induced in vitro by decanting TYDK medium from 24-h cultures (roughly 30% confluent) and replacing with encystation medium modified by the addition of 0.5 grams/liter bovine bile, pH 7.8 (Carpenter et al., 2012). After 24 h, cysts settled and were harvested for subsequent imaging analyses.
In vivo and Ex vivo Bioluminescence Imaging of Mice with Spatial Sampling of Giardia Colonization
Animal studies were performed with IACUC approval at the University of California, Davis (Scott C. Dawson, PI). Protocols for in vivo and ex vivo bioluminescence imaging of Giardia-infected mice were as previously described (Barash et al., 2017b). Specifically, four 8 week old, female C57BL/6J mice (Jackson Laboratories) were maintained on ad libitum water and alfalfa-free irradiated rodent pellets (Teklad 2918). Water was supplemented with 1 mg/ml ampicillin and neomycin (Teknova) for 5 days prior to infection (Solaymani-Mohammadi and Singer, 2011) to promote parasite colonization, and mice were maintained on antibiotics for the entire experiment. For infections, each animal was gavaged with 1 × 10⁷ G. lamblia PGDH-Fluc strain trophozoites in 100 μL phosphate-buffered saline (Barash et al., 2017b).
For non-invasive monitoring of parasite colonization using in vivo BLI, mice were sedated, D-luciferin (30 mg/kg) was then injected intraperitoneally, and bioluminescence was imaged using an IVIS Spectrum (PerkinElmer) with an open emission filter (Barash et al., 2017b). Photons were quantified using an ultra-sensitive CCD camera (IVIS Spectrum) and the resulting heat maps of bioluminescent photon emission intensity were overlaid on still images of anesthetized animals. To allow the D-luciferin to distribute throughout the body, images were collected with 2-min exposures constantly over 8–10 min until the bioluminescent signal stabilized. The exposure time for final image collection ranged from 2 to 5 min due to differences in the signal strength. Bioluminescence was quantified using LivingImage software to draw a region of interest (ROI) around each mouse, from front paws to anus. BLI data was quantified as total flux (photons/second) for exposure time-independent quantification of signal intensity.
To image the ex vivo spatial location and density of Giardia in the murine gastrointestinal tract, sedated mice were euthanized on days 3 or 7 post-gavage by cervical dislocation. The entire gastrointestinal tract was quickly dissected from esophagus to anus and positioned within a plastic Petri dish for ex vivo imaging using thirty second exposures (Barash et al., 2017b). ROI analysis was used to quantify bioluminescence (LivingImage). Total gastrointestinal tract signal was analyzed within a circle encompassing the entirety of the petri dish. The stomach, proximal SI (first half), distal SI (second half), cecum, and large intestine were traced using the free-hand tool and total flux was recorded as stated above (Supplemental Table 1). Spatial imaging of bioluminescence in the entire gastrointestinal tract specified the particular intestinal segments enriched for high-density Giardia foci of colonization. Small intestinal segments with such foci were excised for downstream RNA extraction and stored in RNAlater (Life Technologies) at −80°C, or alternatively, were fixed in 10% phosphate-buffered formalin for histology.
Histological sections of these intestinal samples were stained and visualized using light microscopy, confirming the presence of Giardia trophozoites in selected intestinal samples (Barash et al., 2017b). Protocols for preparation of histological slides were the same as those described in Chen et al. (2015) and were performed by the UC Davis Anatomic Pathology and IHC Laboratory (Davis, CA). Briefly, a subset of the excised bioluminescent intestinal samples was fixed in 10% phosphate-buffered formalin for 24 h. Specimens were dehydrated in a series of graded ethanol (70, 96, and 99%) and embedded in paraffin. Five-micron sections were cut perpendicular to the mucosa surface and the paraffin was cleared from the slides with coconut oil (over 15 min, 60°C). Sections were rehydrated in 99, 96, and 70% ethanol followed by a 10 min wash in water and stained with hematoxylin and eosin (HE). All HE slides were visualized via brightfield microscopy using a Leica DMI 6000 wide-field inverted fluorescence microscope with PlanApo 10X and 40X objectives.
Total RNA Extraction and RNA-Seq of Gastrointestinal Samples in Infected Animals
Total RNA was extracted by from Giardia-infected intestinal segments by resuspending the tissue in RNA STAT 60 solution (Tel-Test, Inc.) and repeatedly pipetting through a glass pipette until tissue homogenization was complete. All samples were kept on ice during tissue homogenization. Total RNA was purified by phenol-chloroform extraction and isopropanol precipitation. Poly(A) selection was performed for both the in vivo and in vitro samples with one microgram of total RNA. Illumina sequencing libraries were constructed and ribosomal RNA was depleted (UC Davis DNA Technologies Core Facility, Davis, CA) for downstream Illumina sequencing. 120–180 million 50 bp, single end reads were subsequently generated via Illumina sequencing (HiSeq 2500 system). All Giardia reads were submitted to the NCBI Sequence Read Archive (ID: SRP104997), with SRA accession numbers SRX2754297 to SRX2754300 for in vivo samples and SRX2754301 to SRX2754304 for in vitro samples.
Trimming and Processing of Transcriptome Sequences
Raw sequences were trimmed using the sliding window trimmer Sickle (Joshi and Fass, 2011). Two pipelines were used for mapping and transcript quantification (Figure 1D). First, the reads were mapped to the Giardia assemblage A genome (WBC6, release 5.0) using TopHat (version 2.0.14) (Trapnell et al., 2009). The TopHat output BAM files were processed and assembled into transcripts by Cufflinks (version 2.2.1) (Trapnell et al., 2010) and normalized to fragments per kilobase of transcript per million fragments mapped (FPKM, see Supplemental Table 2). Differentially expressed genes were identified using the Cuffdiff function of the Cufflinks package (version 2.2.1) (Trapnell et al., 2012). Differentially expressed genes were defined using a threshold cutoff false-discovery rate (FDR) of 5%. The R package cummeRbund was used to generate summary figures for the resulting RNA-seq data, such as heat maps, PCA plots, and gene clusters of differentially expressed genes (via partitioning tools) (Trapnell et al., 2012). The second pipeline mapped the reads back to the Giardia transcriptome (GiardiaDB-5.0_GintestinalisAssemblageA.gff) with Kallisto (Bray et al., 2016), using the recommended 30 bootstraps per sample. The companion package, Sleuth (Bray et al., 2016), was used for differential gene expression analysis, using the Wald test and significance q-value cutoff of 0.05. Transcripts showing concordant significant differential gene expression between Cuffdiff and Sleuth statistical packages were selected as confident differentially expressed (DE) genes.
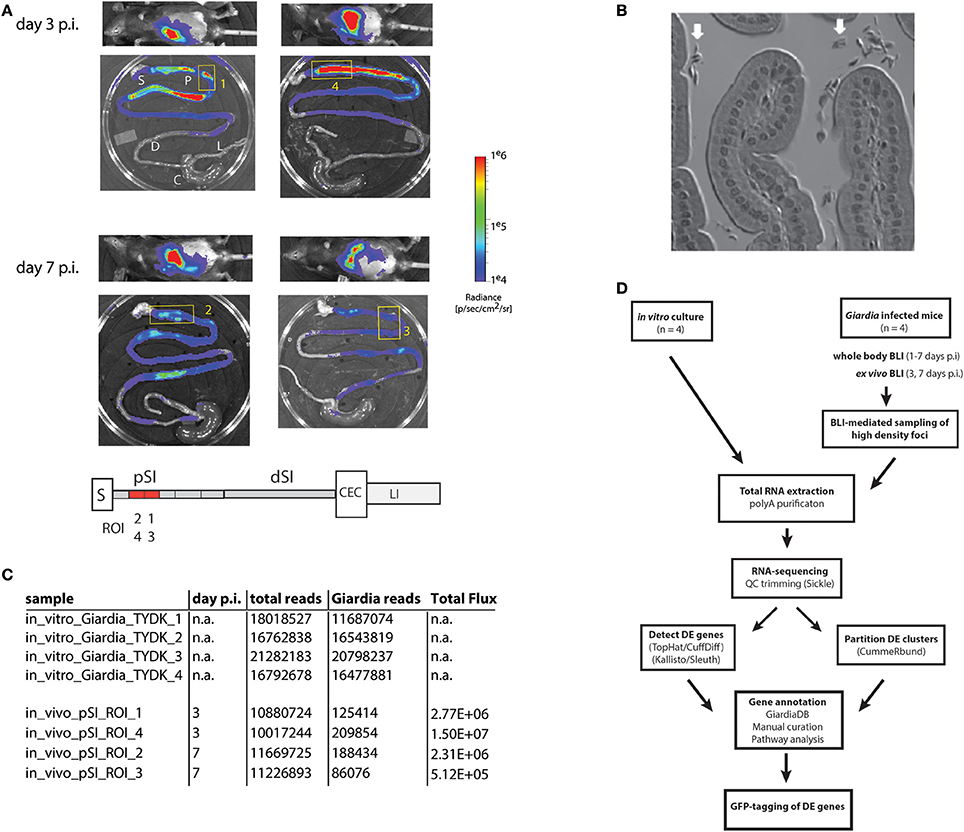
Figure 1. Bioluminescent imaging allows precise sampling of Giardia foci in the proximal small intestine for transcriptomic analyses. A cohort of four mice were infected with one million trophozoites by gavage of the PGDH-FLuc Giardia strain (Barash et al., 2017b). Whole body images were non-invasively collected for parasite bioluminescence from the constitutive PGDH-FLuc bioreporter (A), and mice were subsequently sacrificed at 3 or 7 days post-infection (p.i.). Image overlays display the PGDH-FLuc bioluminescence intensity, with the highest signal intensity shown in red and the lowest in blue. The colored radiance scale indicates the photon flux (p/s/cm2/sr) for each intestinal segment. Ex vivo imaging defined four foci in the proximal small intestine (yellow numbered boxed regions) subsequently excised for transcriptomic sequencing and analysis (A). In the schematic, regions of the gastrointestinal tract are marked as: S, stomach; pSI, proximal small intestine; dSI, distal small intestine; CEC, cecum; and LI, large intestine, with the positions of the Giardia foci (ROI1-ROI4) within the excised fragments in red. In (B), the enrichment of Giardia trophozoites (white arrows) in a representative bioluminescent small intestinal sample was verified using light microscopy of histological sections. (C) Summarizes the total transcriptomic reads for each in vitro culture replicate (TYDK) and for each transcriptomic sample (ROI1-ROI4) from the proximal small intestine (pSI). The total reads include those from the host (mouse) before the Giardia reads were computationally mapped to the Giardia genome. The total flux (p/s/cm2/sr) was quantified for that particular sample. The overall transcriptomic analysis is summarized in (D) (DE = differentially expressed).
For visualization, FPKM values of the 475 confident DE genes were hierarchically clustered. Bi-clustering was performed by Pearson correlation for transcript expression and Spearman correlation of expression profiles associated with each sample. The heatmap (Supplemental Table 3) was plotted using the heatmap.2 function of “gplots” the R software package (https://CRAN.R-project.org/package=gplots).
Functional Transcriptome Annotation, Metabolic Pathway Mapping, and Partitioning Analyses
Cellular functions were inferred for significant differentially expressed Giardia genes using analytical tools associated with the GiardiaDB (http://giardiadb.org/giardiadb/; Aurrecoechea et al., 2009), with subsequent manual inspection and curation of homology, functional domains, and cellular process designations according to prior experimental and bioinformatic evidence. GiardiaDB analytical tools were used to compare in vivo transcriptomic reads to prior transcriptomic and proteomic experimental studies (Palm et al., 2005; Morf et al., 2010; Ringqvist et al., 2011). In addition, the cummeRbund R package was used for partitioning analysis to predict nine differentially expressed gene clusters using the Jenson-Shannon distance binning methods with the cummeRbund software package (Trapnell et al., 2012), and compared to both the in vivo foci gene clusters and prior Giardia encystation and Caco-2-associated transcriptome studies (Palm et al., 2005; Morf et al., 2010; Ringqvist et al., 2011).
C-Terminal GFP Fusion Strain Construction of Select Differentially Expressed Genes
To confirm the cellular localization of novel differentially expressed genes identified in the in vivo transcriptome, 15 differentially expressed Giardia genes (GL50803_7797, GL50803_4705, GL50803_5258, GL50803_7710, GL50803_15499, GL50803_10822, GL50803_15427, GL50803_24412, GL50803_14748, GL50803_6679, GL50803_88960, GL50803_5515, GL50803_14567, GL50803_14926, GL50803_9354) were GFP-tagged via our laboratory's Gateway cloning pipeline (Dawson and House, 2010). We also tagged 14 genes that were more highly expressed in in vitro culture. The C-terminal GFP fusion constructs included approximately 200–250 nucleotides upstream of the gene, the gene itself in frame with GFP, and a puromycin resistance cassette (Dawson and House, 2010). The Giardia strain WBC6 was electroporated with 20 μg of GFP-fusion plasmids, and transformed strains were maintained under antibiotic selection (50 μg/ml puromycin) for at least 2 weeks (Dawson and House, 2010).
Immunostaining and Imaging of Encysting GFP-tagged Strains
To visualize encystation vesicles and the mature cyst, GFP-tagged trophozoites were encysted using established in vitro encystation methods (Carpenter et al., 2012). Sterile deionized water was then added to all experimental culture tubes to lyse incompletely encysted cells. Water resistant cysts were stored at 4°C for subsequent imaging. Cyst wall protein 1 (CWP1) was visualized by immunostaining fixed encysting trophozoites attached to coverslips using a 1:200 dilution of anti-CWP1 primary antibody (Waterborne, Inc., New Orleans, LA) and a goat anti-mouse antibody conjugated to Alexa Fluor 594 (Invitrogen) as previously described (Carpenter et al., 2012). Coverslips were mounted onto slides using Prolong Gold Antifade Solution with DAPI (Invitrogen).
Three dimensional stacks of immunostained samples were acquired using the Metamorph image acquisition software (MDS Technologies) with a Leica DMI 6000 wide-field inverted fluorescence microscope with a PlanApo 100X, NA 1.40 oil immersion objective. Serial sections of GFP-tagged strains were acquired at 0.2 μm intervals and deconvolved using Huygens Professional deconvolution software (SVI). Two dimensional maximum intensity projections were created from the 3D stacks for presentation.
Results
Bioluminescent Imaging Allows Precise Sampling of Regions of the Proximal Small Intestine with High-density Giardia Foci for Transcriptomics
A cohort of four mice was inoculated with the constitutive metabolic bioreporter strain PGDH-FLuc (Barash et al., 2017b). Giardia-specific bioluminescence was quantified non-invasively in animals from 1 to 7 days post-inoculation (Figure 1A and Materials and Methods). Two animals were sacrificed at day 3 p.i., and two more at day 7 p.i. Ex vivo imaging of the gastrointestinal tracts revealed dense foci of bioluminescent signal primarily in the proximal and distal small intestine (Figure 1A); bioluminescent flux directly correlates with the number of active Giardia parasites (Barash et al., 2017b). Proximal intestinal segments from each gastrointestinal tract were sampled, and the bioluminescent flux of the Giardia foci (5.12 × 10⁵ to 1.5 × 10⁷ photons/second/cm2; Figures 1A,C) was determined. Representative proximal small intestinal samples (ROI) from each gastrointestinal tract were selected for transcriptomic analyses. The histology of these segments indicated no verifiable host tissue damage (Materials and Methods), but did indicate obvious colonization of these regions by Giardia trophozoites (Figure 1B).
PolyA-purified total RNA was extracted from four in vivo intestinal samples and was used to create RNA-seq libraries for sequencing (Materials and Methods and Figures 1C,D). Four additional RNA-seq libraries were created and sequenced from four independent in vitro Giardia PGDH-FLuc cultures grown axenically in standard medium (Materials and Methods). Raw sequence reads generated for the RNA-seq samples ranged from 10.0 to 21.3 million (Figure 1C). The majority of RNA-seq reads from the in vitro culture (TYDK) datasets (97.7–98.7%) were mapped back to the WBC6 genome. Due to the high proportion of host total RNA in the ex vivo samples, fewer RNA-seq reads (0.8–1.9%) were mapped to the WBC6 genome; however, these numbers were comparable between individual in vivo samples and were sufficient for the two statistical analysis pipelines to determine differential gene expression (Figure 1C and Materials and Methods).
Identification of 475 Differentially Expressed (DE) Genes between In vitro Culture and In vivo Foci Transcriptomes
Transcriptomic comparisons and analyses between in vitro and in vivo samples were performed using the TopHat, Cufflinks, cummeRbund, Kallisto, and Sleuth packages as outlined in the bioinformatic strategy in Figure 1D and (Trapnell et al., 2012). A comparison of the normalized read (FPKM) profiles of the in vitro and in vivo transcriptomes indicate that the four in vitro profiles were very similar to one another, as were the four in vivo foci profiles (see heat map, Figure 2A and Supplemental Table 2). Significant differences in gene expression profiles between the in vitro and in vivo samples (Figure 2A) were quantified and summarized using two different computational methods (Cuffdiff and Sleuth). Cuffdiff and Sleuth identified 1073 and 1336 differentially expressed genes, respectively, between the in vitro and in vivo datasets (Figure 2B). Four hundred seventy-five differentially expressed genes were concordant between the two methods (marked by asterisks, Figure 2C). One hundred eighty-seven of the concordant differentially expressed genes had increased expression in the in vivo transcriptomes relative to the in vitro transcriptomes (Figure 2C). Two hundred eighty-eight of the concordant differentially expressed genes had decreased expression in the in vivo foci transcriptomes relative to in vitro transcriptomes (Figure 2C). All subsequent analyses focused on the concordant genes with expression levels that varied more than 2-fold between the in vivo and in vitro transcriptomes. These included 187 genes that were more highly expressed in vivo foci and 166 that were more highly expressed in in vitro culture. (Figure 2C and Supplemental Tables 4,5). Sixty-one genes that were expressed in vitro were not detected in the in vivo foci transcriptomes (Supplemental Table 6).
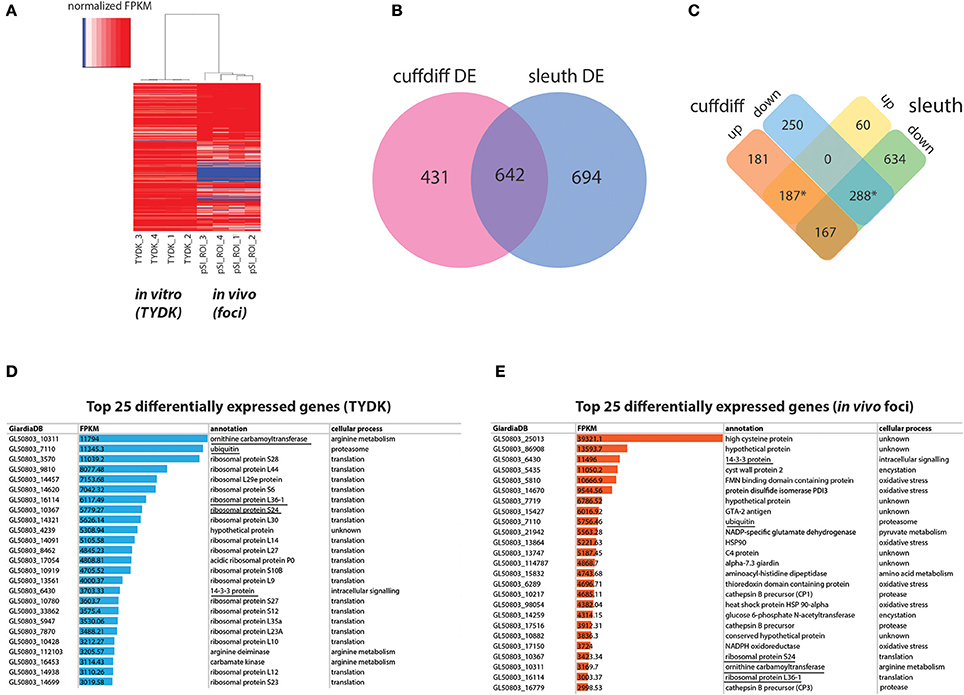
Figure 2. Summary of differentially expressed in vitro and in vivo foci transcriptomes using Cuffdiff and Sleuth. (A) Depicts a heat map of normalized FPKM comparing RNA-seq datasets from the Giardia grown in in vitro culture (TYDK) to Giardia transcriptomes associated with the in vivo foci excised from the proximal small intestine (pSI) (see Figure 1). For clarity, only differentially expressed genes confirmed by two independent methods are summarized by the heat map, with red indicating highly expressed genes, and blue indicating low expressed genes. Differentially expressed transcripts in the in vitro (TYDK) and in vivo (foci) datasets were identified by the concordance of two computational methods (B). Overlap in both upregulated and downregulated genes in the in vivo transcriptomes was calculated and is shown in (C). The asterisk indicates the 475 differentially upregulated genes (187 total) and downregulated genes (288 total) that were concordant between both methods. Of the 475 concordant differentially expressed genes, the 25 most highly transcribed genes present in the in vitro (D) and in vivo foci transcriptomes (E) are also ranked (FPKM). Underlined genes are those that are among the 25 most highly transcribed genes in both the in vitro and the in vivo transcriptome datasets.
Statistically significant increases in gene expression ranging from 2.5- to 153-fold were observed for Giardia in in vivo foci relative to trophozoites cultured in vitro. With respect to the most highly transcribed genes, transcripts associated with translation and arginine metabolism were the most transcribed categories of genes in the in vitro transcriptomes (Figure 2D and Supplemental Tables 4,6). In contrast, transcripts associated with encystation, oxidative stress, or unknown functions are among the most transcribed categories of genes in the in vivo foci transcriptomes (Figure 2E). Despite significant differences between in vivo and in vitro expression profiles, five genes (ornithine carbamoyl transferase (OCT, 10311), ubiquitin (7110), 14-3-3 protein (6430), ribosomal protein L36-1 (16114) and ribosomal protein S24 (10367) are among the top transcribed genes in both transcriptome datasets (Figures 2D,2E).
Encystation-Specific and Oxidative Stress Genes Are Significantly Upregulated in the In vivo Foci
Of the 475 differentially expressed genes, 25 genes were expressed more than 10-fold higher in the in vivo foci relative to cultured cells; however, only 8 genes were expressed at levels more than 10-fold higher in cultured cells than in vivo (Figure 3A and Supplemental Tables 4,5). The expression of 85 genes was elevated more than 5-fold in foci relative to cultured trophozoites, and there were 29 genes whose expression was more than 5-fold higher in the in vitro transcriptomes relative to the in vivo transcriptomes (Supplemental Tables 4,5).
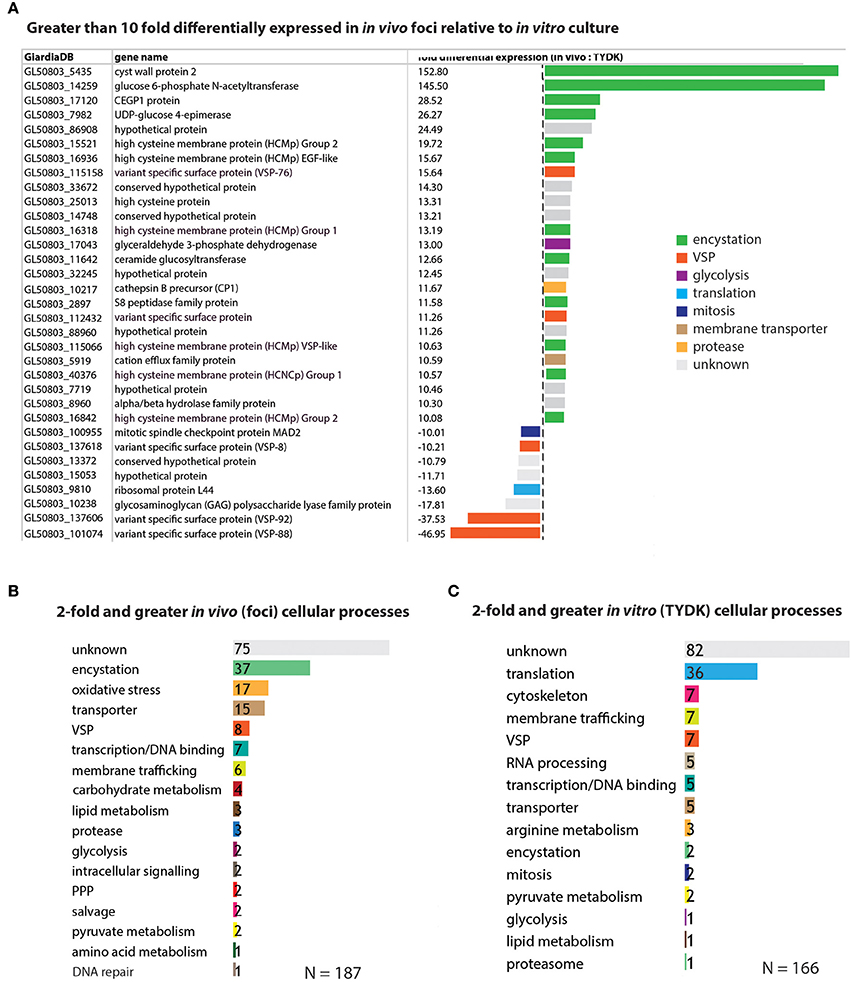
Figure 3. Encystation and oxidative stress genes are the top differentially expressed genes associated with the in vivo foci transcriptomes. In (A), genes that are greater than 10-fold differentially expressed in the in vivo foci transcriptomes relative to in vitro culture are ranked and colored according to cellular process (e.g., encystation). Genes differentially expressed greater than 2-fold are ranked according to the number that are associated with a particular cellular process in the in vivo foci transcriptome (B) and the in vitro (TYDK) transcriptome (C).
In contrast to the genomes of model organisms, many genes within the WBC6 genome lack functional gene annotations associated with Giardia-specific processes (e.g., encystation or pyruvate metabolism). Thus, we manually curated the functional annotations of genes whose expression was more than 2-fold higher in vivo (187 genes) or in vitro (166 genes) and summarized the functional categories associated with these statistically significant differentially expressed genes (Figure 3). Ten of the 25 genes with more than 10-fold higher expression in the in vivo foci are associated with encystation-specific processes. These genes encode components of the cyst wall (CWP2, 153X higher in vivo), enzymes in the UDP-N-acetylgalactosamine biosynthetic pathway (GL50803_14259, 146X higher in vivo), and high cysteine membrane proteins (HCMPs, 10X-20X higher in vivo). Eight genes with more than 10-fold higher expression in the in vivo foci have unknown or uncharacterized functions (Figure 3A and Supplemental Table 4).
Encystation-specific gene expression in in vivo foci becomes even more apparent when we consider the functional annotations of genes with more than 2-fold higher expression in in vivo foci relative to in vitro culture. Thirty-seven differentially expressed genes are associated with encystation, 17 with oxidative stress responses, and 15 with membrane transporter functions (Figure 3B and Supplemental Table 4). This is in contrast to genes highly expressed in vitro culture, which include cytoskeletal genes and other genes associated with housekeeping functions such as translation, RNA processing, and transcription (Figure 3C and Supplemental Table 5). Different types of genes with membrane trafficking functions are increased in the two transcriptome datasets. About equal numbers of unique variant specific surface proteins (or VSPs, Nash, 2002) are differentially expressed amongst the in vitro (7 VSPs) and in vivo foci (8 VSPs) transcriptomes.
Lastly, genes with unknown or uncharacterized function are the most abundant category in both the in vivo foci transcriptome (75/187) and the in vitro transcriptome (82/166) datasets.
In vivo Foci Display Increased Expression of Genes Associated with the UDP-N-Acetylgalactosamine, Pentose Phosphate, and Glycolytic and Pyruvate Pathways
To evaluate the degree to which the differential gene expression we observed is associated with specific metabolic pathways in Giardia, we mapped metabolic genes to four catabolic and biosynthetic pathways (Figure 4) using manual curation, as well as GO term and metabolic pathway enrichment tools available from GiardiaDB (Aurrecoechea et al., 2009). Specifically, we mapped the transcriptional upregulation of genes associated with in vivo foci to glycolysis and pyruvate metabolism, the pentose phosphate pathway (PPP), the UDP-N-acetylgalactosamine pathway, and the arginine dihydrolase pathway (Figure 4). First, we noted that in in vivo foci, the three key enzymes of the arginine dihydrolase pathway (OCT, ADI, CK) showed 3.7–6.4X less gene expression in in vivo foci than in trophozoites grown in in vitro culture.
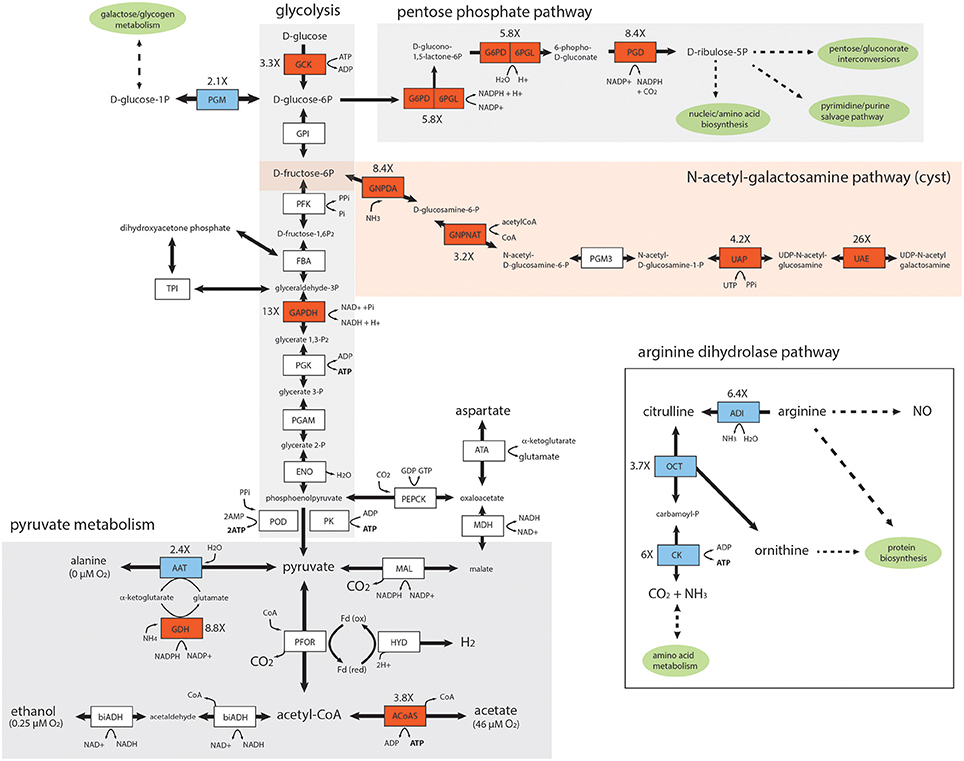
Figure 4. Key enzymes in the glycolytic, pentose phosphate, pyruvate, and UDP-N-acetyl-galactosamine pathways are upregulated in the in vivo Giardia foci. Diagrammatic representation of differentially expressed enzymes associated with in vivo Giardia energy and biosynthetic pathways. Red shading denotes increased expression of in vivo relative to in vitro transcripts, and blue shading denotes decreased expression. White shading indicates no significant differential expression between in vivo foci and in vitro (TYDK) transcriptomes. Oxygen concentrations associated with different branches of the pyruvate metabolic pathway are noted (Lindmark, 1980). The enzyme abbreviations, names, GiardiaDB (GL50803) ORFIDs, and Enzyme Commission numbers are: Glycolysis: ACYP, acylphosphatase (7871), EC 3.6.1.7; ENO, enolase (11118), EC 4.2.1.11; FBA, fructose-bisphosphate aldolase (11043), EC 4.1.2.13; GAPDH, glyceraldehyde-3-phosphate dehydrogenase (17043), EC 1.2.1.12; GPI, glucose-6-phosphate isomerase (9115), EC 5.3.1.9; GCK, glucokinase (8826), EC 2.7.1.2; PFK, phosphofructokinase (14993), EC 2.7.1.90; PGAM, phosphoglycerate mutase (8822), EC 5.4.2.1; PGK, phosphoglycerate kinase (90872), EC 2.7.2.3; PGM, phosphoglucomutase (17254), EC 5.4.2.2; PK, pyruvate kinase (17143,3206),EC 2.7.1.40; POD, pyruvate:orthophosphate dikinase (9909), EC 2.7.9.1; TPI, triose phosphate isomerase (93938), EC 5.3.1.1. Pyruvate metabolism: ATA, aspartate transaminase (91056), EC 2.6.1.1; FeADH, Fe-alcohol dehydrogenase (3861, 3593) EC 1.1.1.1; ACoAS, acetyl-CoA synthetase (13608); AAT, alanine aminotransferase (12150, 16353), EC 2.6.1.2; biADH (bifunctional alcohol/aldehyde dehydrogenase E (93358), EC 1.1.1.1; GDH, NADP-specific glutamate dehydrogenase (21942) EC 1.4.1.3, 1.4.1.4; Fd, ferredoxin (9662, 27266,10329); HYD, hydrogenase (6304), EC 1.12.7.2; MAL, malic enzyme (14285), EC 1.1.1.38; MDH, malate dehydrogenase (3331), EC 1.1.1.37; PEPCK, phosphoenolpyruvate carboxykinase (10623), EC 4.1.1.32; PFOR, pyruvate:ferredoxin oxidoreductase (17063, 114609); Pentose Phosphate Pathway (PPP): G6PD-6PGL, glucose-6-phosphate-1-dehydrogenase (8682), EC 1.1.1.49; PGD, phosphogluconate dehydrogenase (14759), EC 1.1.1.44; UDP-N-acetylgalactosamine (GalNac) biosynthetic pathway: GNPDA, glucosamine-6-phosphate deaminase (8245), EC 3.5.99.6; GNPNAT, glucosamine 6-phosphate N-acetyltransferase (14651), EC 2.3.1.4; PGM3, phosphoacetylglucosamine mutase (16069), EC 5.4.2.10; UAE, UDP-N-acetylglucosamine 4-epimerase (7982), EC 5.1.3.2; UAP, UDP-N-acetylglucosamine diphosphorylase (16217), EC 2.7.7.23. Arginine Dihydrolase Pathway: ADI, arginine deiminase (112103), EC 3.5.3.6; ARG-S, arginyl-tRNA synthetase (10521), EC 6.1.1.19; CK, carbamate kinase (16453), EC 2.7.2.2; NOS, nitric oxide synthase (91252), EC 1.14.13.39; OCD, ornithine cyclodeaminase (2452), EC 4.3.1.12; OCT, ornithine carbamoyltransferase (10311), EC 2.1.3.3; ODC, ornithine decarboxylase (94582), EC4.1.1.17; PRO-S, prolyl-tRNAsynthetase (15983), EC 6.1.1.15.
The carbohydrate component of the cyst is comprised of a D-GalNAc Beta (1,3)-D-GalNAc homopolymer synthesized from fructose 6-phosphate via the N-acetylgalactosamine (GalNAc) biosynthetic pathway (Figure 4). As has been seen previously during the transcriptional activation of GalNAc pathway enzymes during in vitro encystation (Macechko et al., 1992; Jarroll et al., 2001), we found that almost all enzymes in this pathway were expressed between 3.2 and 26X higher in the in vivo foci as compared to in the in vitro transcriptomes. In fact, the second enzyme in this pathway, glucosamine 6-phosphate N-acetyltransferase (GL50803_14651), is one of the top 25 highly expressed genes in in vivo foci (Figure 3B and Supplemental Table 2).
Key enzymes involved in the generation of ATP via glycolysis (GCK, 3.3X, and GAPDH, 13X) and pyruvate metabolism (AcoAS, 3.8X) were also more highly transcribed in the foci. PGM expression was several fold (2.1X) lower in the foci transcriptome relative to in vitro transcriptome. Pyruvate metabolism in Giardia is sensitive to oxygen concentration; at lower oxygen concentrations, pyruvate is fermented to alanine and ethanol, whereas at higher oxygen concentrations pyruvate is converted to acetate with the concomitant production of ATP (Lindmark, 1980). In foci, we observed increased expression of AcoAS, a key enzyme in the higher oxygen pathway resulting in acetate production. We also noted that AAT, involved in alanine production, was less expressed in foci than in vitro culture (2.4X). Lastly, two key enzymes of the PPP (G6PD, 5.8X, and PGD, 8.4X) are more highly expressed in the in vivo foci transcriptomes (Figure 4).
Partitioning Analysis Identifies Highly Expressed In vivo Foci Genes Associated with Encystation
Partitioning analysis sorted nine gene clusters of similar expression levels, and each cluster ranged from 39 to 218 differentially expressed genes (Figure 5A). On average, about 50% of the genes identified using the differential expression analyses (Materials and Methods) were shared with genes in clusters identified using the partitioning analysis (Figure 5B). The gene clusters that were the most highly transcribed in the foci (cluster A, 15X, cluster B, 5X, and cluster C, 3X, respectively) were enriched for encystation, oxidative stress response, and membrane transporter genes (Figure 5C). Cluster A included the most encystation-associated genes (Figure 5B and Supplemental Tables 7,8). These three clusters also shared genes in common with several recent studies of in vitro encystation genes (Morf et al., 2010), putative cyst-specific genes (Palm et al., 2005), and putative host-induced parasite genes (Roxstrom-Lindquist et al., 2005; Figure 5B).
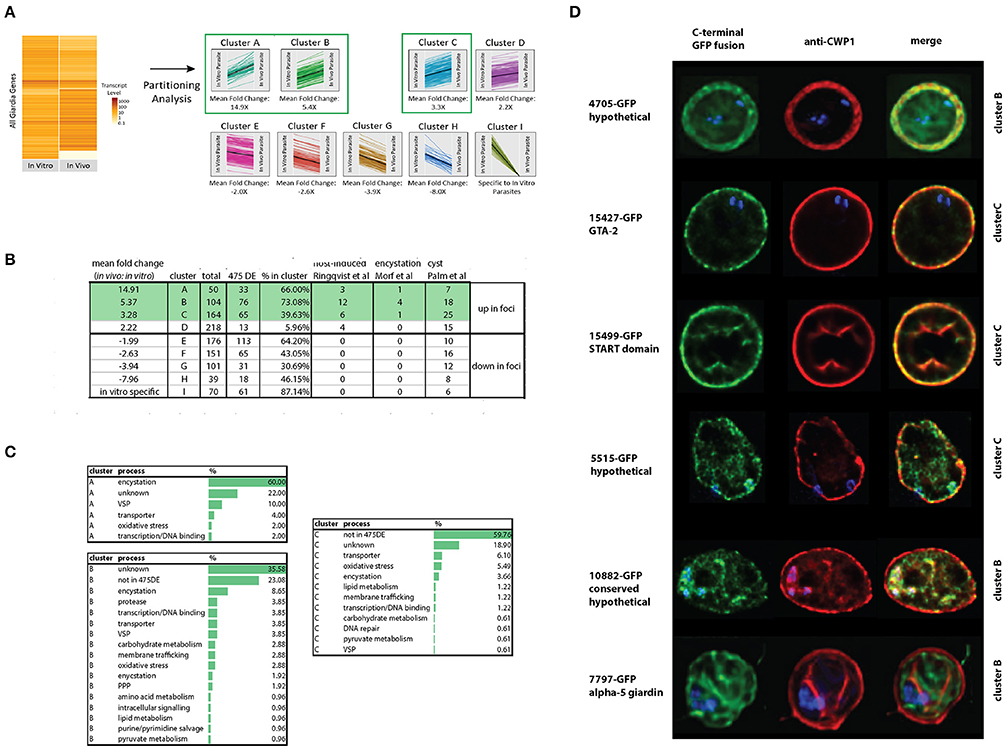
Figure 5. Identification and confirmation of novel proteins expressed highly in vivo that localize to cysts. Differentially expressed genes from the in vivo foci and in vitro culture datasets were partitioned into nine gene clusters (A-I) based on JS distance (Materials and Methods). Many of the 475 differentially expressed genes classified using both Cuffdiff and Sleuth (Materials and Methods) are highly represented in the clusters from this study (A). Other host-induced or encystation-specific transcriptome studies (Palm et al., 2005; Roxstrom-Lindquist et al., 2005; Morf et al., 2010) have fewer genes represented in the clusters than those identified by partitioning analysis in the foci (B). Many genes in clusters A, B, and C are associated with encystation or oxidative stress (C). In (D), C-terminal GFP fusions of genes from cluster B and C also are associated with the cyst wall or the interior of the cyst as visualized using colocalization immunofluorescent images with the cyst wall protein 1 (CWP-1) antibody.
Confirmation of Six New Cyst-Associated Proteins Expressed at Higher Levels in the In vivo Foci
To evaluate whether some of the genes of unknown function identified using either differential expression or partitioning analyses were associated with encystation, we tagged 15 genes using C-terminal GFP tags and created GFP-fusion strains (Dawson and House, 2010). Based on fluorescence microscopy of trophozoites of these GFP fusion strains, 13 of the 15 strains had interphase localization in trophozoites (Supplemental Figure 1). Six had localization in cysts (Figure 5D), with three localizing to the cyst wall: GTA-2 (15427), a START domain protein (15499), and one hypothetical protein (4705). Three GFP fusions localized to the interior region of the mature cyst including alpha-5-giardin (7797), a conserved hypothetical protein (10882), and one hypothetical protein (5515). The 4705-GFP and 7797-GFP strains lacked any localization in the trophozoite stage. Fifteen other genes more highly expressed in vitro culture were also tagged, and 14 had localizations in trophozoites (Supplemental Figure 2).
Discussion
Defining the dynamics of in vivo encystation is essential toward understanding Giardia's metabolic interactions with the host and commensal microbiota (Morf et al., 2010; Faso et al., 2013; Sulemana et al., 2014). By directly imaging Giardia infections using in vivo and ex vivo bioluminescent imaging (BLI) of Giardia with integrated firefly luciferase bioreporters of metabolism (PGDH-Fluc strain) or encystation (PCWP1-Fluc and PCWP2-Fluc strains), we recently showed that parasites colonize both the proximal and distal small intestine in high-density foci early in infection in both mice and gerbils. Encystation is also initiated early during infection in these foci, and persists throughout the entire course of infection (Barash et al., 2017b). The encystation-specific CWP1 and CWP2 promoter fusions to luciferase were highly expressed in the high density in vivo foci, and trophozoites in the foci possessed numerous encystation specific vesicles (ESVs) (Barash et al., 2017b). This work challenged the paradigm that encystation is triggered late in infection via spatially segregated cues in the gastrointestinal tract (Barash et al., 2017b), and rather indicated a density-dependent contribution to the initiation of encystation (Barash et al., 2017b).
Genes Associated with Encystation Are Significantly Upregulated in the In vivo Giardia Foci
Using two different analytic methods (Figure 2), we determined that the transcriptome profiles of Giardia from in vivo foci and from log phase axenic cultures were significantly different. Despite our deriving the samples from the gastrointestinal tracts of four different animals either 3 or 7 days post Giardia infection, the transcriptomic profiles of the in vivo foci were strikingly similar (Figure 2A). Relative to in vitro culture, many of the most highly expressed genes in the in vivo foci have functions associated with encystation and with oxidative stress responses. In contrast, the top in vitro expressed genes are associated with translation, cell division, and arginine metabolism (Figures 2D,E and Edwards et al., 1992; Stadelmann et al., 2012).
Landmark in vitro studies established that the initiation of encystation is transcriptionally controlled (Upcroft et al., 1996; Barat and Bloland, 1997; Land and Johnson, 1999) by a Myb transcription factor within 90 min of switching trophozoite cultures to encystation medium (Sun et al., 2002). GalNAc enzyme transcription has been shown to peak at about 22 h in encystation medium (Einarsson et al., 2016). Trophozoites in each in vivo focus are likely committed to encystation (Barash et al., 2017b), as the transcriptome of each in vivo focus is defined by the high expression of genes associated with later stages of encystation and cyst wall biosynthesis. In total, we have confirmed the expression of 37 known encystation genes and identified six new cyst–associated proteins in the high-density foci (Figure 6). Because we have identified many highly expressed encystation-associated transcripts in key metabolic, biosynthetic, protease, and membrane trafficking pathways, we suggest that the majority of cells in the high-density foci in the proximal intestine are in mid- to late stage encystation (Figure 6 and Supplemental Table 9). The apparent developmental synchrony of cells in the foci is supported by the strong encystation transcriptional profiles in each sample regardless of the day of infection (Figure 6) or in each animal sampled (Figure 2A) and may be the result of density related cues such as nutrient or lipid deprivation that trigger encystation.
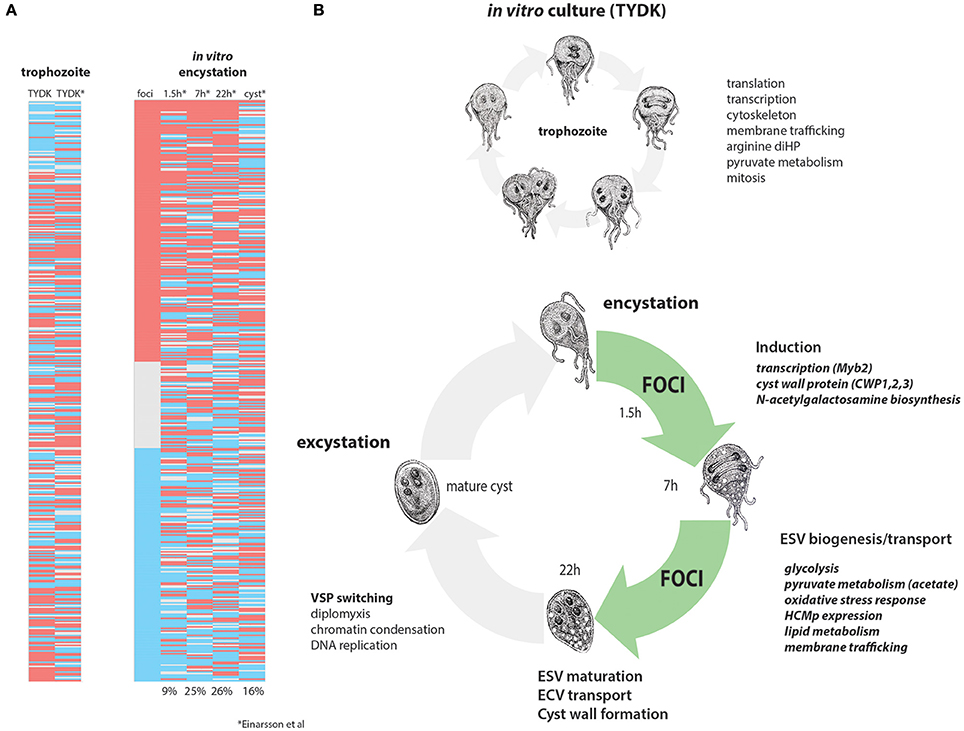
Figure 6. Differentially expressed genes in in vivo foci are similar to mid-late encystation time points in in vitro encystation transcriptomes. In vitro and in vivo differentially expressed genes from this study are compared to the in vitro encystation transcriptome of Einarsson et al. (2016). (A) Compares the 475 differentially expressed genes in this study (red, upregulated in foci; blue, downregulated in foci) to the in vitro culture transcriptome (TYDK) and the transcriptomes of four time points of an in vitro encystation transcriptome study. Percentages indicate the number of similarly differentially expressed genes in the in vivo foci relative to that in vitro encystation time point. (B) Summarizes processes upregulated in in vitro culture, which are primarily trophozoite growth and division (above) as contrasted with cellular processes upregulated in the in vivo foci (green) that are more similar to those genes upregulated during in mid-to-late in vitro encystation.
In support of the idea that Giardia in the foci are encysting, we noted significantly higher expression of the master transcriptional regulator Myb2, all enzymes of the GalNAc biosynthetic pathway (Figure 4), two known cyst wall proteins (CWP2 and CWP3), 17 HCMPs, and two EGF family proteins (Chen et al., 1996; Figures 2, 3, and Supplemental Table 4) in the in vivo foci. CWP1 (Ebneter et al., 2016) was identified as differentially expressed by only one of the two methods of analysis we used, and was thus not included in the 475 differentially expressed genes (Materials and Methods). Through partitioning analysis and analysis of differential gene expression in the in vivo foci, we also identified six new cyst-specific proteins (Figure 5D and Supplemental Tables 7,8). Each localizes to the cyst wall or the cyst interior after 24 h of incubation in encystation medium.
Variant-specific surface proteins (VSPs) contribute to Giardia's evasion from the host immune response (Prucca and Lujan, 2009), and only one VSP is typically expressed per cell (Li et al., 2013). VSP expression occurs early during in vitro encystation and VSP switching occurs during later stages (Prucca et al., 2008; Einarsson et al., 2016). Fourteen VSPs were differentially expressed in our analysis, and two VSPs were among the most highly expressed proteins in in vivo foci relative to in vitro culture (Figure 2).
Giardia directly perturbs lipid metabolism within the host by scavenging the gut lumen for lipids and by excreting novel end products of lipid metabolism (Mendez et al., 2015). Giardia also contributes to shifts in the local gut microbiota (Halliez and Buret, 2013) by both excreting novel lipids and influencing the bioavailability of bile acids (Gillin et al., 1986; Das et al., 1997, 2002; Yichoy et al., 2011). Lipids also play key roles in the regulation of encystation (Mendez et al., 2015). Glucosylceramide transferase-1 (gGlcT1), an enzyme involved in sphingolipid biosynthesis, is highly expressed in in vivo foci and has also been shown to play a key role in ESV biogenesis and cyst viability (Sonda et al., 2008). Also highly expressed in foci is the acid sphingomyelinase-like phosphodiesterase 3b precursor (gSmase 3B) which is also transcriptionally upregulated during encystation and may scavenge ceramide in the small intestine (Sonda et al., 2008). We also noted the increased in vivo expression of seven genes associated with membrane trafficking that could be involved in ESV biogenesis or transport (Figure 3 and Supplemental Table 4).
In Giardia, cathepsin cysteine proteases are linked not only to encystation (Touz et al., 2002) but also to evasion of innate and adaptive immune responses. In co-culture with rat IEC cells, one (3099) of the nine cathepsin B proteases genes has significantly increased expression Giardia trophozoites (Ma'ayeh and Brook-Carter, 2012). Five cysteine proteases (three cathepsin B homologs: 10217, 17516, 16779 and two cathepsin L homologs: 11209, 137680) have roughly five and 11.5-fold higher expression in the foci (Supplemental Tables 2,4). Cathepsin B (16779, CP3) and cathepsin L (137680) are known to be upregulated in encysting trophozoites (DuBois et al., 2008).
Energy Metabolism of Trophozoites Encysting in the In vivo Foci
As an anaerobic fermentative microbe, Giardia derives energy from glycolysis, pyruvate fermentation and the arginine dihydrolase pathway (Troeger et al., 2007 and see Figure 4). Though trophozoites cannot tolerate high oxygen concentrations, they actively consume oxygen (Paget et al., 1993a,b) and may take advantage of slightly elevated oxygen levels for energetic benefit (Paget et al., 1990; Edwards et al., 1992; Adam, 2001). As oxygen levels increase above 0.25 μM, the ATP producing arm of pyruvate metabolism is activated and acetate and ATP become primary end products, with the highest NAD(P)+ or ATP yields occurring at the higher end of tolerated oxygen concentrations (Schofield et al., 1990, 1991, 1992; Edwards et al., 1992). We noted higher expression of genes associated with energy metabolism via glycolysis (GCK, 3.3X and GAPDH, 13X) and pyruvate fermentation via pathways associated with higher oxygen tensions (Figure 4). These expression patterns are indicative of redox stress and encystation-specific metabolism associated with the in vivo foci. At higher oxygen concentrations, it is hypothesized that antioxidant enzymes consume NAD(P)H to neutralize dO2 and ROS/RNS, leading to regeneration of NAD(P) for glycolysis, allowing pyruvate to be used for ATP production, instead of NAD(P)H regeneration (Upcroft et al., 1996). In the in vivo foci, acetate could be the primary end product of Giardia fermentation due to the relatively increased expression of ACoAS (3.8X) and the decreased expression of AAT (2.4X) we observed (Figure 4). Thus, parasites in the high-density foci may take advantage of a more oxidized environment to switch to more energetically favorable pyruvate fermentation. We predict the increased in vivo expression of GDH is associated with parasite ammonia assimilation and the cycling of NAD(P) to maintain intracellular redox balance (Yee et al., 2000).
Encysting trophozoites slow their catabolism of glucose for energy and switch to using glucose to synthesize N-acetylgalactosamine for cyst wall synthesis (Jarroll et al., 2001 and Figure 4). GalNAc is synthesized only during encystation via a transcriptionally induced pathway of five enzymes that produces UDP-GalNac from fructose-6-phosphate that is diverted from ATP production in glycolysis to cyst wall polysaccharide biogenesis. This diversion could result in a net loss of ATP synthesis during encystation.
While little is known about the regulation of glycolysis and energy production during encystation, it is thought that additional ATP is generated from the arginine dihydrolase pathway (ADiHP) (Figure 4). This pathway yields ATP via the conversion of arginine to ammonia and citrulline, with the substrate-level phosphorylation of citrulline yielding ornithine and carbamoylphosphate, and resulting in NH3, CO2 as end products (Schofield et al., 1992). Ornithine carbamoyltransferase (OCT) is one of the most highly expressed enzymes in culture and in the in vivo foci (Figure 2), yet we observed less expression of key enzymes in the ADiHP relative to in vitro culture (Figure 4). This is counter to the prevailing notion that encysting trophozoites increase arginine catabolism through the ADiHP to offset energy lost from slowing glycolysis (Stadelmann et al., 2012).
Lastly, trophozoites also lack purine and pyrimidine synthesis, relying solely on salvage pathways to obtain these metabolites from the host and commensal microbiota (Jarroll et al., 1981; Wang and Aldritt, 1983; Aldritt et al., 1985). We also discovered that several key enzymes of the PPP (G6PD 5.8X and PGD 8.4X) have increased expression in the in vivo foci transcriptome (Figure 4). A key product of the PPP is NADPH, which plays an integral role in reductive biosynthesis as well as in the defense against oxidative stress and the maintenance of cellular redox. In Giardia and in Trichomonas, the G6PD and 6PGL enzymes are fused and are directly involved in the oxidative branch of the PPP in generating reduced NADPH (Figure 4 and Stover et al., 2011). This suggests that in the foci, there is increased cycling of reducing equivalents with CO2 production and the increased production of D-ribose-5P as a key substrate for nucleotide and amino acid biosynthesis and pyrimidine/purine salvage pathways.
Oxidative Stress Responses Are Increased in the In vivo Foci
Transcriptomic analyses of the high-density foci suggest that they are susceptible to and are responding to localized oxidative and nitrosative stresses (Brown et al., 1996; Di Matteo et al., 2008). Giardia attaches to the villi of the small intestine, where oxygen concentrations are up to 60 μM (Adam, 2001). Anti-oxidant defense is thought to be mediated by the thioredoxin-thioredoxin reductase system, as Giardia lacks superoxide dismutase, catalase, and glutathione-glutathione reductase. The thioredoxin-thioredoxin reductase system includes an FAD containing NADPH-dependent disulfide reductase, a thioredoxin, a thioredoxin reductase (TrxR) and a thioredoxin-peroxidase (Faghiri and Widmer, 2011). In oxidative environments, Giardia expresses NADH oxidase and flavodiiron protein that metabolize oxygen to form water (Brown et al., 1996; Di Matteo et al., 2008). Nitrosative stresses can have differing metabolic effects, however; while high micromolar concentrations of nitric oxide are toxic (Fernandes and Assreuy, 1997), lower levels inhibit cell proliferation, encystation, and excystation (Eckmann et al., 2000). Resolution of nitric oxide stress by Giardia is believed to be mediated by activity of its flavohemoglobin protein (Rafferty et al., 2010), which catalyzes the oxidation of nitric oxide to nitrate using oxygen as a co-substrate (Gardner et al., 1998; Hausladen et al., 1998; Gardner, 2005; Ilari and Boffi, 2008).
In particular, we observed the increased expression of genes associated with oxidative or nitrosative stress and detoxification, including NADPH oxidoreductase (17150, 15004), nitroreductase (FMN) family protein (8377), and flavohemoglobin (15009) at levels that were 2.5–8.5-fold higher than standard in vitro culture (Mastronicola et al., 2010). Indeed, many of the top 25 expressed genes in the in vivo foci (e.g., NADPH oxidoreductase) are associated with oxidative or nitrosative stress responses (Ma'ayeh et al., 2015), which may explain how Giardia can colonize the proximal part of the small intestine, a fairly aerobic portion of the intestinal tract (Mastronicola et al., 2010). Due to these transcriptomic patterns, we predict that Giardia trophozoites in high-density in vivo foci are more likely to be subject to host-induced oxidative stressors than Giardia growing at lower density.
Thioredoxin associated proteins also aid in the detoxification of oxidative stress, and five thioredoxin domain proteins (9827, 6289, 2388, 8064, 9335) were also highly expressed in the in vivo foci (Figures 2, 3). One thioredoxin reductase (TrxR, 9827) has disulfide reductase activity and converts oxidized thioredoxin to its reduced form. Reduced thioredoxin is, in turn, used to prevent protein misfolding that can occur under oxidative stress conditions (Land and Johnson, 1999). Giardia's TrxR also has NADPH oxidase activity, and during conversion of thioredoxin to its reduced form, NADP is generated from NADPH (Gillin et al., 1989).
Density Dependence of Encystation and the Consequences of Encystation on Host Pathology
The transcriptional profiles of the sampled foci resemble the transcriptional profiles seen for in vitro encysting trophozoites, suggesting the encysting trophozoites in the foci have received the inducing encystation stimulus within the last 12 h (Sulemana et al., 2014). We hypothesize that once parasites reach threshold high densities in discrete regions of the gut, they could trigger localized host immune responses and redox shifts, resulting in the observed increase in oxidative stress and encystation responses that define transcription in the foci. Current hypotheses about how Giardia induces host symptoms have focused primarily on specific damage induced by parasite attachment to the host gut epithelium or on the production of anti-microbial metabolites by the host. The physiology of parasites within the high-density foci in the host gut clearly differs from that of cells in laboratory culture or in co-culture with cell lines. The observed encystation- and oxidative stress-specific responses in gene expression within parasite foci likely reflect the physiological changes associated with high-density growth in localized regions of the gut. Giardia infection results in a dysbiosis throughout the gastrointestinal tract in mice, characterized by a shift in the diversity of commensal microbiota toward more aerobic Proteobacteria species (Barash et al., 2017a). As we find that encystation-specific metabolism occurs early and consistently during Giardia infection in the host, it is possible that the crowding, nutrient deprivation and accumulation of waste products that likely trigger encystation would also affect the nutrition of the host and associated commensal microbiome. Further investigation of Giardia-host-microbiome interactions should thus emphasize the study of such interactions in situ in order to vet laboratory culture and co-culture studies.
Ethics Statement
This study was carried out in accordance with the recommendations of the IACUC Committee at the University of California, Davis. The protocol was approved by the UC Davis IACUC Committee.
Author Contributions
JP processed samples, analyzed transcriptome data, imaged GFP strains, and created figures and tables, and wrote the manuscript. CN designed animal experiments, collected and analyzed BLI images, and imaged GFP strains. ES analyzed transcriptome data and created figures and tables. KN created and imaged GFP strains. KH created and imaged GFP strains, and edited the manuscript. HS analyzed transcriptome data and developed metabolic models. SD designed experiments, annotated genes, created figures, and wrote and edited manuscript.
Conflict of Interest Statement
The authors declare that the research was conducted in the absence of any commercial or financial relationships that could be construed as a potential conflict of interest.
Acknowledgments
Bioluminescent imaging was performed at the Center for Molecular and Genomic Imaging (CMGI), University of California, Davis with gracious help and training from Jennifer Fung and Charles Smith. The authors especially acknowledge Sarah Guest for the Giardia life cycle drawings. This study was supported by NIH R01AI077571 and NIH R21 AI119791 awards to SD.
Supplementary Material
The Supplementary Material for this article can be found online at: https://www.frontiersin.org/article/10.3389/fcimb.2017.00227/full#supplementary-material
Supplemental Figure 1. Subcellular localization of C-terminal GFP fusion proteins of selected genes with increased expression in the in vivo foci.
Supplemental Figure 2. Subcellular localization of C-terminal GFP fusion proteins of selected genes with increased expression in in vitro axenic culture.
Supplemental Table 1. Quantification of whole body and ex vivo bioluminescent imagine at day 3 and day 7 p.i. for transcriptomic sampling of foci.
Supplemental Table 2. FPKM of all genes in the in vivo and in vitro transcriptomes.
Supplemental Table 3. Overall heatmap of all FPKM.
Supplemental Table 4. Heat map table unregulated.
Supplemental Table 5. Heat map table - down regulated.
Supplemental Table 6. Heat map table - in vitro only.
Supplemental Table 7. Cuffdiff partitioning analysis into nine clusters.
Supplemental Table 8. Annotated nine clusters.
Supplemental Table 9. Comparison of in vivo foci and in vitro encystation transcriptomes.
References
Adam, R. D. (2001). Biology of Giardia lamblia. Clin. Microbiol. Rev. 14, 447–475. doi: 10.1128/CMR.14.3.447-475.2001
Aggarwal, A., and Nash, T. E. (1987). Comparison of two antigenically distinct Giardia lamblia isolates in gerbils. Am. J. Trop. Med. Hyg. 36, 325–332. doi: 10.4269/ajtmh.1987.36.325
Aldritt, S. M., Tien, P., and Wang, C. C. (1985). Pyrimidine salvage in Giardia lamblia. J. Exp. Med. 161, 437–445. doi: 10.1084/jem.161.3.437
Andreu, N., Zelmer, A., and Wiles, S. (2011). Noninvasive biophotonic imaging for studies of infectious disease. FEMS Microbiol. Rev. 35, 360–394. doi: 10.1111/j.1574-6976.2010.00252.x
Aurrecoechea, C., Brestelli, J., Brunk, B. P., Carlton, J. M., Dommer, J., Fischer, S., et al. (2009). GiardiaDB and TrichDB: integrated genomic resources for the eukaryotic protist pathogens Giardia lamblia and Trichomonas vaginalis. Nucleic Acids Res. 37, D526–D530. doi: 10.1093/nar/gkn631
Barash, N., Maloney, J. G., Singer, S. M., and Dawson, S. C. (2017a). Giardia alters commensal microbial diversity throughout the murine gut. Infect. Immun. 85:e00948–16. doi: 10.1128/IAI.00948-16
Barash, N., Nosala, C., Pham, J. K., McInally, S. G., Gourguechon, S., McCarthy-Sinclair, B., et al. (2017b). Giardia colonizes and encysts in high density foci in the murine small intestine. bioRxiv. doi: 10.1101/080226
Barat, L. M., and Bloland, P. B. (1997). Drug resistance among malaria and other parasites. Infect. Dis. Clin. North Am. 11, 969–987. doi: 10.1016/S0891-5520(05)70400-1
Bartelt, L. A., Roche, J., Kolling, G., Bolick, D., Noronha, F., Naylor, C., et al. (2013). Persistent G. lamblia impairs growth in a murine malnutrition model. J. Clin. Invest. 123, 2672–2684. doi: 10.1172/JCI67294
Boucher, S. E., and Gillin, F. D. (1990). Excystation of in vitro-derived Giardia lamblia cysts. Infect. Immun. 58, 3516–3522.
Bray, N. L., Pimentel, H., Melsted, P., and Pachter, L. (2016). Near-optimal probabilistic RNA-seq quantification. Nat. Biotechnol. 34, 525–527. doi: 10.1038/nbt.3519
Brown, D. M., Upcroft, J. A., and Upcroft, P. (1996). A H2O-producing NADH oxidase from the protozoan parasite Giardia duodenalis. Eur. J. Biochem. 241, 155–161. doi: 10.1111/j.1432-1033.1996.0155t.x
Byrd, L. G., Conrad, J. T., and Nash, T. E. (1994). Giardia lamblia infections in adult mice. Infect. Immun. 62, 3583–3585.
Campbell, J. D., and Faubert, G. M. (1994). Comparative studies on Giardia lamblia encystation in vitro and in vivo. J. Parasitol. 80, 36–44. doi: 10.2307/3283342
Carpenter, M. L., Assaf, Z. J., Gourguechon, S., and Cande, W. Z. (2012). Nuclear inheritance and genetic exchange without meiosis in the binucleate parasite Giardia intestinalis. J. Cell Sci. 125, 2523–2532. doi: 10.1242/jcs.103879
Chen, N., Upcroft, J. A., and Upcroft, P. (1996). A new cysteine-rich protein-encoding gene family in Giardia duodenalis. Gene 169, 33–38. doi: 10.1016/0378-1119(95)00759-8
Chen, P. M., Gregersen, H., and Zhao, J. B. (2015). Advanced glycation end-product expression is upregulated in the gastrointestinal tract of type 2 diabetic rats. World J. Diabetes 6, 662–672. doi: 10.4239/wjd.v6.i4.662
D'Archivio, S., Cosson, A., Medina, M., Lang, T., Minoprio, P., and Goyard, S. (2013). Non-invasive in vivo study of the Trypanosoma vivax infectious process consolidates the brain commitment in late infections. PLoS Negl. Trop. Dis. 7:e1976. doi: 10.1371/journal.pntd.0001976
Das, S., Schteingart, C. D., Hofmann, A. F., Reiner, D. S., Aley, S. B., and Gillin, F. D. (1997). Giardia lamblia: evidence for carrier-mediated uptake and release of conjugated bile acids. Exp. Parasitol. 87, 133–141. doi: 10.1006/expr.1997.4197
Das, S., Stevens, T., Castillo, C., Villasenor, A., Arredondo, H., and Reddy, K. (2002). Lipid metabolism in mucous-dwelling amitochondriate protozoa. Int. J. Parasitol. 32, 655–675. doi: 10.1016/S0020-7519(02)00006-1
Davids, B. J., Mehta, K., Fesus, L., McCaffery, J. M., and Gillin, F. D. (2004). Dependence of Giardia lamblia encystation on novel transglutaminase activity. Mol. Biochem. Parasitol. 136, 173–180. doi: 10.1016/j.molbiopara.2004.03.011
Davids, B. J., Reiner, D. S., Birkeland, S. R., Preheim, S. P., Cipriano, M. J., McArthur, A. G., et al. (2006). A new family of giardial cysteine-rich non-VSP protein genes and a novel cyst protein. PLoS ONE 1:e44. doi: 10.1371/journal.pone.0000044
Dawson, S. C., and House, S. A. (2010). Imaging and analysis of the microtubule cytoskeleton in Giardia. Methods Cell Biol. 97, 307–339. doi: 10.1016/S0091-679X(10)97017-9
Di Matteo, A., Scandurra, F. M., Testa, F., Forte, E., Sarti, P., Brunori, M., et al. (2008). The O2-scavenging flavodiiron protein in the human parasite Giardia intestinalis. J. Biol. Chem. 283, 4061–4068. doi: 10.1074/jbc.M705605200
DuBois, K. N., Abodeely, M., Sakanari, J., Craik, C. S., Lee, M., McKerrow, J. H., et al. (2008). Identification of the major cysteine protease of Giardia and its role in encystation. J. Biol. Chem. 283, 18024–18031. doi: 10.1074/jbc.M802133200
DuPont, H. L. (2013). Giardia: both a harmless commensal and a devastating pathogen. J. Clin. Invest. 123, 2352–2354. doi: 10.1172/JCI69932
Ebneter, J. A., Heusser, S. D., Schraner, E. M., Hehl, A. B., and Faso, C. (2016). Cyst-Wall-Protein-1 is fundamental for Golgi-like organelle neogenesis and cyst-wall biosynthesis in Giardia lamblia. Nat. Commun. 7, 13859. doi: 10.1038/ncomms13859
Eckmann, L., Laurent, F., Langford, T. D., Hetsko, M. L., Smith, J. R., Kagnoff, M. F., et al. (2000). Nitric oxide production by human intestinal epithelial cells and competition for arginine as potential determinants of host defense against the lumen-dwelling pathogen Giardia lamblia. J. Immunol. 164, 1478–1487. doi: 10.4049/jimmunol.164.3.1478
Edwards, M. R., Schofield, P. J., O'Sullivan, W. J., and Costello, M. (1992). Arginine metabolism during culture of Giardia intestinalis. Mol. Biochem. Parasitol. 53, 97–103. doi: 10.1016/0166-6851(92)90011-8
Einarsson, E., Troell, K., Hoeppner, M. P., Grabherr, M., Ribacke, U., and Svard, S. G. (2016). Coordinated changes in gene expression throughout encystation of giardia intestinalis. PLoS Negl. Trop. Dis. 10:e0004571. doi: 10.1371/journal.pntd.0004571
Faghiri, Z., and Widmer, G. (2011). A comparison of the Giardia lamblia trophozoite and cyst transcriptome using microarrays. BMC Microbiol. 11:91. doi: 10.1186/1471-2180-11-91
Faso, C., Bischof, S., and Hehl, A. B. (2013). The proteome landscape of Giardia lamblia encystation. PLoS ONE 8:e83207. doi: 10.1371/journal.pone.0083207
Faso, C., and Hehl, A. B. (2011). Membrane trafficking and organelle biogenesis in Giardia lamblia: use it or lose it. Int. J. Parasitol. 41, 471–480. doi: 10.1016/j.ijpara.2010.12.014
Fernandes, P. D., and Assreuy, J. (1997). Role of nitric oxide and superoxide in Giardia lamblia killing. Brazil. J. Med. Biol. Res. 30, 93–99.
Gardner, P. R. (2005). Nitric oxide dioxygenase function and mechanism of flavohemoglobin, hemoglobin, myoglobin and their associated reductases. J. Inorg. Biochem. 99, 247–266. doi: 10.1016/j.jinorgbio.2004.10.003
Gardner, P. R., Gardner, A. M., Martin, L. A., and Salzman, A. L. (1998). Nitric oxide dioxygenase: an enzymic function for flavohemoglobin. Proc. Natl. Acad. Sci. U.S.A. 95, 10378–10383. doi: 10.1073/pnas.95.18.10378
Gillin, F. D., Boucher, S. E., Rossi, S. S., and Reiner, D. S. (1989). Giardia lamblia: the roles of bile, lactic acid, and pH in the completion of the life cycle in vitro. Exp. Parasitol. 69, 164–174. doi: 10.1016/0014-4894(89)90185-9
Gillin, F. D., Gault, M. J., Hofmann, A. F., Gurantz, D., and Sauch, J. F. (1986). Biliary lipids support serum-free growth of Giardia lamblia. Infect. Immun. 53, 641–645.
Gillin, F. D., Reiner, D. S., and Boucher, S. E. (1988). Small-intestinal factors promote encystation of Giardia lamblia in vitro. Infect. Immun. 56, 705–707.
Gourguechon, S., and Cande, W. Z. (2011). Rapid tagging and integration of genes in Giardia intestinalis. Eukaryotic Cell 10, 142–145. doi: 10.1128/EC.00190-10
Halliez, M. C., and Buret, A. G. (2013). Extra-intestinal and long term consequences of Giardia duodenalis infections. World J. Gastroenterol. 19, 8974–8985. doi: 10.3748/wjg.v19.i47.8974
Hausladen, A., Gow, A. J., and Stamler, J. S. (1998). Nitrosative stress: metabolic pathway involving the flavohemoglobin. Proc. Natl. Acad. Sci. U.S.A. 95, 14100–14105. doi: 10.1073/pnas.95.24.14100
Heyworth, M. F. (2014). Immunological aspects of Giardia infections. Parasite 21:55. doi: 10.1051/parasite/2014056
Hutchens, M., and Luker, G. D. (2007). Applications of bioluminescence imaging to the study of infectious diseases. Cell. Microbiol. 9, 2315–2322. doi: 10.1111/j.1462-5822.2007.00995.x
Ilari, A., and Boffi, A. (2008). Structural studies on flavohemoglobins. Meth. Enzymol. 436, 187–202. doi: 10.1016/S0076-6879(08)36010-8
Inge, P. M., Edson, C. M., and Farthing, M. J. (1988). Attachment of Giardia lamblia to rat intestinal epithelial cells. Gut 29, 795–801. doi: 10.1136/gut.29.6.795
Jarroll, E. L., Macechko, P. T., Steimle, P. A., Bulik, D., Karr, C. D., van Keulen, H., et al. (2001). Regulation of carbohydrate metabolism during Giardia encystment. J. Eukaryot. Microbiol. 48, 22–26. doi: 10.1111/j.1550-7408.2001.tb00412.x
Jarroll, E. L., Muller, P. J., Meyer, E. A., and Morse, S. A. (1981). Lipid and carbohydrate metabolism of Giardia lamblia. Mol. Biochem. Parasitol. 2, 187–196. doi: 10.1016/0166-6851(81)90099-2
Joshi, N. A., and Fass, J. N. (2011). Sickle: A sliding-Window, Adaptive, Quality-Based Trimming Tool for FastQ Files (Version 1.33), Davis, CA [Software].
Keister, D. B. (1983). Axenic culture of Giardia lamblia in TYI-S-33 medium supplemented with bile. Trans. R. Soc. Trop. Med Hyg. 77, 487–488. doi: 10.1016/0035-9203(83)90120-7
Land, K. M., and Johnson, P. J. (1999). Molecular basis of metronidazole resistance in pathogenic bacteria and protozoa. Drug Resist. Updat. 2, 289–294. doi: 10.1054/drup.1999.0104
Lauwaet, T., Davids, B. J., Reiner, D. S., and Gillin, F. D. (2007). Encystation of Giardia lamblia: a model for other parasites. Curr. Opin. Microbiol. 10, 554–559. doi: 10.1016/j.mib.2007.09.011
Li, W., Saraiya, A. A., and Wang, C. C. (2013). Experimental verification of the identity of variant-specific surface proteins in Giardia lamblia trophozoites. MBio 4, e00321–13. doi: 10.1128/mBio.00321-13
Lindmark, D. G. (1980). Energy metabolism of the anaerobic protozoon Giardia lamblia. Mol. Biochem. Parasitol. 1, 1–12. doi: 10.1016/0166-6851(80)90037-7
Lujan, H. D., Mowatt, M. R., Byrd, L. G., and Nash, T. E. (1996). Cholesterol starvation induces differentiation of the intestinal parasite Giardia lamblia. Proc. Natl. Acad. Sci. U.S.A. 93, 7628–7633. doi: 10.1073/pnas.93.15.7628
Lujan, H. D., Mowatt, M. R., and Nash, T. E. (1997). Mechanisms of Giardia lamblia differentiation into cysts. Microbiol. Mol. Biol. Rev. 61, 294–304.
Lujan, H. D., Mowatt, M. R., and Nash, T. E. (1998). The molecular mechanisms of Giardia encystation. Parasitol. Today 14, 446–450. doi: 10.1016/S0169-4758(98)01333-7
Luo, J., Lin, A. H., Masliah, E., and Wyss-Coray, T. (2006). Bioluminescence imaging of Smad signaling in living mice shows correlation with excitotoxic neurodegeneration. Proc. Natl. Acad. Sci. U.S.A. 103, 18326–18331. doi: 10.1073/pnas.0605077103
Ma'ayeh, S. Y., and Brook-Carter, P. T. (2012). Representational difference analysis identifies specific genes in the interaction of Giardia duodenalis with the murine intestinal epithelial cell line, IEC-6. Int. J. Parasitol. 42, 501–509. doi: 10.1016/j.ijpara.2012.04.004
Ma'ayeh, S. Y., Knorr, L., and Svard, S. G. (2015). Transcriptional profiling of Giardia intestinalis in response to oxidative stress. Int. J. Parasitol. 45, 925–938. doi: 10.1016/j.ijpara.2015.07.005
Macechko, P. T., Steimle, P. A., Lindmark, D. G., Erlandsen, S. L., and Jarroll, E. L. (1992). Galactosamine-synthesizing enzymes are induced when Giardia encyst. Mol. Biochem. Parasitol. 56, 301–309. doi: 10.1016/0166-6851(92)90179-N
Mastronicola, D., Testa, F., Forte, E., Bordi, E., Pucillo, L. P., Sarti, P., et al. (2010). Flavohemoglobin and nitric oxide detoxification in the human protozoan parasite Giardia intestinalis. Biochem. Biophys. Res. Commun. 399, 654–658. doi: 10.1016/j.bbrc.2010.07.137
Mayrhofer, G., Andrews, R. H., Ey, P. L., Albert, M. J., Grimmond, T. R., and Merry, D. J. (1992). The use of suckling mice to isolate and grow Giardia from mammalian faecal specimens for genetic analysis. Parasitology 105(Pt 2), 255–263. doi: 10.1017/S0031182000074187
Mendez, T. L., De Chatterjee, A., Duarte, T., De Leon, J., Robles-Martinez, L., and Das, S. (2015). Sphingolipids, lipid rafts, and giardial encystation: the show must go on. Curr. Trop. Med. Rep. 2, 136–143. doi: 10.1007/s40475-015-0052-0
Miyamoto, Y., and Eckmann, L. (2015). Drug Development against the major diarrhea-causing parasites of the small intestine, cryptosporidium and giardia. Front. Microbiol. 6:1208. doi: 10.3389/fmicb.2015.01208
Morf, L., Spycher, C., Rehrauer, H., Fournier, C. A., Morrison, H. G., and Hehl, A. B. (2010). The transcriptional response to encystation stimuli in Giardia lamblia is restricted to a small set of genes. Eukaryotic Cell 9, 1566–1576. doi: 10.1128/EC.00100-10
Nash, T. E. (2002). Surface antigenic variation in Giardia lamblia. Mol. Microbiol. 45, 585–590. doi: 10.1046/j.1365-2958.2002.03029.x
Nosala, C., and Dawson, S. C. (2015). The critical role of the cytoskeleton in the pathogenesis of giardia. Curr. Clin. Microbiol. Rep. 2, 155–162. doi: 10.1007/s40588-015-0026-y
Oberhuber, G., Kastner, N., and Stolte, M. (1997). Giardiasis: a histologic analysis of 567 cases. Scand. J. Gastroenterol. 32. 48–51. doi: 10.3109/00365529709025062
Owen, R. L., Nemanic, P. C., and Stevens, D. P. (1979). Ultrastructural observations on giardiasis in a murine model. I. Intestinal distribution, attachment, and relationship to the immune system of Giardia muris. Gastroenterology 76, 757–769.
Paget, T. A., Kelly, M. L., Jarroll, E. L., Lindmark, D. G., and Lloyd, D. (1993a). The effects of oxygen on fermentation in Giardia lamblia. Mol. Biochem. Parasitol. 57, 65–71. doi: 10.1016/0166-6851(93)90244-R
Paget, T. A., Manning, P., and Jarroll, E. L. (1993b). Oxygen uptake in cysts and trophozoites of Giardia lamblia. J. Eukaryot. Microbiol. 40, 246–250. doi: 10.1111/j.1550-7408.1993.tb04911.x
Paget, T. A., Raynor, M. H., Shipp, D. W., and Lloyd, D. (1990). Giardia lamblia produces alanine anaerobically but not in the presence of oxygen. Mol. Biochem. Parasitol. 42, 63–67. doi: 10.1016/0166-6851(90)90113-Z
Palm, D., Weiland, M., McArthur, A. G., Winiecka-Krusnell, J., Cipriano, M. J., Birkeland, S. R., et al. (2005). Developmental changes in the adhesive disk during Giardia differentiation. Mol. Biochem. Parasitol. 141, 199–207. doi: 10.1016/j.molbiopara.2005.03.005
Prucca, C. G., and Lujan, H. D. (2009). Antigenic variation in Giardia lamblia. Cell. Microbiol. 11, 1706–1715. doi: 10.1111/j.1462-5822.2009.01367.x
Prucca, C. G., Slavin, I., Quiroga, R., Elias, E. V., Rivero, F. D., Saura, A., et al. (2008). Antigenic variation in Giardia lamblia is regulated by RNA interference. Nature 456, 750–754. doi: 10.1038/nature07585
Rafferty, S., Luu, B., March, R. E., and Yee, J. (2010). Giardia lamblia encodes a functional flavohemoglobin. Biochem. Biophys. Res. Commun. 399, 347–351. doi: 10.1016/j.bbrc.2010.07.073
Reimao, J. Q., Trinconi, C. T., Yokoyama-Yasunaka, J. K., Miguel, D. C., Kalil, S. P., and Uliana, S. R. (2013). Parasite burden in Leishmania (Leishmania) amazonensis-infected mice: validation of luciferase as a quantitative tool. J. Microbiol. Methods 93, 95–101. doi: 10.1016/j.mimet.2013.02.007
Rhee, K. J., Cheng, H., Harris, A., Morin, C., Kaper, J. B., and Hecht, G. (2011). Determination of spatial and temporal colonization of enteropathogenic E. coli and enterohemorrhagic E. coli in mice using bioluminescent in vivo imaging. Gut Microbes 2, 34–41. doi: 10.4161/gmic.2.1.14882
Ringqvist, E., Avesson, L., Söderbom, F., and Svärd, S. G. (2011). Transcriptional changes in Giardia during host-parasite interactions. Int. J. Parasitol. 41, 277–285. doi: 10.1016/j.ijpara.2010.09.011
Rivero, F. D., Saura, A., Prucca, C. G., Carranza, P. G., Torri, A., and Lujan, H. D. (2010). Disruption of antigenic variation is crucial for effective parasite vaccine. Nat. Med. 16, 551–557, 1p following 557. doi: 10.1038/nm.2141
Roxstrom-Lindquist, K., Ringqvist, E., Palm, D., and Svard, S. (2005). Giardia lamblia-induced changes in gene expression in differentiated Caco-2 human intestinal epithelial cells. Infect. Immun. 73, 8204–8208. doi: 10.1128/IAI.73.12.8204-8208.2005
Saeij, J. P., Boyle, J. P., Grigg, M. E., Arrizabalaga, G., and Boothroyd, J. C. (2005). Bioluminescence imaging of Toxoplasma gondii infection in living mice reveals dramatic differences between strains. Infect. Immun. 73, 695–702. doi: 10.1128/IAI.73.2.695-702.2005
Savioli, L., Smith, H., and Thompson, A. (2006). Giardia and Cryptosporidium join the ‘neglected diseases initiative’. Trends Parasitol. 22, 203–208. doi: 10.1016/j.pt.2006.02.015
Schofield, P. J., Costello, M., Edwards, M. R., and O'Sullivan, W. J. (1990). The arginine dihydrolase pathway is present in Giardia intestinalis. Int. J. Parasitol. 20, 697–699. doi: 10.1016/0020-7519(90)90133-8
Schofield, P. J., Edwards, M. R., and Kranz, P. (1991). Glucose metabolism in Giardia intestinalis. Mol. Biochem. Parasitol. 45, 39–47. doi: 10.1016/0166-6851(91)90025-2
Schofield, P. J., Edwards, M. R., Matthews, J., and Wilson, J. R. (1992). The pathway of arginine catabolism in Giardia intestinalis. Mol. Biochem. Parasitol. 51, 29–36. doi: 10.1016/0166-6851(92)90197-R
Singer, S. M. (2016). Control of giardiasis by interleukin-17 in humans and mice–are the questions all answered? Clin. Vaccine Immunol. 23, 2–5. doi: 10.1128/CVI.00648-15
Solaymani-Mohammadi, S., and Singer, S. M. (2010). Giardia duodenalis: the double-edged sword of immune responses in giardiasis. Exp. Parasitol. 126, 292–297. doi: 10.1016/j.exppara.2010.06.014
Solaymani-Mohammadi, S., and Singer, S. M. (2011). Host immunity and pathogen strain contribute to intestinal disaccharidase impairment following gut infection. J. Immunol. 187, 3769–3775. doi: 10.4049/jimmunol.1100606
Sonda, S., Stefanic, S., and Hehl, A. B. (2008). A sphingolipid inhibitor induces a cytokinesis arrest and blocks stage differentiation in Giardia lamblia. Antimicrob. Agents Chemother. 52, 563–569. doi: 10.1128/AAC.01105-07
Stacer, A. C., Nyati, S., Moudgil, P., Iyengar, R., Luker, K. E., Rehemtulla, A., et al. (2013). NanoLuc reporter for dual luciferase imaging in living animals. Mol. Imaging 12, 1–13.
Stadelmann, B., Merino, M. C., Persson, L., and Svard, S. G. (2012). Arginine consumption by the intestinal parasite Giardia intestinalis reduces proliferation of intestinal epithelial cells. PLoS ONE 7:e45325. doi: 10.1371/journal.pone.0045325
Stover, N. A., Dixon, T. A., and Cavalcanti, A. R. (2011). Multiple independent fusions of glucose-6-phosphate dehydrogenase with enzymes in the pentose phosphate pathway. PLoS ONE 6:e22269. doi: 10.1371/journal.pone.0022269
Sulemana, A., Paget, T. A., and Jarroll, E. L. (2014). Commitment to cyst formation in Giardia. Microbiology 160, 330–339. doi: 10.1099/mic.0.072405-0
Sun, C. H., Palm, D., McArthur, A. G., Svard, S. G., and Gillin, F. D. (2002). A novel Myb-related protein involved in transcriptional activation of encystation genes in Giardia lamblia. Mol. Microbiol. 46, 971–984. doi: 10.1046/j.1365-2958.2002.03233.x
Touz, M. C., Nores, M. J., Slavin, I., Carmona, C., Conrad, J. T., Mowatt, M. R., et al. (2002). The activity of a developmentally regulated cysteine proteinase is required for cyst wall formation in the primitive eukaryote Giardia lamblia. J. Biol. Chem. 277, 8474–8481. doi: 10.1074/jbc.M110250200
Trapnell, C., Pachter, L., and Salzberg, S. L. (2009). TopHat: discovering splice junctions with RNA-Seq. Bioinformatics 25, 1105–1111. doi: 10.1093/bioinformatics/btp120
Trapnell, C., Roberts, A., Goff, L., Pertea, G., Kim, D., Kelley, D. R., et al. (2012). Differential gene and transcript expression analysis of RNA-seq experiments with TopHat and Cufflinks. Nat. Protoc. 7, 562–578. doi: 10.1038/nprot.2012.016
Trapnell, C., Williams, B. A., Pertea, G., Mortazavi, A., Kwan, G., van Baren, M. J., et al. (2010). Transcript assembly and quantification by RNA-Seq reveals unannotated transcripts and isoform switching during cell differentiation. Nat. Biotechnol. 28, 511–515. doi: 10.1038/nbt.1621
Troeger, H., Epple, H. J., Schneider, T., Wahnschaffe, U., Ullrich, R., Burchard, G. D., et al. (2007). Effect of chronic Giardia lamblia infection on epithelial transport and barrier function in human duodenum. Gut 56, 328–335. doi: 10.1136/gut.2006.100198
Upcroft, J., Samarawickrema, N., Brown, D., and Upcroft, P. (1996). Mechanisms of metronidazole resistance in Giardia and Entamoeba. Abstr. Interscie. Conf. Antimicrob. Agents Chemother. 36, 47.
Upcroft, P., and Upcroft, J. A. (2001). Drug targets and mechanisms of resistance in the anaerobic protozoa. Clin. Microbiol. Rev. 14, 150–164. doi: 10.1128/CMR.14.1.150-164.2001
Wang, C. C., and Aldritt, S. (1983). Purine salvage networks in Giardia lamblia. J. Exp. Med. 158, 1703–1712. doi: 10.1084/jem.158.5.1703
Weissleder, R., and Ntziachristos, V. (2003). Shedding light onto live molecular targets. Nat. Med. 9, 123–128. doi: 10.1038/nm0103-123
Welsh, D. K., and Kay, S. A. (2005). Bioluminescence imaging in living organisms. Curr. Opin. Biotechnol. 16, 73–78. doi: 10.1016/j.copbio.2004.12.006
Wiles, S., Pickard, K. M., Peng, K., MacDonald, T. T., and Frankel, G. (2006). In vivo bioluminescence imaging of the murine pathogen Citrobacter rodentium. Infect. Immun. 74, 5391–5396. doi: 10.1128/IAI.00848-06
Yee, J., Mowatt, M. R., Dennis, P. P., and Nash, T. E. (2000). Transcriptional analysis of the glutamate dehydrogenase gene in the primitive eukaryote, Giardia lamblia. Identification of a primordial gene promoter. J. Biol. Chem. 275, 11432–11439. doi: 10.1074/jbc.275.15.11432
Keywords: in vivo Giardia, transcriptome, mouse model, encystation, oxidative stress
Citation: Pham JK, Nosala C, Scott EY, Nguyen KF, Hagen KD, Starcevich HN and Dawson SC (2017) Transcriptomic Profiling of High-Density Giardia Foci Encysting in the Murine Proximal Intestine. Front. Cell. Infect. Microbiol. 7:227. doi: 10.3389/fcimb.2017.00227
Received: 08 March 2017; Accepted: 16 May 2017;
Published: 31 May 2017.
Edited by:
Lorenza Putignani, Bambino Gesù Ospedale Pediatrico (IRCCS), ItalyReviewed by:
Eva Gluenz, University of Oxford, United KingdomEsther Orozco, Centro de Investigación y de Estudios Avanzados del IPN, Mexico
Copyright © 2017 Pham, Nosala, Scott, Nguyen, Hagen, Starcevich and Dawson. This is an open-access article distributed under the terms of the Creative Commons Attribution License (CC BY). The use, distribution or reproduction in other forums is permitted, provided the original author(s) or licensor are credited and that the original publication in this journal is cited, in accordance with accepted academic practice. No use, distribution or reproduction is permitted which does not comply with these terms.
*Correspondence: Scott C. Dawson, scdawson@ucdavis.edu