Soil N2O fluxes along an elevation gradient of tropical montane forests under experimental nitrogen and phosphorus addition
 Anke K. Müller
 Amanda L. Matson
 Marife D. Corre
  Edzo Veldkamp
- Soil Science of Tropical and Subtropical Ecosystems, Buesgen Institute, Georg-August University of Goettingen, Goettingen, Germany
Nutrient deposition to tropical forests is increasing, which could affect soil fluxes of nitrous oxide (N2O), a powerful greenhouse gas. We assessed the effects of 35–56 months of moderate nitrogen (N) and phosphorus (P) additions on soil N2O fluxes and net soil N-cycling rates, and quantified the relative contributions of nitrification and denitrification to N2O fluxes. In 2008, a nutrient manipulation experiment was established along an elevation gradient (1000, 2000, and 3000 m) of montane forests in southern Ecuador. Treatments included control, N, P, and N+P addition (with additions of 50 kg N ha−1 yr−1 and 10 kg P ha−1 yr−1). Nitrous oxide fluxes were measured using static, vented chambers and N cycling was determined using the buried bag method. Measurements showed that denitrification was the main N2O source at all elevations, but that annual N2O emissions from control plots were low, and decreased along the elevation gradient (0.57 ± 0.26–0.05 ±0.04 kg N2O-N ha−1 yr−1). We attributed the low fluxes to our sites' conservative soil N cycling as well as gaseous N losses possibly being dominated by N2. Contrary to the first 21 months of the experiment, N addition did not affect N2O fluxes during the 35–56 month period, possibly due to low soil moisture contents during this time. With P addition, N2O fluxes and mineral N concentrations decreased during Months 35–56, presumably because plant P limitations were alleviated, increasing plant N uptake. Nitrogen plus phosphorus addition showed similar trends to N addition, but less pronounced given the counteracting effects of P addition. The combined results from this study (Months 1–21 and 35–56) showed that effects of N and P addition on soil N2O fluxes were not linear with time of exposure, highlighting the importance of long-term studies.
Introduction
Nitrous oxide (N2O) is both a potent greenhouse gas and a dominant ozone-depleting substance (Denman et al., 2007). Soil emissions are the largest natural (i.e., non-anthropogenic) source of N2O (Ehhalt et al., 2001), which is mainly produced and consumed by the microbial processes of nitrification and denitrification (Chapuis-Lardy et al., 2007). While nitrification is an obligate aerobic process, which depends on ammonium () and/or organic nitrogen (N) as substrates, denitrification is an anoxic process which is controlled mainly by the soil aeration/oxygen status (i.e., soil water content), nitrate () availability, microbially-available organic carbon, and soil pH (Firestone and Davidson, 1989). Thus, soil N availability and water content play a crucial role in controlling the amounts and relative ratios of N-oxide fluxes from soils.
Given the controlling factors for N2O flux, moist tropical forests with high natural N availability have the potential to be strong N2O sources. Indeed, tropical forest soils currently account for 30% of global N2O emissions from unmanaged soils (Ehhalt et al., 2001). However, since atmospheric N deposition from biomass burning, fertilizer use, and industrialization is rapidly increasing (Hietz et al., 2011), it is possible that N2O emissions in tropical forests may increase (Koehler et al., 2009; Martinson et al., 2013). In temperate forest ecosystems, elevated N deposition has been shown to increase soil N availability and accelerate soil N cycling, causing substantial N losses in the form of N2O emissions (e.g., Butterbach-Bahl et al., 1998; Gundersen et al., 1998). In a meta-analysis of N enrichment effects on greenhouse gas fluxes, Liu and Graever (2009) showed that the N2O response to elevated N input could even be stronger in tropical forests than in other ecosystems. These authors suggested that the strength of the tropical forest response to N enrichment may be due to the phosphorus (P) limitation (rather than N limitation) of many tropical soils.
Tropical montane forests (TMFs) make up over 11% of the world's tropical forests. They occur across large elevation gradients and contain a large variety of environmental conditions (FAO, 1993; Bubb et al., 2004). TMFs usually exhibit “conservative” soil N cycling (similar rates of mineral N production and consumption), which results in low N losses. This is in contrast to tropical lowland forest soils, which typically have a more “leaky” soil N cycle; they often have relatively high soil N cycling rates (Vitousek and Matson, 1988; Corre et al., 2010), N-oxide (NO, N2O) fluxes (e.g., Matson and Vitousek, 1987; Keller et al., 2005; Purbopuspito et al., 2006; Koehler et al., 2009), and leaching (e.g., Hedin et al., 2003; Dechert et al., 2005; Schwendenmann and Veldkamp, 2005). However, N addition experiments in TMFs of Hawaii (Hall and Matson, 2003) and Panama (Koehler et al., 2009; Corre et al., 2014) have shown increases in soil mineral N production - especially nitrification rates - and N-oxide fluxes in as little as 1–2 years after the onset of N addition. In the Panamanian TMF, soil N2O emissions during the third and fourth year of N addition reached levels as high as those from the lowland forest, which had already experienced 11–12 years of N addition (Corre et al., 2014). Therefore, there is a strong potential for TMF soil to become a significant N2O source when subjected to chronic N input.
Tropical South America is also experiencing increases in atmospheric P deposition, mainly due to biomass burning (Mahowald et al., 2005). As mentioned above, soil P limitation may affect the response of soil N cycling (and therefore N2O flux) to N enrichment (Liu and Graever, 2009). Hall and Matson (1999), found that N addition to a Hawaiian tropical forest soil resulted in higher inorganic N concentrations and N2O emissions in P-limited soils as compared to N-limited soils. However, field studies with P addition have shown varying results. In a plantation of N-fixing trees in Indonesia, a one-time application of 100 kg P ha−1 followed by 2 years of measurements, exhibited decreased soil N contents and N2O emissions, with increased plant N uptake (Mori et al., 2013). In contrast, Wang et al. (2014) showed that the interaction between N and P addition could result in increased N2O emissions in a tropical lowland forest in Southern China. Phosphorus is known to limit plant growth in TMFs (Tanner et al., 1998; Homeier et al., 2012), but the effect of elevated P deposition on soil N cycling in these areas has been little studied.
Since responses of ecosystem processes to chronic nutrient addition may be non-linear with time (e.g., Aber et al., 1998), quantifying changes in N-oxide fluxes and their controlling factors need to be conducted in long-term and large-scale nutrient manipulation experiments. Here, we report the changes in soil N2O fluxes, contributions of nitrification and denitrification to N2O fluxes, and net rates of soil N cycling (an index of plant-available N) during Months 35–56 of moderate N, P, and combined N + P addition (with additions of 50 kg N ha−1 yr−1 and 10 kg P ha−1 yr−1), along an elevation gradient (1000, 2000, and 3000 m) of TMFs in southern Ecuador.
Martinson et al. (2013) reported the effects of nutrient manipulation on soil N2O fluxes from Months 1–21 of this experiment. Along the elevation gradient, they observed higher soil N2O emissions from soils with N and N + P addition, with soils at 1000 m responding more rapidly than the higher elevations. They also observed slight increases in net nitrification at 2000 and 3000 m (as compared to the previously-undetectable net nitrification activity) with N and N + P additions. However, they did not detect any effect of P addition on soil N2O fluxes or net soil N cycling rates at any elevation.
The objectives of the present study were to (1) determine the cumulative effect of 35–56 months of moderate nutrient additions on soil N2O fluxes and net soil N cycling rates, and (2) assess the contributions of nitrification and denitrification to soil N2O fluxes. By using an elevation gradient, we were also able to assess whether N2O fluxes and/or the microbial processes responsible for N2O production changed with the different environmental conditions associated with elevation (Supplementary Table 1). In response to nutrient addition, we hypothesized that soil N2O fluxes, together with net soil N cycling rates, would further increase as N and N + P additions continued, whereas the moderate P addition might begin to alleviate P limitation, enabling more N uptake and therefore decreasing soil N2O emissions.
Materials and Methods
Study Area
The study area was located in the Andes of southern Ecuador, in the provinces of Loja and Zamora Chinchipe. The experiment was conducted within and close to Podocarpus National Park, in three old-growth forest sites spanning an elevation gradient from 1000 to 3000 m above sea level (Supplementary Table 1; Homeier et al., 2012; Martinson et al., 2013). Forest types across the elevation gradient ranged from premontane at “1000 m” (990–1100 m), to lower montane at “2000 m” (1950–2100 m) and upper montane at “3000 m” (2900–3050 m) (Homeier et al., 2012). At 1000 m, sandy Cambisol soil (covered by only a thin layer of decomposing leaves) had developed from deeply weathered granitic rock (Litherland et al., 1994). At 2000 and 3000 m, loamy textured Cambisol and Histosol soil, respectively, had developed from metamorphic schists (Litherland et al., 1994); these soils were covered by 10–40 cm of thick organic layers (Supplementary Table 1). The study area displayed only slight seasonal variability (Emck, 2007). Mean annual air temperature decreased with elevation from 19.4°C at 1000 m, 15.4°C at 2000 m to 9.4°C at 3000 m. Mean annual precipitation ranged from 1950 mm yr−1 (2000 m) to 4500 mm yr−1 (3000 m), with intermediate rainfall of 2230 mm yr−1 at 1000 m (Moser et al., 2007). Ambient bulk and dry deposition of N and P in the study region ranged between 14 and 45 kg N ha−1 yr−1 and 0.4 and 4.9 kg P ha−1 yr−1, with an increasing tendency for deposition from 1998 to 2010 (Boy et al., 2008; Homeier et al., 2012) and thereafter (personal communication, W. Wilcke). Due to data gaps, we were not able to get detailed information on monthly rainfall during our measurement period. We attribute differences between the three forest sites to the combination of climatic, vegetation, and soil factors associated with the different elevations. However, the elevations themselves were not replicated, so our results may not represent these elevations in other TMF areas.
Experimental Design
At each elevation, we established nutrient manipulation experiments (NUMEX) with 16 plots (20 × 20 m each) equally distributed to four blocks. The four blocks served as replicates and included minimal topographic differences (50–100 m) within each elevation. Each block consisted of four plots: N, P, and N + P additions, and untreated controls; these plots were separated by at least 10 m (Homeier et al., 2013; Martinson et al., 2013). Fertilization started in 2008 with two equal applications per year (February/March and August/September), with the exception of 2010 when there was a 4-month delay of the second fertilization. Fertilizers were applied in solid form at rates of 50 kg N ha−1 yr−1 of urea (CH4N2O) and 10 kg P ha−1 yr−1 of sodium hydrogen phosphate (NaH2PO4·H2O and NaH2PO4·2H2O, with analytic grade quality).
Soil N2O Flux, Temperature, Moisture and Mineral N Concentrations
Measurements of soil N2O flux, temperature, moisture, and mineral N concentrations followed the same procedure described in detail by Martinson et al. (2013). Measurements were performed monthly from Month 35 to Month 56 of the experiment (with January 2008 defined as Month 1) in three out of the four blocks, with a minimum distance of 2 m to plot borders for the nutrient-addition plots. In each plot, measurements were conducted at four locations that were laid out in a stratified random pattern (Martinson et al., 2013); after Month 37, we added one additional location per plot as part of a small scale manipulation study, to measure soil trace gas fluxes. Since we were interested in long-term effects of nutrient deposition rather than the transitory peaks of N2O that occur after N addition, we only included measurements that were taken at least 3 weeks after fertilization. This timespan was chosen based on a study from our working group in Panama, where mineral N concentrations and N2O emissions peaked within 3 weeks following N application in a TMF (Koehler et al., 2009). As shown by Wullaert et al. (2010), we could assume that minimal leaching occurred during those 3 weeks; therefore, the N2O measured throughout the rest of the year can be considered a realistic long-term response to increasing soil nutrients.
Soil N2O fluxes were measured using static vented chambers with permanently installed round polyvinyl chloride chamber bases (area 0.04 m2, height 0.15 m, ~0.03 m inserted into the soil) and polyethylene chamber hoods with a Luer lock sampling port and a vent for pressure equilibrium (0.16 m height of chamber cover, 0.03 m overlapping width with chamber base for tight cover, and 12 L total volume). Gas samples were taken at 2, 14, 26, and 38 min or at 3, 13, 23, and 33 min after chamber closure and stored in pre-evacuated glass containers (60 ml vials until Month 40 and 12 ml Exetainers® afterwards). Gas samples were either analyzed in Ecuador or in Germany, after shipping as over-pressured samples in Labco Exetainers® (Labco Limited, UK). We have tested these Exetainers® for their quality during extended sample storage and aircraft transport (see also Glatzel and Well, 2008). Gas samples were analyzed using gas chromatographs (Shimadzu GC-14B, Duisburg, Germany for samples analyzed in Ecuador and GC 6000 Vega Series 2, Carlo Erba Instruments, Milan, Italy for samples analyzed in Germany; both of these and the standard gases are owned by our group and were calibrated regularly) equipped with an electron capture detector and autosamplers. Nitrous oxide concentrations were determined from the comparison of integrated peak areas from samples to three or four standard gases (ranging from 350 to 3000 ppb; Deuste Steininger GmbH, Mühlhausen, Germany). Fluxes of N2O, expressed as N2O-N flux per area (μg N m−2 h−1), were calculated from the linear increase of N2O concentration in the chamber headspace over time, corrected for the air pressure and temperature measured at the time of field sampling. Annual soil N2O fluxes were approximated by applying the trapezoid rule on time intervals between measured flux rates. Annual rates combine measurements from Months 1–21 (using data from Martinson et al., 2013) to Months 35–56 (this study), assuming constant flux rates per day.
Soil temperature was measured parallel to gas sampling at a 0.05-m depth close to each of the four chamber bases per plot using a GTH 175/Pt-E digital precision thermometer (Greisinger electronics GmbH, Regenstauf, Germany). Soil moisture and mineral N concentrations were determined parallel to gas sampling for each plot from pooled soil samples of the top 5 cm of soil, consisting of four samples taken within 1 m of each chamber. Soil moisture was determined by oven-drying subsamples at 105° C for at least 24 h and was expressed as percentage of water-filled pore space (WFPS) using the measured bulk densities in the top 5 cm of soil (reported by Martinson et al., 2013) and particle densities of 2.65 g cm−3 for mineral soil at 1000 m and 1.4 g cm−3 for organic layers at 2000 and 3000 m (Linn and Doran, 1984; Breuer et al., 2002). Soil extraction for mineral N concentration determination was carried out in-situ in order to avoid alterations of mineral N concentrations due to storage after field sampling (Arnold et al., 2008). A subsample of soil was added into a prepared extraction bottle with 150 ml of 0.5 mol l−1 K2SO4 solution. After returning to the laboratory on the same day, samples were shaken (1 h), filtered and kept frozen until lab analyses were conducted. Analysis of mineral and concentration was done at the University of Goettingen, using continuous flow injection colorimetry (Cenco/Skalar Instruments, Breda, Netherlands); was analyzed by the Berthelot reaction method (Skalar Method 155-000) and by the copper-cadmium reduction method with NH4Cl buffer but without ethylenediamine tetraacetic acid (Skalar Method 461-000).
Net Soil N Cycling Rates: Ammonification and Nitrification
Net rates of soil N cycling were determined three times, in Months 38 and 48 (just over 1 month and about 4 months following fertilization) and in Month 52 (about 2 months following fertilization), using the in-situ buried bag method (Hart et al., 1994). Two pairs of intact soil cores were taken from the top 5 cm of mineral soil (at 1000 m) or organic layer (at 2000 and 3000 m) in each plot of all four blocks. One soil core of each pair was extracted immediately in the field with 0.5 mol L−1 K2SO4 (as described above); the other soil core was put in a plastic bag, inserted back into the soil to incubate for 10 days and afterwards extracted. Net soil N cycling rates of each sampling pair were calculated by subtracting the initial soil mineral N concentrations from mineral N concentrations of incubated soils. Net ammonification is the difference in concentrations and net nitrification is the difference in the concentrations.
15N Tracing to 15N2O: Contributions of Nitrification and Denitrification to Soil N2O Flux
Short-term tracing from 15 or 15 to 15N2O was used to determine the contributions of nitrification and denitrification to soil N2O fluxes; we used the same method applied in a montane forest in Panama (Corre et al., 2014). Tracing was conducted in all four replicate plots of the control and N-addition treatments at all three elevations and was carried out in Month 43 and Month 49, 4, and 5 months after the last fertilization. In each of the four control or N-addition plots, two additional chamber bases (same dimensions and material as described above) were installed >10 m apart, at least 3 weeks prior to sampling. In N-addition plots, the bases were >2 m from plot edges. For the second sampling, the chamber bases were located close to the previous chambers of the same 15N source but always upslope to prevent any possible influences from previously applied 15N. Each of the two chambers in a plot was labeled separately with either 15 or 15.
The amounts of added 15N (either or ) were calculated based on the extant soil mineral N levels in the control and N-addition plots such that the added 15N would be at most 50% of the native levels and the volume of solution would not increase the soil moisture contents. In each plot, 0.52 mg 15N-KNO3 in 50 ml distilled water was applied to the soil within one chamber (0.04 m2 area) and 13.29 mg of 15N-(NH4)2SO4 in 50 ml distilled water was applied to the soil within the other chamber. Half of the amount of the 15N solution was injected about 25 cm deep with a side-port needle at several points inside the chamber. The other half was sprayed with a hand sprayer onto the surface of the soil after removal of the leaf litter layer (which was returned afterwards). Transparent plastic covers (0.9 × 0.6 m) were put 0.5 m above the chamber bases 1–2 days before labeling to prevent immediate leaching losses of the applied 15N tracers in case of rainfall. These applied amounts of 15 and 15 were the same for all plots and represented 3–30% and 7–46% of the native and levels, respectively, in the top 5 cm of soil across all control and N-addition plots.
Thirty minutes after 15N application, gas samples were taken with a syringe at 2, 17, and 32 min following chamber closure and stored as overpressured samples in 100 ml pre-evacuated glass vials with butyl rubber septa. These glass vials were tested as leak proof in an earlier study (Corre et al., 2014). Gas samples were analyzed for N2O concentrations using the same gas chromatograph described above and 15N2O was determined using isotope ratio mass spectrometry (IRMS; Finnigan DeltaPlus XP, Thermo Electron Corporation, Bremen, Germany). Following the third of the three gas samples per chamber, we took a soil sample of the top 5 cm in the center of each chamber base to determine soil moisture and mineral N concentrations following the procedures described above. Additionally, 15N from and was determined by the 15N diffusion procedures described in detail by Corre and Lamersdorf (2004) and analyzed using IRMS (Delta C, Finnigan MAT, Bremen, Germany). Contributions of nitrification and denitrification to soil N2O fluxes were calculated following the same calculations given by Corre et al. (2014).
Statistical Analysis
Data were checked for normality and homoscedasticity, and we used either square root or logarithmic transformation (adding a constant value if the dataset included negative values) for data with non-normal distribution and unequal variance. If after transformation the data were still non-normally distributed we used non-parametric statistical tests.
The influence of soil factors (moisture, temperature, mineral N concentrations) on soil N2O fluxes was assessed using Pearson's correlation tests: first, across the elevation gradient considering the control plots only to assess which of these soil factors control N2O fluxes under ambient nutrient conditions, and second for each elevation considering all treatment plots to determine if changes in these soil factors due to nutrient amendment influence changes in N2O fluxes. These analyses were conducted for the measurements from Month 35–56 on the treatment means (average of three replicate plots) on each sampling day.
Effects of elevation and nutrient addition on time series data (soil N2O flux, temperature, WFPS, mineral N concentration and net N-cycling rates) were assessed using linear mixed effects (LME) models (Piepho et al., 2004; Crawley, 2012). Analyses were based on plot means (the average of four or five chamber measurements for N2O and two measurements for net soil N cycling) with three replicate plots (for all parameters) or four replicate plots (for soil N-cycling rates). Elevation effects were assessed for control plots only and nutrient-addition effects were assessed separately for each of the three elevations. Elevation or treatments were considered fixed effects whereas sampling month and plot (as spatial replication) were included as random effects. The following structures were included in the LME model if this improved the relative goodness of the model fit based on the Akaike information criterion: (1) a first-order temporal autoregressive process accounting for decreasing correlation of measurements with increasing time difference (Zuur et al., 2009) and (2) a variance function varIdent to model heteroscedasticity of residual variances (Crawley, 2012). The significance of the fixed effects was then determined by analysis of variance and stepwise model simplification.
For the short-term 15N tracing method of N2O sources, we first assessed the effects of added 15N solution on soil parameters (mineral N concentrations, WFPS, / ratio) and soil N2O fluxes for each measurement campaign, elevation and treatment. We compared 15- with 15-labeled chambers and both with reference (without 15N) chambers that were measured in the nearest sampling months, using Paired T-tests. Second, we tested the differences in relative contributions of nitrification and denitrification to N2O fluxes between years for each elevation and treatment, between elevations for the control plots only and between treatments for each elevation, using either T-tests (independent and paired) or a Mann–Whitney U-test.
The significance level was defined at P ≤ 0.05 and mean values in the text are given with ± standard error (SE). Statistical analyses were conducted using R 2.14.0 (R Development Core Team, 2012).
Results
Effects of Elevation on Soil Temperature, Wfps, and Net N Cycling under Ambient Environmental Conditions
From Month 35 to 56, soil temperature and WFPS in the top 5 cm of soil in control plots differed between elevations (Table 1) but showed no clear seasonal pattern at any elevation. Soil temperature decreased with increasing elevation (P < 0.001), while WFPS was highest at 2000 m, followed by 3000 m and then 1000 m (P < 0.001).

Table 1. Mean (±SE, n = 3) soil temperature, water-filled pore space (WFPS) and N2O fluxes in tropical montane forests along a 1000-m to 3000-m elevation gradient.
Net ammonification rates in control plots did not differ across the elevation gradient (P = 0.126; Table 2), which was caused by the large spatial variability (i.e., large SE), but net nitrification rates were larger at 1000 m than at 2000 and 3000 m (P < 0.001; Table 2). At all elevations, the dominant form of mineral N in the top 5 cm of soil was (Table 2). Soil was higher at 1000 and 2000 m compared to 3000 m (P < 0.001), and did not vary markedly between the measurement periods. Similar to net nitrification, decreased with increasing elevation (P < 0.001; Table 2), and larger concentrations at 1000 m during Month 38, Months 47–48, and Months 55–56, and at 2000 m during Month 47, coincided with months of large litterfall (Homeier et al., unpublished data on litterfall).
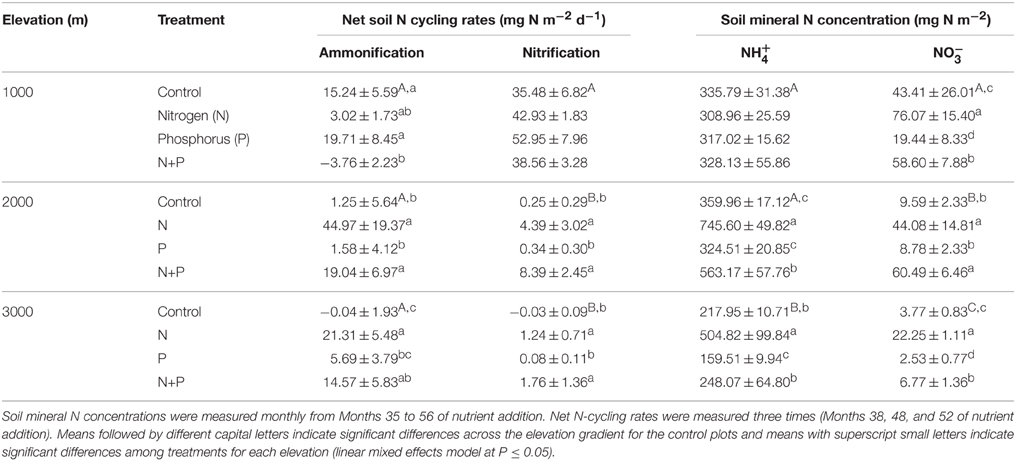
Table 2. Mean (±SE) net soil N cycling rates (n = 4) and soil mineral N concentrations (n = 3) in the top 5 cm of tropical montane forest soils along a 1000-m to 3000-m elevation gradient.
Effects of Elevation on Soil N2O Fluxes under Ambient Environmental Conditions
Soil N2O fluxes in control plots decreased with increasing elevation; hourly fluxes at 1000 m were more than three times larger than at 2000 m and more than 13 times larger than at 3000 m (Table 1). Temporal variability of N2O fluxes from the control plots was largest at 1000 m, but there was no clear seasonal trend (Figure 1).
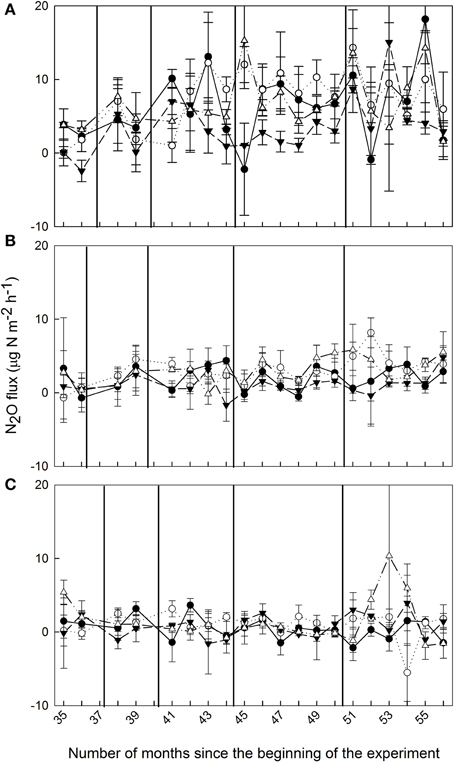
Figure 1. Mean (±SE, n = 3) soil N2O fluxes (μg N m−2 h−1) from montane forests at (A) 1000 m, (B) 2000 m, and (C) 3000 m during Months 35–56 of nutrient manipulation: control (filled circle), N addition (open circle), P addition (filled triangle), and N + P addition (open triangle). Vertical lines indicate fertilization events.
In the control plots at each elevation, addition of 15N solutions for the short-term 15N tracing of N2O did not affect soil N2O fluxes, WFPS or mineral N concentrations (P≥0.060) as compared to the reference (without 15N) chambers, except at 2000 m during the first measurement campaign, where addition of 15 solution increased soil concentrations (P < 0.009). The relative contributions of nitrification and denitrification to N2O fluxes did not differ between the two measurement campaigns (P≥0.500), and hence we report the means (±SE, n = 4) of these two periods. Denitrification dominated N2O fluxes in control plots along the elevation gradient with contributions of 67 ± 26% at 1000 m, 100 ± 0% at 2000 m and 98 ± 3% at 3000 m (Figure 2). There was a larger contribution of nitrification to N2O fluxes at 1000 m than at 2000 m (P = 0.029). The amounts of 15N2O emitted during 30 min of chamber closure were very small: up to 0.003% of soil 15 and up to 0.755% of soil 15 in the top 5 cm of soil across the elevation gradient.
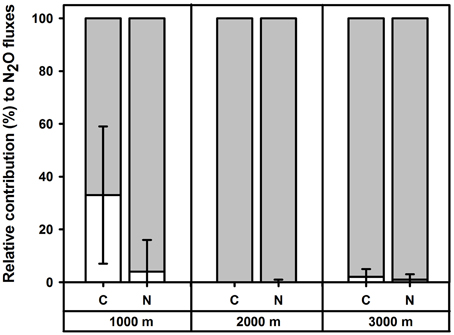
Figure 2. Mean (±SE, n = 4) relative contribution (%) of nitrification (white) and denitrification (shaded) to soil N2O fluxes in the top 5 cm of forest soils along an elevation gradient, measured in Month 43 and 49 of experimental nutrient addition.
Across the elevation gradient, soil N2O fluxes from control plots were positively correlated with soil temperature and (Table 3). Soil temperature and soil concentration were negatively correlated with WFPS. Soil temperature was positively correlated with soil and concentrations. Soil and concentrations were also positively correlated. Correlation tests performed for each elevation revealed significant correlations at 1000 m only: positive correlations between soil N2O fluxes and WFPS (r2 = 0.59; P = 0.004; n = 22) and between soil temperature and concentrations (r2 = 0.52; P = 0.013; n = 22).
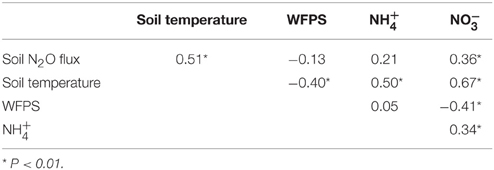
Table 3. Pearson correlation coefficients for monthly average (n = 66) soil N2O flux (μg N m−2 h−1), soil temperature (°C), water-filled pore space (WFPS; %), and mineral N concentrations (mg N m−2) in control plots of forests across an elevation gradient.
Effects of Nutrient Addition on Soil Temperature, WFPS, and Net N Cycling Across an Elevation Gradient
Soil temperature and WFPS measured between Month 35 and 56 differed between treatments only at 3000 m (P < 0.001; Table 1). Soil temperature was higher in P plots compared to all other treatments (P = 0.006–0.033) whereas WFPS was lower in N + P plots compared to control (P = 0.013) and N plots (P = 0.026).
Soil mineral N concentrations measured monthly between Month 35 and 56 were also influenced by nutrient addition (Table 2). At 1000 m, concentrations did not differ between treatments (P = 0.601) whereas concentrations decreased in the order of N, N + P, control, and P plots (P ≤ 0.017; Table 2). At 2000 m, concentrations in N and N + P plots were larger than in control plots (P < 0.005) with concentrations in N plots being larger than in N + P plots (P = 0.007). Soil concentrations displayed similar differences between treatments as that of (Table 2). At 3000 m, concentrations were higher in N plots and lower in P plots compared to control and N + P plots (P < 0.001) whereas concentrations displayed the same treatment differences described for 1000 m with descending concentrations in the order of N, N + P, control, and P plots (P < 0.001; Table 2).
Nutrient addition affected net soil N cycling rates across all elevations (Table 2). At 1000 m, net ammonification rates decreased in N + P plots (P = 0.017) compared to control and P plots (P = 0.004) whereas the N plots showed intermediate rates (Table 2). There was no treatment difference detected for net nitrification rates (P = 0.357). At 2000 m, net ammonification and nitrification rates increased in N and N + P plots compared to control and P plots (P = 0.001–0.033; Table 2). At 3000 m, net ammonification rates increased in N (P = 0.001) and N + P plots (P = 0.007) compared to control plots, and P plots did not differ from the control (P = 0.196; Table 2). Furthermore, net ammonification rates in N plots were higher than in P plots (P = 0.029). Net nitrification rates increased in N (P = 0.011) and N + P plots (P = 0.005) whereas P plots were comparable with the control (P = 0.536).
Effects of Nutrient Addition on Soil N2O Fluxes Across an Elevation Gradient
At 1000 m, over the entire measurement period, soil N2O fluxes from nutrient-amended plots were not different from control plots (P = 0.059–0.146; Figure 1A, Table 1). The P plots, however, had lower soil N2O fluxes compared to N (P = 0.001) and N + P plots (P = 0.004) (Table 1). At 2000 m, nutrient additions had the same effects as at 1000 m; N2O fluxes from nutrient-amended plots were not significantly different than control plots (P = 0.119–0.128), but P plots had lower soil N2O fluxes compared to N and N + P plots (both P = 0.002; Figure 1B, Table 1). At 3000 m, there were no detectable treatment differences in soil N2O fluxes (P = 0.391–0.651; Figure 1C, Table 1).
For the short-term 15N tracing method of N2O sources, addition of 15N solutions did not affect soil N2O fluxes, WFPS or mineral N concentrations (P≥0.062) as compared to the reference chambers in each N plot at each elevation. Relative contributions of nitrification and denitrification to soil N2O fluxes did not differ between the two measurement campaigns for each treatment (P≥0.500) and hence we reported the average values of these two measurements. We did not detect a significant difference in the sources of N2O fluxes between control and N plots at any elevation (P = 0.625) and mean (± SE, n = 4) contributions of denitrification to N2O fluxes in N plots were 96 ± 12% at 1000 m, 100 ± 1% at 2000 m and 99 ± 2% at 3000 m (Figure 2). The amounts of 15N2O emitted during 30 min of chamber closure were maximally 0.004% of soil 15 and 0.065% of soil 15 in the top 5 cm across the elevation gradient.
Across all treatments plots for each elevation, correlations of soil N2O fluxes with soil temperature, WFPS and mineral N varied (Table 4). At 1000 m, N2O fluxes were positively correlated with WFPS. At 2000 m, there was a positive correlation of N2O fluxes with WFPS, and concentrations. At 3000 m, we did not detect any significant correlation between N2O fluxes and these controlling soil factors.
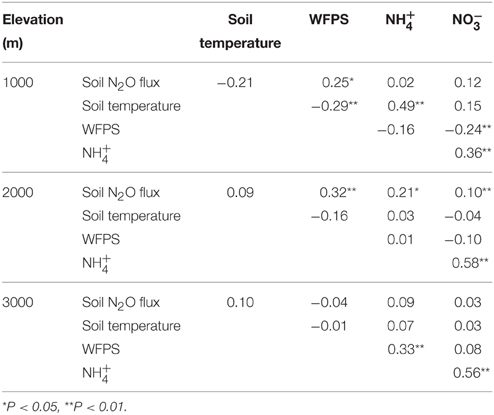
Table 4. Pearson correlation coefficients for monthly average (n = 80) soil N2O flux (μg N m−2 h−1), soil temperature (°C), water-filled pore space (WFPS; %), and mineral N concentrations (mg N m−2) of all treatment plots of forests along an elevation gradient.
Discussion
Effects of Elevation on Soil N2O Fluxes and Controlling Factors under Ambient Environmental Conditions
Annual soil N2O fluxes from control plots across the elevation gradient (Table 1) were lower than those from other TMFs at comparable elevations that reported in-situ, year-round measurements, e.g., in Indonesia (0.29–1.11 kg N2O-N ha−1 yr−1; Purbopuspito et al., 2006), Panama (1.13 kg N2O-N ha−1 yr−1; Koehler et al., 2009), Brazil (0.96 kg N2O-N ha−1 yr−1; Sousa Neto et al., 2011), and Peru (0.44–2.23 kg N2O-N ha−1 yr−1; Teh et al., 2014). Our hourly N2O fluxes (Table 1) were, however, within the range of others reported from our general study area (Wolf et al., 2011) as well as those previously measured from our same control sites (−0.03 to 0.24 kg N2O-N ha−1 yr−1 in 2008 and −0.34 to 0.48 kg N2O-N ha−1 yr−1 in 2009; Martinson et al., 2013).
According to the hole-in-the-pipe (HIP) model, the amount of gaseous N loss from soils is primarily controlled by soil N availability, which is commonly measured using the soil N cycling rate (Firestone and Davidson, 1989; Davidson et al., 2000). We compared the net soil N cycling rates from our control plots (Table 2) with published data from other old-growth TMFs that used in-situ incubation of intact soil cores. Along our elevation gradient, net nitrification in the top 5 cm of soil was highest at 1000 m, likely reflecting the lower organic C and WFPS at 1000 m as compared to the higher elevations (Martinson et al., 2013). However, our net N cycling rates from 1000 m were lower than values reported for TMFs on Andosol soils located between 700 and 1500 m in northwestern Ecuador and Costa Rica (Arnold, 2008; Arnold et al., 2009). Similarly, net nitrification rates in the top 5 cm of the organic layer in an Andosol soil at 1200 m in Panama (Koehler et al., 2009) were more than 10 times higher than values from the same depth of organic layers in our Cambisol soil at 2000 m and our Histosol soil at 3000 m. A separate study carried out at our study sites showed that gross rates of mineral N production (N mineralization and nitrification) in our control plots were low and closely coupled with microbial N immobilization (Baldos et al., 2015), which is typical for conservative soil N cycling and supports our low net soil N cycling rates. Therefore, it is not surprising that the N2O losses from our study sites were very low, with mean daily N2O fluxes (Table 1) accounting for only 0.02–0.06% of gross N mineralization rates (used as an index of soil available N, ranging from 60 ± 10 mg N m−2 d−1 at 3000 m over 191 ± 53 mg N m−2 d−1 at 2000 m to 235 ± 30 mg N m−2 d−1 at 1000 m in the top 5 cm of soil; Baldos et al., 2015). This was comparable with the 0.06% N2O loss in proportion to gross N mineralization rate in the top 5 cm of soil reported for a TMF in Panama (Corre et al., 2014).
The second level of control on gaseous N losses from soils in the HIP model is the soil aeration status, usually represented by the soil WFPS, which influences the relative contributions of nitrification and denitrification to gaseous N losses. Denitrification is proposed to become the dominant source of N2O fluxes above a threshold value of 60% WFPS (Davidson et al., 2000) and to become the only N2O source at WFPS >70% (Davidson, 1991; Machefert and Dise, 2004; Bateman and Baggs, 2005). Although, WFPS in the top 5 cm of soil only surpassed these threshold values at 2000 m (Table 1), the 15N tracing method showed that denitrification was the dominant source of N2O at 1000 m and the only N2O source at 2000 and 3000 m. However, in previous studies, it has been shown that WFPS threshold values can vary substantially depending on soil texture; for example, in acid brown earth (Cambisol) with 48% sand in Northern Ireland, 60–80% of N2O was derived from denitrification at 40% WFPS (Stevens et al., 1997). This is comparable to our results from the sandy loam mineral soil (Cambisol) at 1000 m. At 2000 and 3000 m, the 59–71% WFPS in the top 5 cm of the organic layer should theoretically have included some nitrification-derived N2O fluxes. However, these organic layers had very high gravimetric soil moisture contents (on average, 3.4 and 4.9 g g−1) due to the high water holding capacity of the organic matter (Hudson, 1994). To illustrate this: approximately 27–30 kg H2O m−2 was stored in the top 5 cm organic layer, which was much more than the approximately 15 kg H2O m−2 stored in the top 5 cm of mineral soil at 1000 m. Such high gravimetric water contents in organic layers can create plenty of anaerobic microsites in which denitrification can occur despite the relatively low total WFPS. Indeed, the positive correlations between N2O flux and (Table 3) also supported our results from the 15N tracing method that denitrification was the dominant N2O source. Thus, our findings illustrate that in contrast to mineral soils, different threshold values of WFPS should be used for organic layers in estimating limits of the relative importance of nitrification and denitrification as N2O sources.
N-addition Effects on Soil N2O Fluxes
In partial confirmation of our hypothesis, concentrations (at all elevations), as well as net ammonification (at 2000 and 3000 m), net nitrification (at 2000 and 3000 m) and concentrations (at 2000 m), were all higher in N-amended (i.e., N and N + P) plots as compared to control plots (Table 2). These observed increases were supported by the increased gross rates of N mineralization and nitrification and decreases in microbial immobilization of and , which were measured in the third and fourth year of nutrient manipulation at our sites (Baldos et al., 2015). However, in contrast to our hypothesis, these increases in net and gross rates of mineral N production and mineral N levels did not lead to increases in N2O fluxes in N-amended plots relative to the control (Table 1; Figure 1). This does not mean that denitrification was not occurring, though, but may instead be an indication that produced N2O was being further reduced to N2. In the 15N tracing experiment, although denitrification was the main N2O source, emitted 15N2O accounted for maximally 0.065% of soil 15 (see Results: effects of nutrient addition on N2O). This low percentage suggests that there may have been further reduction of N2O to N2. Reduction to N2 is possible in soils, given favorable anaerobic microsites, high soil carbon and low soil levels (Weier et al., 1993). Such conditions were present in our sites, especially at the higher elevations with thick organic layers (see the discussion of water in organic layers above). Therefore, the combination of anaerobic microsites, with low concentrations (Table 2) and presumably high labile carbon in organic layers, may have resulted in high N2/N2O ratios, where losses via denitrification were dominated by N2 (Weier et al., 1993). Chronic N addition can cause increases in levels and decreases in soil pH, which then inhibit N2O to N2 reduction; this was observed in an Andosol soil from a montane forest in Panama (Koehler et al., 2009, 2012; Corre et al., 2014). The increases in levels in our N-amended plots (Table 2), however, were much lower than those observed from the Panamanian montane forest soil, which received 4 years of 125 kg N ha−1 yr−1 (with resulting levels as high as 50–60 mg N m−2 in the organic layer and 112–183 mg N m−2 in the mineral soil). Our moderate levels of nutrient addition were probably the reason why soil pH in our N-amended plots did not yet differ significantly from the control plots even after 4 years (Baldos et al., 2015).
After the first 21 months of N addition to our sites, Martinson et al. (2013) reported that net nitrification at all elevations increased slightly and that these increases were accompanied by small increases in N2O fluxes during the second year of N addition. Although we again observed higher N cycling with N addition in Months 35–56 (Table 2), we did not measure higher N2O emissions with N addition (Table 1; Figure 1). Whether an increase in soil N availability (e.g., mineral N concentrations, net/gross rates of mineral N production) results in an increase in N2O fluxes can depend on inter-annual variations in climate. In our results, the positive correlation of N2O fluxes with WFPS at 1000 m, both in control plots (see Results: control plots) and across all treatments (Table 4), clearly indicates that there was a soil moisture control on N2O fluxes. Additionally, at 2000 m, the correlations across treatments showed that a combination of changes in soil mineral N concentrations and moisture contents was controlling N2O fluxes (Table 3). Corre et al. (2014) showed that the N2O response to chronic N addition in tropical forest soils will tend to be more pronounced in wet years as opposed to dry years. They also showed that even small changes in moisture can strongly affect N2O; a decrease of 7% in the seasonal average WFPS, corresponded to a 50% decrease in N2O emissions (Corre et al., 2014).
Martinson et al. (2013) reported N2O flux measurements from the initial 21 months of our study, but they had no information regarding the processes responsible for the observed emissions. Given the additional information from this study, we can now infer that the fluxes measured by Martinson et al. (2013) were predominantly denitrification-related and that gaseous N loss was likely dominated by N2 rather than the small emissions of N2O that they observed. We also know that WFPS from Months 35 to 56 (43–71%; Table 1) was lower than that measured from Months 1 to 21 of nutrient manipulation (63–88% WFPS; Martinson et al., 2013). Thus, the difference in the response of N2O fluxes to N addition between the two study periods could be reflecting a general dampening of denitrification activity from the slightly wetter Months 1–21 to the slightly drier Months 35–56, which effectively removed the measureable response to N addition (i.e., the already low N2O fluxes), while N2 emissions may have continued to be elevated.
P-addition Effects on Soil N2O Fluxes
As we hypothesized, we began to see P-addition effects on N2O fluxes during our study period (Months 35–56), which were not present during the initial 2 years (Months 1–21) of nutrient manipulation (Martinson et al., 2013). At 1000 and 2000 m, soil N2O fluxes in P plots were significantly lower than fluxes from N-amended plots, with the same trend—although not significant—when compared to control (Table 1; Figures 1A,B). This may have been related to changes in aboveground net primary production (ANPP) with P addition. Across our elevation gradient, ANPP was limited by P and/or co-limited by N + P, as shown by the trend toward higher basal area increment, which was already evident after 1 year of P addition (at 1000 and 2000 m) and N + P addition (at all elevations) (Homeier et al., 2012, 2013). If P addition increased ANPP, there may have been an increase in plant uptake of other soil nutrients, including soil mineral N. Since P addition did not change net (Table 3) or gross (Baldos et al., 2015) rates of mineral N production, an increase in uptake of soil mineral N by plants would lead to lower mineral N levels in P plots; although not always significant, we did measure lower mineral N concentrations (especially ) in soils of P plots at 1000 and 2000 m (Table 2). Since was the main substrate for N2O production across our elevation gradient, decreased concentrations in P plots may have led to reduced N2O fluxes. Similar results were observed in a 6-year old leguminous tree plantation in Indonesia, where P addition alleviated plant P limitation and increased root N uptake, resulting in decreased mineral N concentrations and N2O fluxes (Mori et al., 2013).
At 3000 m, we possibly observed the same mechanism (i.e., P addition catalyzing N uptake) with slightly different results. At this elevation, there were significant decreases in and concentrations (Table 2) with no significant change to N2O fluxes. We attribute this to the fact that initial fluxes of N2O were too low to detect a decrease (Table 1; Figure 1C). This idea is supported by the fact that N2O fluxes at 3000 m were not correlated with any of the measured soil factors, neither for control plots nor across all treatments (Tables 3, 4), which again suggests that the N2O fluxes were too low (mostly fluctuating around zero; Figure 1C) to generate any significant relationships with the soil factors known to control N2O fluxes.
As shown in the N-addition section above, the effects of N + P addition on net N cycling and soil mineral N concentrations followed the same trends as those for N addition alone (Table 2). However, it is notable that the increases as a result of N addition in the N + P plots were not as strong as the increases in the N plots, presumably because of the opposing effect of P addition. Although N-cycling responses to P addition appeared to be delayed as compared to responses to N addition (i.e., there were no significant effects of P addition during the initial 21 months reported by Martinson et al., 2013), the presence of P in atmospheric deposition could be an important long-term control on N2O fluxes in ecosystems where deposition of both nutrients is occurring. For example, although our study did not show any nutrient-addition effects on N2O fluxes, Baral et al. (2014) in a different study related to N2O fluxes also observed that added P addition increased plant N uptake; in their case this resulted in significantly less N2O emissions with N + P addition as compared to N addition alone.
Conclusion
We have shown that soil N2O fluxes in our study sites were among the lowest measured in TMFs and that denitrification was the main source of N2O, which was possibly being produced in anaerobic microsites. We attribute the low N2O fluxes to the conservative soil N cycling along our elevation gradient (Baldos et al., 2015), and the combination of low concentrations and presumably high available C in the organic layers (at 2000 and 3000 m) which could favor the already low gaseous N losses to be dominated by N2. In contrast to the first 21 months of this study (Martinson et al., 2013) we did not detect significant increases in N2O fluxes in Months 35–56, despite an increase in soil N availability. This may be due to the generally low N2O fluxes during our measurement period, which we in turn attribute to the lower rainfall and soil moisture contents during our study period. However, we did detect a reduction in soil mineral N concentrations and N2O fluxes with P addition, in contrast to the first 21 months when no effects were observed (Martinson et al., 2013). The significant P effect during our study period was probably due to increased uptake of soil mineral N by vegetation after an extended period of P addition, since P is a limiting element for ANPP at our sites (Homeier et al., 2012, 2013). Nitrogen plus phosphorus addition showed similar trends in net rates of mineral N production, mineral N concentrations and N2O fluxes to those with N addition alone, although to a lesser degree because of the counteracting effects of P addition. This 5-year study (the work of Martinson et al., 2013 together with our results), strongly illustrated that effects of nutrient addition on soil N2O fluxes are not always linear with time of exposure. We observed large inter-annual variation in N2O responses, which we primarily attributed to changes of soil moisture conditions, combined with soil characteristics such as texture and organic C content. Without this multiple-year study we would not have been able to detect these changes in nutrient response over time.
Author Contributions
Substantial contributions were achieved by all listed authors and were as follows:
Conception and design of the work: AKM, MC, EV
Acquisition of data: AKM, ALM
Analysis and Interpretation of data: AKM, ALM, MC, EV
Drafting and revising the work: AKM, ALM, MC, EV.
Conflict of Interest Statement
The authors declare that the research was conducted in the absence of any commercial or financial relationships that could be construed as a potential conflict of interest.
Acknowledgments
We thank Patricio Salas and Pablo Ramirez for excellent field and laboratory assistance; Norman Loftfield for help with the equipment; the laboratory staff of the Soil Science of Tropical and Subtropical Ecosystems, University of Goettingen for their assistance in laboratory analysis; the Ministeri del Ambiente for research permits; the Nature and Culture International in Loja for providing the study area and the research station; the Universidad Técnica Particular de Loja for cooperation, especially the soil science group with Juan Ignacio Burneo Valdivieso and Daniel Capa; the Deutsche Forschungsgemeinschaft for funding this study as subproject A7 (Ve 219/8-2) of the Research Group 816 “Biodiversity and Sustainable Management of a Megadiverse Mountain Ecosystem in south Ecuador.”
Supplementary Material
The Supplementary Material for this article can be found online at: https://www.frontiersin.org/article/10.3389/feart.2015.00066
Abbreviations
HIP, Hole-in-the-pipe; IRMS, Isotope ratio mass spectrometry; TMF, Tropical montane forest; WFPS, Water-filled pore space.
References
Aber, J., McDowell, W., Nadelhoffer, K., Magill, A., Berntson, G., Kamakea, M., et al. (1998). Nitrogen saturation in temperate forest ecosystems: hypotheses revisited. Bioscience 48, 921–934. doi: 10.2307/1313296
Arnold, J. (2008). Internal Nitrogen Cycling in Tropical Forest Soils. Ph.D. dissertation, Georg-August-University of Göttingen.
Arnold, J., Corre, M. D., and Veldkamp, E. (2008). Cold storage and laboratory incubation of intact soil cores do not reflect in-situ nitrogen cycling rates of tropical forest soils. Soil Biol. Biochem. 40, 2480–2483. doi: 10.1016/j.soilbio.2008.06.001
Arnold, J., Corre, M. D., and Veldkamp, E. (2009). Soil N cycling in old-growth forests across an Andosol toposequence in Ecuador. For Ecol. Manag. 257, 2079–2087. doi: 10.1016/j.foreco.2009.02.014
Baldos, A. P., Corre, M. D., and Veldkamp, E. (2015). Responses of N cycling to nutrient inputs in forest soils across a 1000-3000-m elevation gradient in the Ecuadorian Andes. Ecology 96, 749–761. doi: 10.1890/14-0295.1
Baral, B. R. T., Kuyper, W., and Van Groenigen, J. W. (2014). Liebig's law of the minimum applied to a greenhouse gas: alleviation of P-limitation reduces soil N2O emission. Plant Soil 374, 539–548. doi: 10.1007/s11104-013-1913-8
Bateman, E. J., and Baggs, E. M. (2005). Contributions of nitrification and denitrification to N2O emissions from soils at different water-filled pore space. Biol. Fertil. Soils 41, 379–388. doi: 10.1007/s00374-005-0858-3
Boy, J., Rollenbeck, R., Valarezo, C., and Wilcke, W. (2008). Amazonian biomass burning-derived acid and nutrient deposition in the north Andean montane forest of Ecuador. Glob. Biogeochem. Cycles 22, GB4011. doi: 10.1029/2007gb003158
Breuer, L., Kiese, R., and Butterbach-Bahl, K. (2002). Temperature and moisture effects on nitrification rates in tropical rain-forest soils. Soil Sci. Soc. Am. J. 66, 834–844. doi: 10.2136/sssaj2002.8340
Butterbach-Bahl, K., Gasche, R., Huber, C. H., Kreutzer, K., and Papen, H. (1998). Impact of N-input by wet deposition on N-trace gas fluxes and CH4-oxidation in spruce forest ecosystems of the temperate zone in Europe. Atmos. Environ. 32, 559–564. doi: 10.1016/S1352-2310(97)00234-3
Chapuis-Lardy, L., Wrage, N., Metay, A., Chotte, J.-L., and Bernoux, M. (2007). Soils, a sink for N2O? A review. Glob. Change Biol. 13, 1–17. doi: 10.1111/j.1365-2486.2006.01280.x
Corre, M. D., and Lamersdorf, N. P. (2004). Reversal of nitrogen saturation after long-term deposition reduction: impact on soil nitrogen cycling. Ecology 85, 3090–3104. doi: 10.1890/03-0423
Corre, M. D., Sueta, J. P., and Veldkamp, E. (2014). Nitrogen-oxide emissions from tropical forest soils exposed to elevated nitrogen input strongly interact with rainfall quantity and seasonality. Biogeochemistry 118, 103–120. doi: 10.1007/s10533-013-9908-3
Corre, M. D., Veldkamp, E., Arnold, J., and Wright, S. J. (2010). Impact of elevated N input on soil N cycling and losses in old-growth lowland and montane forests in Panama. Ecology 91, 1715–1729. doi: 10.1890/09-0274.1
Davidson, E. A. (1991). “Fluxes of nitrous oxide and nitric oxide from terrestrial ecosystems,” in Microbial Production and Consumption of Greenhouse Gases: Methane, Nitrogen Oxides and Halomethanes, eds J. E. Rogers and W. B. Whitman (Washington, DC: American Society for Microbiology), 219–235.
Davidson, E. A., Keller, M., Erickson, H. E., Verchot, L. V., and Veldkamp, E. (2000). Testing a conceptual model of soil emissions of nitrous and nitric oxides. Bioscience 50, 667–680. doi: 10.1641/0006-3568(2000)050[0667:TACMOS]2.0.CO;2
Dechert, G., Veldkamp, E., and Brumme, R. (2005). Are partial nutrient balances suitable to evaluate nutrient sustainability of land use systems? Results from a case study in Central Sulawesi, Indonesia. Nutr. Cycling Agroecosyst. 72, 201–2012. doi: 10.1007/s10705-005-1546-2
Denman, K. L., Brasseur, G., Chidthaisong, A., Ciais, P., Cox, P., Dickinson, R., et al. (2007). “Couplings between changes in the climate system and biogeochemistry,” in Climate Change 2007: The Physical Science Basis. Contribution of Working Group I to the Fourth Assessment Report of the Intergovernmental Panel on Climate Change, eds S. Solomon, D. Qin, M. Manning, Z. Chen, M. Marquis, K. B. Averyt, M. Tignor, and H. L. Miller (Cambridge: Cambridge University Press), 499–588.
Ehhalt, D., Prather, M., Dentener, F., Derwent, R., Dlugokencky, E., Holland, E., et al. (2001). “Atmospheric chemistry and greenhouse gases,” in Climate Change 2001: The Scientific Basis. Contribution of Working Group I to the Third Assessment Report of the Intergovernmental Panel on Climate Change, eds J. T. Houghton, Y. Ding, D. J. Griggs, M. Noguer, P. J. van der Linden, X. Dai, K. Maskell, and C. A. Johnson (Cambridge: Cambridge University Press), 241–287.
Emck, P. (2007). A Climatology of South Ecuador with Special Focus on the Major Andean Ridge as Atlantic-Pacific Climate Divide. Dissertation, Friedrich-Alexander-University of Erlangen-Nürnberg.
FAO (1993). Forest Resources Assessment 1990 – Tropical Countries. FAO Forestry Paper 112, Food and Agricultural Organization of the United Nations, Rome.
Firestone, M. K., and Davidson, E. A. (1989). “Microbiological basis of NO and N2O production and consumption in soil,” in Exchange of Trace Gases Between Terrestrial Ecosystems and the Atmosphere, eds M. O. Andreae, D. S. Schimel (New York, NY: John Wiley), 7–21.
Glatzel, S., and Well, R. (2008). Evaluation of septum-capped vials for storage of gas samples during air transport. Environ. Monit. Assess. 136, 307–311. doi: 10.1007/s10661-007-9686-2
Gundersen, P., Emmett, B. A., Kjønaas, O. J., Koopmans, C. J., and Tietema, A. (1998). Impact of nitrogen deposition on nitrogen cycling in forests: as synthesis of NITREX data. For. Ecol. Manag. 101, 37–55. doi: 10.1016/S0378-1127(97)00124-2
Hall, S. J., and Matson, P. A. (1999). Nitrogen oxide emissions after nitrogen additions in tropical forests. Nature 400, 152–155. doi: 10.1038/22094
Hall, S. J., and Matson, P. A. (2003). Nutrient status of tropical rain forests influences soil N dynamics after N additions. Ecol. Monogr. 73, 107–129. doi: 10.1890/0012-9615(2003)073[0107:NSOTRF]2.0.CO;2
Hart, S. C., Stark, J. M., Davidson, E. A., and Firestone, M. K. (1994). “Nitrogen mineralization, immobilization and nitrification,” in Methods of Soil Analysis, Part 2: Microbial and Biochemical Properties, eds R. W. Weaver, J. S. Angle, P. J. Bottomley, D. F. Bezdicek, S. Smith, M. A. Tabatabai, et al. (Madison, WI: Soil Science Society of America Book Series), 985–1018.
Hedin, L. O., Vitousek, P. M., and Matson, P. A. (2003). Nutrient losses over four million years of tropical forest development. Ecology 84, 2231–2255. doi: 10.1890/02-4066
Hietz, P., Turner, B. L., Wanek, W., Richter, A., Nock, C. A., and Wright, S. J. (2011). Long-term change in the nitrogen cycle of tropical forests. Science 334, 664–666. doi: 10.1126/science.1211979
Homeier, J., Hertel, D., Camenzind, T., Cumbicus, N. L., Maraun, M., Martinson, G. O., et al. (2012). Tropical Andean Forests are highly susceptible to nutrient inputs – rapid effects of experimental N and P addition to an Ecuadorian montane forest. PLoS ONE 7:e47128. doi: 10.1371/journal.pone.0047128
Homeier, J., Leuschner, C., Bräuning, A., Cumbicus, N., Hertel, D., Martinson, G. O., et al. (2013). “Effects of nutrient addition on the productivity of montane forests and implications for the carbon cycle,” in Ecosystem Services, Biodiversity and Environmental Change in a Tropical Mountain Ecosystem of South Ecuador, eds J. Bendix, E. Beck, A. Bräuning, F. Makeschin, R. Mosandl, S. Scheu et al., (Berlin: Springer), 315–329. doi: 10.1007/978-3-642-38137-9_23
Hudson, B. (1994). Soil organic matter and available water capacity. J. Soil Water Conserv. 49, 189–194
Keller, M., Varner, R., Dias, J. D., Silva, H., Crill, P., Cosme de Oliveira, R. Jr., et al. (2005). Soil-atmosphere exchange of nitrous oxide, nitric oxide, methane, and carbon dioxide in logged and undisturbed forest in the Tapajos National Forest, Brazil. Earth Interact. 9, 1–28. doi: 10.1175/EI125.1
Koehler, B., Corre, M. D., Steger, K., Well, R., Zehe, E., Sueta, J. P., et al. (2012). An in-depth look into a tropical lowland forest soil: nitrogen-addition effects on the contents of N2O, CO2 and CH4 and N2O isotopic signatures down to 2-m depth. Biogeochemistry 111, 695–713. doi: 10.1007/s10533-012-9711-6
Koehler, B., Corre, M. D., Veldkamp, E., Wullaert, H., and Wright, S. J. (2009). Immediate and long-term nitrogen oxide emissions from tropical forest soils exposed to elevated nitrogen input. Glob. Change Biol. 15, 2049–2066. doi: 10.1111/j.1365-2486.2008.01826.x
Linn, D. M., and Doran, J. W. (1984). Effect of water-filled pore space on carbon dioxide and nitrous oxide production in tilled and nontilled soils. Soil Sci. Soc. Am. J. 48, 1267–1272. doi: 10.2136/sssaj1984.03615995004800060013x
Litherland, M., Aspden, J. A., and Jemielita, R. A. (1994). The metamorphic belts of Ecuador: British Geological Survey, Overseas Memoir 11. Nottingham: British Geological Survey.
Liu, L., and Graever, T. L. (2009). A review of nitrogen enrichment effects on three biogenic GHGs: the CO2 sink may be largely offset by stimulated N2O and CH4 emission. Ecol. Lett. 12, 1103–1117. doi: 10.1111/j.1461-0248.2009.01351.x
Machefert, S. E., and Dise, N. B. (2004). Hydrological controls on denitrification in riparian ecosystems. Hydrol. Earth Syst. Sci. 8, 686–694. doi: 10.5194/hess-8-686-2004
Mahowald, N. M., Artaxo, P., Baker, A. R., Jickells, T. D., Okin, G. S., Randerson, J. T., et al. (2005). Impacts of biomass burning emissions and land use change on Amazonian atmospheric phosphorus cycling and deposition. Glob. Biogeochem. Cycles 19, GB4030. doi: 10.1029/2005gb002541
Martinson, G. O., Corre, M. D., and Veldkamp, E. (2013). Responses of nitrous oxide fluxes and soil nitrogen cycling to nutrient additions in montane forests along an elevation gradient in southern Ecuador. Biogeochemistry 112, 625–636. doi: 10.1007/s10533-012-9753-9
Matson, P. A., and Vitousek, P. M. (1987). Cross-system comparisons of soil nitrogen transformations and nitrous oxide flux in tropical forest ecosystems. Glob. Biogeochem. Cycles 1, 163–170. doi: 10.1029/GB001i002p00163
Mori, T., Ohta, S., Ishizuka, S., Konda, R., Wicaksono, A., Heriyanto, J., et al. (2013). Soil greenhouse gas fluxes and C stocks as affected by phosphorus addition in a newly established Acacia mangium plantation in Indonesia. For. Ecol. Manag. 310, 643–651. doi: 10.1016/j.foreco.2013.08.010
Moser, G., Hertel, D., and Leuschner, C. (2007). Altitudinal change in LAI and stand leaf biomass in tropical montane forests: a transect study in Ecuador and a pan-tropical meta-analysis. Ecosystems 10, 924–935. doi: 10.1007/s10021-007-9063-6
Piepho, H. P., Büchse, A., and Richter, C. (2004). A mixed modelling approach for randomized experiments with repeated measures. J. Agron. Crop Sci. 190, 230–247. doi: 10.1111/j.1439-037X.2004.00097.x
Purbopuspito, J., Veldkamp, E., Brumme, R., and Murdiyarso, D. (2006). Trace gas fluxes and nitrogen cycling along an elevation sequence of tropical montane forests in Central Sulawesi, Indonesia. Glob. Biogeochem. Cycles 20:GB3010. doi: 10.1029/2005GB002516
R Development Core Team (2012). R: A Language and Environment for Statistical Computing. R Foundation for Statistical Computing, Vienna. Available online at: http://www.R-project.org/
Schwendenmann, L., and Veldkamp, E. (2005). The role of dissolved organic carbon, dissolved organic nitrogen, and dissolved inorganic nitrogen in a tropical wet forest ecosystem. Ecosystems 8, 330–351. doi: 10.1007/s10021-003-0088-1
Sousa Neto, E., Carmo, J. B., Keller, M., Martins, S. C., Alves, L. F., Vieira, S. A., et al. (2011). Soil-atmosphere exchange of nitrous oxide, methane and carbon dioxide in a gradient of elevation in the coastal Brazilian Atlantic forest. Biogeosciences 8, 733–742. doi: 10.5194/bg-8-733-2011
Stevens, R. J., Laughlin, R. J., Burns, L. C., Arah, J. R. M., and Hood, R. C. (1997). Measuring the contributions of nitrification and denitrification to the flux of nitrous oxide from soil. Soil Biol. Biochem. 29, 139–151. doi: 10.1016/S0038-0717(96)00303-3
Tanner, E. V. J., Vitousek, P. M., and Cuevas, E. (1998). Experimental investigation of nutrient limitation of forest growth on wet tropical mountains. Ecology 79, 10–22. doi: 10.1890/0012-9658(1998)079[0010:EIONLO]2.0.CO;2
Teh, Y. A., Diem, T., Jones, S., Huaraca Quispe, L. P., Baggs, E., Morley, N., et al. (2014). Methane and nitrous oxide fluxes across an elevation gradient in the tropical Peruvian Andes. Biogeosciences 11, 2325–2339. doi: 10.5194/bg-11-2325-2014
Vitousek, P. M., and Matson, P. A. (1988). Nitrogen transformations in a range of tropical forest soils. Soil Biol. Biochem. 20, 361–367. doi: 10.1016/0038-0717(88)90017-X
Wang, F., Li, J., Wang, X., Zhang, W., Zou, B., Neher, D. A., et al. (2014). Nitrogen and phosphorus addition impact soil N2O emission in a secondary tropical forest of South China. Sci. Rep. 4:5615. doi: 10.1038/srep05615
Weier, K. L., Doran, J. W., Power, J. F., and Walters, D. T. (1993). Denitrification and dinitrogen/nitrous oxide ratio as affected by soil water, available carbon, and nitrate. Soil Sci. Soc. Am. J. 57, 66–72. doi: 10.2136/sssaj1993.03615995005700010013x
Wolf, K., Veldkamp, E., Homeier, J., and Martinson, G. O. (2011). Nitrogen availability links forest productivity, soil nitrous aoxide and nitric oxide fluxes of a tropical montane forest in southern Ecuador. Glob. Biogeochem. Cycles 25, GB4009. doi: 10.1029/2010GB003876
Wullaert, H., Homeier, J., Valarezo, C., and Wilcke, W. (2010). Response of the N and P cycles of an old-growth montane forest in Ecuador to experimental low-level N and P amendments. For. Ecol. Manag. 260, 1434–1445. doi: 10.1016/j.foreco.2010.07.021
Keywords: denitrification, nitrification, net nitrogen cycling, nitrous oxide emissions, nitrogen addition, phosphorus addition, 15N tracing
Citation: Müller AK, Matson AL, Corre MD and Veldkamp E (2015) Soil N2O fluxes along an elevation gradient of tropical montane forests under experimental nitrogen and phosphorus addition. Front. Earth Sci. 3:66. doi: 10.3389/feart.2015.00066
Received: 18 June 2015; Accepted: 15 October 2015;
Published: 29 October 2015.
Edited by:
Selene Báez, Consorcio para el Desarrollo Sostenible de la Ecoregion Andina, EcuadorReviewed by:
Daniel P. Rasse, Norwegian Institute for Bioeconomy Research, NorwaySafya Menasseri-Aubry, Agrocampus Ouest, France
Copyright © 2015 Müller, Matson, Corre and Veldkamp. This is an open-access article distributed under the terms of the Creative Commons Attribution License (CC BY). The use, distribution or reproduction in other forums is permitted, provided the original author(s) or licensor are credited and that the original publication in this journal is cited, in accordance with accepted academic practice. No use, distribution or reproduction is permitted which does not comply with these terms.
*Correspondence: Anke K. Müller, amuelle8@gwdg.de