 Yaniv Olshansky
 Alissa M. White
 Bryan G. Moravec1
 Jon Chorover
- 1Department of Soil, Water and Environmental Science, The University of Arizona, Tucson, AZ, United States
- 2Department of Hydrology and Atmospheric Sciences, The University of Arizona, Tucson, AZ, United States
This study investigated the concentration discharge (C-Q) patterns of selected elements transported to streams during spring snowmelt through an instrumented mixed-conifer forested catchment in rhyolitic terrain in the Jemez Mountains (NM, United States). High frequency, concurrent sampling of soil solution and gasses, groundwater, and surface water enabled identification and sourcing of five groups of solutes with distinct C-Q behavior. Non-hydrolyzing cations and strong acid anions, had mostly positive C-Q relations and a clockwise hysteresis pattern related to flushing of a limited reservoir of solutes accumulated in soils under snowpack. Rare earth elements (REEs) and dissolved organic carbon (DOC), demonstrated large positive C-Q relations and a clockwise hysteresis pattern, consistent with their co-transport as metal-ligand complexes, and signaling biologically induced weathering reactions in the soil. Silicon and dissolved inorganic carbon (DIC) exhibited chemostatic C-Q trends and an anti-clockwise hysteresis pattern consistent with sourcing from deep groundwater. Hydrolyzing metals (Mn, Al, Ti, and Zr) with high coefficients of variance (CV) for concentration relative to CV values for stream discharge and with no significant C-Q pattern, were found to be transported mainly as filterable colloids. Fe C-Q behavior was similar to this hydrolyzing metals group, but complexation with DOC was also important for Fe during the initial stage of the snowmelt hydrograph. Investigation of time-series of solutes and gasses provided evidence for biologically induced silicate weathering reactions that initiated in the soil subsurface and propagated down through groundwater to streams.
Key Points
(1) Hydrologic and critical zone observatories provide opportunities for high frequency sensing and sampling to resolve coupled processes controlling catchment hydrochemical response.
(2) Cluster and principal components analysis of indices pertaining to concentration-discharge (C-Q) identified five groups of solutes with transport behavior governed by distinct hydrogeochemical processes.
(3) The results provide evidence of biologically influenced weathering reactions in soil and groundwater time-series that are propagated into stream C-Q relations.
Introduction
Solute concentration-discharge (C-Q) relations in streams contain useful information on flow paths and biogeochemical processes that occur during water transport through the critical zone (Chorover et al., 2017). During transport, water interacts with multiple CZ compartments, including soil pores, groundwater, and hyporheic zones, accumulating and redistributing solutes and suspended matter. The chemical signature of the water changes as a function of contact times and composition in these compartments as a result of thermodynamic and kinetically limited reactions (e.g., ion exchange, mineral transformation, organic matter decomposition), and mixing of different sources. Streamwater C-Q relations integrate these multiple upgradient CZ processes (Evans and Davies, 1998; Pokrovsky et al., 2006; Godsey et al., 2009; Bouchez et al., 2017; Winnick et al., 2017).
Concentration-discharge relations are defined as chemostatic or chemodynamic, depending on whether variation in concentration is negligible or significant, respectively, relative to variation in discharge (Godsey et al., 2009; Herndon et al., 2015). Large solute reservoirs and high chemical reaction rates relative to advective velocity are hypothesized to generate chemostatic C-Q relations (Godsey et al., 2009; Thompson et al., 2011; Vaughan et al., 2017), whereas supply limited conditions (i.e., small mass stores and low reaction rates) result in solute dilution (Maher, 2011). Solute accretion (i.e., increased concentration with discharge) has been attributed to flushing of a concentrated source (e.g., soil pore water, hyporheic zones) during high flow events (Hoagland et al., 2017; Vaughan et al., 2017). Positive C-Q relations may also result from colloid mobilization during high through-flux events (Trostle et al., 2016).
Hysteresis in C-Q relations between rising and falling hydrograph limbs provides additional information on processes controlling solute export to the stream. Higher solute concentrations on the rising versus falling limb (i.e., clockwise hysteresis), suggests limited solute supply from a proximal source (Evans and Davies, 1998; Chanat et al., 2002; Bowes et al., 2009, 2015; Vaughan et al., 2017), whereas the opposite trend suggests longer transport time and a distal solute source, or a change in rate of groundwater relative to near surface water discharge to the stream. Alternatively, non-stationary transit time distributions of waters through the subsurface may also result in hysteresis in the C-Q relation (Benettin et al., 2015; Winnick et al., 2017).
Most studies on C-Q relations have focused solely on measurements of stream water itself and general catchment characteristics (i.e., size, relief, and geology). To improve mechanistic interpretations, it should be beneficial to concurrently assess time-dependent hydrochemical behavior of upgradient sources (i.e., soil pore water and groundwater). Few prior studies have simultaneously collected time-series data on the chemistry and hydrologic response of soil water, groundwater and streams (Kim et al., 2014, 2017; Herndon et al., 2015; Hoagland et al., 2017). Furthermore, while stream hydrochemistry can vary significantly over the course of individual hydrologic events, sampling across a wide range of discharge is frequently limited to grab samples taken at random discharge levels often separated in time by days to weeks (Evans and Davies, 1998; Godsey et al., 2009; McIntosh et al., 2017). Several recent studies have indicated the need for higher (sub-daily) sampling frequency to better resolve system response to hydrologic events (Bowes et al., 2009; Kirchner and Neal, 2013; McIntosh et al., 2017). Prior work at the Jemez Critical Zone Observatory (NM, United States) has indicated that most of the groundwater recharge and the largest variation in stream discharge occurs during the annual snowmelt period, which is characterized by a single large stream hydrograph that extends over several weeks (Zapata-Rios et al., 2016). In the present study, we collected time series data across a snowmelt hydrograph at daily minimum and maximum streamflow, to test the hypotheses that (i) event-based changes in soil and groundwater chemistry would be reflected in stream C-Q relations and (ii) this would enable us to better resolve mechanistic controls over stream hydrochemistry. Therefore, the aim of this study was to link stream C-Q relations to hydrochemical dynamics in up gradient sources, by simultaneously probing soil, groundwater and stream hydrologic and hydrochemical response.
Materials and Methods
Site Description
The study site is part of the Jemez River Basin-Critical Zone Observatory (JRB-CZO) (Chorover et al., 2011), and the La Jara catchment studied here has been described in several prior publications (Perdrial et al., 2014, 2018; Vázquez-Ortega et al., 2015, 2016; Zapata-Rios et al., 2016; McIntosh et al., 2017). La Jara is a 3.3 km2 catchment extending in elevation from 3432 to 2728 m, draining the south facing slope of Redondo dome under montane mixed conifer forest within the Valles Caldera National Preserve (VCNP) in the Jemez Mountains of northern New Mexico (Figure 1). The upper headwaters include a highly instrumented 0.15 km2 zero order basin (ZOB). The La Jara catchment (LJ) and its nested ZOB are the focus of the current study. The site was impacted by the Thompson Ridge wildfire in May–June 2013 with medium to high severity burned areas distributed in a patch-wise fashion (Reale et al., 2015).
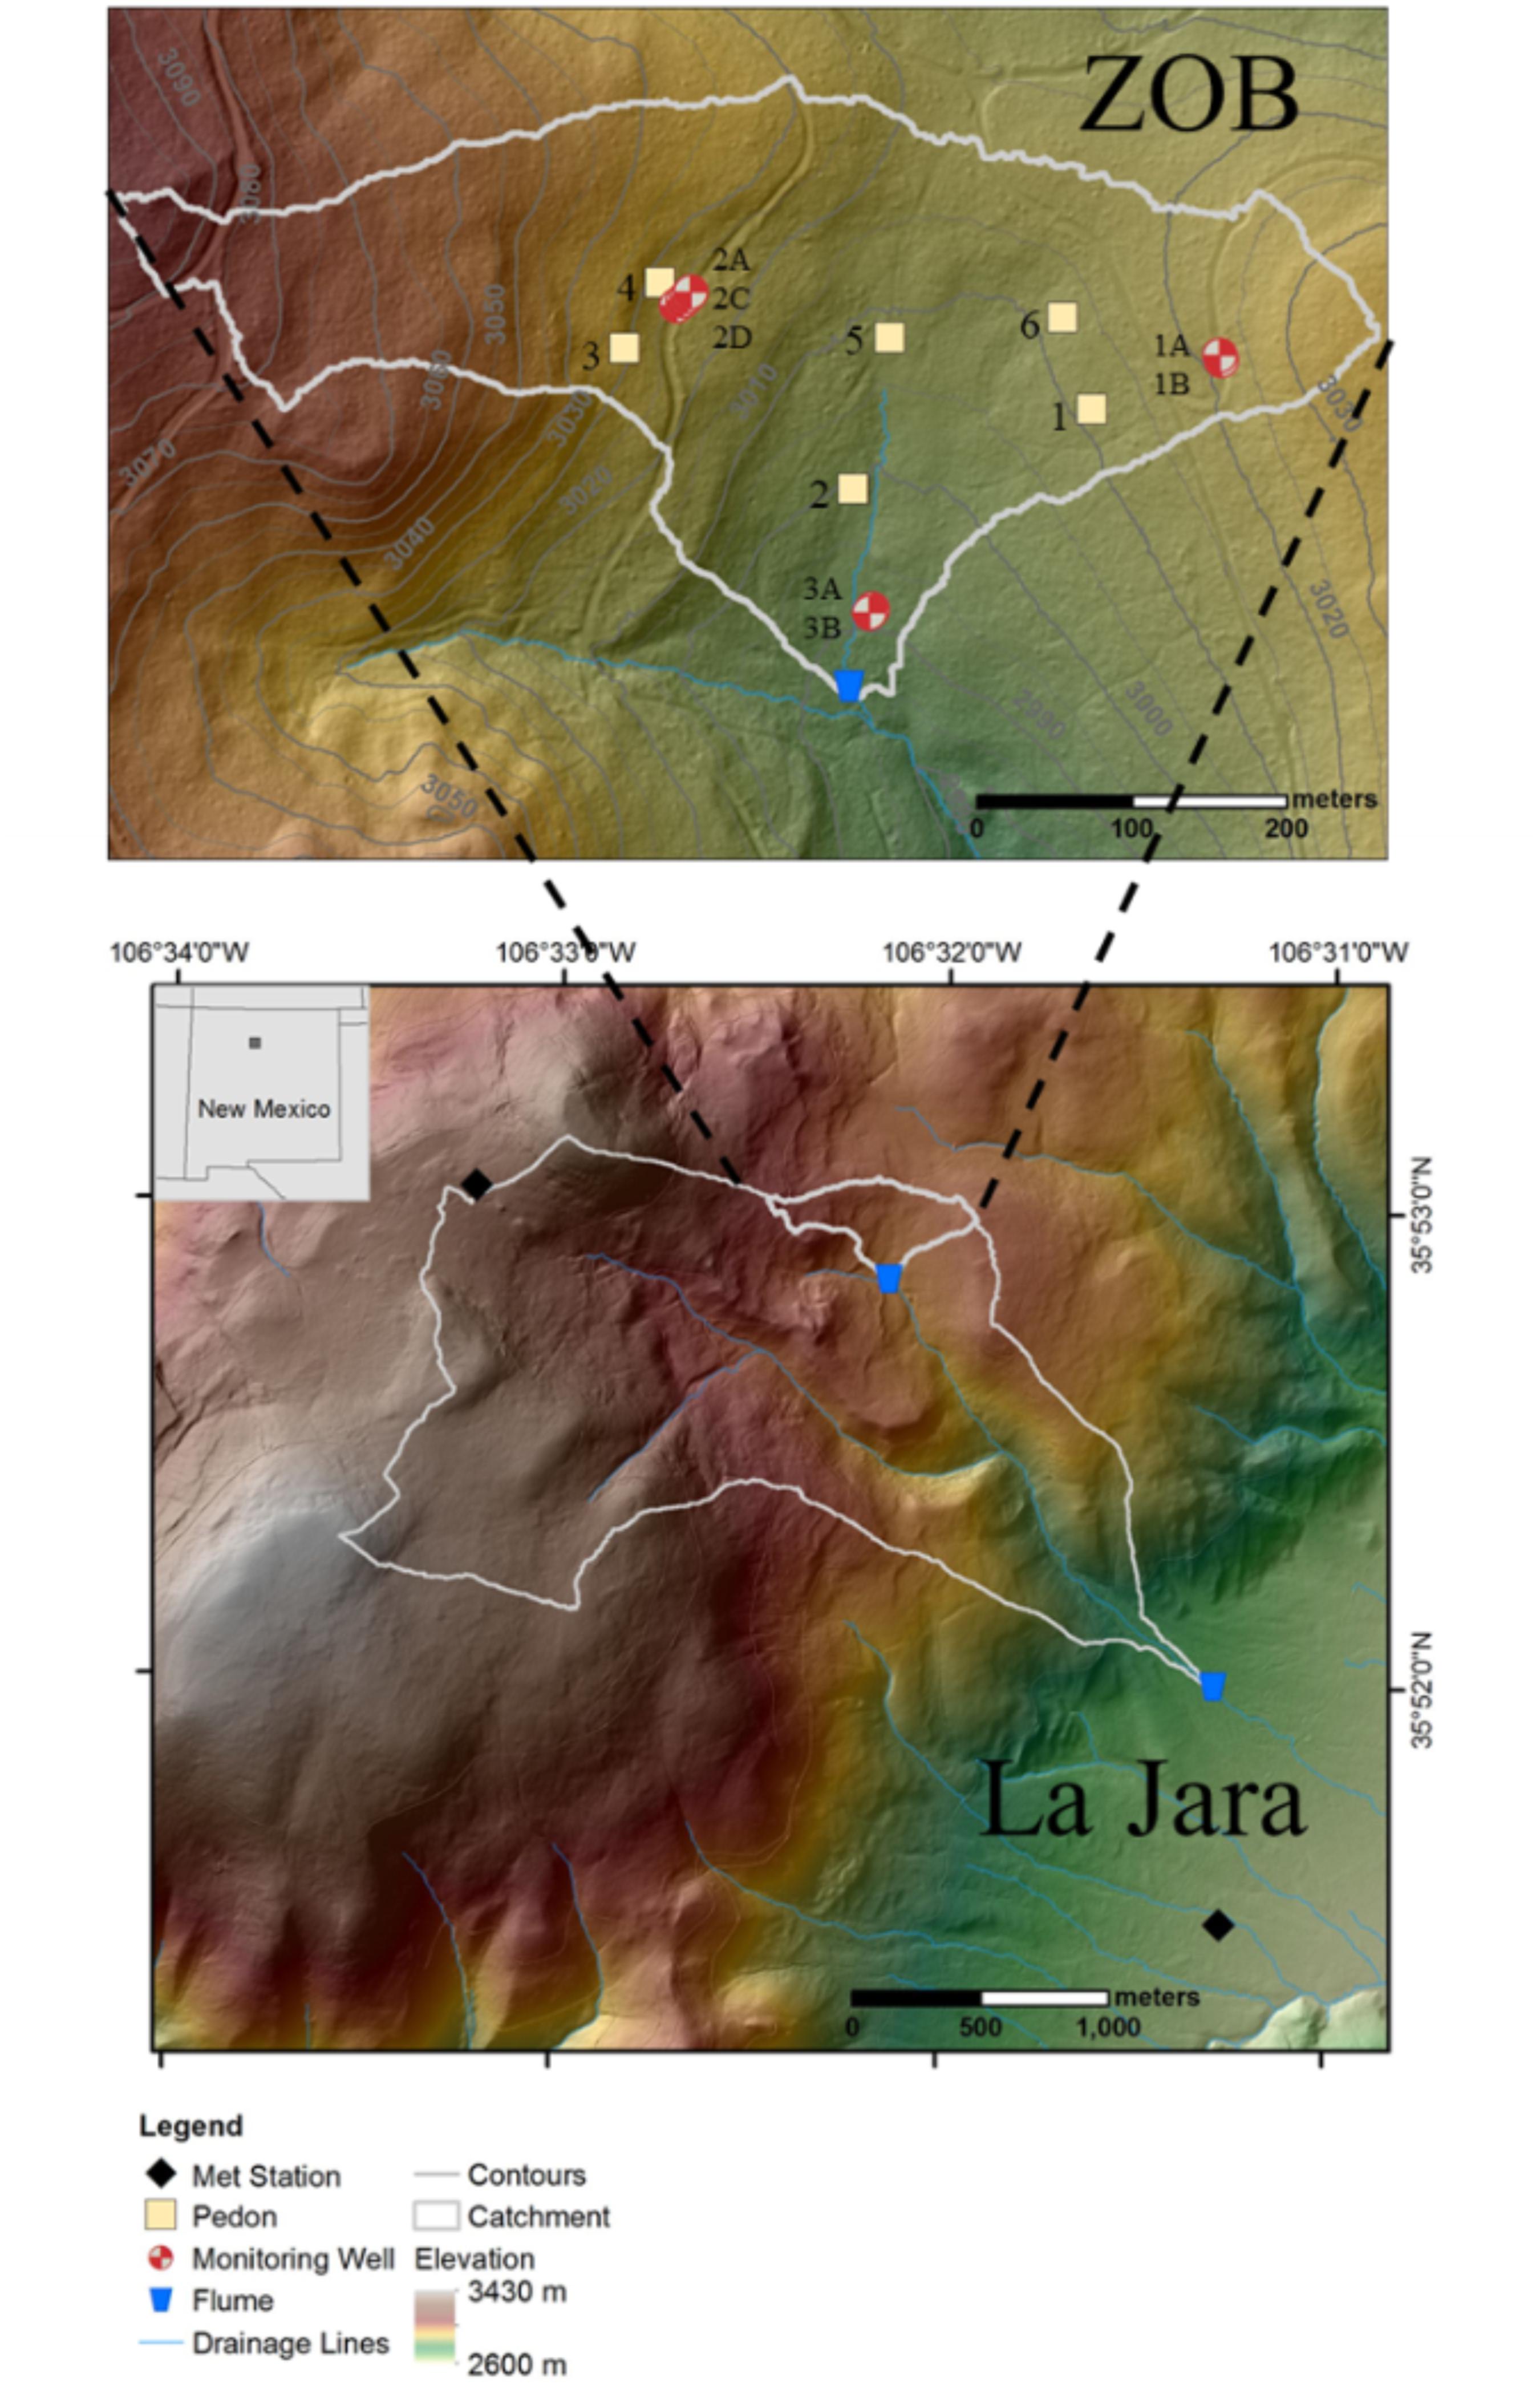
FIGURE 1. Digital elevation model (DEM) of the La Jara catchment (LJ, outline in white) based on 2010 LiDAR flight data. LJ drains the southeastern slope of Redondo Peak within the Valles Caldera National Preserve. The mixed conifer zero order basin (ZOB, also outlined in white and shown in expanded form in upper inset), is an instrumented sub-catchment nested within the LJ catchment. Sampling locations of meteorological stations, flumes, instrumented pedons and groundwater monitoring wells are indicated.
The instrumented ZOB and larger LJ catchment contain a mixture of the upper Tshirege member of Bandelier Tuff and caldera collapse breccias. While the LJ catchment is dominated by Bandelier Tuff, in the ZOB, these two geological substrates are bisected by a series of normal faults that lie parallel to the catchment axis. The Bandelier Tuff is rhyolitic welded to non-welded vitrophyre primarily made up of plagioclase, sanidine, quartz, pyroxene and biotite in a glass matrix intra-stratified by ash-fall deposits. Asymmetrical jointing in tuffs was observed from the surface to a depth of at least 50 m in drill cores excavated from the ZOB in June, 2016. Evidence of discontinuous hydrothermal alteration exists at the surface on some portions of the Bandelier Tuff, while upwelling of hydrothermal fluids has altered the volcaniclastics. Caldera collapse breccias consist primarily of reworked rhyolitic volcaniclastics and pre-caldera sedimentary rocks (Hulen and Nielson, 1986; Chipera et al., 2008).
Field Data and Sample Collection
Water dynamics in the LJ catchment during spring 2017 were measured using two meteorological stations, six instrumented pedons and five monitoring wells located in the ZOB, and two flumes located at the outlet of the ZOB and at the base of LJ catchment (Figure 1).
Meteorological data (i.e., air temperature, precipitation and snow depth) were obtained from the Valles Caldera National Preserve Headquarters Redondo Climate Stations1 (Figure 1). The Redondo station is located in the upper elevation of the LJ catchment close to the ZOB (hereafter upper LJ) whereas the Headquarters station is located closer to the LJ flume at the lower elevation of the catchment (hereafter lower LJ).
To probe the soil compartment of the CZ, six instrumented pedons were installed in the ZOB. Two pedons were located on the south-west facing slope, two were situated on the south-east facing slope, and two were placed in the convergent hollow (Figure 1). Soil volumetric water content (VWC) was measured continuously at three depths (10, 30, and 60 cm) in each of the six pedons, using 5TE sensors (Decagon, Pullman, WA, United States). Soil PCO2, and temperature were measured continuously at depths of 2, 10, 30, and 60 cm, with GMP222 (Vaisala Inc., Houston, TX, United States). Biweekly soil water samples were collected from each pedon at four soil horizon depths (10–130 cm), using Prenart SuperQuartz soil-water samplers (2 μm pore size, Prenart Equipment ApS, Frederiksberg, Denmark). A vacuum pump applied constant suction of 40 kPa to collect the samples into acid-washed high density polyethylene (HDPE) bottles.
Groundwater was monitored with five wells located on the south-west (site 1) and south-east (site 2) facing slopes of the ZOB (Figure 1). Well depths were 43, 39, 47, 32, and 7 m below ground surface (mbgs, corresponding to elevations of 2989, 2992, 2983, 2990, and 3014 m above mean sea level) for Well 1A, Well 1B, Well 2A, Well 2C, and Well 2D, respectively. Well 2D probes a shallow perched aquifer on the south-east facing slope. The groundwater table was monitored using vibrating wire piezometers (Model 4500, Geokon Inc., Lebanon, NH, United States). Water samples were collected bimonthly from March to November 2017 from wells 1A, 1B, 2A, and 2C into acid-washed HDPE bottles using a vacuum pump (as described for the soil water samples above). Daily samples were collected from well 2D into acid-washed 1 L polypropylene bottles using an automatic water sampler (Teledyne ISCO, NE, United States). The outlets of the ZOB and LJ catchment were installed with Parshall flumes fitted with pressure transducers (InSitu Level TROLL 500 15 psig Model: 89010) that measured stage heights continuously at 15 min intervals over the study period. Discharge was estimated using standard stage-discharge relationships for 12 or 18 inch Parshall flumes. Water samples from these flumes, were collected in 1 L polypropylene bottles, during the highest and lowest daily discharge, using an automatic water sampler.
Aqueous Sample Processing Prior to Analysis
All water samples were packed on ice and sent overnight to UA to be filtered within 48 h of collection using 0.45 μm nylon filters. Sample aliquots for dissolved inorganic and organic carbon [dissolved inorganic carbon (DIC) and dissolved organic carbon (DOC), respectively] were filtered through combusted 0.7 μm glass-fiber filters. A subset of samples was used to evaluate colloidal contribution to element concentrations. These samples were cascade filtered through a 1.2 μm polycarbonate filter, and then through a 0.025 μm cellulose acetate/nitrate filter. Element concentrations in the “colloidal fraction” were calculated as the difference in concentrations measured for the 1.2 and 0.025 μm filtrates.
Sample Analyses
Sample chemical analysis was performed at the University of Arizona Laboratory for Emerging Contaminants (ALEC). Sample aliquots for major and minor solutes (Na+, Mg2+, Al, Si, K+, Ca2+, Mn, Fe, Sr2+, and Zr) as well as lanthanide series elements (rare earth elements, REEs, hereafter designated as light, medium and heavy, LREE: La to Nd, MREE: Sm to Tb, HREE: Dy to Lu) were preserved in acid-washed HDPE bottles by acidification to ca. pH 2 using trace metal grade nitric acid. All water samples were stored at 4°C prior to analysis by inductively coupled plasma mass spectrometry (ICP-MS, Perkin Elmer ELAN DRC II ICP- MS, Shelton, CT prior to 2013; and thereafter Agilent 7700x) equipped with either a dynamic reaction (Perkin Elmer) or collision (Agilent) cell to eliminate molecular isobaric interferences. Rhodium (Rh) was included as an internal standard for Fe, Al, Mn, and P, and indium (In) was used as an internal standard for REE based on similarities in first ionization potential. Calibration curves included at least five points, and correlation coefficients were >0.995. Creation of a satisfactory calibration curve was followed by the analysis of an initial calibration blank (ICB) and calibration verification (ICV) solution, with a concentration in the low to midrange of the calibration curve. A continuing calibration blank (CCB) and continuing calibration verification (CCV) solution were measured after every 20 samples and at the end of each batch. Each batch also included measurement of at least one quality control (QC) solution from a second source, such as the NIST 1643e. Acceptable QC responses were between 90 and 110% of the certified value. DIC and DOC were measured using a Shimadzu TOC-VCSH analyzer (Shimadzu Scientific Instruments, Columbia, MD, United States). Major anions (Cl-, NO3-, SO42-, and PO4) were measured by ion chromatography (Dionex ICS-1000 equipped with an AS22 Analytical Column, Sunnyvale, CA, United States). Organic carbon molecular characterization was conducted by collecting UV-Vis absorbance spectra (190–655 nm) (Shimadzu Scientific Instruments UV-2501PC, Columbia, MD, United States), and fluorescence excitation–emission matrices (EEM) (FluoroMax-4 equipped with a 150 W Xe-arc lamp source, Horiba Jobin Yvon, Irvine, CA, United States). The EEMs were acquired by scanning excitation (Ex) from 200 to 450 nm and emission (Em) from 250 to 650 nm in 5 nm increments. Spectra were collected with Ex and Em slits at 5 and 2 nm band widths, respectively, with an integration time of 100 ms. Ultrapure water blank EEMs were subtracted and fluorescence intensities were normalized to the area under the water Raman peak, collected at an excitation of 350 nm. Inner-filter correction was performed based on the corresponding UV–Vis scans (Murphy et al., 2013). Details on the described methods, precision, and reproducibility for analysis performed in ALEC are reported elsewhere (Perdrial et al., 2014; Vázquez-Ortega et al., 2015; Trostle et al., 2016).
Data Processing and Statistical Analysis
All data processing and statistical analyses were performed using R (R Core Team, 2017) and the following packages: CAR, lsmens, nlme, and ggplot2 (Wickham, 2009; Fox and Weisberg, 2011; Lenth, 2015; Pinheiro et al., 2017). C-Q relations for each limb of the hydrograph were fitted to a power law (Eq. 1) using non-linear least-squares estimates (Gauss–Newton).
Where C is the solute concentration, Q is the discharge, b is the fitted power exponent and a is a fitting parameter. The ratio of coefficients of variance for concentration and discharge (CVC/CVQ) was calculated as
where μ and σ are the mean and standard deviation of the solute concentration (C) and discharge (Q), respectively. Solute export behavior was defined on the basis of the power law exponent, b (Eq. 1), and the ratio CVC/CVQ (Godsey et al., 2009; Thompson et al., 2011; Musolff et al., 2015). Chemostatic behavior was defined as b = 0 and CVC/CVQ ≤ 0.2, whereas chemodynamic behavior is defined as |b|≥ 0 and/or CVC/CVQ > 0.2 (Hoagland et al., 2017).
The hysteresis index (HI), which quantifies the extent of offset between C-Q trends for each limb in the hydrograph was calculated following Vaughan et al. (2017). Normalized discharge (Qi,norm) and concentration (Ci,norm) values were calculated as
where Qi and Ci are the discharge and concentration value at time i, and Qmin, Cmin, Qmax, and Cmax are the minimum and maximum discharge and concentration values. The Cnorm values for each limb were interpolated at increments of 0.01 of Qnorm by fitting local polynomial regression (LOESS function, stat package R Core Team, 2017). The hysteresis indices were then calculated by the difference between normalized solute concentration pairs at equivalent discharge. C-Q analysis were performed only for LJ stream and not for the ZOB stream due to low data resolution on volumetric discharge for the latter.
To further study the relations between solute C-Q behaviors, a hierarchical cluster analysis approach was applied. First, the fitted values of the power law exponents, CVC/CVQ values, and mean HI indices for each solute and limb were combined into a single matrix. In cases of a poor fit to Eq. 1 (i.e., p > 0.05), b was assigned a value of zero. Columns were standardized by subtracting the mean and dividing by the standard deviation of each column. The Euclidian distance matrix was calculated using the “dist” function in R. Hierarchical clustering was than calculated from the distance matrix using the “hclust” function with the “ward.D2” method. Principle component analysis (PCA) was performed on the standardized matrix, using the “prcomp” function to evaluate the different behaviors between clusters.
Differences between solute concentration means in water sources (i.e., soil, groundwater and streams) were assessed using linear mixed effect model for repeated measures (lme function, nlme package Pinheiro et al., 2017) one-way ANOVA and Tukey’s honest significant difference (HSD) test (ANOVA and lsmean function car, and lsmeans packages, respectively, Fox and Weisberg, 2011; Pinheiro et al., 2017). Humification indices (HIX) were calculated as the ratio between the sum of fluorescence intensity in the 435–480 nm region to the region of 300–345 nm for a specific excitation wavelength of 255 nm (Ohno, 2002). Visual Minteq 3.1 was used for geochemical speciation modeling and saturation indices calculation. Carbonate speciation in streams and groundwater was calculated from pH and DIC data, whereas for soil pore water, carbonate speciation was calculated using PCO2 and alkalinity (estimated by the diffrence between non-hydrolyzing cations and strong acid anions, Stumm and Morgan, 1981).
Results
Water and Snow Dynamics
Snowpack accumulation began in late November 2016, as (daily mean) air temperature dropped to -4°C, below freezing, and it reached a maximum depth of ca. 1000 mm in upper LJ catchment in mid-January 2017 (data not shown). The onset of snowmelt was measured in the upper LJ climate station on March 1, 2017 as average air temperature increased above 0°C (Figures 2A,B). During the first 3 weeks (March-1 to March-22), snow depth in upper LJ decreased from 930 to 440 mm. A subsequent drop in air temperature decreased the rate of snowmelt and this was accompanied by further snow accumulation (ca. 200 mm) as a result of new precipitation events from March 22 to April 5. Air temperature increased again and snowmelt resumed until completion on April 21. Therefore, this snowmelt hydrograph can be considered as a large melting event superimposed by a sub-event with small snow accumulation and melting. It is important to note that air temperature measured in the lower LJ climate station, was higher by 2.5 ± 0.42 degree, and most of snowpack at this location had melted by mid-March.

FIGURE 2. Time series of hydrometeorological data: (A) air temperature and (B) snow depth at Redondo peak and Headquarters meteorological stations (C) mean (lines) and standard error (shaded) volumetric soil water content as a function of depth in ZOB, (D) groundwater elevation Well 1A (right axis) and Well 2D (left axis), respectively, and surface water discharge for (E) ZOB and (F) La Jara flumes.
Following snowmelt trends, mean VWC in the ZOB, averaged across the six instrumented pedons (Figure 2C), increased, signaling infiltration into the near surface soil layers. The duration of elevated VWC increased with soil depth, with surficial (10 cm depth) soils showing a relatively short-lived period of elevated water content between mid-March and early April, whereas the deeper horizons (60 cm depth) showed sustained saturation into early May, and the intermediate depth (30 cm) showed an intermediate behavior (Figure 2C). Previous work indicated minimal overland flow over still frozen ground (Liu et al., 2008; McIntosh et al., 2017).
The perched groundwater table elevation, represented here by Well 2D, showed a steady response to snowmelt (Figure 2D). Overall the perched water table increased by 1320 mm over the snowmelt period. Variation in the rate of groundwater elevation increase corresponded to the timing of snowmelt. During the initial melt period (March 1 – March 22) this rate was 1.6 × 10⁻³ ± 4 × 10⁻⁶ m h-1. During this period snow depth was negatively correlated with groundwater table elevation (slope = -1.25 m snow m water table-1, R2 = 0.97). Then as the rate of snowpack ablation decreased with decreasing temperature (and new snow accumulated between March 22 and April 5), the groundwater table continued to rise, but at a greatly reduced rate of 6.5 × 10⁻⁴ ± 2 × 10⁻⁶ m h-1. For this period there was a positive correlation between snow depth and groundwater table elevation (slope = 0.61 m snow m water table-1, R2 = 0.59). The rate of the groundwater table rise increased again to 8 × 10⁻⁴ ± 1 × 10⁻⁶ mh-1 during the second period of snowmelt (April 5–24). Snow depth was negatively correlated with the groundwater table elevation (slope = -0.45 m snow m water table-1, R2 = 0.98). Maximum water table elevation was measured on April 24, 6 days after the second peak in the LJ hydrograph.
In contrast to the Well 2D, the deep groundwater table elevation measured in the south-west facing slope (Well 1A), exhibited two pronounced peaks. During the first peak (March 1–22) the groundwater table elevated by 2 m, corresponding to the initial period of snowmelt. Following the first peak, the water table decreased by 1.3 m. The minimum between the two water table peaks (April 8) was observed 3 days after the second snow accumulation peak. The second max in groundwater table occurred on April 10. This peak precedes the maximum water table elevation measured in Well 2D by 2 weeks, and coincides with the decrease in mean ZOB VWC at 10 and 30 m depth.
The hydrograph of the ZOB stream exhibited two pronounced peaks during spring snowmelt, March 20 to April 16, 2017 (Figure 2E). A similar pattern was observed in the hydrograph of the LJ stream (Figure 2F), however, maximum discharge consistently occurred 2 days later in LJ (March 22 and April 18), despite the fact that the ZOB is a higher elevation stream and subject to colder air temperatures (Figure 2A). During the first snowmelt period, ZOB and LJ stream discharge increased from ca. 0 to 30 m3h-1 and 450 m3h-1, these maximum values corresponding to specific discharges of 2 × 10⁻⁴ and 1.36 × 10⁻⁴ m h-1, respectively (Figures 2E,F). The accumulation of the snowpack (March 22 to April 5) resulted in decreased discharge to 0 and 170 m3h-1 in ZOB and LJ streams, respectively. As snowmelt resumed, a second hydrograph rise was observed (up to 20 and 170 m3h-1, for ZOB and LJ streams, respectively). Both ZOB and LJ hydrographs contain daily peaks and troughs associated with diurnal fluctuations in temperature, and hence melt rates.
Bulk and Time Series of Water Chemistry
Mean solute concentrations in soil solution, groundwater and streams (LJ and ZOB) are presented in Table 1. The pH in Well 2D groundwater was higher by 0.5 units than those of soil and stream waters. Soil solutions were significantly enriched in Zr, Al, DOC, and REEs. Mean concentrations of DIC, Si, Mn, Na+, SO42-, Mg, Ca2+, and Sr2+ were significantly higher in Well 2D than in the LJ stream. For example, DIC, Mn, Ca2+, SO42- and Sr2+ mean concentrations were 18, 16, 15, 7 and 7 times higher in Well 2D groundwater than in the LJ stream, respectively. Highest NO3- concentrations, which were measured in the LJ stream, were 2–3 times higher than concentrations in the ZOB stream, ground water, and soil water. Deeper ground water at site 2 (Well 2C) showed similar chemistry to Well 2D, except that Mg2+ was higher in Well 2C. Wells in site 1 (Well 1A, and Well 1B) had up to 10-fold lower Ca2+, SO42-, and DIC concentrations, whereas Mn was higher in this site compared to site 2 (Supplementary Figure S2). Groundwater was slightly oversaturated with respect to calcite (mean saturation index, SI = 0.22 ± 0.009) while streams and soil pore water showed consistent under-saturation (mean SI = -2.77 ± 0.08, -2.42 ± 0.08, and -3.26 ± 0.10 for LJ, ZOB streams, and soil pore water, respectively, Supplementary Figure S1). Since some degassing of CO2(aq) from water samples may have occurred before sample analysis, calculated SIs for calcite may overestimate the actual values in the streams and Well 2D waters. To address this issue calcite SI values were calculated for Well 2D water in equilibrium with three PCO2 concentrations, 0.4, 4, and 40 mL L-1. The calculated SIs were, 1.35 ± 0.01, 0.44 ± 0.01, and -0.55 ± 0.01. Therefore, even for high PCO2 values, Well 2D water remained close to equilibrium with calcite. It is important to note that some calcite precipitation may have occurred between sample collection and analysis, and this may result in underestimation of calcite SI in Well 2D.
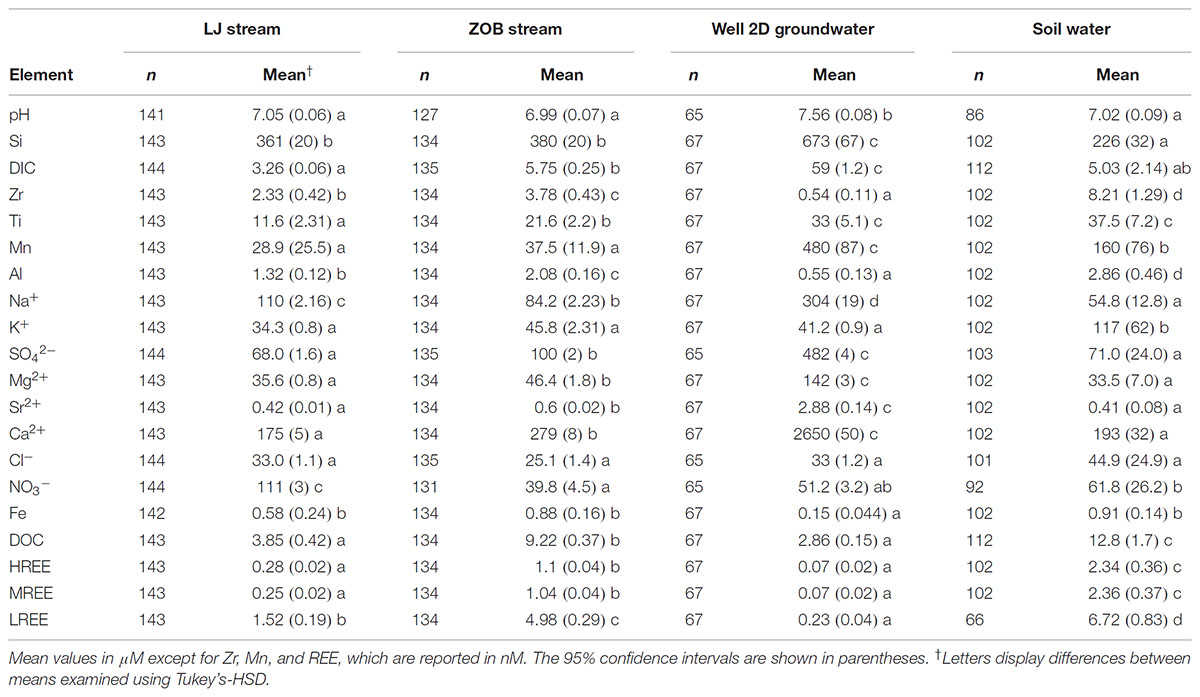
TABLE 1. Summary of pH and solute chemistry for various water types sampled in La Jara catchment.
Time series of Si, DIC, Ca2+, and Na+ in soil water, groundwater and ZOB and LJ streams are shown in Figure 3. Si concentrations in both ZOB and LJ surface waters exhibited similar trends, and concentration ranges (ca. 200 to 1000 μM). Two pronounced peaks in surface water Si concentrations occurred during the first and second falling limbs of the snowmelt hydrographs. The first set of peaks in both surface water systems occurred March 24 to April 4 when Si concentration increased from ca. 370 μM to ca. 500 μM. The second set of peaks occurred May 8–18 and was substantially larger than the first; Si concentrations increased to 1030 μM. It is noteworthy that both surface water Si peaks follow the observation of elevated Si concentrations in groundwater (Well 2D). This is especially evident for the second peak in streamwater Si concentration that follows a rapid increase in Well 2D concentration that started April 26. The increased concentration of Si in groundwater occurred in two steps the first from ca. 500 to 800 μM (April 26) and then to ca. 1300 μM (May 5). This increase in Si concentration was also observed in the deeper groundwater wells located on both slopes of the ZOB (wells 1A and 2C, Supplementary Figure S2). Groundwater Si concentration decreased to 720 μM by June 28 (Supplementary Figure S2), however, due to a gap in data between May 17 and June 28, it is unclear precisely when the Si concentrations declined in Well 2D. Interestingly, the peaks in Si concentration in groundwater coincided with increases in concentrations of DIC, Na+ and (to a lesser extent) Ca2+ in the groundwater (Figure 3). Furthermore, these increases in groundwater solute concentrations preceded by a few days the increases in surface water Si concentrations.
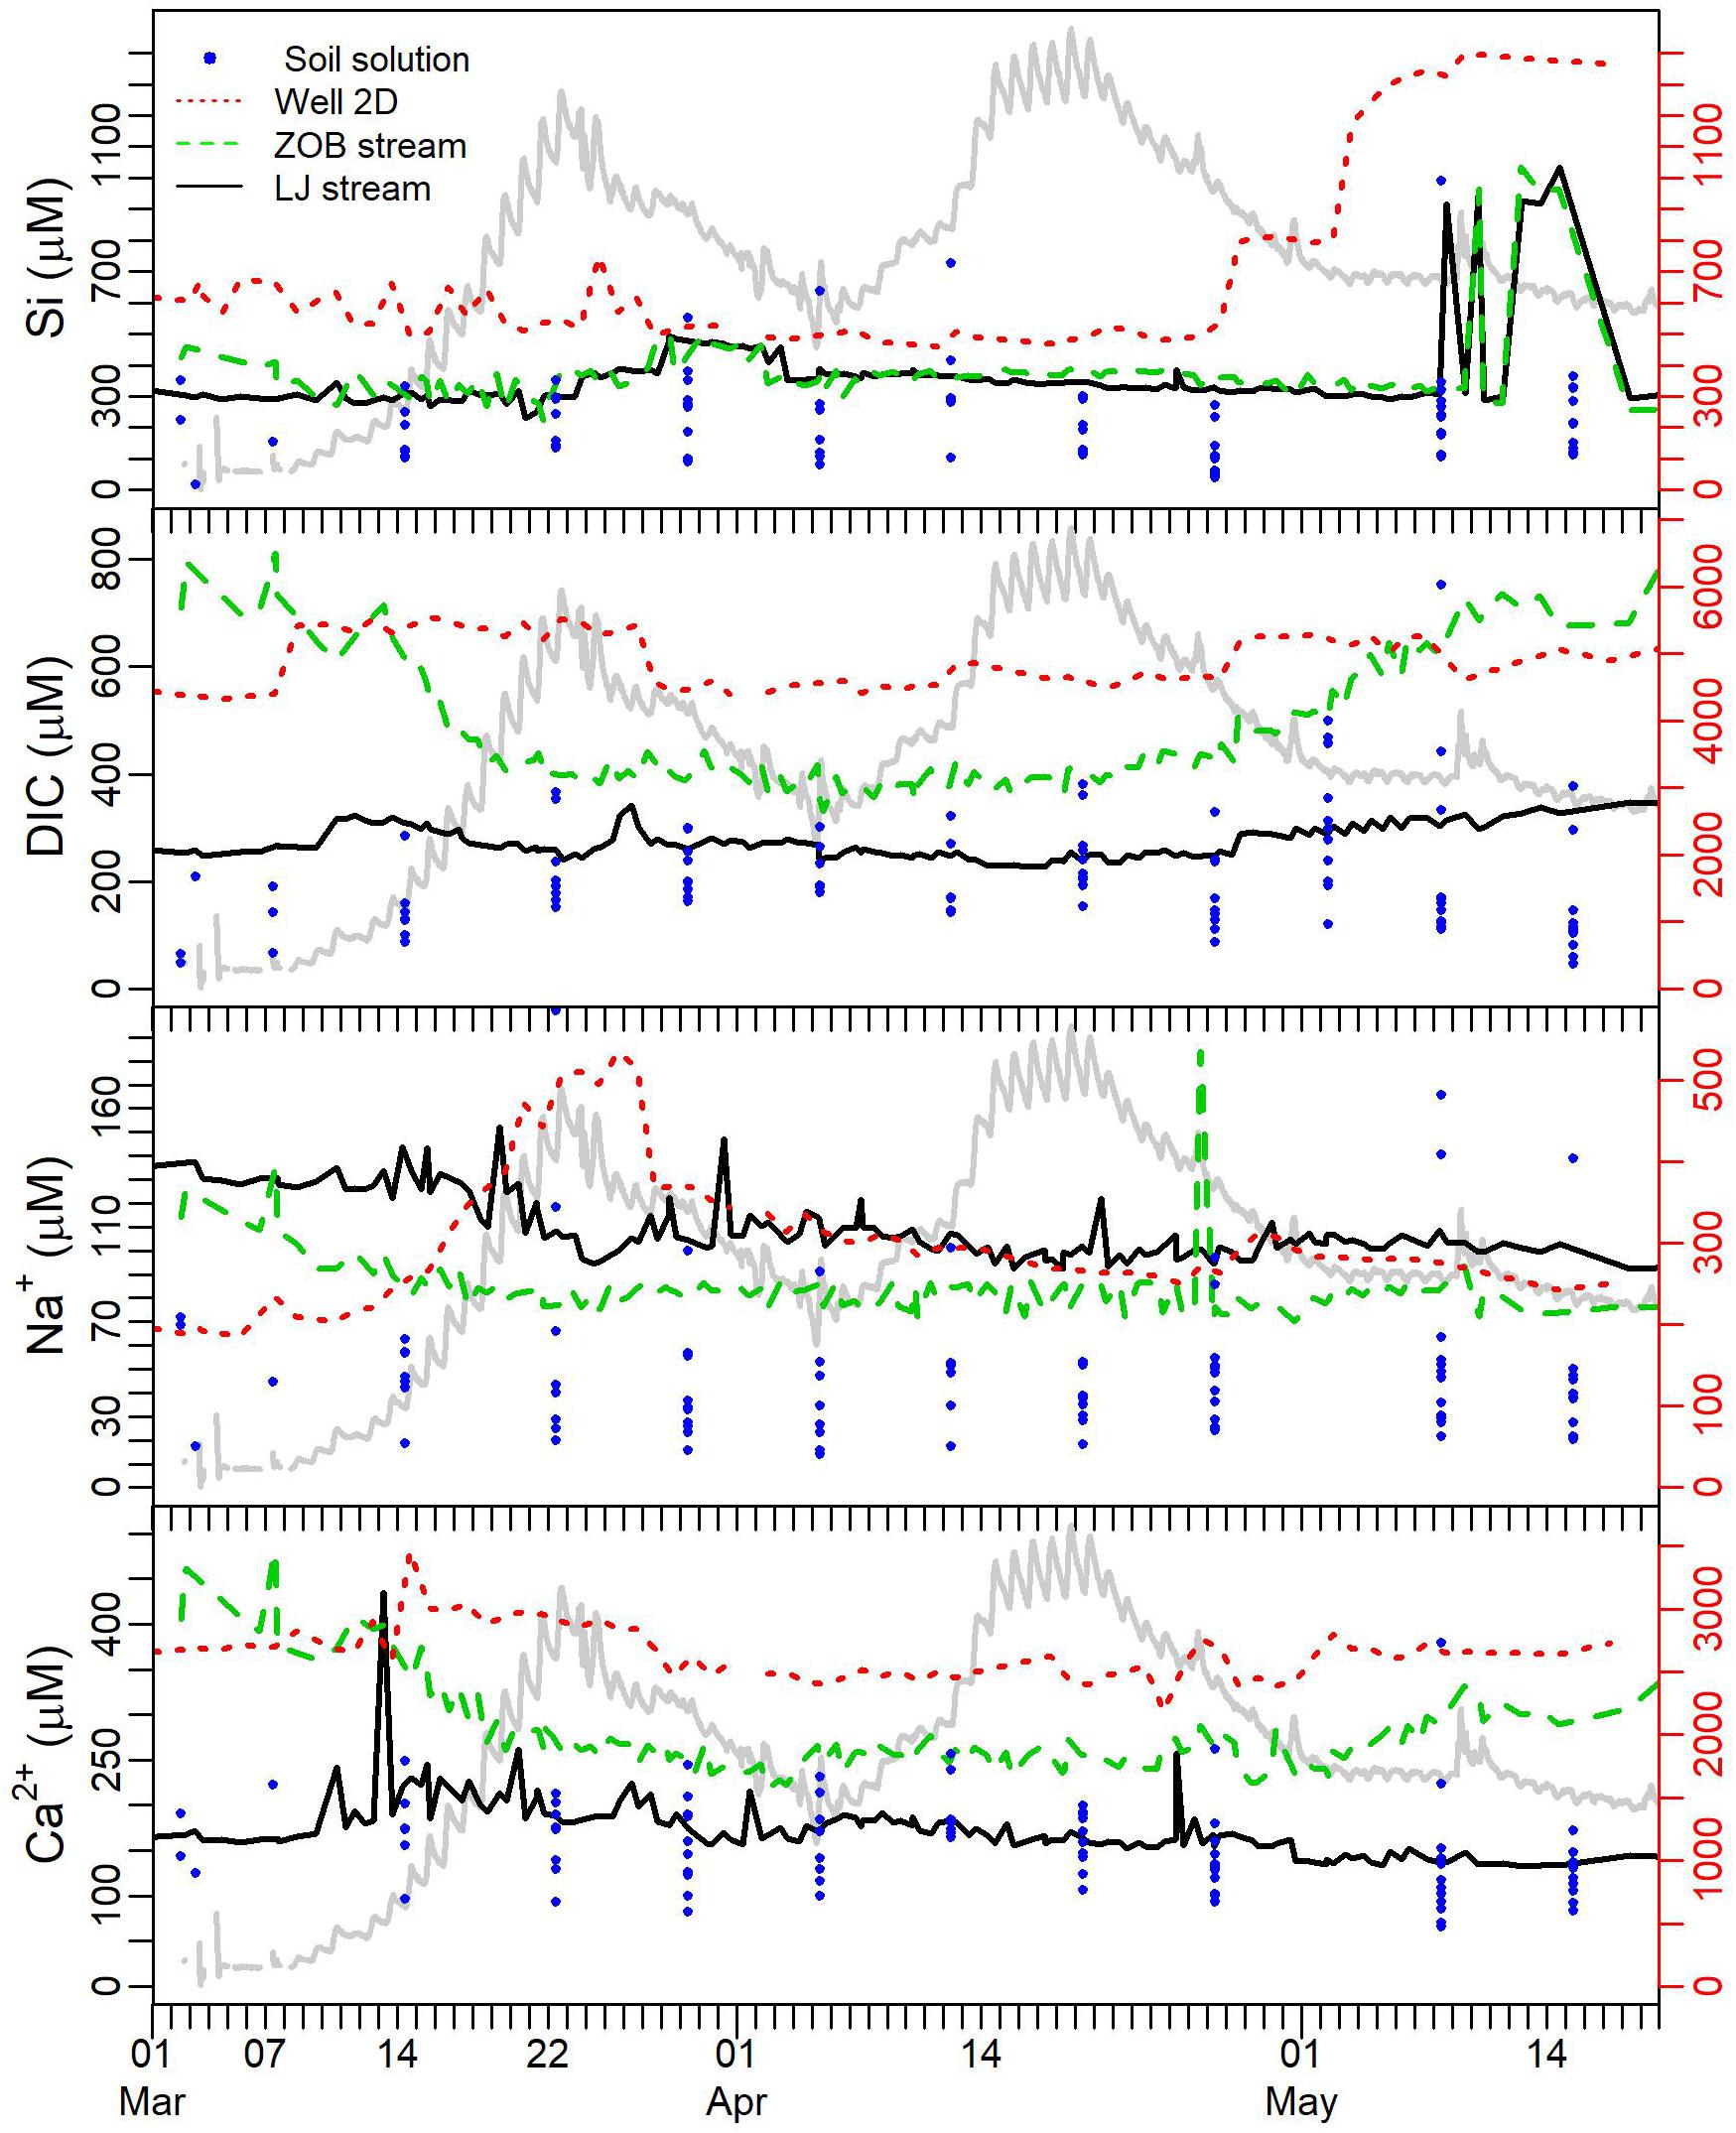
FIGURE 3. Time series of Si, DIC, Na and Ca in soil solution (filled blue circles), groundwater monitoring Well 2D (dotted red line), ZOB flume (dashed green line) and LJ flume (solid black line). The LJ hydrograph trace (from Figure 2F) is shown in light gray in the background (no axis scale) for temporal reference.
The ZOB stream showed a decrease in DIC during the first hydrograph rise followed by an increase during the second descending limb of the hydrograph (Figure 3). In contrast to the ZOB stream, DIC concentrations in LJ stream exhibited smaller variability. Notably, the humification index (HIX) measured for dissolved organic matter (DOM) collected from the ZOB stream, was correlated with DIC (R2 = 0.53, Supplementary Figure S3). In addition, DIC concentrations in the ZOB stream were correlated in time with PCO2 measured in the ZOB instrumented pedons (Supplementary Figure S4). Linear correlation with soil PCO2 explained up to 76% of the variance in ZOB stream DIC concentrations (Supplementary Figures S5, S6). It is important to note that stream water and soil gas PCO2 values were similar for LJ and ZOB streams, and for soil gas (1.28 ± 0.33, 2.18 ± 0.33, and 2.48 ± 36, mL L-1, respectively).
C-Q Relations
To increase the information obtained from the collected data, each limb (Rise 1, Descent 1, Rise 2, and Descent 2 are denoted as R1, D1, R2, D2, respectively) of the snowmelt hydrograph was analyzed separately (Figure 4). This approach allowed us to elucidate sequential trends in snowmelt hydrochemical response that would otherwise be missed in bulk analysis of C-Q data. C-Q trends differed among solutes and hydrograph sections (Figure 4 and Table 2). For both R1 and R2, Si, DIC, and Na exhibited chemostatic or slight dilution trends (b ≤ 0, Eq. 1) with relatively low CVC/CVQ (<0.2). Besides Na+, non-hydrolyzing cations and strong acid anions (K+, Ca2+, Mg2+, Sr2+, SO42-, Cl-, and NO3-) exhibited slight positive C-Q relations (0.05 < b < 0.2) with low CVC/CVQ (<0.2) during R1. D1 showed lower positive or chemostatic trends for the anions (SO42-, NO3, and Cl-). Other cations showed similar positive trends in R1 and D1 (Mg2+, Ca2+, Sr2+, K+). During R2, a shift from positive or chemostatic to dilution (b < -0.1) was observed for all non-hydrolyzing cations and strong acid anions except K+, which retained a positive C-Q trend. During D2, all ions except Na+ showed a positive power law slope (b > 0.2). The largest b values were calculated for DOC and REEs in all of the four hydrograph limbs (Table 2). REEs exhibited higher positive C-Q trends during R2 and D2 (b > 0.7), while DOC showed highest b values on the two descending limbs (0.49 and 0.65 for D1 and D2, respectively). The metals Mn, Al, Zr, and Ti exhibited scattered chemodynamic behavior (i.e., low b values and poor fit to power law function and high CVC/CVQ). The power law slopes for Fe were similar to those for these other metals for the last three hydrograph limbs, but in the first rising limb, Fe concentrations were much higher than the subsequent hydrograph limbs and showed a tighter positive correlation with discharge (Figure 4 and Table 2). All of these polyvalent metals (Mn, Al, Zr, Ti, and Fe) also exhibited a large colloidal fraction in both ZOB and LJ streams (Figure 5), whereas other elements did not show a significant colloidal contribution.
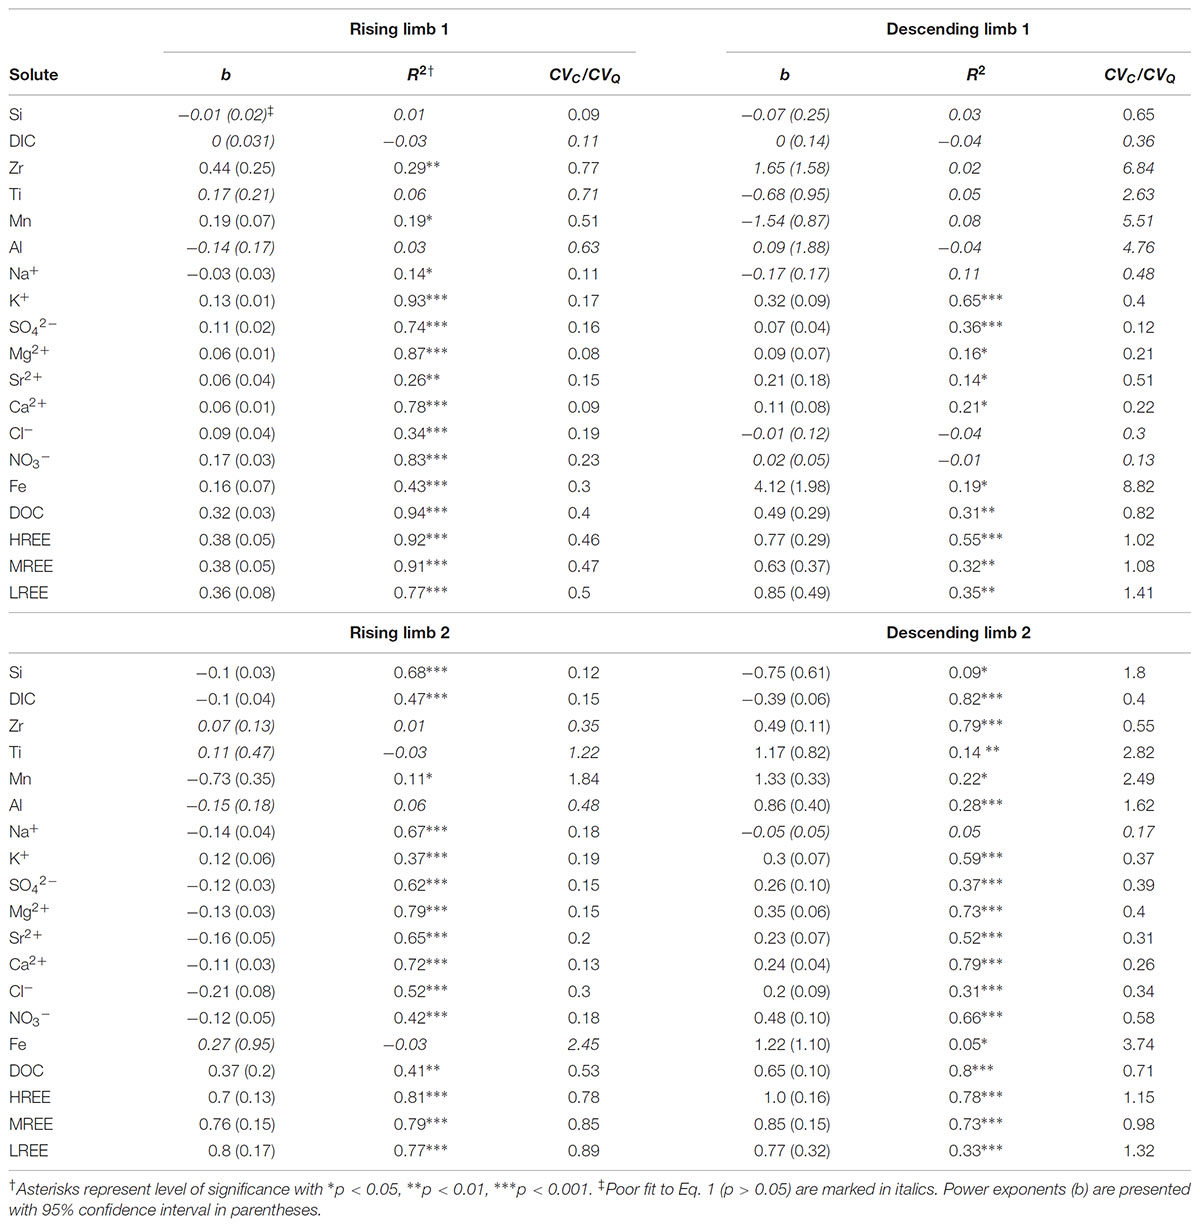
TABLE 2. Summary of power law fit (Eq. 1) and coefficient of variance (Eq. 2) for C-Q relations in the LJ stream.
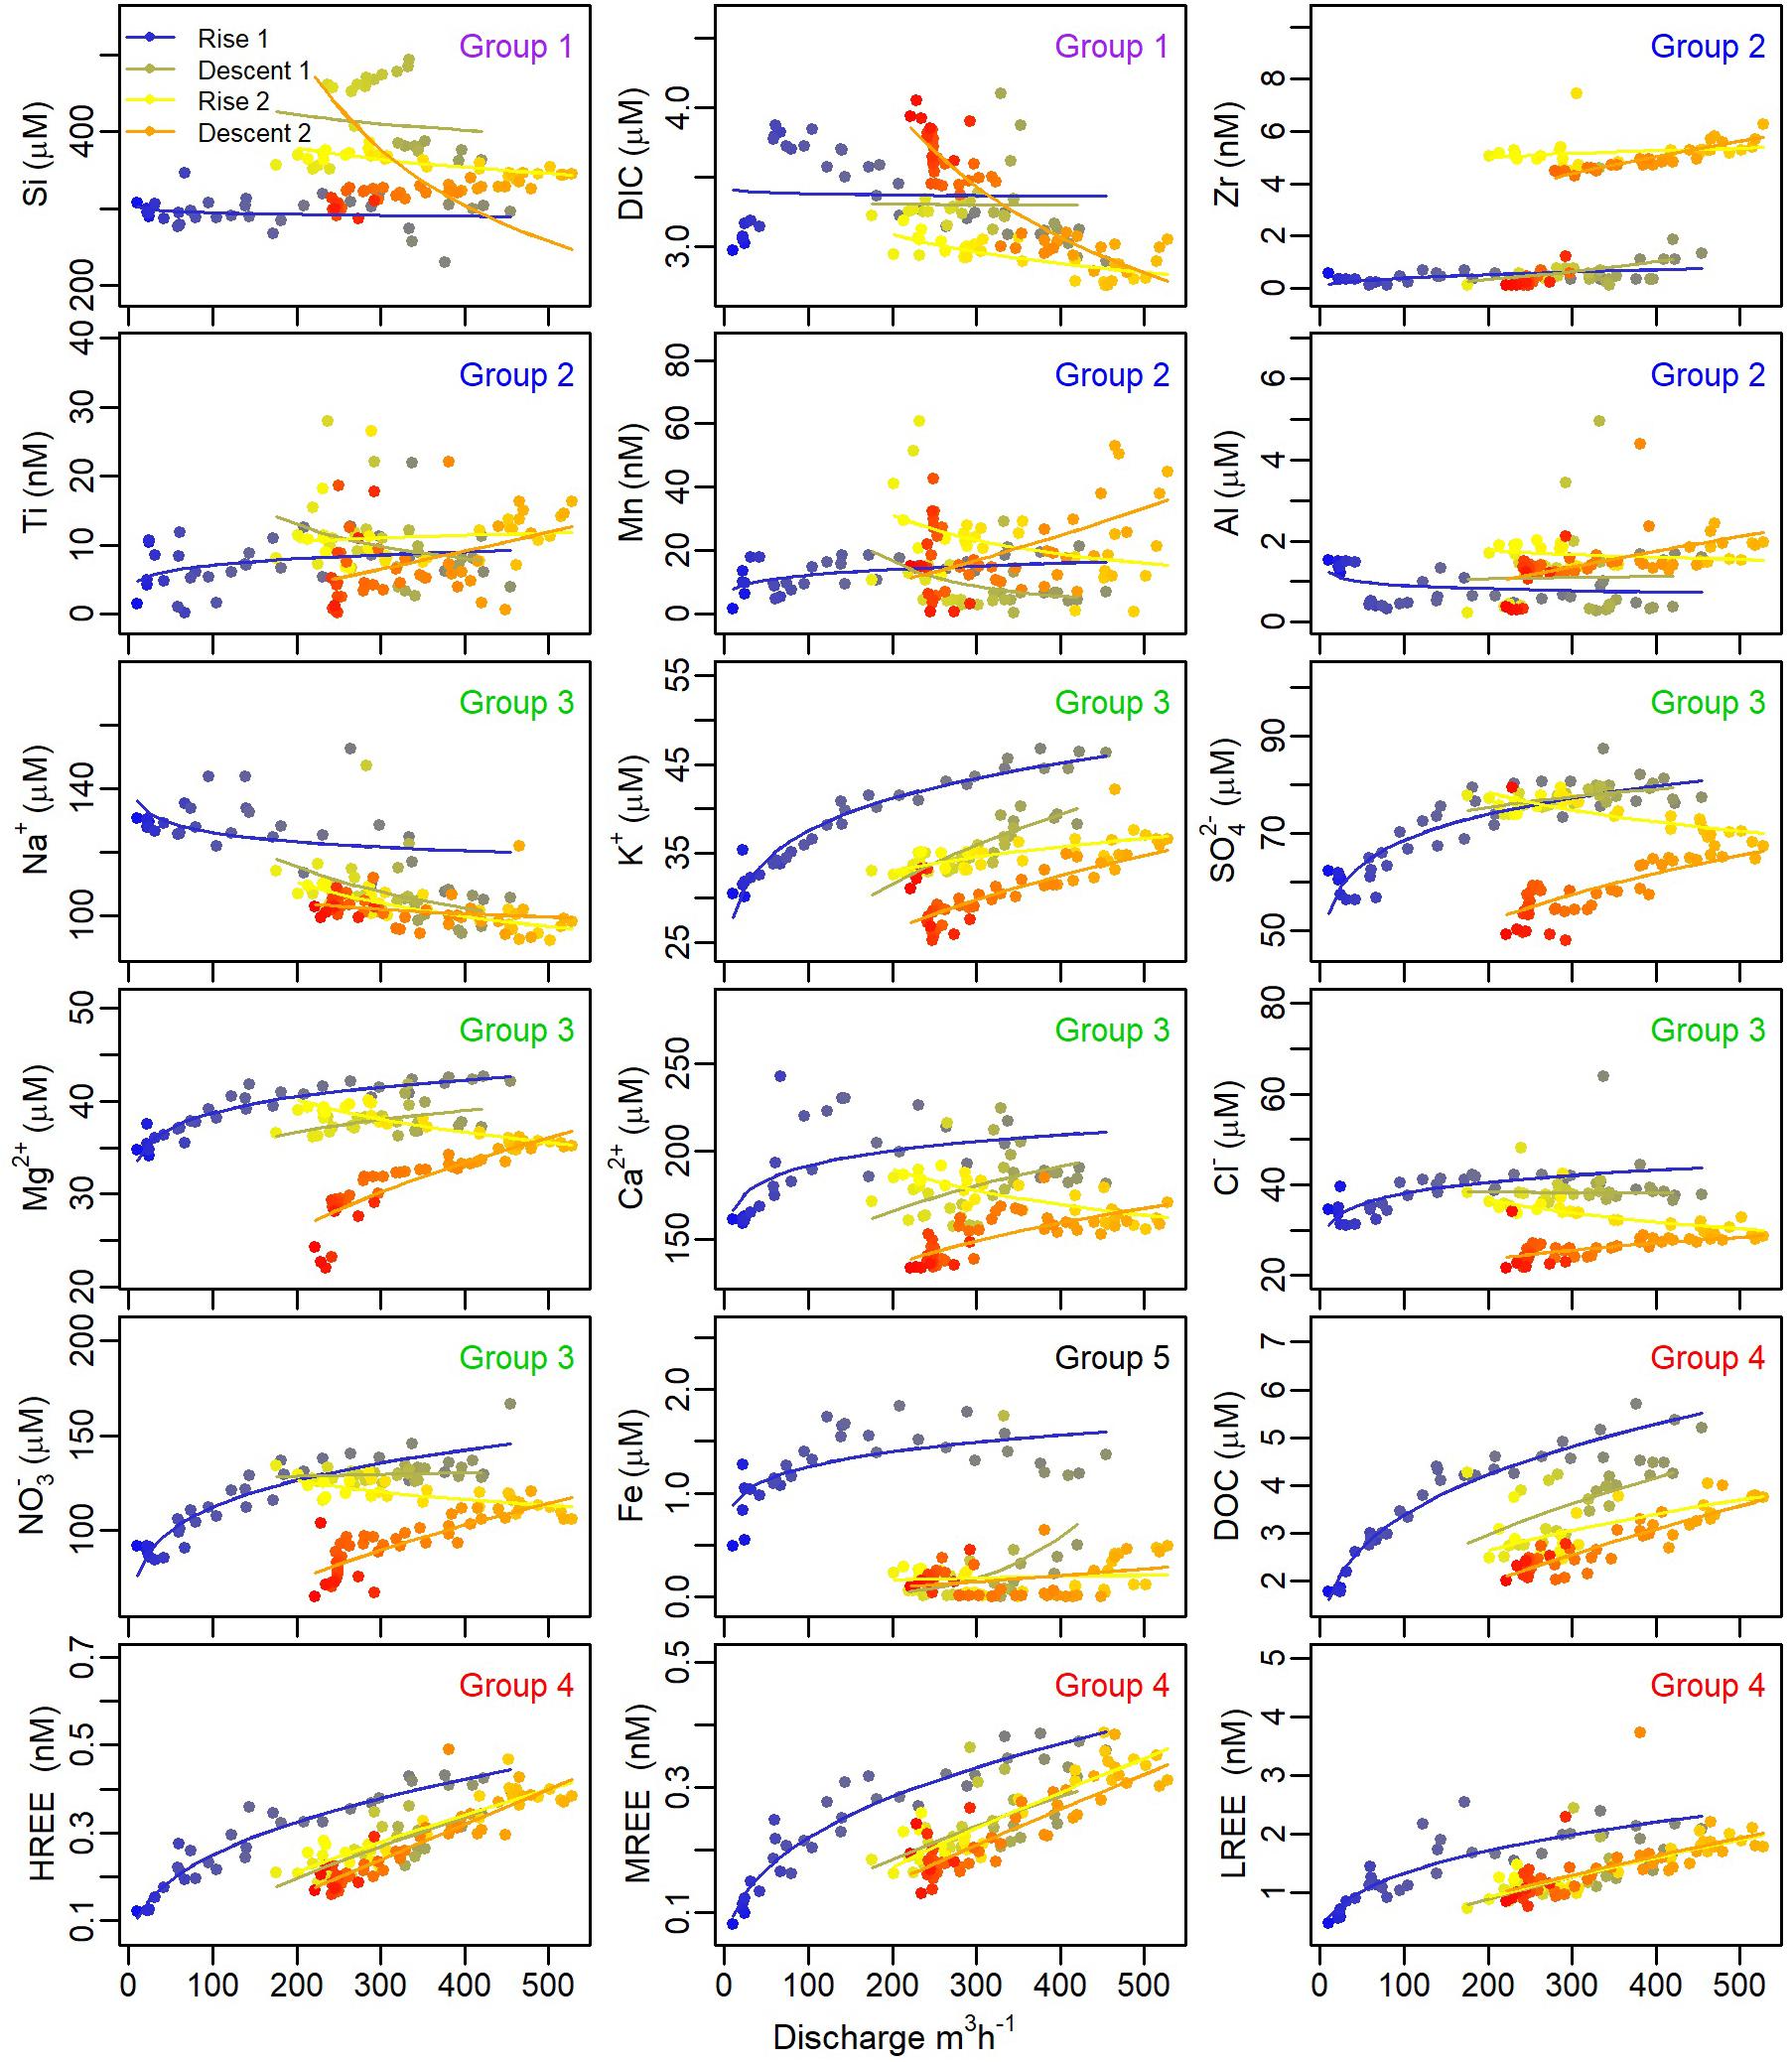
FIGURE 4. La Jara flume C-Q relations for selected elements. Solids lines are best fits to power law (Eq. 1) for each of the four hydrographs limbs: first rising (blue), first falling (green), second rising (yellow), and second falling (orange). See Table 2 for extracted parameters and associated statistics. Group numbers in each plot are linked to Figure 6.
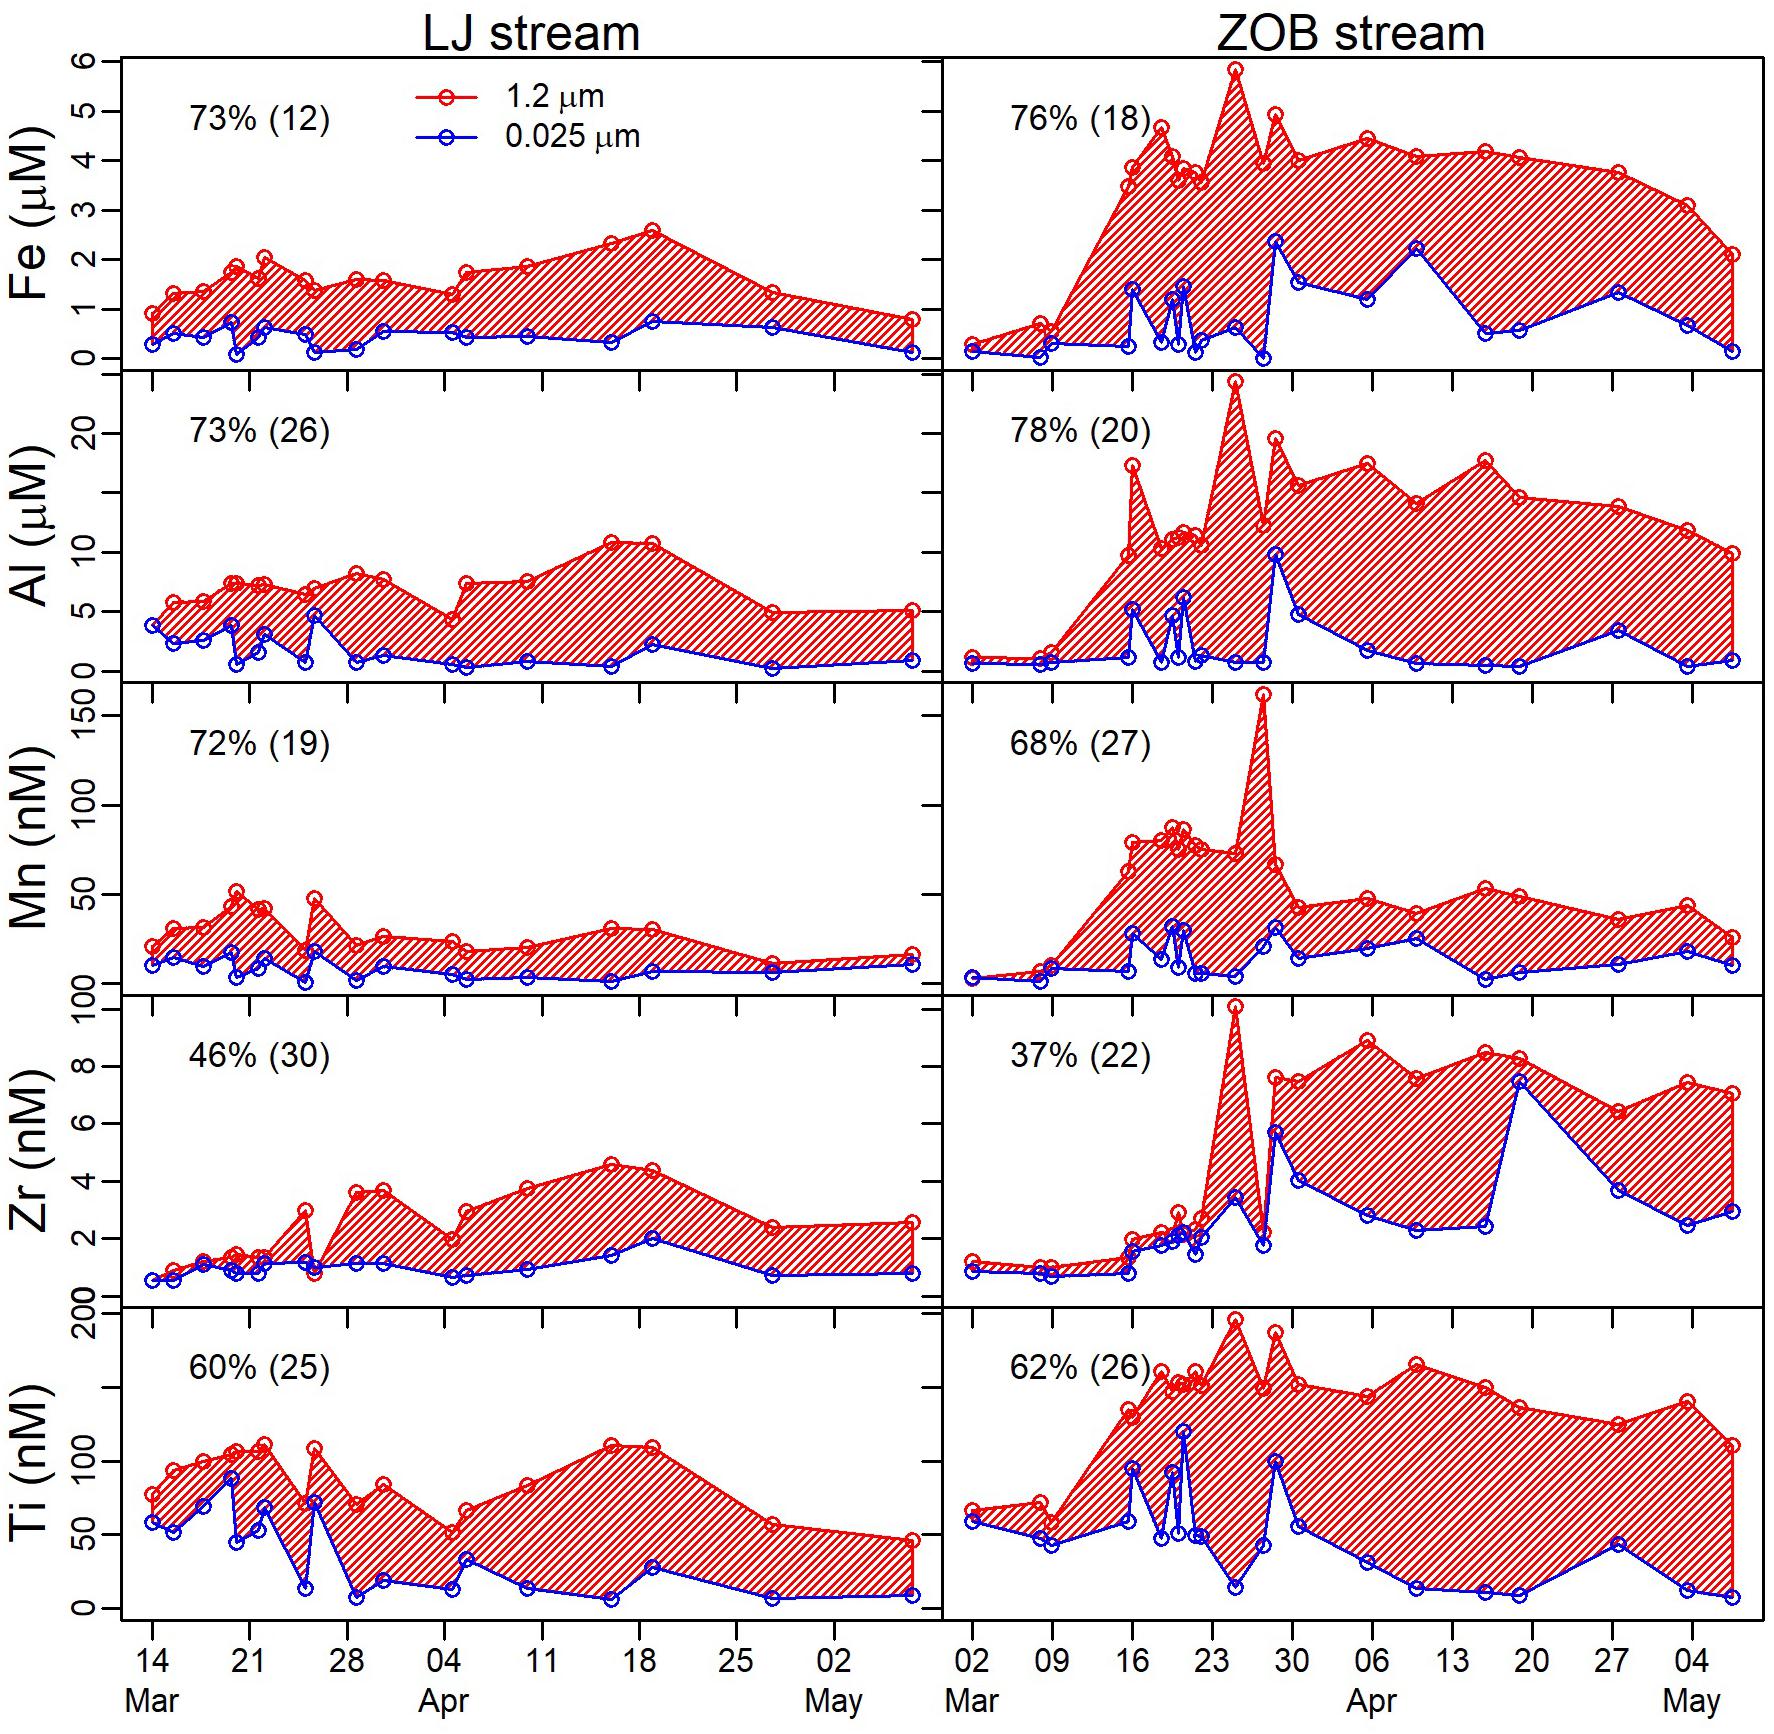
FIGURE 5. Time series results for the cascade filtration data pertaining to Fe, Al, Mn, Zr, and Ti. Concentrations are shown for elements in filtrates following filtration at 1.2 μm (red) and 0.025 μm (blue). Area marked in red diagonal lines represents the elemental mass contribution of colloids (0.025–1.2 μm). Numbers inset in each plot are the mean and standard deviation of the colloidal fraction over the course of the experiment.
C-Q Hysteresis
The La Jara stream snowmelt hydrograph exhibited different hysteresis patterns for the tested solutes. Since the snowmelt hydrograph in this work can best be described as one large snowmelt event superimposed with a smaller sub-event of snow accumulation and melting, hysteresis indices were calculated for the R1-D2 limbs as well as each of the sequential sub limbs (i.e., R1-D1, D1-R2, and R2-D2). Hysteresis indices (HIs) calculated as described in Section “Data Processing and Statistical Analysis,” are presented in Table 3 and Supplementary Figure S7. Pronounced anticlockwise hysteresis was observed between the R1 and D2 for Si, DIC, Zr, and Al. In contrast, major ions, DOC, and REEs exhibited overall clockwise hysteresis between R1 and D2. Strong clockwise hysteresis was observed for Fe for the first hydrograph peak (R1-D1) with no hysteresis for the second peak (R2-D2). The elements Na+, K+, Fe, DOC, and REEs, exhibited larger hysteresis on the first hydrograph peak. Mg2+, Ca2+, Sr2+, DIC, and Cl- had similar hysteresis values for both hydrograph peaks, whereas NO3-, and SO42- had larger hysteresis on the second hydrograph peak. Si showed anticlockwise hysteresis for the first hydrograph peak.
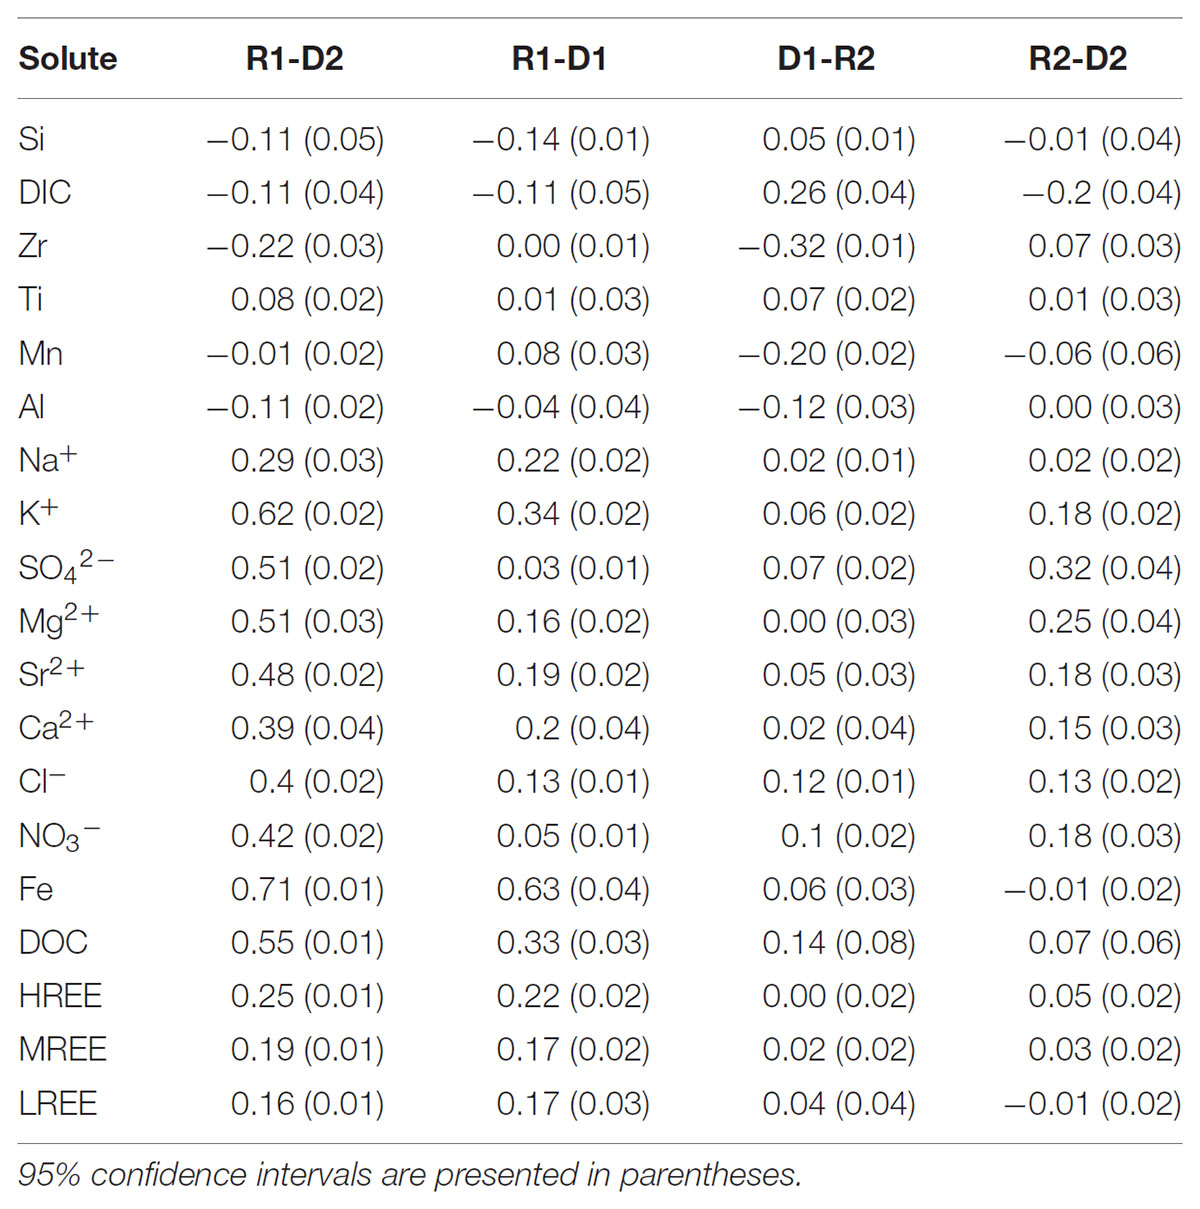
TABLE 3. Summary of mean hysteresis indices (HI) calculated for pairs of hydrograph limbs.
Cluster and Principle Component Analyses
Cluster analysis and PCA reduction methods were applied to separate solutes into groups with similar C-Q behaviors. As described in Section “Data Processing and Statistical Analysis,” values of the power law exponent (b in equation 1), coefficients of variance ratio (CVC/CVQ), and mean HIs, were combined into a single matrix. Results of the cluster analysis and PCA performed on this matrix are presented in Figure 6. The solutes clustered into five groups: (1) Si and DIC, (2) non-hydrolyzing cations and strong acid anions (Na+, K+, Ca2+, Mg2+, Sr2+, SO42-, Cl-, and NO3-), (3) DOC and REEs (4) Al, Mn, Zr and Ti, and, (5) Fe. The first three principle components (PC) explained 78% of the data variability, and the eigenvectors of these first three PCs are presented in Supplementary Table S1. Biplots of the first and second PCs (Figure 6), demonstrate that the hydrolyzing metals (groups 4 and 5) that exhibited higher CVC/CVQ, were separated based on the higher value of CVC/CVQ loadings in PC1 and PC2. DOC and REEs (group 3) were separated by the high power law exponent value (negative correlation with b values was dominant in PC2). Scores of group 1 plotted in the opposite direction of the power law exponent and HI loadings. K+ and Na+ were situated on the extremes of the major ions ellipsoid; K+ scores plotted closer to group 3 (DOC and REEs) whereas Na+ scores plotted closer to group 1 (Si and DIC). There was no strong separation observed between groups 3 and 4 in the biplot of PC1 and PC3, whereas Fe was strongly separated from the other elements based on its high hysteresis in the first hydrograph peak. Strong correlations were observed between DOC and REEs (R2 > 0.5, p < 0.001) for all hydrograph limbs except D1.
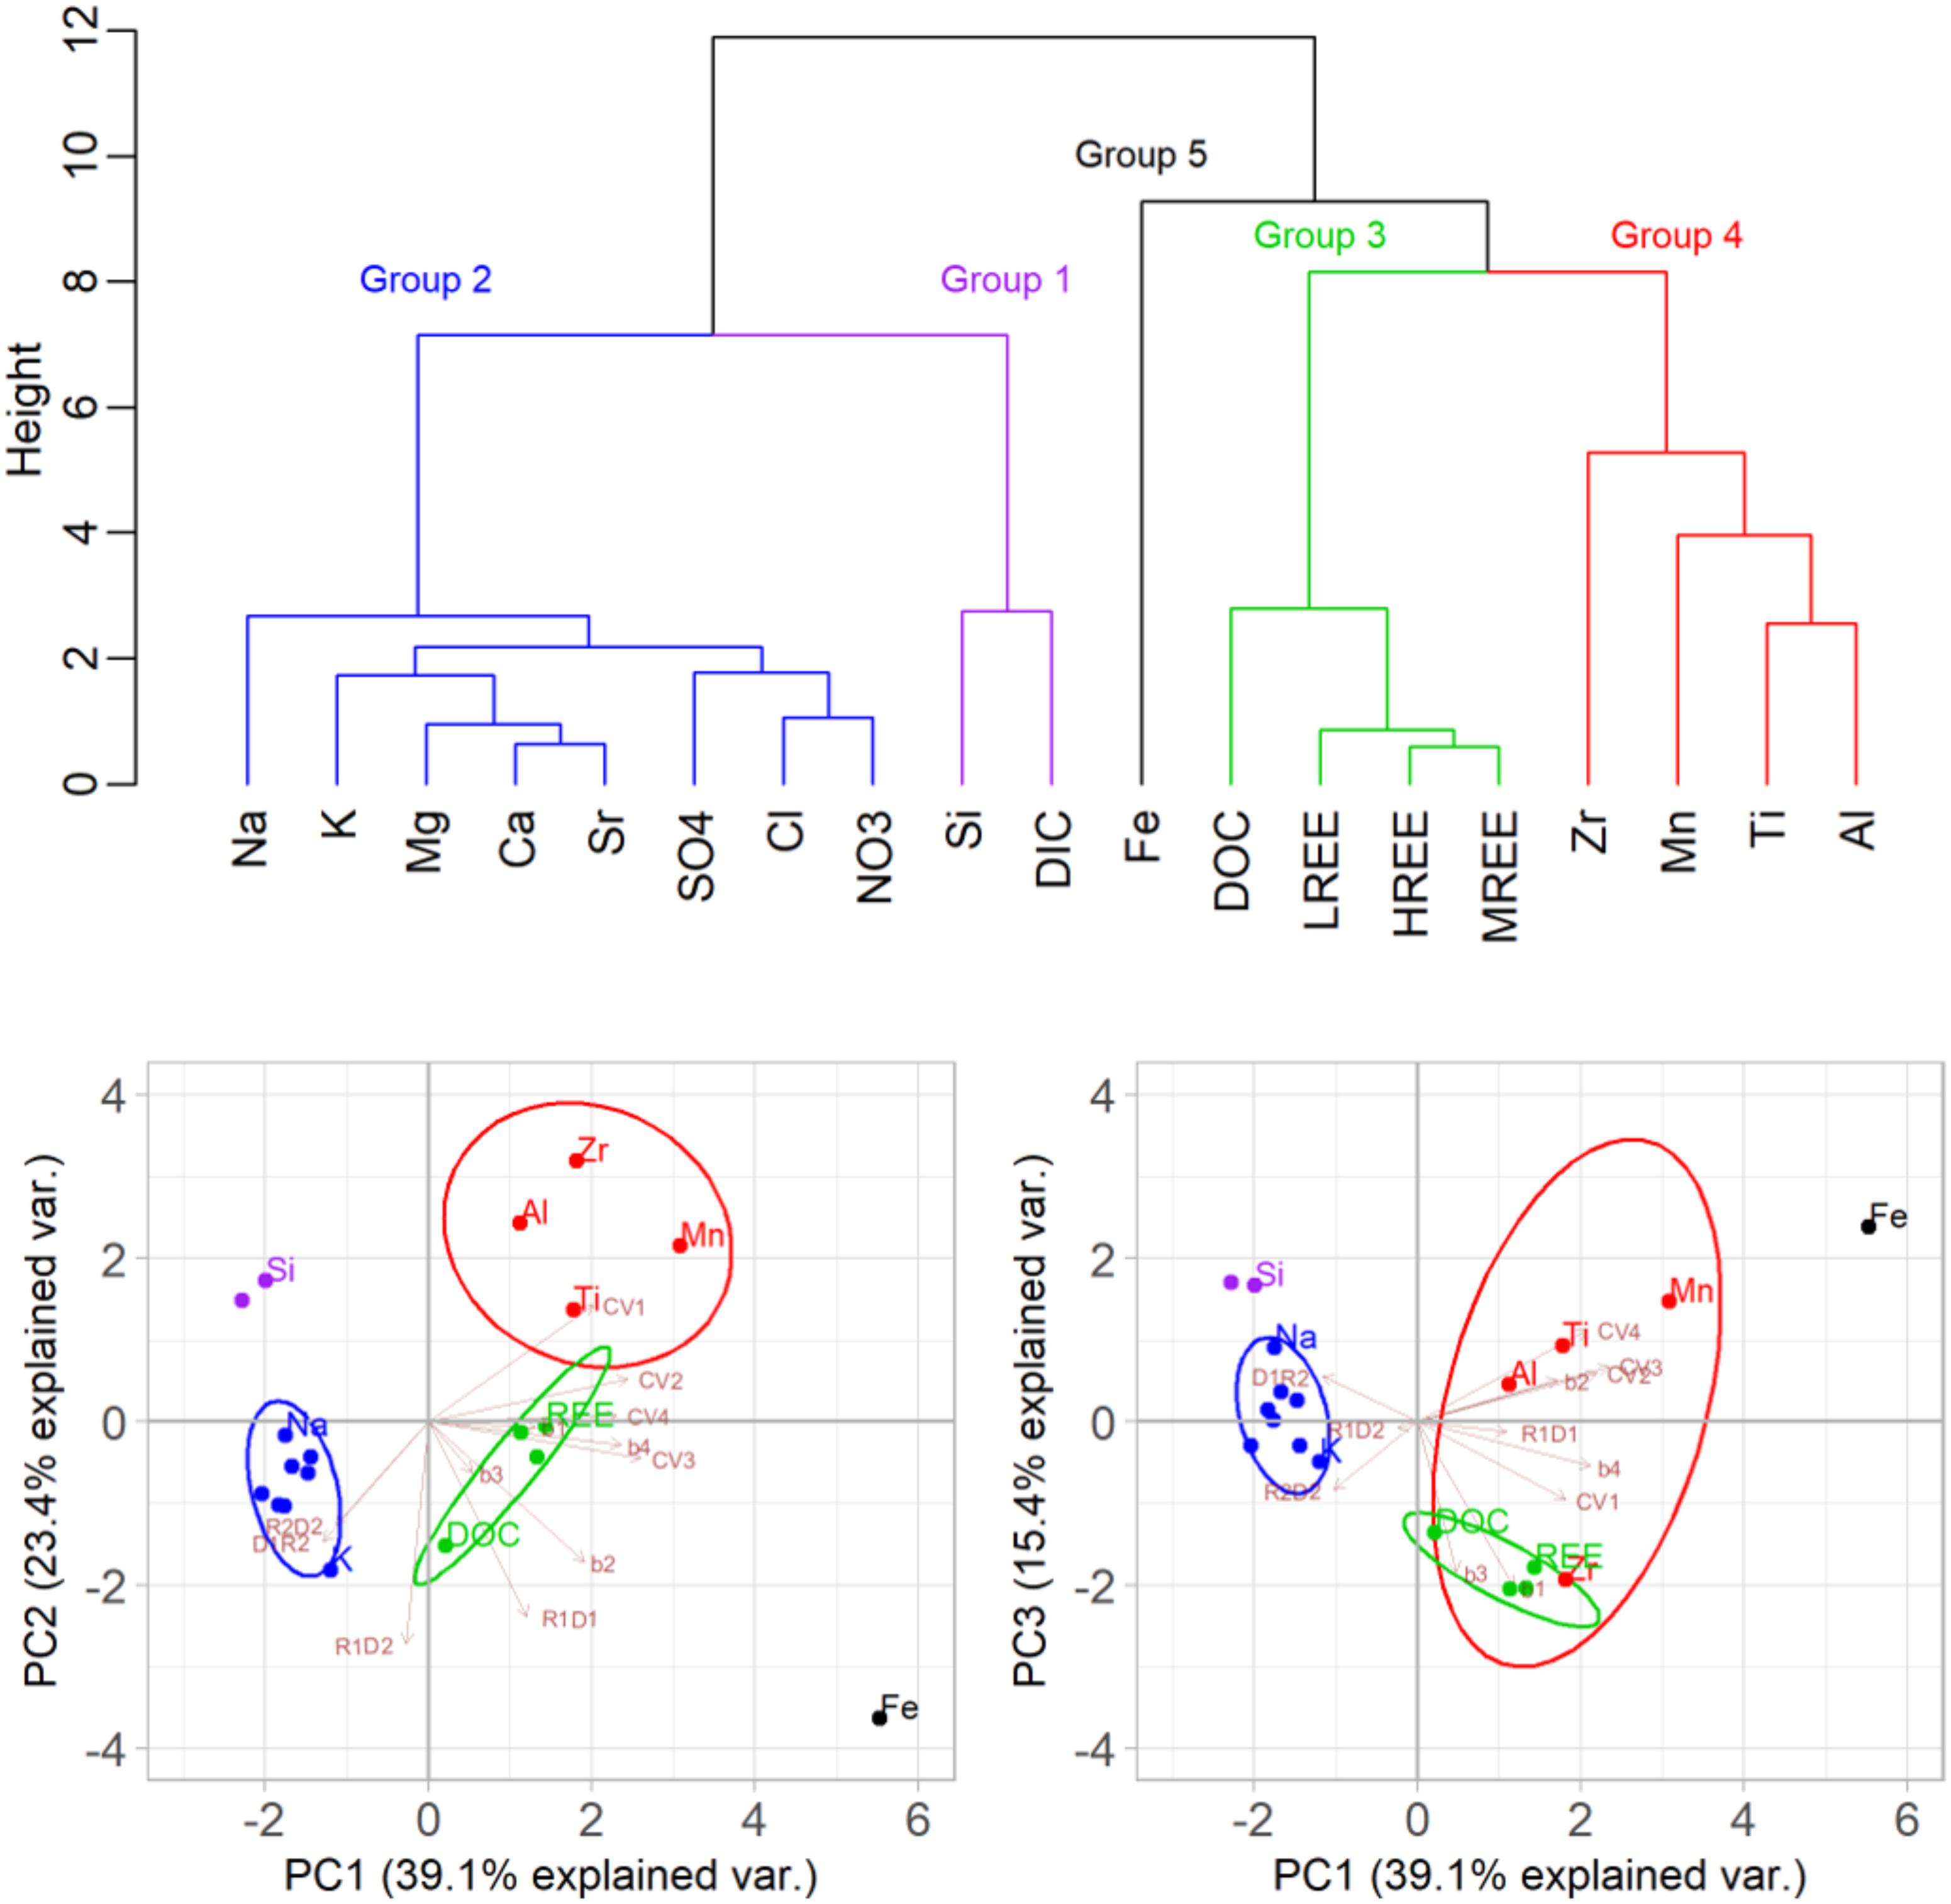
FIGURE 6. Cluster dendogram (top) with colors representing the five distinct solute groups identified and where Y-axis Height is the value of the criterion associated with the clustering method. Moving along the clustering tree from bottom to top, each leaf (group) fuses into another. Fusion at larger height represents larger distance between the groups. Biplots of the principle component (PC) pairs (bottom) showing PCs 1 and 2 (bottom left) and PCs 1 and 3 (bottom right). Loadings of the exponent a (equation 1), the coeficients of variance (CVC/CVQ), and the hysteresis indices between pairs of limbs (R for rise and D for falling limbs), are shown in brown arrows. Ellipsoid probability (95%) encapsulates the groups.
Discussion
The aim of this study was to link hydrogeochemical processes in the critical zone pore waters to their manifestation in stream C-Q relations on the time scale of the snowmelt hydrograph. Spring snowmelt 2017 in the LJ Jara catchment, characterized by two distinct hydrograph peaks resulting from snow melt and accumulation periods, provided a unique opportunity to test the hypothesis that stream hydrochemical response can be resolved in terms of soil solution and groundwater contributions. Results presented in Section “Water and Snow Dynamics,” suggest that soil solution, groundwater and surface waters all responded rapidly to snow melt with a short lag between the upper ZOB stream and the LJ catchment outlet. Variation in groundwater table rise correlates with snow melt and stream discharge trends (Figure 2), consistent with connectivity between soil water, groundwater and streamwater on the hydrograph time scale. The following sections discuss the hydrogeochemical processes observed in the La Jara catchment during spring snowmelt of 2017. The first section interprets relationships among time series of the different CZ compartments, and associated analysis performed on the bulk data. The second section discusses the analysis of C-Q and its link to short term CZ processes.
Time Series Data
Elevated Si concentrations in groundwater have been postulated as the source for contributing the bulk of Si to LJ surface waters (McIntosh et al., 2017). Data on Si concentrations in soils, groundwater and surface waters (Table 1 and Figure 3) support this hypothesis. During D1, Si values in LJ and ZOB streams reached similar values as found in groundwater (Well 2D), suggesting that at this period streamflow was associated with a progressively decreasing contribution of laterally transmitted soil water that diluted groundwater-derived Si during the high flow periods (R1 and R2). This suggests that pressure wave propagation from snow melt through the soil profile and into groundwater exhibits a lag where stream waters are heavily influenced by discharging groundwater later in the hydrograph pulse, even after soils (Figure 2C) have largely transferred drainage waters to the saturated subsurface (Figure 2D).
In contrast to Si, concentrations of Ca2+, Na+, Mg2+, Mn, and SO42- did not elevate in the streams during D1, even though their concentrations were larger (by factors of 7–16, Table 1) in Well 2D groundwater relative to surface water. This suggests that stream water Si may have an additional or even different source than that represented solely by Well 2D. Indeed, concentrations of SO42-, Ca2+, and DIC in Wells 1A and 1B were lower than observed in Well 2D (Figures 3 and Supplementary Figure S2), and are more consistent with concentrations measured in LJ and ZOB surface waters, which suggests that groundwater permeating the welded tuff on the eastern side of the ZOB is likely an important source to the ZOB and LJ streams. In any case, the relative magnitude of deeper groundwater contributions appears to increase during the descending limbs of the hydrograph, which helps to explain both C-Q and hysteresis behaviors, and the separation of solutes by source, as discussed further in Section “C-Q Analysis.”
The increase in Ca2+ and DIC concentrations in Well 2D during the first peak of the snowmelt hydrograph (Figure 3) is consistent with calcite dissolution. This is with agreement with saturation indices calculated from geochemical modeling; these indicate groundwater solutions are near equilibrium with calcite. Hence, the Na+ peak in Well 2D during that same period may derive either from the weathering of primary silicate minerals, or from Ca2+-induced displacement of Na+ from clay surfaces. In the current study, Ca2+ concentrations in Well 2D remained high (Table 1 and Figure 3) regardless of changes in water table depth. This observation is different from the rapid decrease in Ca2+ concentration in groundwater due to dilution with fresh rain water during the wet periods as reported for an argillite bedrock in the Eel River Critical Zone Observatory (Kim et al., 2014, 2017). This suggests that in the Jemez CZO study site, water percolating thorough the unsaturated zone to groundwater accumulates sufficient amounts of solutes (from relatively rapid mineral dissolution and cation exchange reactions) to maintain the high concentration in groundwater. A second silicate weathering pulse was observed as the water table in Well 2D began to recede. A similar Si pulse was captured at the same time in Wells 1A and 2C (Supplementary Figure S2). Moreover, in Well 1A this pulse was coincident with pulses of Na+, Mn, SO42-, Cl-, DOC, and HIX. The increase in DOC and HIX, suggests that reactants (e.g., carbonic acid, DOM) giving rise to the weathering pulse propagate from the biologically active soil layers down through the vadose zone and into groundwater. The resulting fast Si pulse likely reflects dissolution of volcanic glass, which is prevalent in the ZOB subsurface. This rapid silicate dissolution during high water flow through the CZ is in agreement with previous observations for an argillite bedrock site (Kim et al., 2014, 2017). Furthermore this rapid pulse of Si in groundwater and streams offers an additional mechanism for rapid Si recharge of groundwater, contrasting with the slow silicate dissolution mechanism postulated previously for this study site (McIntosh et al., 2017), and is in agreement with the assumption of the dispersive mixing model.
On-going investigations into the mineralogy of cores extracted during the construction of wells 1 and 2 will help to elucidate the solid phases contributing to weathering pulses, and to explain the different trends in Na, Mn, SO42-, Cl-, and DOC concentrations between these wells on the eastern (Wells 1, Bandelier Tuff) and western (Wells 2, caldera breccia) slopes of the ZOB. For example, relative to the eastern slope, the western slope contains threefold higher mass concentration of Fe (oxy)hydroxide (ca. 30 g kg-1 in the 1–15 m depth increment), predominantly as ferrihydrite, which we postulate acts as a reactive adsorbent for DOC (Gu et al., 1994; Eusterhues et al., 2005; Vazquez-Ortega et al., 2014). The western slope also contains calcite inclusions, not observed in the eastern slope boreholes, that likely contribute elevated Ca2+ to Well 2D groundwater samples. Since calcium carbonate can contain significant amount of SO42- (ca. 10 mg kg-1, Gill et al., 2008; Balan et al., 2014), the presence of calcite can explain the elevated SO42- concentrations in Well 2D water samples. In addition, we postulate that groundwater recharge on the eastern slope is dominated by fracture flow, whereas on the western slope it is dominated by matrix flow.
Analyzing multi-year time series on LJ surface water carbon dynamics, Perdrial et al. (2014) concluded that DOC with a terrestrial fluorescence signature and high humification index (HIX) originated from lateral water flow through near-surface soils, whereas DIC, as well as DOC with a stronger microbial fluorescence signature, were sourced from groundwater. Results of the present study indicate DIC dynamics in the ZOB stream are strongly influenced by soil biological activity. Specifically, DIC concentration and HIX (a reflection of partial microbial degradation of organic matter) in ZOB surface waters were highly correlated with each other (Supplementary Figure S3), as well as with PCO2 in the soil profile (Supplementary Figures S5, S6) implying that soils serve as the dominant source of both DIC and DOC to groundwater and stream. Higher PCO2 are known to accumulate under snowpack (Brooks et al., 1996), consistent with an active heterotrophic microbial community during the cold season whose respiratory products (CO2 and DOC with high HIX values) are discharged to surface water during snowmelt, as demonstrated by the close similarity in PCO2 between streams water and soil gas. Demonstrating important mechanism of CO2 transport from soil to streams. It is important to note, however, that higher PCO2 value occurs during the warm season (Brooks et al., 1996; Perdrial et al., 2014). This activity enables the processing of organic matter and accumulation of the degradation products in the soil profile. As water starts to move through the soil profile it transports this processed organic material, carbonic acid, and DOM to the subsurface and ZOB stream. Increased soil saturation during the snowmelt (Figure 2C), limits microbial activity (i.e., decrease in soil PCO2), probably due to oxygen limitation. Thus, degradation of soil organic matter and transport of processed DOM to the stream decreases (i.e., lower HIX). As soils begin to drain, microbial and plant root activity increases (indicated by increased PCO2 and HIX values). Hence, the soil hydrologic response from snow melt affects heterotrophic microbial activity. This, in turn, drives carbonic acid and complexing ligand (DOC with high HIX) production. These reactants propagate downward into the deeper subsurface to affect the second weathering pulse observed in the wells on both sides of the ZOB. These results provide support for the analytical model proposed by Calabrese et al. (2017), which suggests that transport of carbonic acid from bioactive soil exerts a principal control over subsurface bedrock chemical weathering rates. Results of the current study suggest that organic ligand production also controls these weathering reactions and needs to be included in future models.
C-Q Analysis
Principle component analysis is commonly used to develop mixing models (Nils Christophersen, 1992; Hooper, 2003; Liu et al., 2008). Wymore et al. (2017) used PCA, to reduce dimensionality of catchment variables, enabled them to compare C-Q parameters between multiple sites. In the current study, cluster analysis and PCA enabled us to sort the large set of quantified major and trace solutes into five distinct groups on the basis of their hydrochemical behavior (Section “Cluster and Principle Component Analyses,” Figure 6). These groups represent different coupled processes that occur in the CZ during spring snowmelt, which in this system represents the largest through-flux of fresh water. The first group, Si and DIC, represents mobile products of silicate weathering reaction. Elements of this group demonstrated chemostatic or dilution C-Q trends and anti-clockwise hysteresis patterns. Their higher concentrations in groundwater (Table 1), and the Si concentration peak during the first hydrograph recession (Figure 3), suggest that Si and DIC derive from a relatively large groundwater reservoir that is displaced by new meteoric waters entering through surficial soils. Such an assessment is also consistent with the observed groundwater table rise (Figure 2D) that coincides with high downward fluxes through saturated soils (Figure 2C). Groundwater Si is, therefore, potentially recharged by pulsed upgradient weathering events, as observed in this study.
Non-hydrolyzing cations and strong acid anions formed the second group. With the exception of Na+, ions in this group exhibited slightly positive power law exponents in the R1, D1, and D2 hydrograph limbs (Table 2 and Figure 4). Most ions of this group exhibited dilution trends during the second hydrograph rise (R2), indicating lower generation rates of these ions during the second part of the snowmelt hydrograph, consistent with flushing and removal during the first hydrograph peak. The high frequency sampling method provide increased resolution for these trends and shifts in C-Q trend, compare to previous study that demonstrated chemostatic behavior of these elements (McIntosh et al., 2017). Potassium was unique in retaining a positive trend during the second rise of the hydrograph. All solutes in this group also showed clockwise hysteresis for both peaks in the hydrograph (Table 3 and Supplementary Figure S7). These trends are consistent with a flush of a limited pool of nutrient ions (Ca2+, Mg2+, K+, NO3-, SO42-) that accumulate under snowpack as a result of both wet deposition followed by downward ion migration through the snowpack during freeze-thaw cycles as well as organic matter decomposition under the snowpack (Brooks et al., 1996; Schmidt and Lipson, 2004). Trend of positive or chemostatic C-Q relations for these elements also been observed in the Susquehanna Shale Hills CZO, and explain by the large contribution of soil later flow and mobilization accumulated elements to stream (Bao et al., 2017; Li et al., 2017a). Na+, which is not a nutrient cation, diverged from the rest of the group in its display of slight dilution to chemostatic behavior. Likewise, on the PC biplots (Figure 6), Na+ scored closest to the Si/DIC group. This difference is likely the result of lower biocycling of Na+ (and hence less accumulation in decomposing organic matter of surface soils) relative to the other ions in this group. Moreover, groundwater obtained from wells on both sides of the ZOB was more enriched in Na+ than was soil or stream water. Therefore, Na+ discharge may be dominated by release from the deeper groundwater weathering zone (similar to the case for Si and DIC), as has been suggested in previous work from this site (Zapata-Rios et al., 2015). The other borderline member of this group was K+, which did not change the power exponent sign from positive to negative during the second hydrograph rise, R2 (Table 2). Interestingly, on the PC biplot K+ scored closer to group 3 solutes (DOC and REEs). Since soil is the primary source of DOC to streams, our analysis suggests that K+ discharge is dominated by this source as well, and indeed it is also known to be mobilized readily by leaching of biomass (Tripler et al., 2006).
Prior observations of correlations between REE and DOC concentrations has led to the suggestion that fractionation of the lanthanide series resulting from variation in metal-ligand stability is a useful probe of ligand-promoted biological weathering in the CZ (Vázquez-Ortega et al., 2015). A prior study in a granitic catchment showed that these elements are transported as colloidal material in streams, and that this process explained positive power law exponents in C-Q relations (Trostle et al., 2016). Results of the present study indicate that, in the volcanic terrain of La Jara catchment, REEs in streamwater occur as aqueous organic complexes that are tightly correlated with and potential controlled by DOC transport.
The last two groups (4 and 5) exhibited strong coefficients of variance in concentrations compared to discharge (i.e., high values of CVC/CVQ), and also showed large colloidal fractions throughout the snowmelt hydrograph (Table 2 and Figure 5). In contrast to group 4 (Ti, Zr, Mn, and Al), Fe showed a high concentration flush and a positive C-Q trend in the first hydrograph limb (R1, Table 2 and Figure 4), and a strong clockwise hysteresis in the first hydrograph peak, which led to it being distinguished as a separate solute group. The positive correlation of Fe with DOC during R1 (R = 0.56, p < 0.001), and large positive hysteresis pattern for the same period, suggests a rapid flush of small Fe-DOM colloids that accumulated over winter in the soil or riparian zones. Overall, the C-Q relations of elements in groups 4 and 5, are consistent with a dominant colloidal (<1.2 μm) control on aqueous filtrate concentrations, as was confirmed by direct cascade filtration (Figure 5). Previous studies have suggested increased fluid shear stress during lateral soil water flow is the dominant mechanism for colloid detachment and transport from soils and hyporheic zones to the stream (Bradford et al., 2002; Wörman et al., 2002; Trostle et al., 2016). Therefore, elements that transport to streams as colloids may demonstrate pronounced positive C-Q relations (Trostle et al., 2016). The fact that components of groups 4 (Ti, Zr, Mn, and Al) and 5 (Fe) did not show consistent and clear positive power law exponents in the present study (Table 2 and Figure 4) despite being dominantly present in colloidal form (Figure 5) is consistent with the fact that the Jemez CZ is deeper and more complex than that of the Catalina site studied by Trostle et al. (2016). In the LJ catchment, colloids mobilized from soils may be subsequently immobilized in pores and fractures of the deep vadose and saturated zones.
Conclusion
The La Jara catchment is representative of the high elevation, mountain headwaters of the Rio Grande, which serves as the principal water source for Albuquerque, El Paso and other cities. Monitoring of pore waters and surface waters in the LJ catchment during spring snowmelt identified five distinct groups of C-Q behaviors that are distinguished on the basis of their sourcing and transport behavior in the CZ. Probing multiple CZ compartments, including soil water, groundwater and surface water, enabled the establishment of linkages between C-Q behavior of these groups and CZ processes. Si and DIC (group 1) derive from a groundwater source, as their contribution to surface waters become more dominant when shallow subsurface flows (soil) decreased during the descending limb of the hydrograph. Lanthanide series elements and DOC (group 3), had stronger positive C-Q trends and clockwise hysteresis patterns that were more pronounced compared with other tested elements. The C-Q behavior of these solutes suggest that they are useful signals of soil biologically influenced weathering reactions (e.g., strong positive chemodynamic behavior). Non-hydrolyzing cations and strong acid anions (group 2) demonstrated mostly positive C-Q trends and a clockwise hysteresis pattern. These trends imply flushing of a limited reservoir of solutes that accumulated under the snowpack. Endmembers of this group included Na+, which showed some similarity to DIC and Si, suggesting contribution from deep subsurface weathering, and K+, which exhibited C-Q behavior transitional to REEs and DOC, consistent with its sourcing from decomposing organic materials and active bio-cycling role. Groups 4 and 5 comprise metals that exhibit higher coefficients of variance (CV) for concentration relative to discharge, with generally poor fits to the power law function. These groups also had high colloidal fractions in surface water, demonstrating that adhesion and shearing effects that control colloid transport in complex geological settings are not strongly correlated with discharge. Although Fe had much in common with these other hydrolyzing metals and also comprised a significant colloidal component, it was represented by a separate group (5) due to its apparent complexation with DOM and transport to the stream as a metal-organic complex during the first rise of the hydrograph.
Frequent sampling of surface and ground water further revealed a large pulse of Si in streams and wells of the LJ catchment that occurred during the second descending limb of the hydrograph. This pulse was linked to enhanced bioactivity (increased soil PCO2 and HIX values) and vertical downward flow of DIC and DOC that promoted fast weathering of silicate minerals, likely including volcanic glass, which is an abundant and highly weatherable mineral present in the CZ at this volcanic site. Given that soil biological activities likely drive the DIC and DOC impacts on silicate weathering observed here, consideration of such effects would be useful for the ongoing development of reactive transport models of critical zone evolution (Li et al., 2017b).
Author Contributions
YO performed the data analysis, developed the conceptual framework, and wrote the manuscript with support from JC, JM, AW, and BM. JC and JM conceived the original idea. JC supervised the project.
Funding
This research was funded by the National Science Foundation, Grant No. EAR-1331408, which supports the Catalina-Jemez Critical Zone Observatory, and through the Binational Agricultural Research and Development (BARD) program, which awarded a postdoctoral fellowship to YO (Grant No. FI-534-2015) and the National Science Foundation, Grant No. EAR-1331408, which supports the Catalina-Jemez Critical Zone Observatory.
Conflict of Interest Statement
The authors declare that the research was conducted in the absence of any commercial or financial relationships that could be construed as a potential conflict of interest.
Acknowledgments
All data utilized in this paper are available through the criticalzone.org website at http://criticalzone.org/catalina-jemez/data/. We are grateful to Mary Kay Amistadi, Rachel Nadine Burnett, Mark Losleben, and Adam Killebrew for assistance with laboratory chemical analyses and field work.
Supplementary Material
The Supplementary Material for this article can be found online at: https://www.frontiersin.org/articles/10.3389/feart.2018.00181/full#supplementary-material
Footnotes
References
Balan, E., Blanchard, M., Pinilla, C., and Lazzeri, M. (2014). First-principles modeling of sulfate incorporation and 34S/32S isotopic fractionation in different calcium carbonates. Chem. Geol. 374–375, 84–91. doi: 10.1016/j.chemgeo.2014.03.004
Bao, C., Li, L., Shi, Y., and Duffy, C. (2017). Understanding watershed hydrogeochemistry: 1. Development of RT-Flux-PIHM. Water Resour. Res. 53, 2328–2345. doi: 10.1002/2016WR018934
Benettin, P., Bailey, S. W., Campbell, J. L., Green, M. B., Rinaldo, A., Likens, G. E., et al. (2015). Linking water age and solute dynamics in streamflow at the Hubbard Brook Experimental Forest, NH, USA. Water Resour. Res. 51, 9256–9272. doi: 10.1002/2015WR017552
Bouchez, J., Moquet, J. S., Espinoza, J. C., Martinez, J. M., Guyot, J. L., Lagane, C., et al. (2017). River mixing in the amazon as a driver of concentration-discharge relationships. Water Resour. Res. 53, 8660–8685. doi: 10.1002/2017WR020591
Bowes, M. J., Jarvie, H. P., Halliday, S. J., Skeffington, R. A., Wade, A. J., Loewenthal, M., et al. (2015). Characterising phosphorus and nitrate inputs to a rural river using high-frequency concentration-flow relationships. Sci. Total Environ. 511, 608–620. doi: 10.1016/j.scitotenv.2014.12.086
Bowes, M. J., Smith, J. T., and Neal, C. (2009). The value of high-resolution nutrient monitoring: a case study of the River Frome, Dorset, UK. J. Hydrol. 378, 82–96. doi: 10.1016/j.jhydrol.2009.09.015
Bradford, S. A., Yates, S. R., Bettahar, M., and Simunek, J. (2002). Physical factors affecting the transport and fate of colloids in saturated porous media. Water Resour. Res. 38, 63-1–63-12. doi: 10.1029/2002WR001340
Brooks, P. D., Williams, M. W., and Schmidt, S. K. (1996). Microbial activity under alpine snowpacks, Niwot Ridge, Colorado. Biogeochemistry 32, 93–113. doi: 10.1007/BF00000354
Calabrese, S., Porporato, A., and Parolari, A. J. (2017). Hydrologic transport of dissolved inorganic carbon and its control on chemical weathering. J. Geophys. Res. Earth Surf. 122, 2016–2032. doi: 10.1002/2017JF004346
Chanat, J. G., Rice, K. C., and Hornberger, G. M. (2002). Consistency of patterns in concentration-discharge plots. Water Resour. Res. 38, 22-1–22-10. doi: 10.1029/2001WR000971
Chipera, S. J., Goff, F., Goff, C. J., and Fittipaldo, M. (2008). Zeolitization of intracaldera sediments and rhyolitic rocks in the 1.25 Ma lake of Valles caldera, New Mexico, USA. J. Volcanol. Geotherm. Res. 178, 317–330. doi: 10.1016/j.jvolgeores.2008.06.032
Chorover, J., Derry, L. A., and McDowell, W. H. (2017). Concentration-Discharge relations in the critical zone: implications for resolving critical zone structure, function, and evolution. Water Resour. Res. 53, 8654–8659. doi: 10.1002/2017WR021111
Chorover, J., Troch, P. A., Rasmussen, C., Brooks, P. D., Pelletier, J. D., Breshears, D. D., et al. (2011). How water, carbon, and energy drive critical zone evolution: The Jemez–Santa Catalina critical zone observatory. Vadose Zone J. 10:884. doi: 10.2136/vzj2010.0132
Eusterhues, K., Rumpel, C., and Kogel-Knabner, I. (2005). Organo-mineral associations in sandy acid forest soils: importance of specific surface area, iron oxides and micropores. Eur. J. Soil Sci. 56, 753–763. doi: 10.1111/j.1365-2389.2005.00710.x
Evans, C., and Davies, T. D. (1998). Causes of concentration/discharge hysteresis and its potential as a tool for analysis of episode hydrochemistry. Water Resour. Res. 34, 129–137. doi: 10.1029/97WR01881
Fox, J., and Weisberg, S. (2011). An {R} Companion to Applied Regression. Second. Thousand Oaks, CA: Sage.
Gill, B. C., Lyons, T. W., and Frank, T. D. (2008). Behavior of carbonate-associated sulfate during meteoric diagenesis and implications for the sulfur isotope paleoproxy. Geochim. Cosmochim. Acta 72, 4699–4711. doi: 10.1016/j.gca.2008.07.001
Godsey, S. E., Kirchner, J. W., and Clow, D. W. (2009). Concentration-discharge relationships reflect chemostatic characteristics of US catchments. Hydrol. Process. 23, 1844–1864. doi: 10.1002/hyp.7315
Gu, B., Schmitt, J., Chen, Z., Liang, L., and McCarthy, J. F. (1994). Adsorption and desorption of natural organic matter on iron oxide: mechanisms and models. Environ. Sci. Technol. 28, 38–46. doi: 10.1021/es00050a007
Herndon, E. M., Dere, A. L., Sullivan, P. L., Norris, D., Reynolds, B., and Brantley, S. L. (2015). Landscape heterogeneity drives contrasting concentration-discharge relationships in shale headwater catchments. Hydrol. Earth Syst. Sci. 19, 3333–3347. doi: 10.5194/hess-19-3333-2015
Hoagland, B., Russo, T. A., Gu, X., Hill, L., Kaye, J., Forsythe, B., et al. (2017). Hyporheic zone influences on concentration-discharge relationships in a headwater sandstone stream. Water Resour. Res. 53, 4643–4667. doi: 10.1002/2016WR019717
Hooper, R. P. (2003). Diagnostic tools for mixing models of stream water chemistry. Water Resour. Res. 39, 1–13. doi: 10.1029/2002WR001528
Hulen, J. B., and Nielson, D. L. (1986). Hydrothermal alteration in the Baca geothermal system, Redondo dome, Valles Caldera, New Mexico (USA). J. Geophys. Res. 91, 1867–1886. doi: 10.1029/JB091iB02p01867
Kim, H., Bishop, J. K. B., Dietrich, W. E., and Fung, I. Y. (2014). Process dominance shift in solute chemistry as revealed by long-term high-frequency water chemistry observations of groundwater flowing through weathered argillite underlying a steep forested hillslope. Geochim. Cosmochim. Acta 140, 1–19. doi: 10.1016/j.gca.2014.05.011
Kim, H., Dietrich, W. E., Thurnhoffer, B. M., Bishop, J. K. B., and Fung, I. Y. (2017). Controls on solute concentration-discharge relationships revealed by simultaneous hydrochemistry observations of hillslope runoff and stream flow: the importance of critical zone structure. Water Resour. Res. 53, 1424–1443. doi: 10.1002/2016WR019722
Kirchner, J. W., and Neal, C. (2013). Universal fractal scaling in stream chemistry and its implications for solute transport and water quality trend detection. Proc. Natl. Acad. Sci. U.S.A. 110, 12213–12218. doi: 10.1073/pnas.1304328110
Lenth, R. (2015). lsmeans: Least-Squares Means. Available at: http://cran.r-project.org/package=lsmeans
Li, L., C. Bao, P. L. Sullivan, S. Brantley, Y. Shi, and C. Duffy (2017a), Understanding watershed hydrogeochemistry: 2. Synchronized hydrological and geochemical processes drive stream chemostatic behavior. Water Resour. Res. 53, 2346–2367, doi: 10.1002/2016WR018935
Li, L., Maher, K., Navarre-Sitchler, A., Druhan, J., Meile, C., Lawrence, C., et al. (2017b). Expanding the role of reactive transport models in critical zone processes. Earth Sci. Rev. 165, 280–301. doi: 10.1016/j.earscirev.2016.09.001
Liu, F., Bales, R. C., Conklin, M. H., and Conrad, M. E. (2008). Streamflow generation from snowmelt in semi-arid, seasonally snow-covered, forested catchments, Valles Caldera, New Mexico. Water Resour. Res. 44, 1–13. doi: 10.1029/2007WR006728
Maher, K. (2011). The role of fluid residence time and topographic scales in determining chemical fluxes from landscapes. Earth Planet. Sci. Lett. 312, 48–58. doi: 10.1016/j.epsl.2011.09.040
McIntosh, J. C., Schaumberg, C., Perdrial, J., Harpold, A., Vázquez-Ortega, A., Rasmussen, C., et al. (2017). Geochemical evolution of the critical zone across variable time scales informs concentration-discharge relationships: jemez River Basin critical zone observatory. Water Resour. Res. 53, 4169–4196. doi: 10.1002/2016WR019712
Murphy, K. R., Stedmon, C. A., Graeber, D., and Bro, R. (2013). Fluorescence spectroscopy and multi-way techniques. PARAFAC. Anal. Methods 5:6557. doi: 10.1039/c3ay41160e
Musolff, A., Schmidt, C., Selle, B., and Fleckenstein, J. H. (2015). Catchment controls on solute export. Adv. Water Resour. 86, 133–146. doi: 10.1016/j.advwatres.2015.09.026
Nils Christophersen, R. P. H. (1992). Multivariate analysis of stream water chemical data: the use of principal components analysis for the end-member mixing problem. Water Resour. Res. 28, 99–107.
Ohno, T. (2002). Fluorescence inner-filtering correction for determining the humification index of dissolved organic matter. Environ. Sci. Technol. 36, 742–746. doi: 10.1021/es0155276
Perdrial, J., Brooks, P. D., Lohse, K. A., Harpold, A. A., Zapata-rios, X., Meixner, T., et al. (2018). Biogeochemistry A net ecosystem carbon budget for snow dominated forested headwater catchments: linking water and carbon fluxes to critical zone carbon storage. Biogeochemistry 138, 225–243. doi: 10.1007/s10533-018-0440-3
Perdrial, J. N., McIntosh, J., Harpold, A., Brooks, P. D., Zapata-Rios, X., Ray, J., et al. (2014). Stream water carbon controls in seasonally snow-covered mountain catchments: impact of inter-annual variability of water fluxes, catchment aspect and seasonal processes. Biogeochemistry 118, 273–290. doi: 10.1007/s10533-013-9929-y
Pinheiro, J., Bates, D., DebRoy, S., Sarkar, D., and R Core Team (2017). {nlme}: Linear and Nonlinear Mixed Effects Models. Available at: https://cran.r-project.org/package=nlme
Pokrovsky, O. S., Schott, J., and Dupré, B. (2006). Trace element fractionation and transport in boreal rivers and soil porewaters of permafrost-dominated basaltic terrain in Central Siberia. Geochim. Cosmochim. Acta 70, 3239–3260. doi: 10.1016/j.gca.2006.04.008
R Core Team (2017). R: A Language and Environment for Statistical Computing. Available at: https://www.r-project.org/
Reale, J. K., Van Horn, D. J., Condon, K. E., and Dahm, C. N. (2015). The effects of catastrophic wildfire on water quality along a river continuum. Freshw. Sci. 34, 1426–1442. doi: 10.1086/684001
Schmidt, S. K., and Lipson, D. A. (2004). Microbial growth under the snow: Implications for nutrient and allelochemical availability in temperate soils. Plant Soil 259, 1–7.
Stumm, W., and Morgan, J. J. (1981). Aquatic Chemistry: An Introduction Emphasizing Chemical Equilibria in Natural Waters. Hoboken, NJ: Wiley.
Thompson, S. E., Basu, N. B., Lascurain, J., Aubeneau, A., and Rao, P. S. C. (2011). Relative dominance of hydrologic versus biogeochemical factors on solute export across impact gradients. Water Resour. Res. 47, 1–20. doi: 10.1029/2010WR009605
Tripler, C. E., Kaushal, S. S., Likens, G. E., and Todd Walter, M. (2006). Patterns in potassium dynamics in forest ecosystems. Ecol. Lett. 9, 451–466. doi: 10.1111/j.1461-0248.2006.00891.x
Trostle, K. D., Ray Runyon, J., Pohlmann, M. A., Redfield, S. E., Pelletier, J., McIntosh, J., et al. (2016). Colloids and organic matter complexation control trace metal concentration-discharge relationships in Marshall Gulch stream waters. Water Resour. Res. 52, 7931–7944. doi: 10.1002/2016WR019072
Vaughan, M. C. H., Bowden, W. B., Shanley, J. B., Vermilyea, A., Sleeper, R., Gold, A. J., et al. (2017). High-frequency dissolved organic carbon and nitrate measurements reveal differences in storm hysteresis and loading in relation to land cover and seasonality. Water Resour. Res. 53, 5345–5363. doi: 10.1002/2017WR020491
Vazquez-Ortega, A., Hernandez-Ruiz, S., Amistadi, M. K., Rasmussen, C., and Chorover, J. (2014). Fractionation of dissolved organic matter by (Oxy)Hydroxide-coated sands: competitive sorbate displacement during reactive transport. Vadose Zone J. 13:7. doi: 10.2136/vzj2013.10.0179
Vázquez-Ortega, A., Huckle, D., Perdrial, J., Amistadi, M. K., Durcik, M., Rasmussen, C., et al. (2016). Solid-phase redistribution of rare earth elements in hillslope pedons subjected to different hydrologic fluxes. Chem. Geol. 426, 1–18. doi: 10.1016/j.chemgeo.2016.01.001
Vázquez-Ortega, A., Perdrial, J., Harpold, A., Zapata-Ríos, X., Rasmussen, C., McIntosh, J., et al. (2015). Rare earth elements as reactive tracers of biogeochemical weathering in forested rhyolitic terrain. Chem. Geol. 391, 19–32. doi: 10.1016/j.chemgeo.2014.10.016
Winnick, M. J., Carroll, R. W. H., Williams, K. H., Maxwell, R. M., Dong, W., and Maher, K. (2017). Snowmelt controls on concentration-discharge relationships and the balance of oxidative and acid-base weathering fluxes in an alpine catchment, East River, Colorado. Water Resour. Res. 53, 2507–2523. doi: 10.1002/2016WR019724
Wörman, A., Packman, A. I., Johansson, H., and Jonsson, K. (2002). Effect of flow-induced exchange in hyporheic zones on longitudinal transport of solutes in streams and rivers. Water Resour. Res. 38, 2-1–2-15. doi: 10.1029/2001WR000769
Wymore, A. S., Brereton, R. L., Ibarra, D. E., Maher, K., and McDowell, W. H. (2017). Critical zone structure controls concentration-discharge relationships and solute generation in forested tropical montane watersheds, Water Resour. Res. 53, 6279–6295. doi: 10.1002/2016WR020016
Zapata-Rios, X., Brooks, P. D., Troch, P. A., McIntosh, J., and Guo, Q. (2016). Influence of terrain aspect on water partitioning, vegetation structure and vegetation greening in high-elevation catchments in northern New Mexico. Ecohydrology 9, 782–795. doi: 10.1002/eco.1674
Keywords: critical zone, mineral weathering, groundwater, cluster analysis, PCA
Citation: Olshansky Y, White AM, Moravec BG, McIntosh J and Chorover J (2018) Subsurface Pore Water Contributions to Stream Concentration-Discharge Relations Across a Snowmelt Hydrograph. Front. Earth Sci. 6:181. doi: 10.3389/feart.2018.00181
Received: 02 June 2018; Accepted: 12 October 2018;
Published: 09 November 2018.
Edited by:
Pamela L. Sullivan, The University of Kansas, United StatesReviewed by:
Daniel Enrique Ibarra, Stanford University, United StatesMatthew Winnick, University of Massachusetts Amherst, United States
Elizabeth Herndon, Kent State University, United States
Copyright © 2018 Olshansky, White, Moravec, McIntosh and Chorover. This is an open-access article distributed under the terms of the Creative Commons Attribution License (CC BY). The use, distribution or reproduction in other forums is permitted, provided the original author(s) and the copyright owner(s) are credited and that the original publication in this journal is cited, in accordance with accepted academic practice. No use, distribution or reproduction is permitted which does not comply with these terms.
*Correspondence: Jon Chorover, Y2hvcm92ZXJAZW1haWwuYXJpem9uYS5lZHU=