Long-Term and Inter-annual Mass Changes in the Iceland Ice Cap Determined From GRACE Gravity Using Slepian Functions
 Max von Hippel
 Christopher Harig
- 1Department of Mathematics, The University of Arizona, Tucson, AZ, United States
- 2Department of Geosciences, The University of Arizona, Tucson, AZ, United States
The Gravity Recovery and Climate Experiment (GRACE) satellites have measured anomalies in the Earth's time-variable gravity field since 2002, allowing for the measurement of the melting of glaciers due to climate change. Many techniques used with GRACE data have difficulty constraining mass change in small regions, such as Iceland, often requiring broad averaging functions in order to capture trends. These techniques also capture data from nearby regions, causing signal leakage. Alternatively, Slepian functions may solve this problem by optimally concentrating data both in the spatial domain (e.g., Iceland) and spectral domain (i.e., the bandwidth of the data). We use synthetic experiments to show that Slepian functions can capture trends over Iceland without meaningful leakage and influence from ice changes in Greenland. We estimate a mass change over Iceland from GRACE data of approximately -9.3 ± 1.0 Gt/yr between March 2002 and November 2016, with an acceleration of 1.1 ± 0.5 Gt/yr2.
1. Introduction
Earth's mountain glaciers and ice caps have been losing mass in response to climate change (Stocker et al., 2013), and in 2014 this mass loss accounted for ~25% of current observed global mean sea level rise (Chen et al., 2017). About 11% of Iceland is covered by ~3,500 Gt of ice (Björnsson and Pálsson, 2008; Pfeffer et al., 2014). Between 1995 and 2013, Iceland experienced −9.5 ± 1.5 Gt/yr of average ice mass change, with negative acceleration (meaning an increasing rate of mass loss) (Björnsson et al., 2013). In Iceland, ice mass changes and volcanic activity are linked, as unloading caused by ice melt can affect the frequency and character of volcanic eruptions (e.g., Jull and McKenzie, 1996; Gee et al., 1998; Pagli and Sigmundsson, 2008; Schmidt et al., 2013). Detailed and accurate measurements of glacier mass balance are therefore important to understand not only sea level rise, but also volcanic activity in Iceland and potential international consequences. For example, the 2010 Eyjafjallajòkull eruption stranded over 8.5 million passengers of 108,000 canceled flights, costing airlines 1.7 billion USD (Alexander, 2013).
The Gravity Recovery and Climate Experiment (GRACE) consisted of twin satellites which orbited the Earth about 15 times per day from 2002 until 2017. Monthly global gravity field data products were derived from the recorded GPS positions of the satellites and changing distance between them (Tapley et al., 2004). GRACE data are sensitive to mass changes near Earth's surface, and have been used to investigate time variable changes in the cryosphere (Harig and Simons, 2012), hydrosphere (Longuevergne et al., 2010), atmosphere (Syed et al., 2005), and the solid Earth (Chen et al., 2007).
Various data centers and groups produce GRACE Level-2 products, and authors have used a diverse set of methodologies with these products to estimate ice mass changes for Iceland. These results are generally in agreement regardless of data center or methodology (Table 1), with most estimates falling between −11 and −12 Gt/yr. These results are not directly comparable because they span different time-periods, but we list them as well as some non-GRACE-based results.
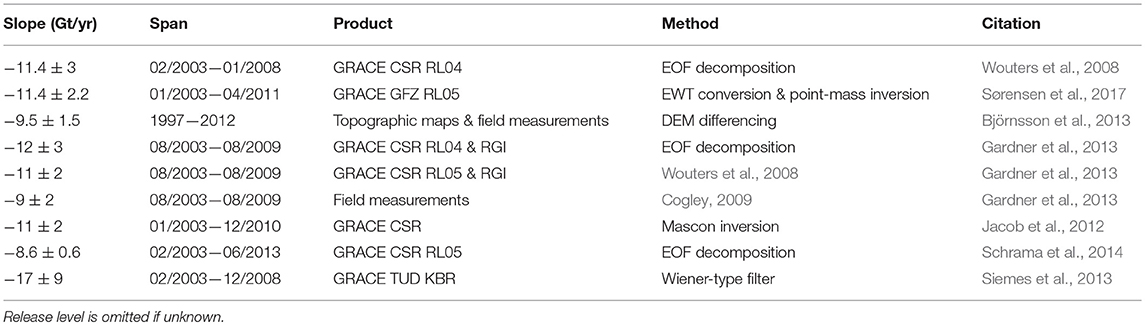
Table 1. Comparison of recent prior mass balance estimates for Iceland.
In this paper we derive ice mass loss trends over Iceland from GRACE data. In order to examine signals in Iceland separately from other mass changes we use a method of spatio-spectral localization on the sphere in which we transform the data onto a basis of spherical Slepian functions (Slepian, 1983; Simons et al., 2006). This technique has previously been applied to various spatial domains including Greenland (Harig and Simons, 2012, 2016), Antarctica (Harig and Simons, 2015), and the High Plains Aquifer in the USA (Longuevergne et al., 2010).
It is an open question how well Slepian functions perform for small regions, and we address that question with the case-study of Iceland. We perform a series of synthetic tests to examine the method's ability to resolve smaller magnitude signals (i.e., Iceland) in the presence of nearby larger magnitude signals (i.e., Greenland). We show the Slepian technique recovers trends over Iceland without meaningful leakage from Greenland, and produces similar results to comparable techniques where the leakage from Greenland is considerable and must be subtracted. Finally, we discuss the relationship between the recent ice mass changes over Iceland and volcanism.
2. Methods
We use GRACE Release 5 Level 2 monthly 60° gravity field data products from the Center for Space Research (CSR), spanning April 2002 to November 2016 (inclusive). These data are distributed in the form of Stokes coefficients, which describe the data in a spherical harmonic basis. To analyze the data, we use the method of Harig and Simons (2012) and transform GRACE data from the spherical harmonic basis into a Slepian basis. The code to perform Slepian analysis on the sphere is freely available online (Harig et al., 2015). Per the recommendations of the CSR and Jet Propulsion Laboratory (JPL) data centers (Center for Space Research, 2013), we replace the degree 2 order 0 coefficients with measurements from satellite laser ranging (Cheng et al., 2013). GRACE does not directly provide 1° coefficients, which are related to the relative positions of the center of mass and center of figure of the Earth's outer surface. We therefore use 1° coefficients calculated as in Swenson et al. (2008) (see GRACE Technical Note-13). Finally, we convert the geopotential data into surface mass density using the method of Wahr et al. (1998).
The spherical harmonic basis is orthonormal over the unit sphere but is not orthogonal over arbitrary regions of the sphere, which makes it ill-suited for the representation of GRACE data within spatially localized regions, such as Iceland. We therefore project our data onto a basis of spherical Slepian functions, which are orthogonal over arbitrary (and non-convex) regions of the sphere (Bates et al., 2017). Slepian functions, also known as prolate spheroidal wave functions, optimally concentrate energy (and consequentially sensitivity to the data) both in the spatial domain (e.g., Iceland) and spectral domain (in this case the bandwidth of the data, L) (Slepian, 1983).
The Shannon Number, N = (L+1)2A/(4π), is a measurement of spatiospectral optimization, and gives the number of optimal Slepian functions concentrated within a spectral domain and a spatial region of area A/(4π) on the unit sphere (Kennedy and Sadeghi, 2013). We project the GRACE data from the spherical harmonic basis onto the N most optimal functions of the Slepian basis concentrated within the region of interest and bandwidth of the data. We use synthetic experiments to determine whether these functions fully capture the trend over the region. If the Slepian functions are insufficiently spatially concentrated, then we are able to enlarge the region (therefore increasing N) by buffering the coastlines of the region by a specific distance, e.g., 1.0°. Our synthetic experiments inform the choice of a spatial buffer around the region within which the functions are better contained, as illustrated for Iceland and Greenland in Figure 1. These are described in more detail in section 3.
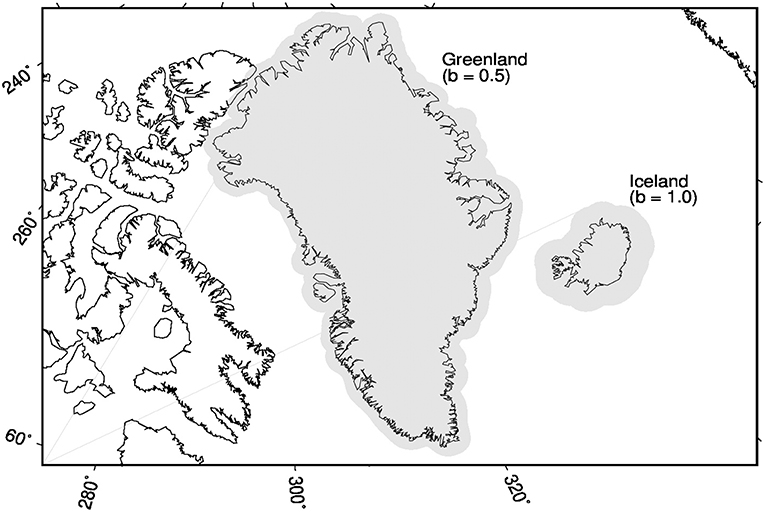
Figure 1. A map of the localization regions used for Greenland and Iceland. b denotes buffer. The gray areas represent the region of Greenland buffered by 0.5° and the region of Iceland buffered by 1.0°, respectively. We use an oblique Mercator projection centered in Greenland.
The GRACE data should be corrected for viscous deformation of the solid Earth due to glacial isostatic adjustment (GIA). Because of Iceland's unique tectonic setting, global models like Paulson et al. (2007) (as adjusted by Geruo et al., 2013) are likely inappropriate (Fleming et al., 2007; Jacoby et al., 2009). The Vatnajoköll ice cap is highly sensitive to GIA (Ivins, 2014), and GIA modeling for Iceland is non-trivial. Iceland-specific models generally agree that a weak upper mantle and Little Ice Age changes must be taken into account to match present day GPS displacement, and diverge significantly from globally calculated models. We choose not to correct our results for a specific GIA model, although we list several recent corrections in Table 2.
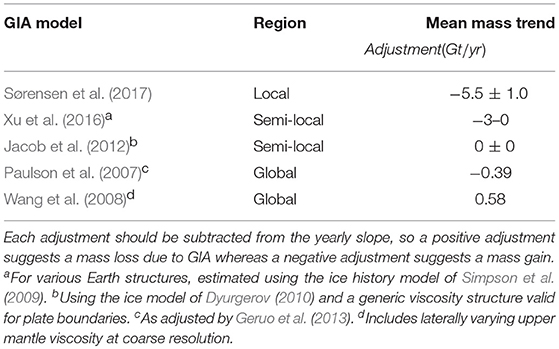
Table 2. GIA adjustments for Iceland.
We construct third-degree polynomial functions with annual and semi-annual periodicity to fit the time series of each Slepian coefficient. We do this for the N most optimally concentrated Slepian functions within the bandwidth of our data and buffered region of interest. The sum of integrals of these polynomials over time produce the total time-variable mass loss trend for the region. We loosely follow Wahr et al. (2006) and calculate conservative GRACE error estimates from any variance not represented by a linear fit to the time series of each spherical harmonic coefficient. The time-averaged variance is then used to construct a covariance matrix which is propagated to each Slepian function and their collective sum (Harig and Simons, 2012). Uncertainties are displayed with a 95% confidence interval. Additionally we solve for autocorrelation during the time series inversion, as suggested by Williams et al. (2014), which effectively reduces the degrees of freedom and increases the estimate of uncertainty (Harig and Simons, 2015). Error propagation from the original CSR processing is unknown, and could perhaps as much as double the uncertainty in the GRACE data (Horwath and Dietrich, 2006). For a related conversation and case study, see Schmidt et al. (2007) and Horwath and Dietrich (2009), respectively.
For a given region R of the unit sphere Ω we choose an optimal buffer through a synthetic experiment, as in Harig and Simons (2012). We use a “boxcap” function to construct a synthetic signal with 200 Gt/yr of mass loss uniformly distributed over R and 0 Gt/yr over (Ω − R). We add random Gaussian noise to the synthetic data with covariance matching that of the actual GRACE data. This introduces synthetic uncertainty which conservatively captures the actual uncertainty in the data product (Swenson and Wahr, 2006). From these synthetic data, we then use our Slepian based analysis to recover the trend over R at each combination of buffer from 0.0 to 2.0° and bandwidth from 0 to 60, and plot the resulting percent-recovered contours. We select the (buffer, bandwidth) tuple of bandwidth closest to 60 which best aligns with the 100% recovery contour of the original signal.
A large buffer for Iceland introduces the problem of signal leakage since Iceland neighbors another area with large mass change signals, Greenland. For non-overlapping regions the total mass change will be conserved, but there is the possibility that signals in Greenland might be observed in Iceland. We address this with a synthetic experiment which measures leakage from Greenland to Iceland and from Iceland to Greenland.
3. Results
Our first synthetic experiment informs our choice of a 1.0° buffer around Iceland. In Figure 2 we show the results of our recovery experiment for Iceland with a synthetic boxcap signal. For several combinations of spectral bandwidth and buffer extent the synthetic data trend can be completely recovered (panel A). In panel B we see that the green contour indicating 100% synthetic trend recovery corresponds to several different magnitudes of recovered trends from GRACE data. As buffer extent starts increasing above roughly 2.0°, the Iceland region begins to intersect with the Greenland region resulting in the larger negative trend values at large buffers. Overall, we choose the experimental case where L = 60, corresponding to a buffer size of 1.0°, because it maximizes the available bandwidth of the GRACE data and reduces the opportunity for signal leakage with the nearby region of Greenland (see below). When we repeat this synthetic experiment for Greenland, we confirm the 0.5° buffer choice of Harig and Simons (2012).
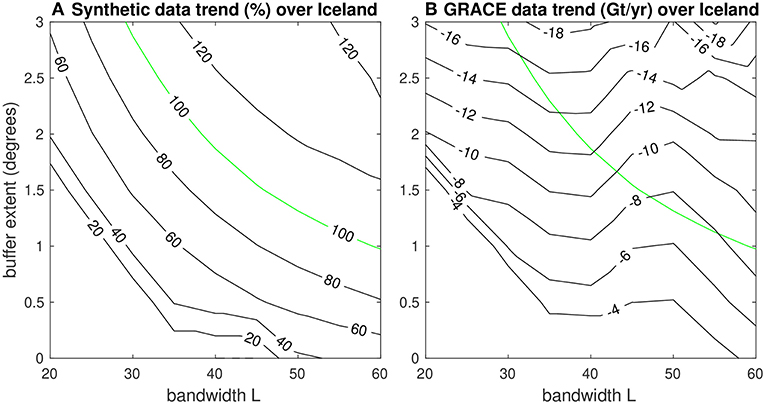
Figure 2. (A) Synthetic trend recovery over Iceland. The contours represent the percent signal recovered from the synthetic data for each choice of buffer and bandwidth. (B) Real trend recovery over Iceland. The contours represent the actual trend estimates calculated from GRACE data for each choice of buffer and bandwidth. The 100% recovery contour from (A) is shown in green. For the bandwidth of the data (L = 60), the 100% recovery contour closely aligns with the choice of a 1.0° buffer around Iceland.
Using a buffer of 0.5° around Greenland and 1.0° around Iceland, we measure -232.5 ± 6.3Gt/yr of mass change over Greenland and -9.3 ± 1.0Gt/yr of mass change over Iceland between March 2002 and November 2016 without correction for GIA. Correcting for GIA over Greenland using the model of Paulson et al. (2007), as adjusted by Geruo et al. (2013), we measure a slope of -238.2 ± 6.3Gt/yr. These results are discussed further below. Here we use these preliminary trends in a second synthetic experiment to estimate leakage between Iceland and Greenland. We use a “boxcap” function to create synthetic signals over the unbuffered regions as detailed in Table 3 below. Then for each region we compare the trends recovered with and without the other region in the synthetic data. Synthetic noise matching the covariance of the actual GRACE data is added to each region before recovery, in order to apply the uncertainty in the GRACE data to the synthetic data. Note that although the covariance matrix captures the uncertainty in the GRACE data, it does not necessarily capture uncertainty produced by center data processing, and we are unable to estimate or differentiate that uncertainty.
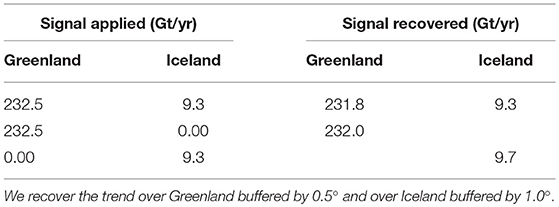
Table 3. Synthetic trends recovered over each region with and without leakage from the other region.
The absolute value of the difference in trends recovered over each region A with and without the other region B in the synthetic signal serves as an approximation of the leakage from B into A. Leakage from Greenland appears to cause ±0.40 Gt/yr of uncertainty in the trend over Iceland, and leakage from Iceland appears to cause ±0.24 Gt/yr of uncertainty in the trend over Greenland. These uncertainties are respectively smaller than our ±2σ uncertainties of ±0.99 Gt/yr over Iceland and ±6.29 Gt/yr over Greenland, meaning that uncertainty caused by leakage between Greenland and Iceland does not meaningfully influence the outcome of our measurement over either region. We therefore do not adjust our results for leakage.
In Figure 3 we show using a linear estimate that Iceland has lost -9.3 ± 1.0Gt/yr from 2002 through 2016. During and after 2010 the data diverge from the prior linear trend. In 2010 there is an abrupt decrease in mass, and from 2010 to 2016 the secular trend in mass is relatively flat. The abrupt change in 2010 occurs near in time to the Eyjafjallajükull volcanic eruption, which is highlighted on the graph in red. This eruption rapidly melted 0.2 Gt of ice through magma heat transfer and deposited an almost equal quantity of tephra (half of the total tephra emitted) within a 5 km radius of the summit caldera (Gudmundsson et al., 2012; Tarasewicz et al., 2012). Tephra distributed by the eruption across Iceland and Europe decreased exponentially in deposition thickness relative to distance from the summit caldera (Bonadonna et al., 2011), so that most of the distribution of tephra outside of this 5 km radius within Iceland ranged between 2 and 0.01 cm (Arnalds et al., 2013). If a tephra deposition is sufficiently thick, its insulating effect can overpower melting caused by decreased albedo, leading to a net decrease in melting (Östrem, 1959; Reid and Brock, 2010; Reznichenko et al., 2010). While climate change is the primary driver of glacial melting (Milne et al., 2009), the possibility that volcanic tephra deposition may have impacted short-term mass-loss trends over the Eyjafjallajükull ice cap merits future research.
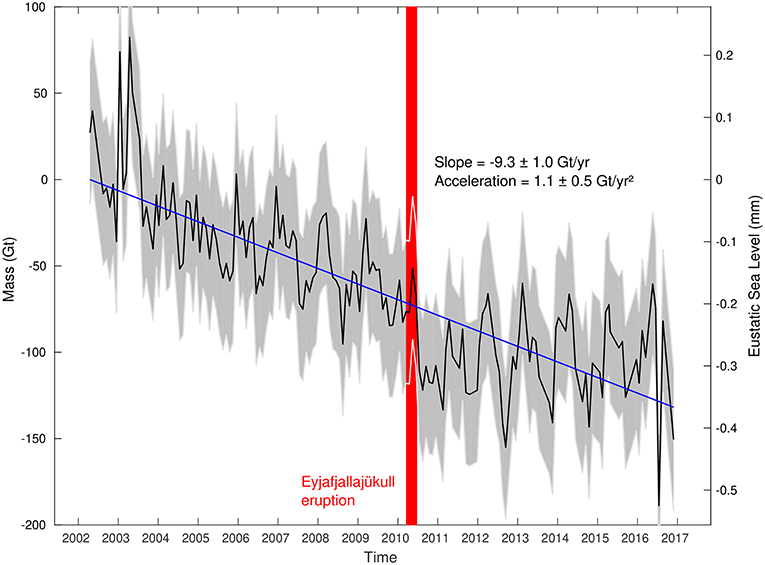
Figure 3. GRACE-derived mass loss trend over Iceland. The black line indicates the total integrated monthly mass change since 2002 (gigatons left axis and equivalent ecstatic sea level change, right axis), and the gray shaded region is its ±2σ uncertainty interval. The blue line is the best-fit linear equation over the entire timespan. The red strip highlights the time period of the Eyjafjallajükull volcanic eruption.
We next represent the total integrated mass change over Greenland (Figure 4) and Iceland (Figure 5) in map form. The map for Greenland has the same qualitative spatial distribution as the equivalent map by Harig and Simons (2012), but differs in magnitude because the date ranges are different. As expected, mass loss is mostly concentrated in the southeast and northwest coastal areas of Greenland. In Iceland, mass loss is centered over the eastern half of the island, which contains the larger volume of ice stored in glaciers and ice caps (Björnsson and Pálsson, 2008). The map for Greenland incorporates correction for GIA using the model of Paulson et al. (2007), adjusted by Geruo et al. (2013), but the map for Iceland is not corrected. GIA correction does not meaningfully impact the qualitative spatial distribution of either map, although when non-zero it does influence the color-indicated magnitudes.
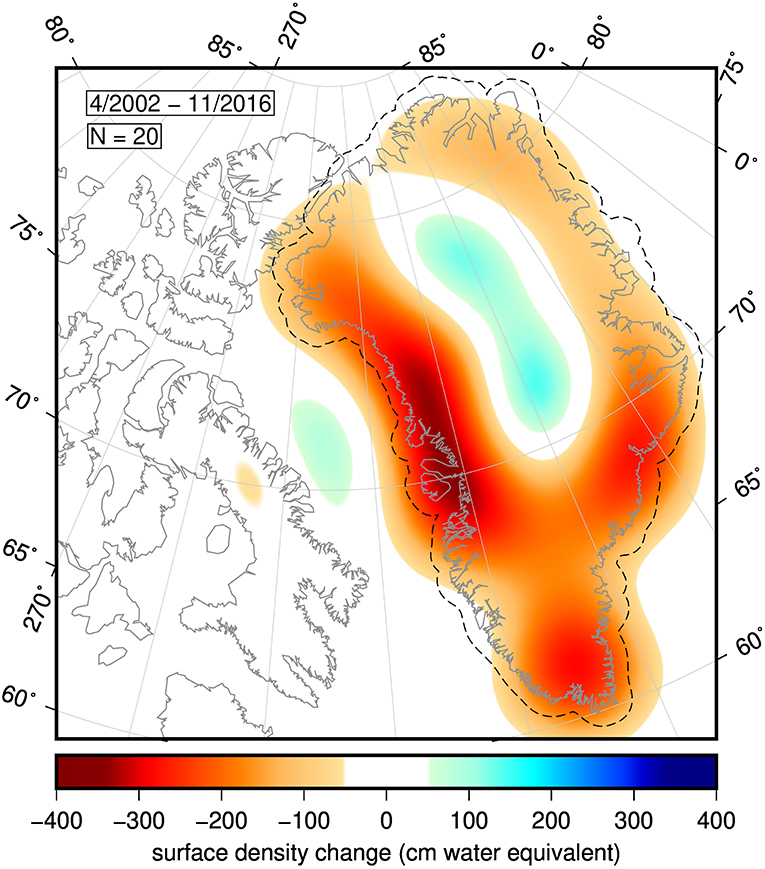
Figure 4. Geographic pattern of mass change over Greenland, shown in centimeters water equivalent. The dashed line around Greenland is its 0.5° buffer. The figure represents the total mass change over the date range specified in the top left. Below the date range is the Shannon number N = 20 for the buffered region and bandwidth of 60, indicating that the figure represents the sum of 20 optimal Slepian functions.
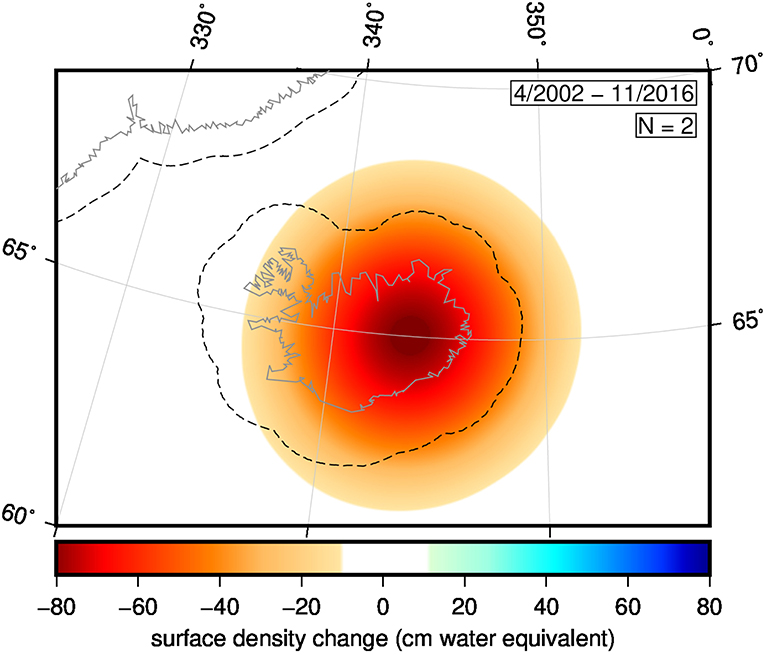
Figure 5. Geographic pattern of mass change over Iceland, shown in centimeters water equivalent. The dashed border in the northwest is the 0.5° buffer around Greenland, and the similar dashed border around Iceland is its 1.0° buffer. The figure represents the total mass change over the date range specified in the top right. Below the date range is the Shannon number N = 2 for the buffered region and bandwidth of 60, indicating that the figure represents the sum of two optimal Slepian functions, as pictured in Supplementary Figure 1.
The map for Iceland is simpler because there are only two Slepian functions optimally concentrated within the buffered region and bandwidth, in contrast to 20 such functions for Greenland. The reason for this is the bandwidth of the data; the spatial resolution of the GRACE data at L = 60 is ~330 km, and Iceland is roughly 500 km wide, so most of Iceland is described by a single independent point in the GRACE data. With a Shannon number of N = 2 the combined basis closely resembles an axisymmetric function. In contrast the N = 20 functions of Greenland mean that, in Greenland, the five largest functions by integral mass contribute 85% of the total mass change while the remaining functions primarily contribute changes to the spatial pattern (Harig and Simons, 2012).
4. Discussion
4.1. Changes in Mass Balance Rate
A change in slope clearly occurs between 2009 and 2011. To determine whether or not this change is actually coincident with the eruption, we iterated over each month from January 2009 until December 2011, and determined the absolute value of the difference between the best-fit slopes for the 2 years up until the specified month and the 2 years after. The maximum change occurs in December 2010 with a magnitude of Δ slope = 38.3 Gt/yr. Repeating this experiment with a 12-months running mean and 24-months slope on each side, we find the maximum change occurs in September 2011. Björnsson et al. (2013) find that the tephra effect of the eruption doubled the subsequent summer melt, which aligns well with our analysis that the biggest 4-years change in slope happened in the preceding winter. Compton et al. (2017) observe the same effect in cGPS data, with the same explanation. Coincident trend changes do not occur in other regions, such as Greenland (Velicogna et al., 2014; Harig and Simons, 2016), Antarctica (Velicogna et al., 2014), Alaska (Harig and Simons, 2016), or Siberia (Vey et al., 2013), supporting a hypothesis local to Iceland. However, lacking a climate-model analysis or global field data, we cannot rule out climate variability as the principal cause of the changing slope.
We observe a linear mass loss trend over Iceland of approximately −10.6 Gt/yr prior to the 2010 eruption (Table 4), which aligns well within the uncertainty of ±2.0 Gt/yr with prior estimates of −11.4 Gt/yr (Wouters et al., 2008; Sørensen et al., 2017) and −11.0 Gt/yr (Björnsson et al., 2013) over similar time periods. The observed positive acceleration prior to the 2010 eruption compares favorably with the 3.1±5.1 Gt/yr2 estimated over March 2003–February 2010 by Schrama and Wouters (2011). Using the Mascon Visualization Tool (Mas, 2016) with the GSFC mascons, we find that Iceland has a semi-annual amplitude of <5 Gt during and after the eruption, which is insufficient to fully explain either a change in slope on the order of ~8 Gt, or the estimated approximately −25 Gt of ice loss that occurred in 2010 (Björnsson et al., 2013). Compton et al. (2017) account for seasonal variations in their analysis, and find that the eruption caused a 2-months delay in seasonal melt patterns.
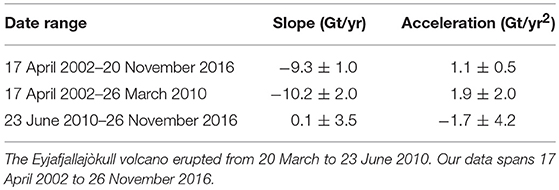
Table 4. Ice mass trends and accelerations over Iceland before and after the 2010 Eyjafjallajòkull eruption.
The apparent change in slope in 2010 raises the question of how much data are required to accurately measure either slope or acceleration over Iceland with a 1.0° buffer. We perform a final synthetic experiment to test our ability to recover the slope and acceleration parameters of our fit for Icelandic mass change. In this synthetic experiment we apply −200 Gt/yr uniformly distributed over Iceland buffered by 1.0° and then recover the first and second-order trends over cumulative 6-month intervals. In Figure 6A we see that after about 4 years the slope recovered is close to 100% of the slope applied, indicating that a minimum of 4 years of data are needed to accurately estimate the slope of a linear trend. To test acceleration recovery we apply a trend with an initial slope of −200 Gt/yr and acceleration of 1.0 Gt/yr2 uniformly distributed over Iceland buffered by 1.0° and then recover the acceleration over cumulative 6-month intervals (Figure 6B). We see that the recovered acceleration only begins to converge upon 100% of the applied acceleration after 12 years.
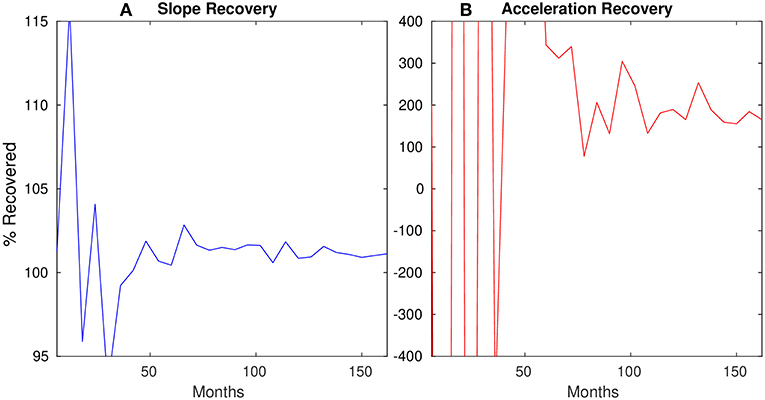
Figure 6. Results of our synthetic experiment for Iceland to test recovery of (A) slope and (B) acceleration parameters. For varying amounts of months of consistent synthetic data over Iceland we use our Slepian method to measure the slope and acceleration of the mass loss trend. The x-axis denotes the number of cumulative months of synthetic data processed, and the y-axis denotes the , where R is the recovered slope or acceleration and A is the applied synthetic slope or acceleration.
Wouters et al. (2013) find that at least 10 years of data for Antarctica or 20 for Greenland are required to resolve the long-term acceleration trend over each within an accuracy of ±10 Gt/yr2. Since Iceland is much smaller than Greenland or Antarctica and exhibits orders of magnitude less mass change, its long-term acceleration may require even more time to distinguish within the context of short-term ice cap variations. As with the larger Greenland and Antarctic ice sheets, stochastic variability is likely the main reason that short term and long term trends do not necessarily agree.
4.2. Comparison With Other Techniques
Alternatives to Slepian optimization for GRACE data include the filters of Siemes et al. (2013) and Kvas and Mayer-Gürr (2016), and mascons from the Center for Space Research at the University of Texas Austin (CSR), NASA Goddard Space Flight Center (GSFC), NASA Jet Propulsion Laboratory (JPL), and German Research Center for Geosciences (GFZ). Siemes et al. (2013) estimate a mass loss of 17 Gt/yr over Iceland from 2003 to 2008, larger than our estimate of 11 Gt/yr over the same period. Their uncertainty discounting GIA correction is ±2 Gt/yr; ours is ±3.1 Gt/yr. They use a 50 km band around each spatial domain, which is smaller than the 1.0° buffer we use for Iceland, and comparable to the 0.5° buffer we use for Greenland. The Kalman filter of Kurtenbach et al. (2012) is optimized for temporal resolution, achieving a maximum spatial resolution of n = 40 (Chen et al., 2017); we achieve n = 60. It is also model-based, unlike the Slepian technique (we make no direct comparison because (Kurtenbach et al., 2012) do not evaluate Iceland).
We perform a direct comparison to the GSFC mascon solutions (Luthcke et al., 2013), calculating the total mass trend in their recommended method. Evaluating the Goddard mascons, we measured a mass-loss trend of −9.93 Gt/yr over 01/2003 - 5/20161, which compares favorably with our estimate of −9.3 ± 1 Gt/yr over our full timespan. This trend estimate can be visualized using the Colorado Center for Astrodynamics Research mascon visualization tool (Mas, 2016). CSR mascons are not recommended for basins of area below 200,000 km2 (Save et al., 2016), but the area of Iceland is 103,001 km2. GSFC mascons require about 600 km of buffer (Luthcke et al., 2013), exceeding our buffers for Iceland and Greenland. Iceland intersects five JPL mascons, one of which touches Greenland (Wiese et al., 2016). Recovering Iceland's mass loss from JPL mascons would therefore require a large buffer and detailed consideration of leakage from Greenland. GFZ mascons are similar to CSR ones. In general, mascons may intersect small spatial domains in arbitrarily inconvenient ways, forcing the use of large spatial buffers, whereas Slepian optimization uses basis elements specifically concentrated within the area of interest.
5. Conclusions
We find that mass loss trends over Iceland can be accurately measured in GRACE data using Slepian functions without explicitly accounting for leakage from nearby Greenland. We measure an average mass loss trend over Iceland of -9.3 ± 1.0Gt/yr between April 2002 and November 2016, which agrees well with the previous work of Björnsson et al. (2013) who found an average trend of −9.5 ± 1.5 Gt/yr since 1995. Prior to March 2010, we observe a linear trend of −10.2 ± 2.0 Gt/yr, which aligns closely with existing estimates over that time period.
The feedback loops of ice unloading, seasonal weather patterns, and volcanic activity in Iceland are poorly understood, complicating prediction of long-term mass loss after the eruption (Compton et al., 2017). We do not consider the possible role of hydropower water reservoirs in delaying runoff, which may be substantial (Sørensen et al., 2017). We consider <6 years of data after the 2010 eruption, and <10 years of data before it. Wouters et al. (2013) as well as our synthetic slope and acceleration recovery experiments suggest that both date ranges are insufficient to accurately measure acceleration in the GRACE data.
If Iceland returns to a mass loss trend between −9.7 and −10.6 Gt/yr, it could completely deglaciate within 3 centuries (Pfeffer et al., 2014). However, feedback loops of climate change, post-glacial rebound, ice mass unloading, and volcanic activity will likely increase the variability of annual mass loss trends in Iceland (Björnsson et al., 2013; Compton et al., 2015, 2017). More GRACE data are required to determine long-term trends (Wouters et al., 2013). The GRACE Follow-On (GRACE-FO) mission launched on May 22, 2018. By incorporating GRACE-FO data with vertical GPS measurements, satellite imaging of tephra deposition, and in situ measurements, future research may better illuminate the post-eruption mass-loss trend over Iceland.
Code Availability
The code used in this work is available freely online (Harig et al., 2015). Installation instructions for the various Slepian code repositories can be found at http://github.com/Slepian/Slepian.
Author Contributions
MvH wrote code, performed research, and wrote the paper. CH mentored Max through the project, and edited the paper.
Conflict of Interest Statement
The authors declare that the research was conducted in the absence of any commercial or financial relationships that could be construed as a potential conflict of interest.
Acknowledgments
This work was supported by a NASA Space Grant Internship to MvH at the University of Arizona. CH acknowledges support from the TRIFF-WEES program at the University of Arizona. We thank Rick Bennett for helpful discussions, and two reviewers for their comments to improve the manuscript.
Supplementary Material
The Supplementary Material for this article can be found online at: https://www.frontiersin.org/articles/10.3389/feart.2019.00171/full#supplementary-material
Supplementary Figure 1. Two optimal Slepian functions describing mass changes over Iceland.
Footnotes
1. ^Calculated over 17 mascons, in region 80, basin 4052.
References
Alexander, D. (2013). Volcanic ash in the atmosphere and risks for civil aviation: a study in European crisis management. Int. J. Disast. Risk Sci. 4, 9–19. doi: 10.1007/s13753-013-0003-0
Arnalds, O., Thorarinsdottir, E. F., Thorsson, J., Waldhauserova, P. D., and Agustsdottir, A. M. (2013). An extreme wind erosion event of the fresh Eyjafjallajökull 2010 volcanic ash. Sci. Rep. 3:1257. doi: 10.1038/srep01257
Bates, A. P., Khalid, Z., and Kennedy, R. A. (2017). Efficient computation of Slepian functions for arbitrary regions on the sphere. IEEE Trans. Sig. Process 65, 4379–4393. doi: 10.1109/TSP.2017.2712122
Björnsson, H., and Pálsson, F. (2008). Icelandic glaciers. Jökull 58, 365–386. Available online at: http://jardvis.hi.is/sites/jardvis.hi.is/files/Pdf_skjol/Jokull58_pdf/jokull58-bjornssonpalsson.pdf
Björnsson, H., Pálsson, F., Gudmundsson, S., Magnússon, E., Adalgeirsdóttir, G., Jóhannesson, T., et al. (2013). Contribution of Icelandic ice caps to sea level rise: trends and variability since the little ice age. Geophys. Res. Lett. 40, 1546–1550. doi: 10.1002/grl.50278
Bonadonna, C., Genco, R., Gouhier, M., Pistolesi, M., Cioni, R., Alfano, F., et al. (2011). Tephra sedimentation during the 2010 Eyjafjallajökull eruption (Iceland) from deposit, radar, and satellite observations. J. Geophys. Res. 116, 1–20. doi: 10.1029/2011JB008462
Center for Space Research. (2013). Further Details on RL05 Re-processing. Available online at: http://www2.csr.utexas.edu/grace/RL05_details.html (accessed March 03, 2018).
Chen, J., Wilson, C., Tapley, B., and Grand, S. (2007). GRACE detects coseismic and postseismic deformation from the Sumatra-Andaman earthquake. Geophys. Res. Lett. 34. doi: 10.1029/2007GL030356
Chen, X., Zhang, X., Church, J. A., Watson, C. S., King, M. A., Monselesan, D., et al. (2017). The increasing rate of global mean sea-level rise during 1993–2014. Nat. Clim. Change 7, 492–495. doi: 10.1038/nclimate3325
Cheng, M., Tapley, B. D., and Ries, J. C. (2013). Deceleration in the earth's oblateness. J. Geophys. Res. 118, 740–747. doi: 10.1002/jgrb.50058
Cogley, J. G. (2009). Geodetic and direct mass-balance measurements: comparison and joint analysis. Ann. Glaciol. 50, 96–100. doi: 10.3189/172756409787769744
Compton, K., Bennett, R. A., and Hreinsdóttir, S. (2015). Climate-driven vertical acceleration of Icelandic crust measured by continuous GPS geodesy. Geophys. Res. Lett. 42, 743–750. doi: 10.1002/2014GL062446
Compton, K., Bennett, R. A., Hreinsdóttir, S., van Dam, T., Bordoni, A., Barletta, V., et al. (2017). Short-term variations of Icelandic ice cap mass inferred from cGPS coordinate time series. Geochem. Geophys. Geosyst. 18, 2099–2119. doi: 10.1002/2017GC006831
Dyurgerov, M. (2010). Reanalysis of glacier changes: from the IGY to the IPY, 1960–2008. Data Glaciol. Stud. 108, 1–116.
Fleming, K., Martinec, Z., and Wolf, D. (2007). “Glacial-isostatic adjustment and the viscosity structure underlying the Vatnajökull Ice Cap, Iceland,” in Deformation and Gravity Change: Indicators of Isostasy, Tectonics, Volcanism, and Climate Change, eds D. Wolf and J. Fernández (Casa de los Volcanes on Lanzarote: Springer), 751–768.
Gardner, A. S., Moholdt, G., Cogley, J. G., Wouters, B., Arendt, A. A., Wahr, J., et al. (2013). A reconciled estimate of glacier contributions to sea level rise: 2003 to 2009. Science 340, 852–857. doi: 10.1126/science.1234532
Gee, M. M., Taylor, R., Thirlwall, M., and Murton, B. (1998). Glacioisostacy controls chemical and isotopic characteristics of tholeiites from the Reykjanes Peninsula, SW Iceland. Earth Planet. Sci. Lett. 164, 1–5.
Geruo, A., Wahr, J., and Zhong, S. (2013). Computations of the viscoelastic response of a 3-D compressible earth to surface loading: an application to glacial isostatic adjustment in Antarctica and Canada. Geophys. J. Int. 192, 557–572. doi: 10.1093/gji/ggs030
Gudmundsson, M. T., Thordarson, T., Höskuldsson, Á., Larsen, G., Björnsson, H., Prata, F. J., et al. (2012). Ash generation and distribution from the April-May 2010 eruption of Eyjafjallajökull, Iceland. Sci. Rep. 2:572. doi: 10.1038/srep00572
Harig, C., Lewis, K. W., Plattner, A., and Simons, F. J. (2015). A suite of software analyzes data on the sphere. Eos 96, 18–22. doi: 10.1029/2015EO025851
Harig, C., and Simons, F. J. (2012). Mapping Greenland's mass loss in space and time. Proc. Natl. Acad. Sci. U.S.A. 109, 19934–19937. doi: 10.1073/pnas.1206785109
Harig, C., and Simons, F. J. (2015). Accelerated West Antarctic ice mass loss continues to outpace East Antarctic gains. Earth Planet. Sci. Lett. 415, 134–141. doi: 10.1016/j.epsl.2015.01.029
Harig, C., and Simons, F. J. (2016). Ice mass loss in Greenland, the Gulf of Alaska, and the Canadian Archipelago: seasonal cycles and decadal trends. Geophys. Res. Lett. 43, 3150–3519. doi: 10.1002/2016GL067759
Horwath, M., and Dietrich, R. (2006). Errors of regional mass variations inferred from GRACE monthly solutions. Geophys. Res. Lett. 33, 849–864. doi: 10.1029/2005GL025550
Horwath, M., and Dietrich, R. (2009). Signal and error in mass change inferences from GRACE: the case of Antarctica. Geophys. J. Int. 177, 849–864. doi: 10.1111/j.1365-246X.2009.04139.x
Jacob, T., Wahr, J., Pfeffer, W. T., and Swenson, S. (2012). Recent contributions of glaciers and ice caps to sea level rise. Nature 482:514. doi: 10.1038/nature10847
Jacoby, W. R., Hartmann, O., Wallner, H., Smilde, P. L., Buerger, S., Sjöberg, L. E., et al. (2009). Temporal gravity variations near shrinking Vatnajökull ice cap, Iceland. Pure Appl. Geophys. 166, 1283–1302. doi: 10.1007/s00024-009-0499-9
Jull, M., and McKenzie, D. (1996). The effect of deglaciation on mantle melting beneath Iceland. J. Geophys. Res. Solid Earth 101, 21815–21828.
Kennedy, R. A., and Sadeghi, P. (2013). Hilbert Space Methods in Signal Processing. Cambridge: Cambridge University Press.
Kurtenbach, E., Eicker, A., Mayer-Gürr, T., Holschneider, M., Hayn, M., Fuhrmann, M., et al. (2012). Improved daily GRACE gravity field solutions using a Kalman smoother. J. Geodyn. 59, 39–48. doi: 10.1016/j.jog.2012.02.006
Kvas, A., and Mayer-Gürr, T. (2016). “Kalman filtered daily GRACE gravity field solutions in near real-time-first steps,” in ESA Living Planet Symposium 2016 (Prag).
Longuevergne, L., Scanlon, B. R., and Wilson, C. R. (2010). GRACE hydrological estimates for small basins: evaluating processing approaches on the high plains aquifer, USA. Water Resour. Res. 46, 1–15. doi: 10.1029/2009WR008564
Luthcke, S. B., Sabaka, T., Loomis, B., Arendt, A., McCarthy, J., and Camp, J. (2013). Antarctica, Greenland and Gulf of Alaska land-ice evolution from an iterated GRACE global mascon solution. J. Glaciol. 59, 613–631. doi: 10.3189/2013JoG12J147
Mascon Visualization Tool. (2016). Available online at: https://ccar.colorado.edu/grace/gsfc.html (accessed May 3, 2019).
Milne, G. A., Gehrels, W. R., Hughes, C. W., and Tamisiea, M. E. (2009). Identifying the causes of sea-level change. Nat. Geosci. 2, 471–478. doi: 10.1038/ngeo544
Östrem, G. (1959). Ice melting under a thin layer of Moraine, and the existence of ice cores in Moraine ridges. Geogr. Ann. 41, 228–230. doi: 10.1080/20014422.1959.11907953
Pagli, C., and Sigmundsson, F. (2008). Will present day glacier retreat increase volcanic activity? Stress induced by recent glacier retreat and its effect on magmatism at the Vatnajökull ice cap, Iceland. Geophys. Res. Lett. 35, 1–5. doi: 10.1029/2008GL033510
Paulson, A., Zhong, S., and Wahr, J. (2007). Inference of mantle viscosity from GRACE and relative sea level data. Geophys. J. Int. 171, 497–508. doi: 10.1111/j.1365-246X.2007.03556.x
Pfeffer, W. T., Arendt, A. A., Bliss, A., Bolch, T., Cogley, J. G., Gardner, A. S., et al. (2014). The Randolph Glacier Inventory: a globally complete inventory of glaciers. J. Glaciol. 60, 537–552. doi: 10.3189/2014JoG13J176
Reid, T. D., and Brock, B. W. (2010). An energy-balance model for debris-covered glaciers including heat conduction through the debris layer. J. Glaciol. 56, 903–916. doi: 10.3189/002214310794457218
Reznichenko, N., Davies, T., Shulmeister, J., and McSaveney, M. (2010). Effects of debris on ice-surface melting rates: an experimental study. J. Glaciol. 56, 384–394. doi: 10.3189/002214310792447725
Save, H., Bettadpur, S., and Tapley, B. D. (2016). High-resolution CSR GRACE RL05 mascons. J. Geophys. Res. 121, 7547–7569. doi: 10.1002/2016JB013007
Schmidt, P., Lund, B., Hieronymus, C., Maclennan, J., Árnadóttir, T., and Pagli, C. (2013). Effects of present-day deglaciation in Iceland on mantle melt production rates. J. Geophys. Res. 118, 3366–3379. doi: 10.1002/jgrb.50273
Schmidt, R., Flechtner, F., König, R., Meyer, U., Neumayer, K.-H., Reigber, C., et al. (2007). “GRACE time-variable gravity accuracy assessment,” in Dynamic Planet, eds C. Rizos, and P. Tregoning (Berlin; Heidelberg: Springer), 237–243.
Schrama, E., and Wouters, B. (2011). Revisiting Greenland ice sheet mass loss observed by GRACE. J. Geophys. Res. 116, 1–10. doi: 10.1029/2009JB006847
Schrama, E., Wouters, B., and Rietbroek, R. (2014). A mascon approach to assess ice sheet and glacier mass balances and their uncertainties from GRACE data. J. Geophys. Res. 119, 6048–6066. doi: 10.1002/2013JB010923
Siemes, C., Ditmar, P., Riva, R., Slobbe, D., Liu, X., and Farahani, H. H. (2013). Estimation of mass change trends in the Earth's system on the basis of GRACE satellite data, with application to Greenland. J. Geodesy 87, 69–87. doi: 10.1007/s00190-012-0580-5
Simons, F. J., Dahlen, F. A., and Wieczorek, M. A. (2006). Spatiospectral concentration on a sphere. SIAM Rev. 48, 504–536. doi: 10.1137/S0036144504445765
Simpson, M. J., Milne, G. A., Huybrechts, P., and Long, A. J. (2009). Calibrating a glaciological model of the Greenland ice sheet from the Last Glacial Maximum to present-day using field observations of relative sea level and ice extent. Quat. Sci. Rev. 28, 1631–1657. doi: 10.1016/j.quascirev.2009.03.004
Slepian, D. (1983). Some comments on Fourier analysis, uncertainty and modeling. SIAM Rev. 25, 379–393. doi: 10.1137/1025078
Sørensen, L. S., Jarosch, A. H., AOalgeirsdóttir, G., Barletta, V. R., Forsberg, R., Pálsson, F., et al. (2017). The effect of signal leakage and glacial isostatic rebound on GRACE-derived ice mass changes in Iceland. Geophys. J. Int. 209, 226–233. doi: 10.1093/gji/ggx008
Stocker, T., Qin, D., Plattner, G.-K., Tignor, M., Allen, S. K., Boschung, J. (Eds.). (2013). Climate Change 2013: The Physical Science Basis. Contribution of Working Group I to the Fifth Assessment Reportntribution of Working Group I to the Fifth Assessment Report, Technical Report. Cambridge: Intergovernmental Panel on Climate Change.
Swenson, S., Chambers, D., and Wahr, J. (2008). Estimating geocenter variations from a combination of GRACE and ocean model output. J. Geophys. Res. 113, 1–12. doi: 10.1029/2007JB005338
Swenson, S., and Wahr, J. (2006). Post-processing removal of correlated errors in GRACE data. Geophys. Res. Lett. 33, 1–4. doi: 10.1029/2005GL025285
Syed, T. H., Famiglietti, J. S., Chen, J., Rodell, M., Seneviratne, S. I., Viterbo, P., et al. (2005). Total basin discharge for the Amazon and Mississippi river basins from GRACE and a land-atmosphere water balance. Geophys. Res. Lett. 32, 1–5. doi: 10.1029/2005GL024851
Tapley, B. D., Bettadpur, S., Ries, J. C., Thompson, P. F., and Watkins, M. M. (2004). GRACE measurements of mass variability in the earth system. Science 305, 503–505. doi: 10.1126/science.1099192
Tarasewicz, J., White, R. S., Woods, A. W., Brandsdóttir, B., and Gudmundsson, M. T. (2012). Magma mobilization by downward-propagating decompression of the Eyjafjallajökull volcanic plumbing system. Geophys. Res. Lett. 39:19309. doi: 10.1029/2012GL053518
Velicogna, I., Sutterley, T., and Van Den Broeke, M. (2014). Regional acceleration in ice mass loss from Greenland and Antarctica using GRACE time-variable gravity data. Geophys. Res. Lett. 41, 8130–8137. doi: 10.1002/2014GL061052
Vey, S., Steffen, H., Müller, J., and Boike, J. (2013). Inter-annual water mass variations from GRACE in central Siberia. J. Geodesy 87, 287–299. doi: 10.1007/s00190-012-0597-9
Wahr, J., Molenaar, M., and Bryan, F. (1998). Time variability of the Earth's gravity field: Hydrological and oceanic effects and their possible detection using GRACE. J. Geophys. Res. 103, 30205–30230. doi: 10.1029/98JB02844
Wahr, J., Swenson, S., and Velicogna, I. (2006). Accuracy of GRACE mass estimates. Geophys. Res. Lett. 33, 1–5. doi: 10.1029/2005GL025305
Wang, H., Wu, P., and van der Wal, W. (2008). Using postglacial sea level, crustal velocities and gravity-rate-of-change to constrain the influence of thermal effects on mantle lateral heterogeneities. J. Geodyn. 46, 104–117. doi: 10.1016/j.jog.2008.03.003
Wiese, D. N., Landerer, F. W., and Watkins, M. M. (2016). Quantifying and reducing leakage errors in the JPL RL05M GRACE mascon solution. Water Resour. Res. 52, 7490–7502. doi: 10.1002/2016WR019344
Williams, S. D., Moore, P., King, M. A., and Whitehouse, P. L. (2014). Revisiting GRACE Antarctic ice mass trends and accelerations considering autocorrelation. Earth Planet. Sci. Lett. 385, 12–21. doi: 10.1016/j.epsl.2013.10.016
Wouters, B., Bamber, J. L., van den Broeke, M. R., Lenaerts, J. T. M., and Sasgen, I. (2013). Limits in detecting acceleration of ice sheet mass loss due to climate variability. Nat. Geosci. 6, 613–616. doi: 10.1038/ngeo1874
Wouters, B., Chambers, D., and Schrama, E. (2008). GRACE observes small-scale mass loss in Greenland. Geophys. Res. Lett. 35, 1–5. doi: 10.1029/2008GL034816
Keywords: GRACE, Slepian, Iceland, mass loss, ice, gravity, optimization
Citation: von Hippel M and Harig C (2019) Long-Term and Inter-annual Mass Changes in the Iceland Ice Cap Determined From GRACE Gravity Using Slepian Functions. Front. Earth Sci. 7:171. doi: 10.3389/feart.2019.00171
Received: 06 February 2019; Accepted: 19 June 2019;
Published: 04 July 2019.
Edited by:
Alun Hubbard, UiT the Arctic University of Norway, NorwayReviewed by:
Reinhard Dietrich, Dresden University of Technology, GermanyErik R. Ivins, NASA Jet Propulsion Laboratory (JPL), United States
Copyright © 2019 von Hippel and Harig. This is an open-access article distributed under the terms of the Creative Commons Attribution License (CC BY). The use, distribution or reproduction in other forums is permitted, provided the original author(s) and the copyright owner(s) are credited and that the original publication in this journal is cited, in accordance with accepted academic practice. No use, distribution or reproduction is permitted which does not comply with these terms.
*Correspondence: Max von Hippel, maxvonhippel@email.arizona.edu