 Zeng Jia-jun
 Zhang Zhi-Jun
- School of Resource Environment and Safety Engineering, University of South China, Hengyang, China
To accurately determine the stress characteristics of underground rock masses subjected to hydraulic pressure, and to reveal the crack-initiation, crack-propagation, and macromechanical characteristics of fractured rock masses under long-term hydraulic pressure, a hydraulic loading system that can deliver continuous and stable hydraulic pressure was developed. The system is composed of a device that supplies a stable hydraulic pressure, flowmeter, pressure gauge, acoustic emission instrument, loading device, and control system. The main innovation of the test system lies in the stabilization of the hydraulic pressure, which distinguishes the new system from traditional hydraulic loading devices and provides several advantages. First, in the new system, air pressure serves as the driving force, and water and gas coexist in the same cavity. Given the high compressibility of gas, the hydraulic pressure can still reach relative stability during crack initiation and propagation in the specimen. Second, the device is capable of long-term operation with low energy consumption. In contrast to conventional hydraulic loading systems based on servo control, the hydraulic pressure of the new device can be maintained for a long time with little energy consumption. Finally, the device is simple to operate, is low in cost, convenient to assemble, and can be used in single-, double-, and triple-axis tests. The accuracy and reliability of the test system were verified through its application in the uniaxial compression test of a fractured body under the action of stable hydraulic pressure. The test system provides the foundation for the study of the physical mechanisms of deep underground rock masses subjected to long-term, stable seepage pressure.
Introduction
During long-term geological processes, natural rock masses develop defects such as joints, cracks, and voids, which affect the mechanical properties of the rock mass. These defects in the rock mass also provide transport channels and storage locations for groundwater. Under the action of ground stresses or engineering disturbances, groundwater can enter the joints or cracks in the rock mass, resulting in the expansion of the original joints and cracks. Infiltration by groundwater thus has a great influence on the evolution of cracks and the macroscopic mechanical properties of rock and can contribute to the instability of underground structures. Therefore, it is of great theoretical and practical significance to study the fracture mechanics of fractured rock masses under the action of hydraulic pressure.
To explore the fracture mechanism of rock under the action of hydraulic pressure, mechanical models of rock fracture under hydraulic action have been established, and the mechanisms of fracture evolution have been analyzed based on the theories of fracture mechanics and hydromechanics (Liu et al., 2014, 2019; Sampath et al., 2018; Zhang et al., 2018; Gao et al., 2019; Zhao et al., 2019a, b). While the theory underlying the hydraulic fracturing of rock masses is mature, further tests are needed to verify the theory before it is applied in engineering. Using hydraulic loading systems, fracture experiments can be carried out to explore the macromechanical behavior and crack evolution of rock masses under hydraulic pressure. For example, Zhuang et al. (2016, 2019) developed hydraulic fracturing test equipment for core rock samples and conducted a series of tests. Using a high-pressure hydromechanical test system, Zhao et al. (2017a) performed permeability tests on fractured limestone samples and analyzed the mechanical characteristics and permeability during the stress–strain process. Zhao et al. (2017b) the MTS815 Rock Mechanics Test System to conduct transient pulse tests on single rock fissures under different pressure conditions, and quantify the morphological changes of the fracture surface after the transient pulse test or under the hydro-mechanical coupling effect. To study the macromechanical characteristics and crack evolution of rock under the influence of hydraulic pressure, Hao et al. (2018) refitted a hydraulic loading device with a DCS-200 loading control system and evaluated the hydraulic fracturing of rock masses under uniaxial compression. Using a coupled thermal-hydro-mechanical test system, Li et al. (2018) tested single-fracture red sandstone specimens under three-dimensional stress and evaluated the energy and crack propagation rate. Using a GCTS RTX-3000 triaxial rock testing system, Zhou et al. (2018) and Xing et al. (2019) applied axial pressure, confining pressure, and water pressure to prefabricated single-crack rock samples and analyzed the stress–strain and crack evolution characteristics of the crack bodies under hydraulic action. To study fracture and fissure development in rock, Mei et al. (2019) prepared a three-dimensional cylindrical test piece and applied axis pressure and water pressure to the rock body using a servo-controlled RLW–1000G rock rheology testing system.
The hydraulic test systems used in the above studies adopt servo control, which is easy to realize during hydraulic tests under triaxial confining pressure. However, servo control is complex and costly. Furthermore, at the moment of fracture initiation, the expansion and instability of the rock mass causes fluid loss and a reduction in volume; this can result in delayed servo response and hydraulic instability. In contrast, groundwater generates stable hydraulic pressure in deep fissured rock masses. The hydraulic pressure from groundwater remains stable even during crack initiation, crack propagation, and rock failure. Thus, to experimentally achieve stable hydraulic pressure, a test system that uses air pressure to supply stable hydraulic pressure was developed in this study. In the new system, water and gas coexist in a cavity, and gas provides pressure to the water body in real time. Due to the high-pressure contraction of gas, the hydraulic pressure reaches a relatively stable state. This test system is easy to operate, low cost, consumes little energy, and can supply long-term stable hydraulic pressure under uniaxial, biaxial, and triaxial loading. The developed test system was successfully used to conduct uniaxial compression tests of fractured rock masses under stable hydraulic pressure.
Test System and Functions
The test system is composed of a stable hydraulic pressure supply device, flowmeter, pressure gauge, acoustic emission instrument, loading device, and control system (Figure 1).
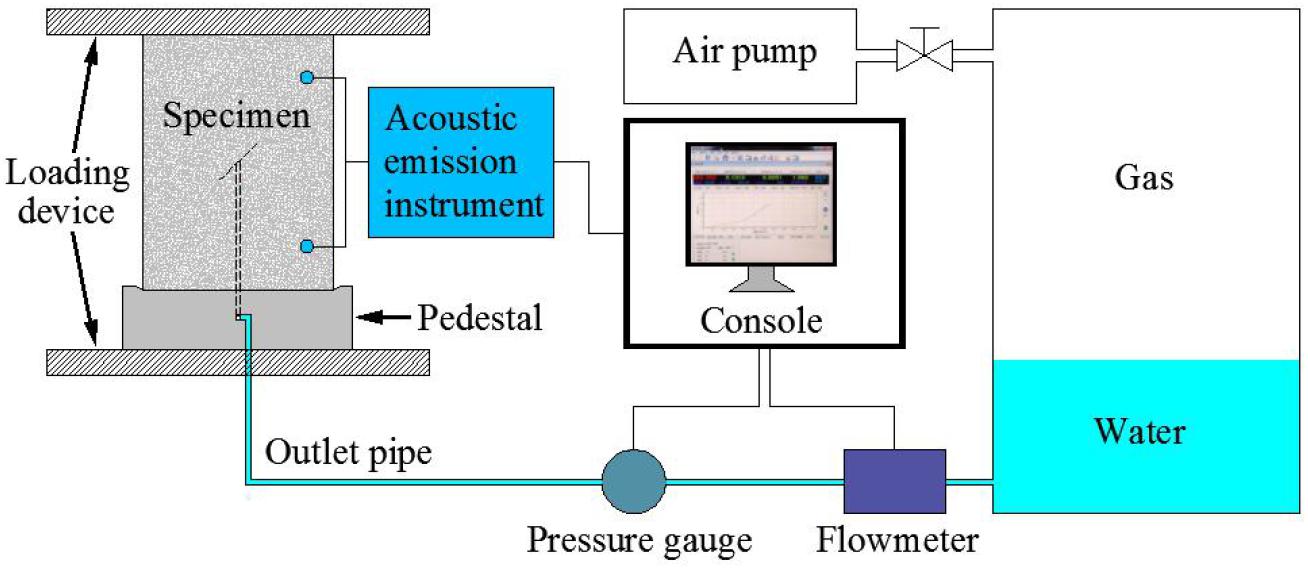
Figure 1. Schematic of the developed test system.
Stable Hydraulic Pressure Supply Device
The device used to provide a stable hydraulic pressure is shown in Figure 2. The internal diameter of the chamber in the supply device is 30 mm, and the height is 80 mm. The water injection volume is 1/5 of the total chamber volume, and the ratio of water to gas is 1:4.
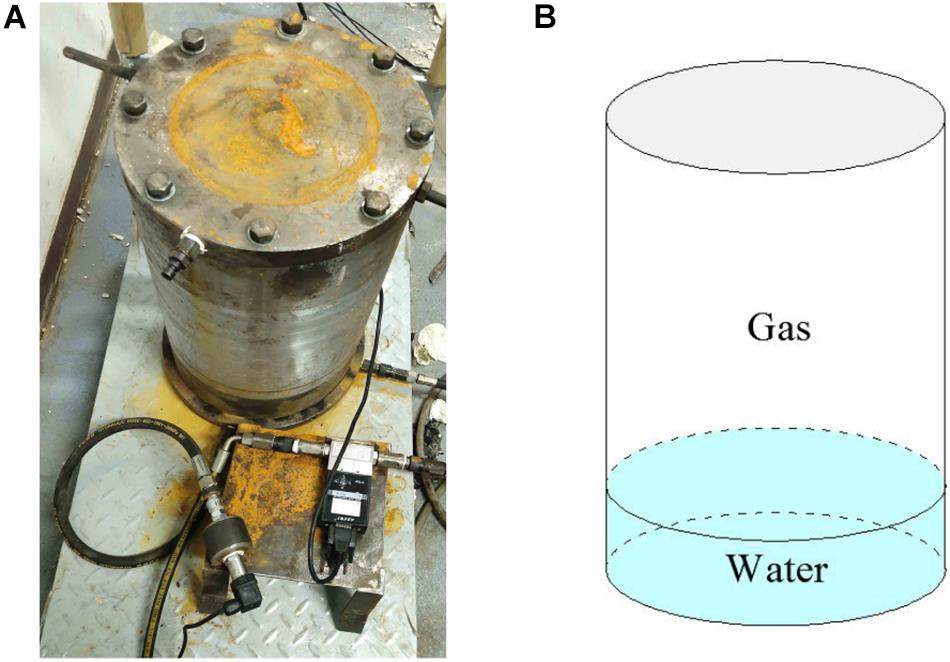
Figure 2. Photograph (A) and schematic (B) of the stable hydraulic pressure supply device.
The compressibility of water β is defined as
where Vw is the volume of water, and p is pressure. According to Eq. (1), it can be calculated that a force of 21 MPa is needed to compress the volume of water by 1%. The water body is difficult to compress; thus, the water body is assumed to be incompressible.
The Boyle–Mariotte law is defined as
where P1 and V1 are the initial pressure and volume, respectively, and P2 and V2 are the pressure and volume after the gas volume change, respectively. Assuming an incompressible water body, only the flow of water causes the volume of the water body to decrease. During crack initiation and propagation, the water flows into the test piece and enters the new crack, resulting in a small reduction in the volume of the water body. The volume reduction of the water body resulting from crack formation is assumed to be 1%, resulting in a 0.25% increase in gas volume. Thus, according to Eq. (2), the air pressure decreases by only 0.25% after the small reduction in water body volume.
In conventional servo-controlled hydraulic loading systems, crack initiation and propagation during the loading of the test piece results in an instant expansion in volume. This steep and instantaneous decrease in hydraulic pressure causes crack propagation to accelerate during the middle and late stages of loading. The expansion in volume also accelerates, making it difficult for the servo response to keep pace. Furthermore, the high demand on the servo drive leads to crack initiation and propagation in the test piece, and the water pressure cannot be kept stable.
In the new system, although the hydraulic pressure decreases slightly due to the loss of water during loading, this decrease is negligible. It can ensure that the water pressure is stable during the loading process of the test piece. In addition, the developed test system has the advantages of low cost and low energy consumption.
Other Components
The flowmeter is a model AST10 flow recorder (Figure 3) that automatically reads the pressure difference and flow at the inlet and outlet. The accuracy of this flowmeter is 10 ml/s. The flowmeter is connected via a data line so that the flow value can be read on the computer.
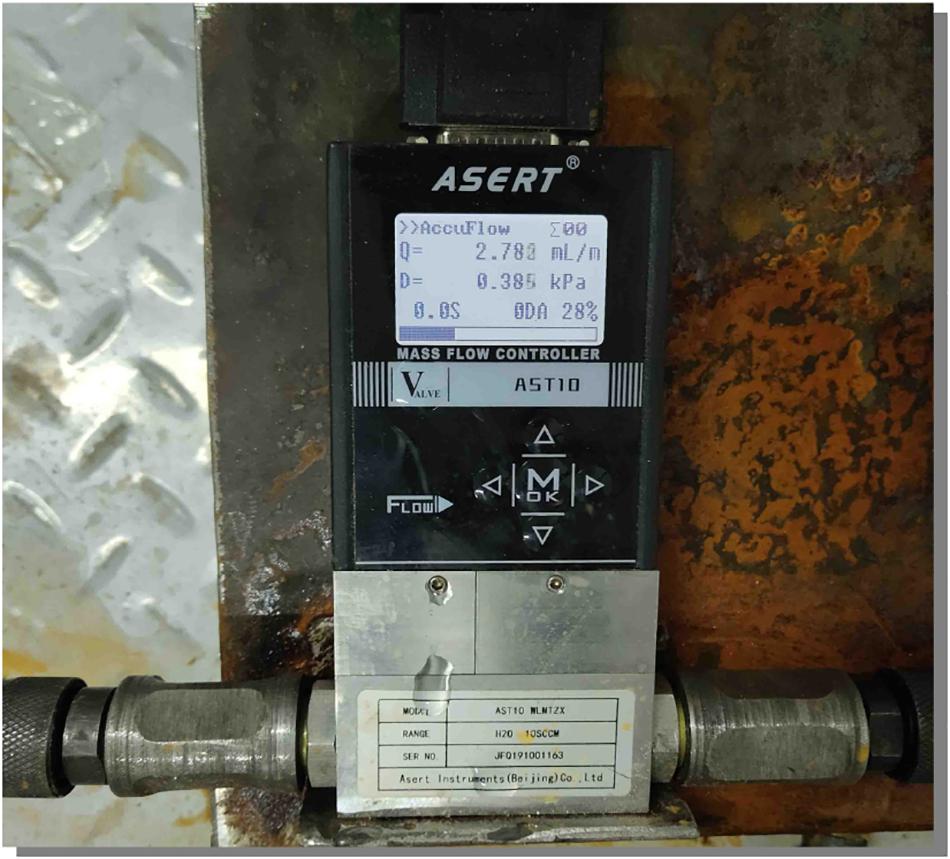
Figure 3. Flowmeter.
The pressure gauge is a mik-p310 high-precision pressure sensor with a range of 0–2.5 MPa (Figure 4A). The pressure sensor is attached to an Asmik recorder that can record and export information such as hydraulic pressure and water temperature (Figure 4B).
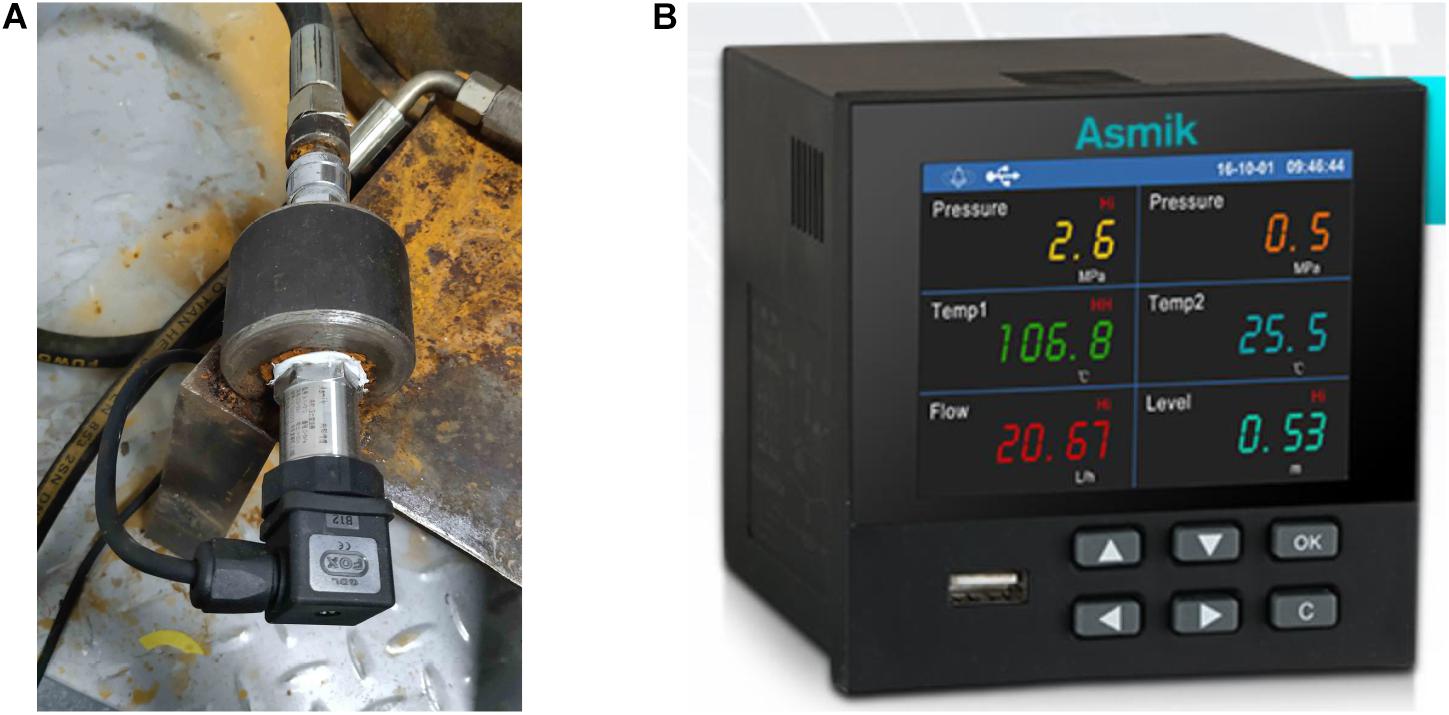
Figure 4. Images of the pressure sensor (A) and recording device (B).
Acoustic emission signals are acquired using a DS5 system (Figure 5A) with eight channels. The sampling frequency is 2.5 MHz, and the preamplifier gain is 40 dB (Figure 5B). The probe (model RS-2A; Figure 5C) has a frequency range of 50–400 kHz and a center frequency of 150 kHz. The acoustic emission data of the specimen are collected by more than three non-coplanar probes, allowing crack initiation and propagation in the specimen to be tracked and located.
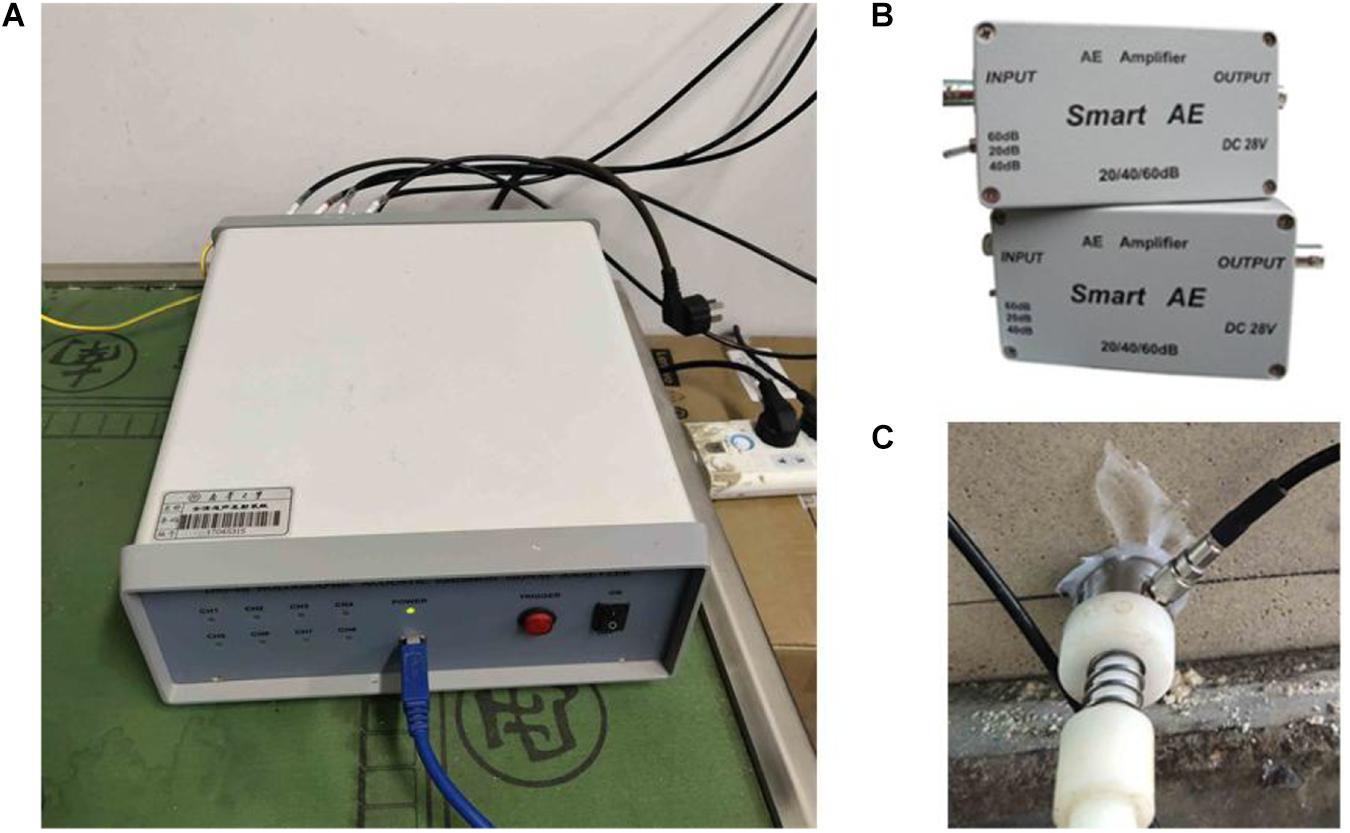
Figure 5. Images of the acoustic emission equipment: (A) main body; (B) amplifier, and (C) probe.
As shown in Figure 6A, the loading device is a rock mechanics testing machine (model XTR-2000) with a maximum test force of 2000 kN. The loading mode can be selected as either force control or displacement control. As shown in Figure 6B, a console contains two computers that control the rock loading instrument and automatically collect and record the stress and displacement of the test piece during the loading process (right monitor) and control the acoustic emission radiometer, micro-flowmeter, and pressure gauge, which automatically read and record test data (left monitor).
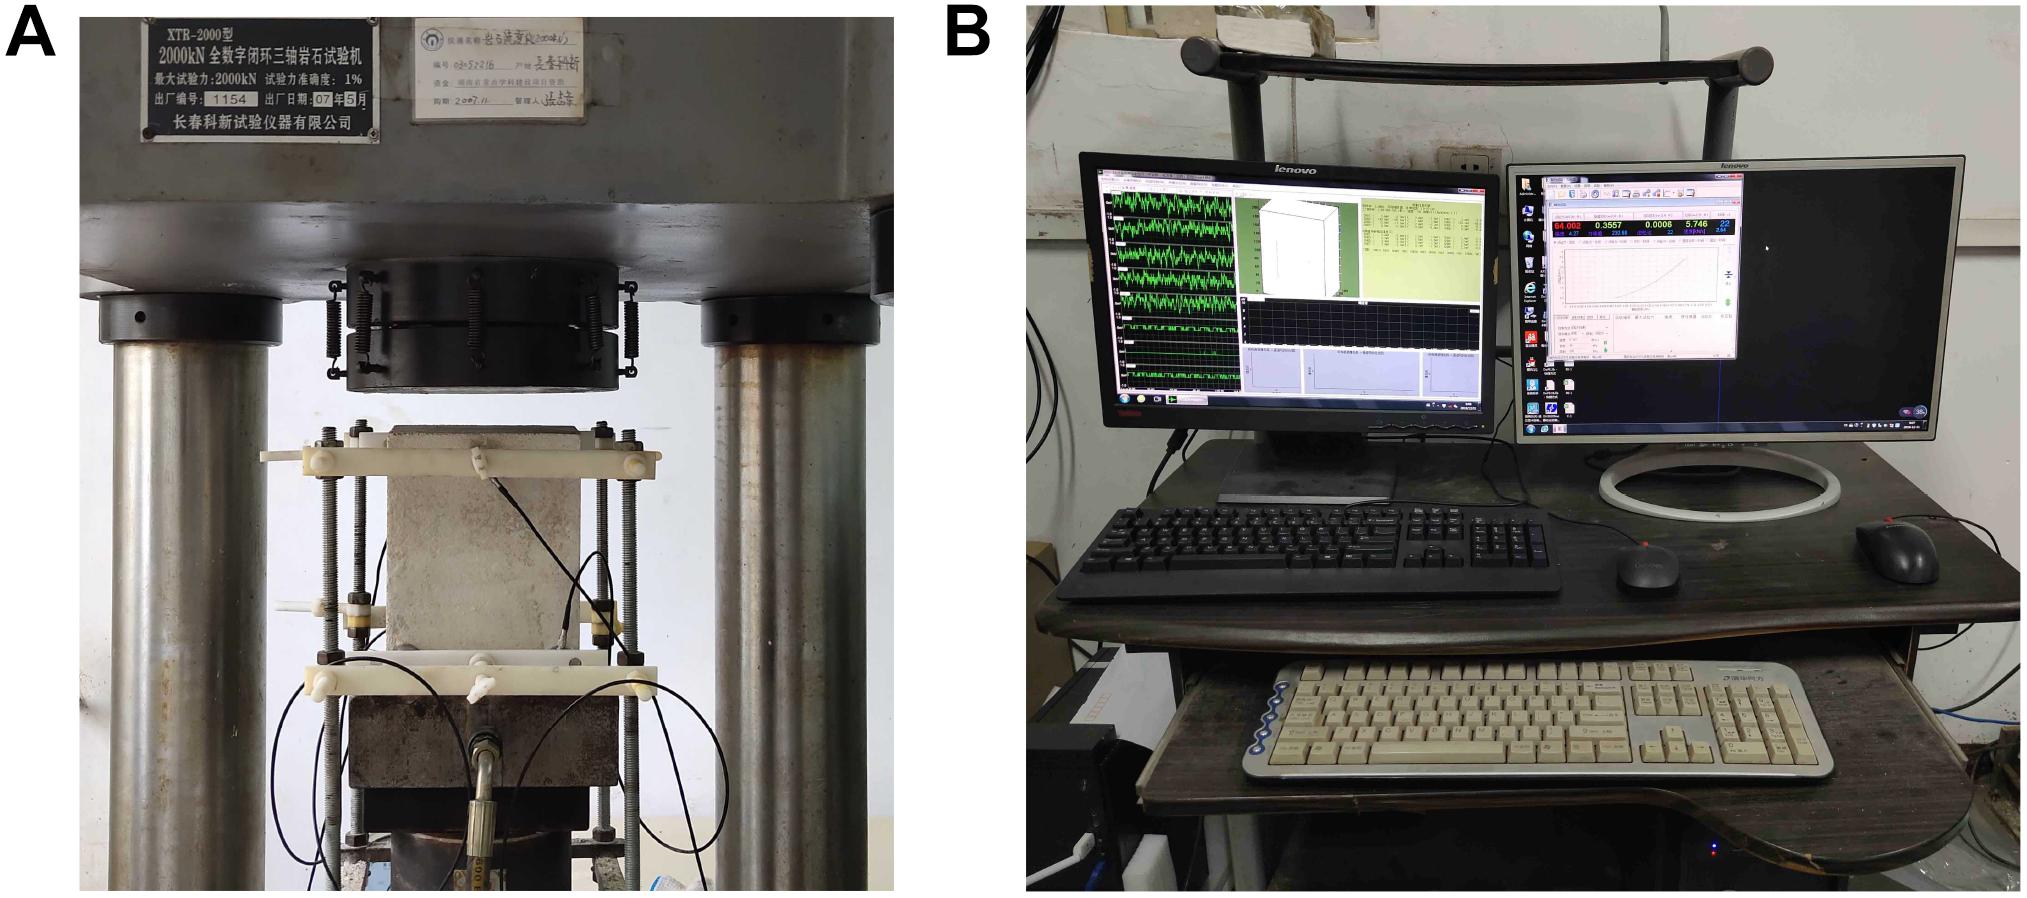
Figure 6. Images showing the XTR-2000 loading device (A) and computer console (B).
Hydraulic Test
Preparation of a Specimen With Internal Crack
Cement mortar was used as rock-like specimen in the hydraulic test. The mortar was composed of 325-grade white cement: fine sand: water in a 5:5:2 mass ratio. The fine sand was screened with a 1.25-mm sieve. The mold prepared for the test piece was made of stainless steel and acrylic board. The internal dimensions of the test piece were 150 mm (length) × 100 mm (width) × 200 mm (height), as shown in Figure 7A.
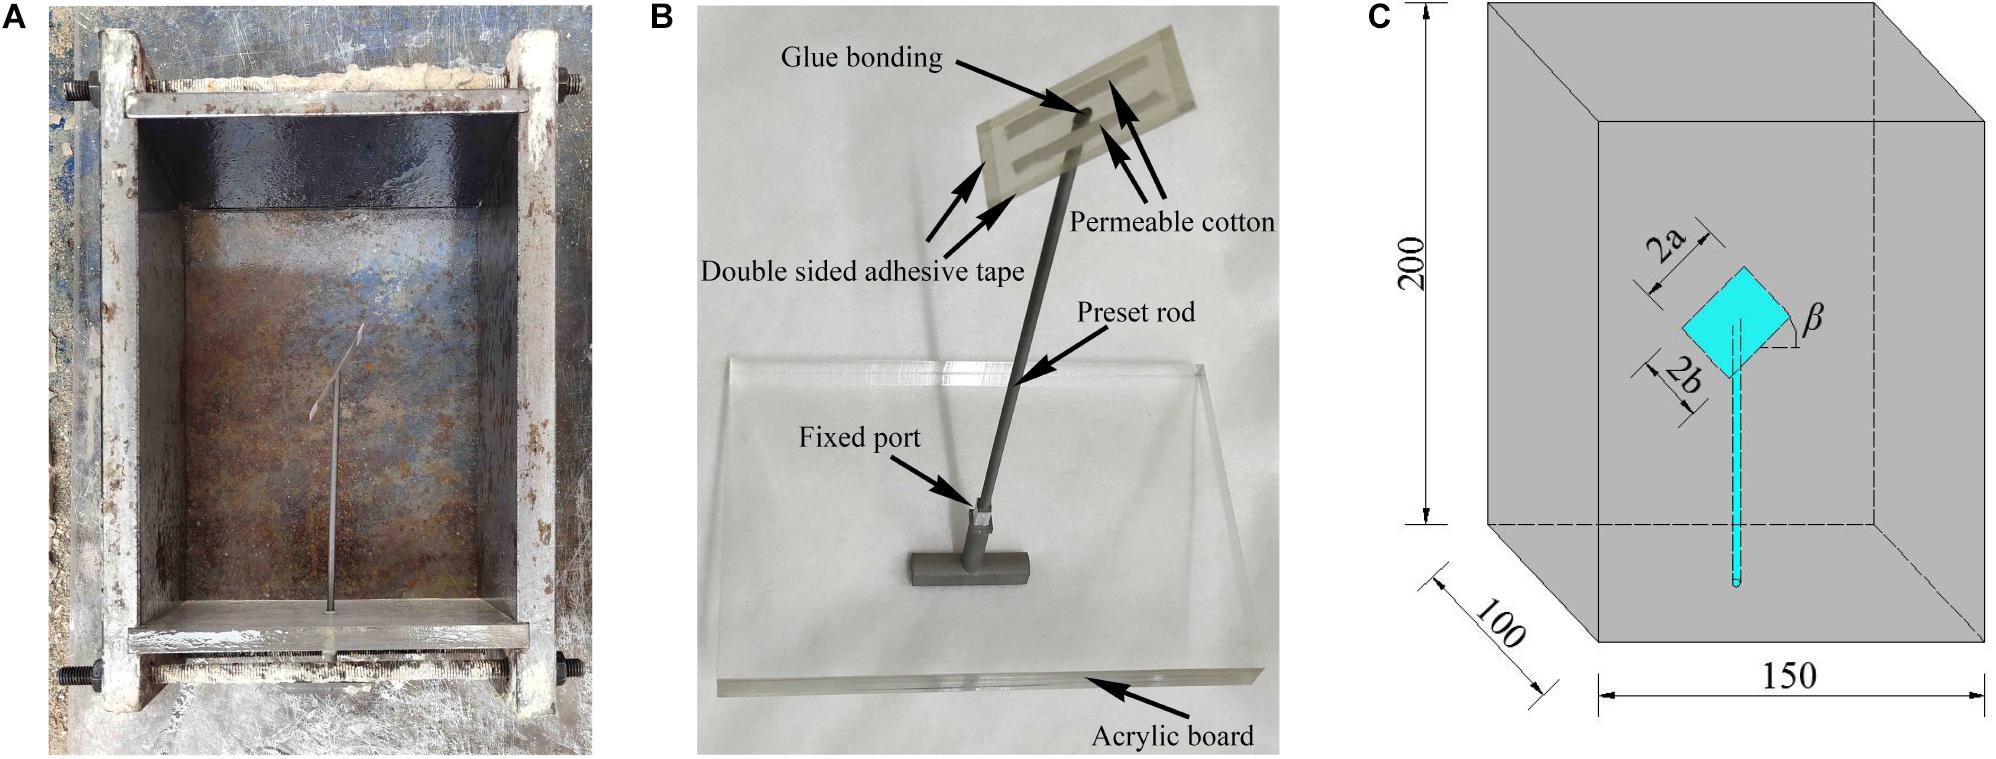
Figure 7. Schematic diagram showing the formation of an internal fracture specimen: (A) image of the mold; (B) image of the support; and (C) schematic diagram of the resulting specimen (unit: mm).
As shown in Figure 7B, the support for internal crack preparation was composed of two mica pieces, two permeable cotton pieces, and four transparent tapes. The dimensions of the mica sheets were 45 mm (length) × 28 mm (width) × 0.07 mm (thickness). One of the mica pieces had a hole in the center, while the second did not. The two mica pieces were bonded with double-sided adhesive to avoid mortar inflow during pouring. The two mica pieces middle was padded with 1-mm-thick permeable cotton to ensure internal opening and water injection during the test. The crack surface was acted on by a prefabricated stainless-steel rod constructed via three-dimensional printing. One end, which was bonded with glue and the mica piece, to form a certain angle; the other end was designed to fix the angle with acrylic plate. The diameter of the prefabricated rod inside the test piece was 3 mm; thus, the diameter of the water injection hole was 3 mm.
After the mold was assembled, the release agent was applied to the inner wall of the mold to facilitate demolding. The evenly mixed cement mortar was then slowly poured into the mold layer by layer while ensuring that the crack surface was free of deformation. After the pouring was complete, the mortar was vibrated using a vibration table, resulting in an evenly plastered surface. After initial setting, the prefabricated rod was removed. The mold was then removed 24 h later and placed into a curing box for 28 days. Figure 7C shows a schematic diagram of the internal fracture; the fracture length and width are indicated by 2a and 2b, respectively, while the angle between the fracture and the horizontal plane is the fracture obliquity β.
Stress–Strain and Hydraulic Pressure Characteristics
Figure 8 shows the stress–strain curve for uniaxial compression and a plot of hydraulic pressure vs. strain for a rock specimen with an internal fissure at a 45° angle and a stable hydraulic pressure of 1 MPa. In Figure 8, the stage between points O and A is the stage without hydraulic pressure. The initial hydraulic pressure was 1001.2 kPa after stable. When the vertical uniaxial compression force on the specimen reached 2 MPa, hydraulic pressure was applied to the interior of the specimen. This initial stage of applying stable hydraulic pressure is represented by the stage between points A and B in Figure 8. When hydraulic pressure was applied inside the test piece, the water in the hydraulic pressure chamber entered into the internal crack through the water injection hole, and the water volume in the hydraulic pressure chamber decreased slightly, resulting in a slight change in pressure.
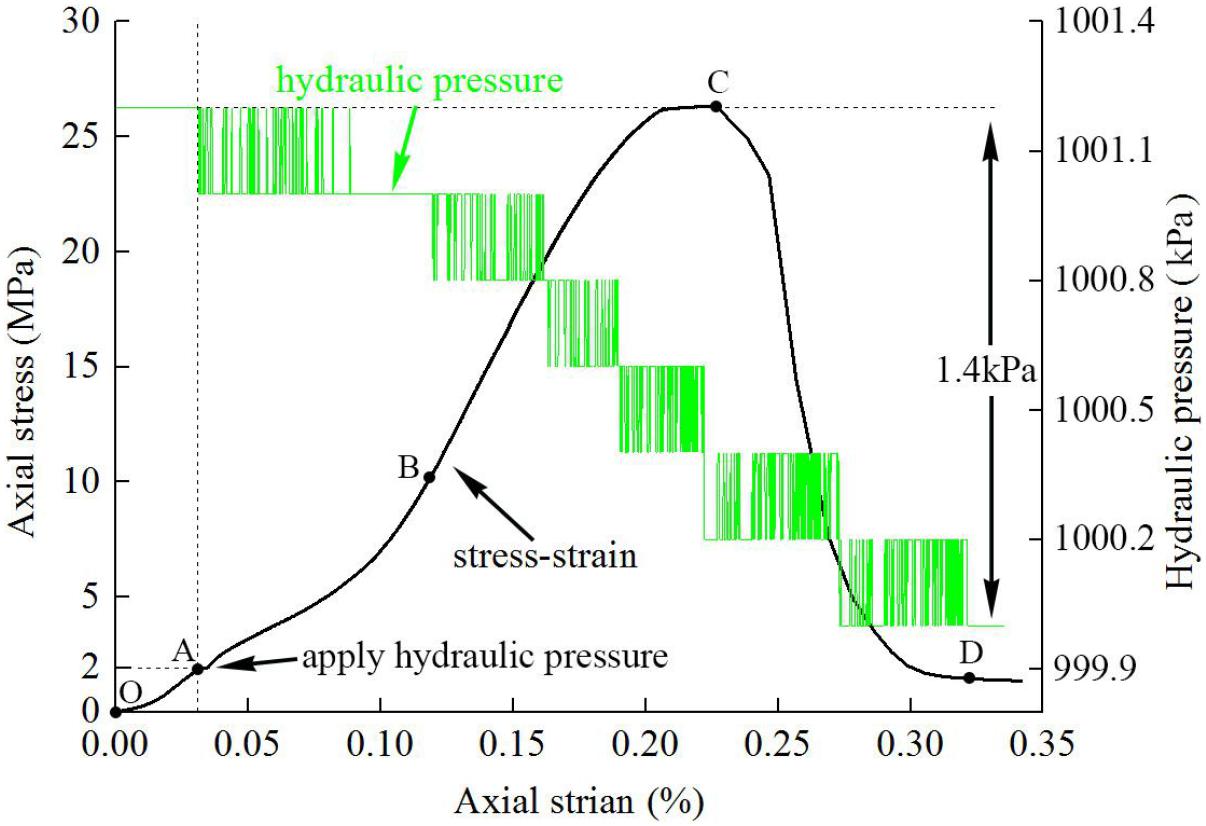
Figure 8. Stress–strain and hydraulic pressure curves for an internal fracture specimen subjected to a stable hydraulic pressure of 1 MPa.
The middle stage of applying stable hydraulic pressure is represented by the stage between points B and C in Figure 8. During this stage, the internal crack in the test piece expanded and produced a large number of microcracks. The water body penetrates into the new crack surface stably in real time and provides water pressure. The water volume in the water pressure chamber continues to decrease slightly, the gas volume continues to increase slightly, and the pressure continues to fluctuate and decrease, but the maximum fluctuation is only 0.6 kPa, accounting for less than 0.6% of the hydraulic pressure of 1001 kPa at that time.
The stage between points C and D in Figure 8 is the later stage of applying stable hydraulic pressure. During this stage, a large number of microcracks in the specimen expanded to form macrocracks, and considerable specimen deformation was observed. However, the stress decreased rapidly in this stage, and two slight drops in hydraulic pressure occurred. At the end of the test (point D in Figure 8), the hydraulic pressure was relieved, the loading system was closed, and the test data were saved.
Throughout the test, the hydraulic pressure decreased by 1.4 kPa, corresponding to a decrease of 0.14% compared to the initial hydraulic pressure. This change is small enough to be ignored.
Fracture Characteristics
Figure 9 shows the uniaxial compression failure mode of a specimen containing an internal fracture at an angle of 45° under a stable hydraulic pressure of 1 MPa. Because the crack in the test piece was located in the inner part of the test piece, and the material was opaque, the evolution of the internal crack could not be directly observed in real time. Therefore, this paper focuses on the failure mode of the test piece and the morphological characteristics of the failure section under hydraulic pressure. The failure mode of the internal fracture specimen in this study was tension shear failure; the macrocrack penetrated the upper and lower ends of the specimen, as shown in Figure 9A. The features of the macrocrack surface are shown in Figure 9B. Under the combined action of osmotic pressure and vertical stress, the internal crack initiated a wing tensile crack along the long side of the specimen; this section was complete without obviously scratches. The direction of crack propagation is shown by the white dashed arrows in Figure 9B, and the range of propagation is roughly indicated by the white dashed lines. When the axial pressure of the specimen increased continuously, the specimen reached peak strength, and the macrocrack penetrated the upper and lower loading faces. The shear region of the main macro shear crack failure section is indicated by the red dashed lies in Figure 9B; obvious scratches and broken particles can be observed.
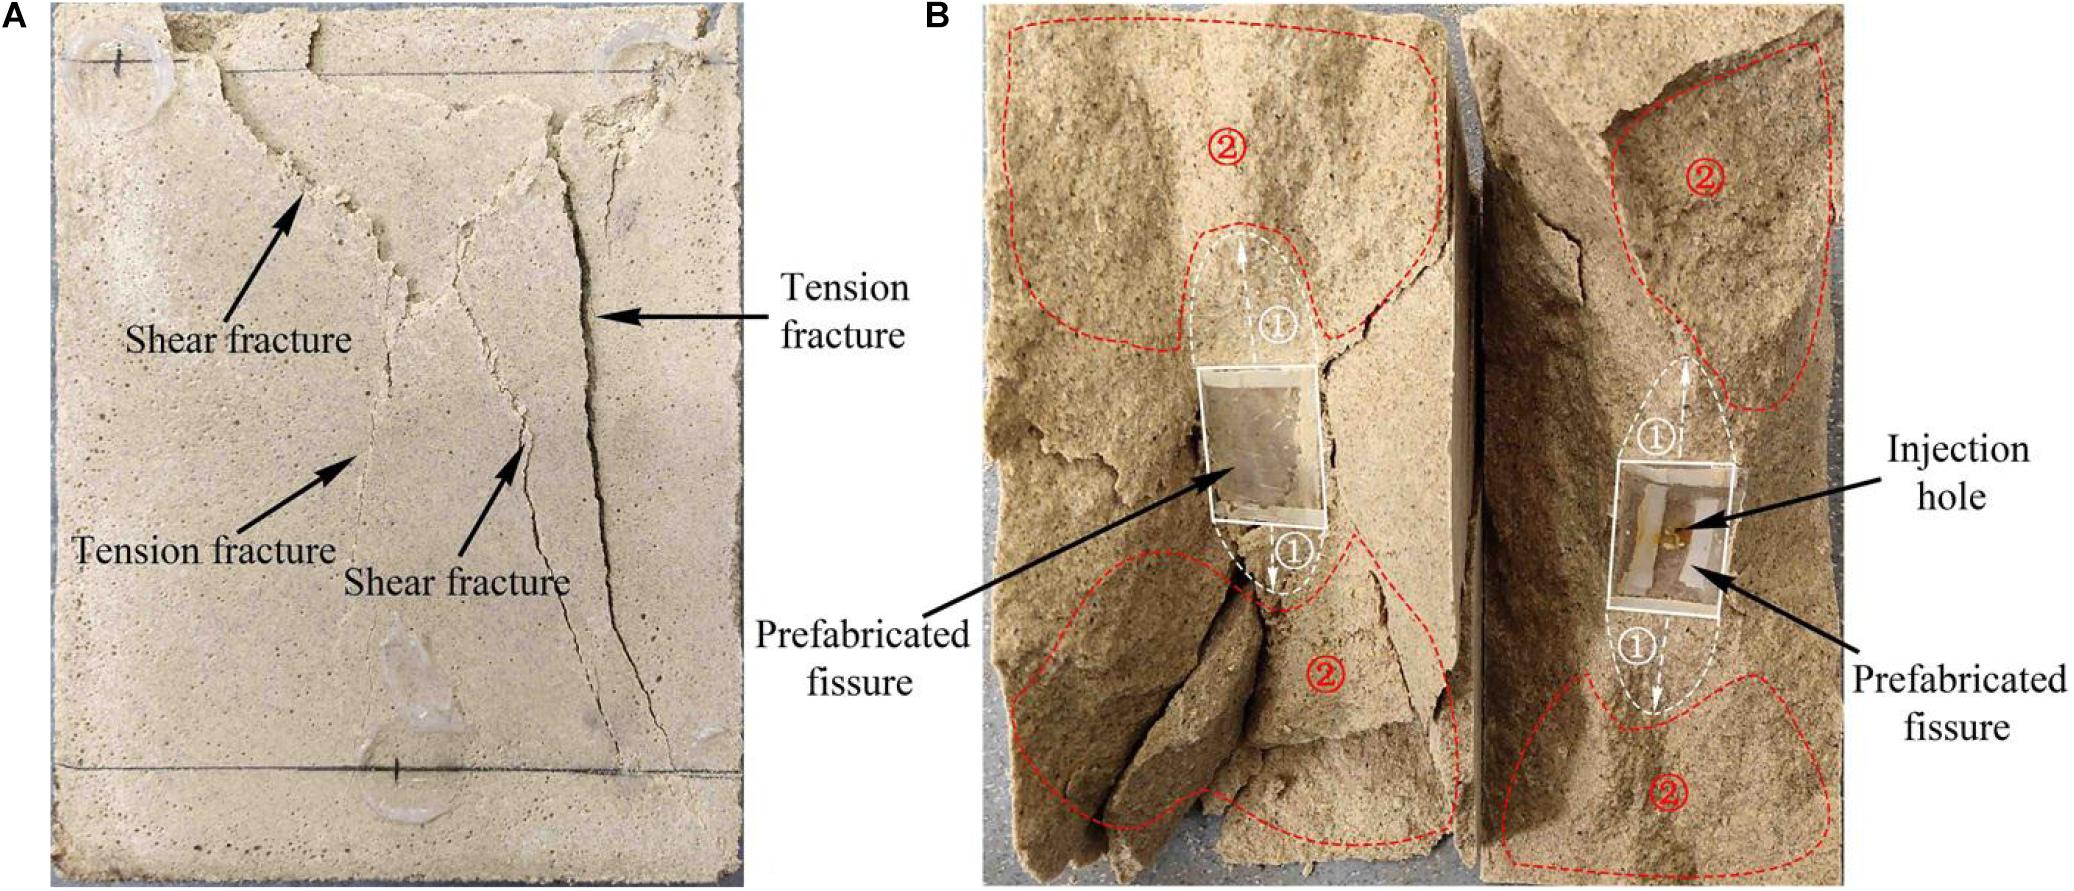
Figure 9. Images showing the uniaxial compression failure mode of a specimen with an internal fracture at an angle of 45° under a stable hydraulic pressure of 1 MPa: (A) external view and (B) internal fracture plane (① wing crack; ② shear zone).
Acoustic Emission Location
Acoustic emission acquisition uses 6 acoustic emission probes for data detection, and the probe position is shown in Figure 10. The coupling agent is paved between the probe and the test piece to ensure the propagation of the sound source and the fixed use of the probe.
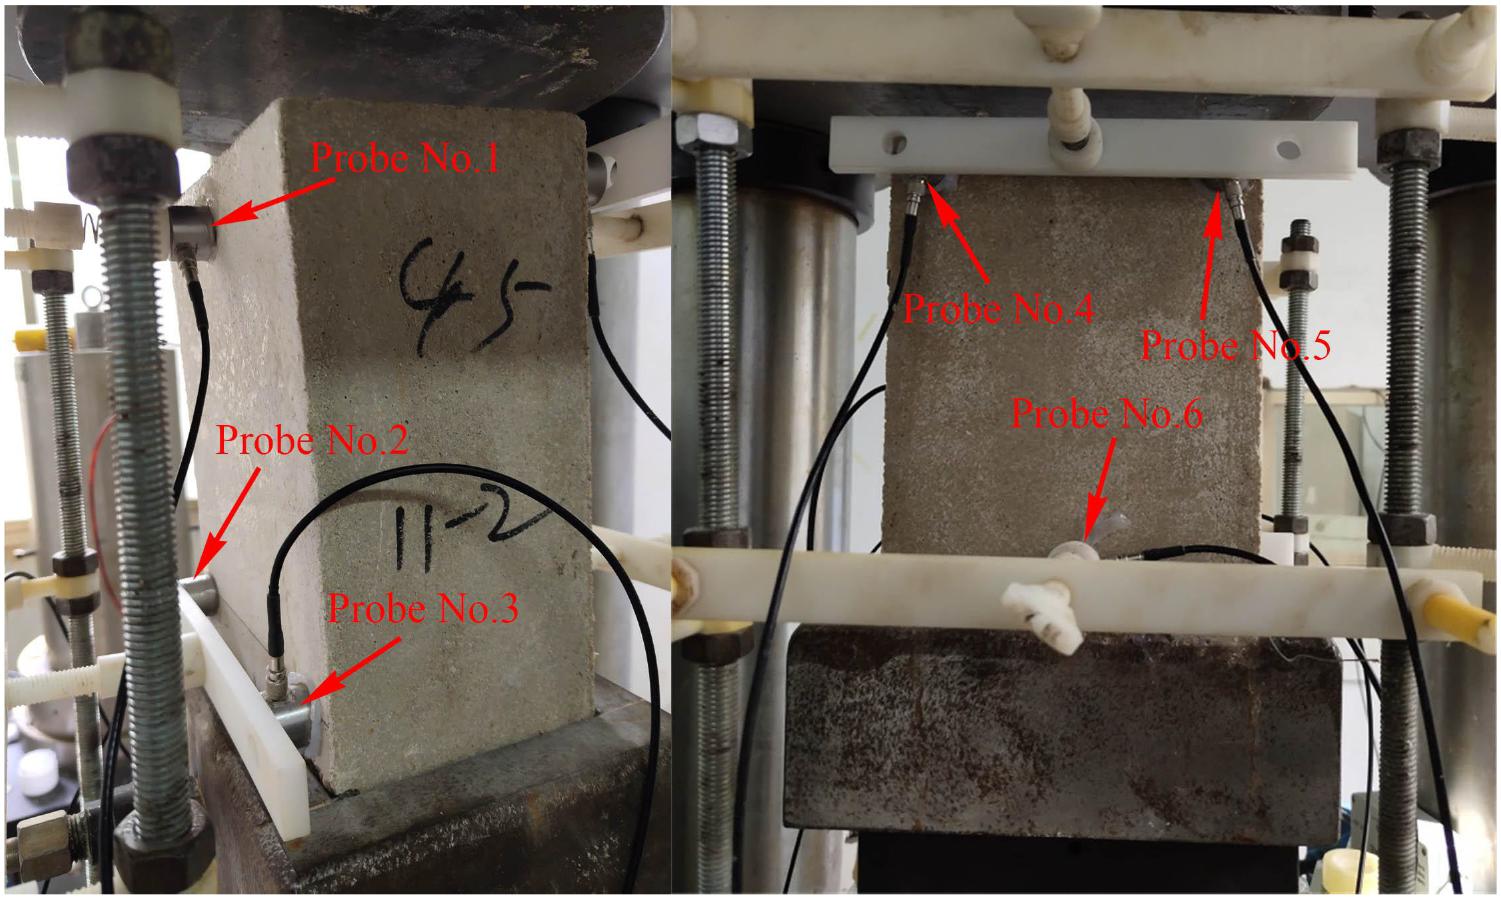
Figure 10. Images showing the locations of acoustic emission probes with respect to the specimen.
The acoustic emission maps corresponding to points B, C, and D in Figure 8 are shown in Figure 11. As shown in Figure 11A, many acoustic emission events occurred at point B in Figure 8, and the acoustic emission points are observed near the internal cracks and water injection holes. The cracks were generated near the internal cracks, and the water pressure fully acted on the internal crack surface. The acoustic emission map corresponding to point C in Figure 8 (i.e., when the specimen reached peak strength) shows many points (Figure 11B). In addition to the cracks near the internal cracks, the long side under the internal cracks also cracked. According to the fracture section of the specimen, the cracks were speculated to be tension cracks and shear cracks on the airfoil. The acoustic emission was relatively dense under the internal cracks. In the map corresponding to point D in Figure 8 (complete specimen failure), the acoustic emission events are densely distributed near the internal cracks (Figure 11C). The results show that the wing tension cracks were initiated at the upper and lower ends of the internal cracks, and the acoustic emission events were concentrated under the cracks.
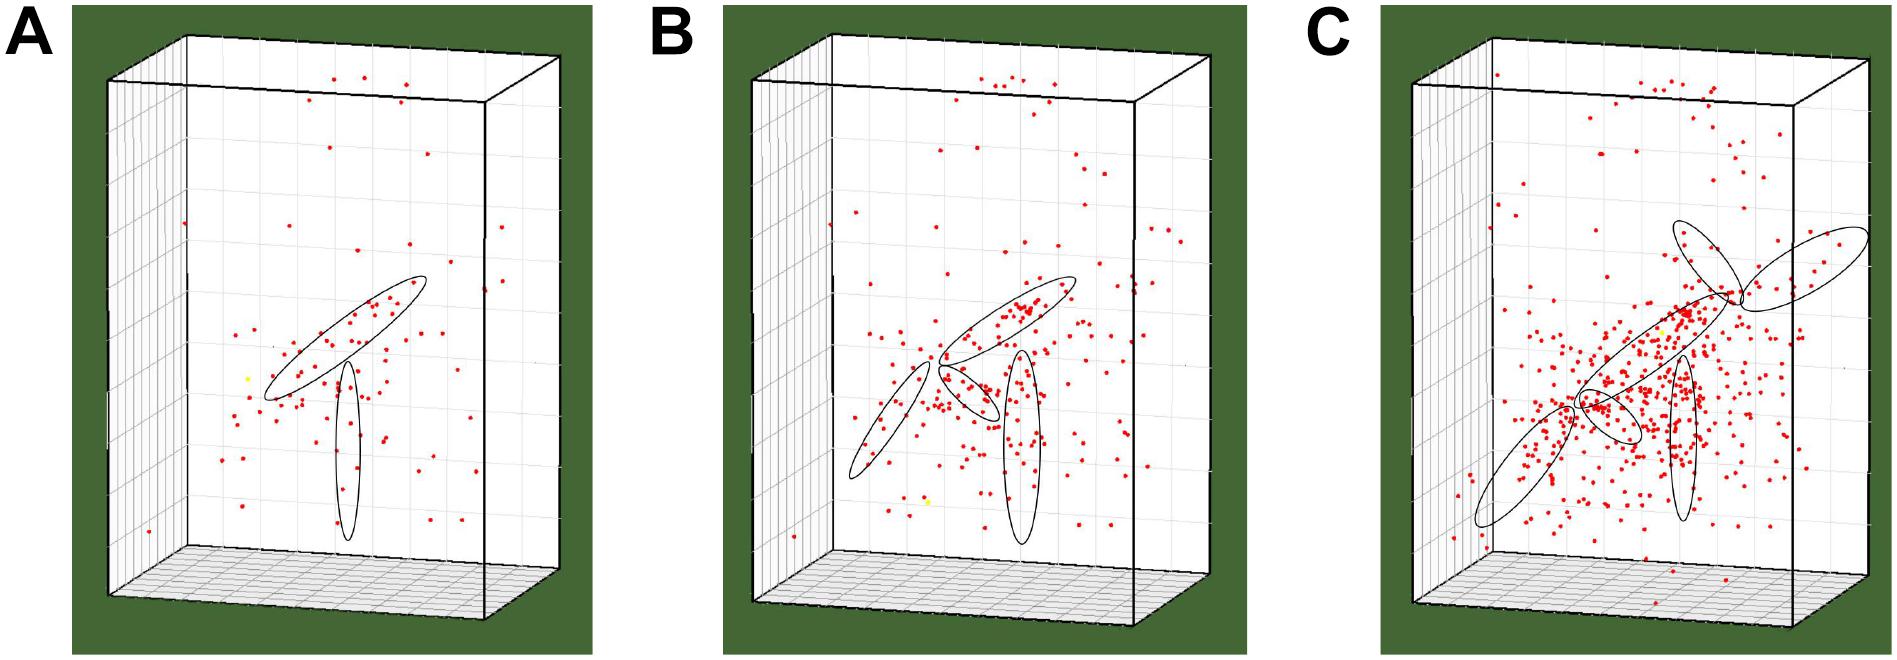
Figure 11. Acoustic emission maps corresponding to the locations of points (A) B, (B) C, and (C) D in Figure 8.
Conclusion
To simulate long-term, stable seepage pressure in deep rock masses, a test system that provides stable hydraulic pressure was developed and demonstrated using a specimen with a 45° internal fracture. The main conclusions can be summarized as follows:
(1) The developed hydraulic loading system successfully provided stable hydraulic pressure during crack initiation, propagation, and failure;
(2) Based on the stress–strain and hydraulic pressure curves, crack initiation and propagation in the specimen led to a slight decrease in hydraulic pressure corresponding to a reduction of 0.14% compared to the initial hydraulic pressure;
(3) The failure mode and fracture section of the specimen indicated a tensile shear failure mode, and the long side of the internal fracture initiated a wing tensile crack, the region of wing crack and tensile crack in macro crack section is analyzed;
(4) The crack evolution and distribution characteristics at different time periods during the test were revealed based on acoustic emission maps.
Data Availability Statement
All datasets generated for this study are included in the article/supplementary material.
Author Contributions
ZJ: data processing and thesis writing. ZZ-J: program design and writing guide. PC: equipment development and scheme design.
Funding
This work was supported by the National Natural Science Foundation of China (Grant Nos. 51704168 and 51774187) and the China Postdoctoral Science Foundation (Grant No. 2016M602417).
Conflict of Interest
The authors declare that the research was conducted in the absence of any commercial or financial relationships that could be construed as a potential conflict of interest.
Acknowledgments
The authors appreciate the constructive comments from the reviewers.
References
Gao, Q., Han, S., Cheng, Y., Yan, C., Sun, Y., and Han, Z. (2019). Effects of non-uniform pore pressure field on hydraulic fracture propagation behaviors. Eng. Fract. Mech. 221:106682. doi: 10.1016/j.engfracmech.2019.106682
Hao, R., Cao, P., Chen, Y., Jin, J., Wang, H., and Fan, X. (2018). Mechanical and propagating behaviors of single-flawed rock samples with hydraulic pressure and uniaxial compression conditions. Int. J. Geomech. 18, doi: 10.1061/(ASCE)GM.1943-5622.0001176
Li, Z., Rao, Q.-H., Li, P., and Yi, W. (2018). Crack initiation rate of brittle rock under thermal-hydro-mechanical coupling condition. Trans. Nonferrous Metals Soc. China 28, 2107–2113. doi: 10.1016/s1003-6326(18)64855-1
Liu, T., Cao, P., and Lin, H. (2014). Damage and fracture evolution of hydraulic fracturing in compression-shear rock cracks. Theor. Appl. Fract. Mech. 74, 55–63. doi: 10.1016/j.tafmec.2014.06.013
Liu, W., Liu, Y., Du, Y., Pang, L., and Meng, X. (2019). Study on the development and distribution rule of tensile shear fracture propagation angle of fractured rock mass under seepage pressure. Geotech. Geol. Eng. 37, 4151–4161. doi: 10.1007/s10706-019-00899-w
Mei, J., Yang, L., Sheng, X., Song, G., Yang, W., and Zhang, B. (2019). Time-dependent propagation of 3-D cracks in rocks under hydromechanical coupling. Rock Mech. Rock Eng. doi: 10.1007/s00603-019-02020-2
Sampath, K. H. S. M., Perera, M. S. A., and Ranjith, P. G. (2018). Theoretical overview of hydraulic fracturing break-down pressure. J. Nat. Gas Sci. Eng. 58, 251–265. doi: 10.1016/j.jngse.2018.08.012
Xing, J., Zhao, C., Yu, S., Matsuda, H., and Ma, C. (2019). Experimental study on rock-like specimens with single flaw under hydro-mechanical coupling. Appl. Sci. 9:9163234. doi: 10.3390/app9163234
Zhang, L., Ren, Q., Tao, M., and Tong, Q. (2018). Effect of hydraulic pressure and tectonic stress on fracture initiation in rock flaws. Soil Mech. Foundation Eng. 55, 9–15. doi: 10.1007/s11204-018-9495-3
Zhao, Y., Tang, J., Chen, Y., Zhang, L., Wang, W., Wan, W., et al. (2017a). Hydromechanical coupling tests for mechanical and permeability characteristics of fractured limestone in complete stress–strain process. Environ. Earth Sci. 76, 1–18. doi: 10.1007/s12665-016-6322-x
Zhao, Y., Wang, Y., and Tang, L. (2019a). The compressive-shear fracture strength of rock containing water based on Druker-Prager failure criterion. Arab. J. Geosci. 12, 452.1–452.8. doi: 10.1007/s12517-019-4628-1
Zhao, Y., Wang, Y., Wang, W., Tang, L., Liu, Q., and Cheng, G. (2019b). Modeling of rheological fracture behavior of rock cracks subjected to hydraulic pressure and far field stresses. Theor. Appl. Fract. Mech. 101, 59–66. doi: 10.1016/j.tafmec.2019.01.026
Zhao, Y., Zhang, L., Wang, W., Tang, J., Lin, H., and Wan, W. (2017b). Transient pulse test and morphological analysis of single rock fractures. Int. J. Rock Mech. Min. Sci. 91, 139–154. doi: 10.1016/j.ijrmms.2016.11.016
Zhou, Y., Zhao, C., Zhao, C., Ma, C., and Xie, J. (2018). Experimental study on the fracturing behaviors and mechanical properties of cracks under coupled hydro-mechanical effects in rock-like specimens. Water 10:1355.1-1355.16.1355. doi: 10.3390/w10101355
Zhuang, L., Kim, K. Y., Jung, S., Diaz, M., and Yoon, J. (2016). “Laboratory study on cyclic hydraulic fracturing of Pocheon granite in Korea,” in Proceedings of the 50th US Rock Mechanics / Geomechanics Symposium ARMA (Prague: Bohemia Interactive), 16–163.
Keywords: stable hydraulic pressure, hydraulic coupling, internal crack, crack growth, acoustic emission characteristics
Citation: Jia-jun Z, Zhi-Jun Z and Cheng-zhi P (2020) Development and Application of a Hydraulic Loading Test System That Provides Continuous and Stable Hydraulic Pressure. Front. Earth Sci. 8:77. doi: 10.3389/feart.2020.00077
Received: 13 January 2020; Accepted: 02 March 2020;
Published: 08 April 2020.
Edited by:
Yanlin Zhao, Hunan University of Science and Technology, ChinaReviewed by:
Jun Wang, Hunan Institute of Engineering, ChinaChunyang Zhang, Wuhan University of Technology, China
Copyright © 2020 Jia-jun, Zhi-Jun and Cheng-zhi. This is an open-access article distributed under the terms of the Creative Commons Attribution License (CC BY). The use, distribution or reproduction in other forums is permitted, provided the original author(s) and the copyright owner(s) are credited and that the original publication in this journal is cited, in accordance with accepted academic practice. No use, distribution or reproduction is permitted which does not comply with these terms.
*Correspondence: Pu Cheng-zhi, cHVjaGVuZ3poaUBmb3htYWlsLmNvbQ==