Modeling Water Allocation under Extreme Drought of South-to-North Water Diversion Project in Jiangsu Province, Eastern China
 Chunfen Zeng
 Jingsong Ma2
  Chen Xu
- 1Key Laboratory of Surface Processes and Environment Remote Sensing in the Three Gorges Reservoir Area, School of Geography and Tourism, Chongqing Normal University, Chongqing, China
- 2 School of Geographic and Oceanographic Sciences, Nanjing University, Nanjing, China
- 3 Multi-scale Land Surface Hydrology Laboratory, Department of Civil and Environmental Engineering, Voiland College of Engineering and Architecture, Washington State University, Pullman, WA, United States
Along with China’s economic development and social progress, water scarcity has become increasingly challenging. Optimized allocation of water resources, especially through water transfer project, is one of the important approaches to mitigate water shortages. In this study, authors built a model of water resources allocation simulation and the microcosmic configuration based on a complex water network in the east route of the South-to-North Water Transfer Project in Jiangsu Province, east China. Selecting data from the typical years with assurance rates of P = 95%, 75%, and 50%, the simulation of supply and demand of water resources under the present situation and the tapping scenario of planning project was carried out. The results showed that water supply capacity increased while water deficits decreased remarkably for the diversion projects. Under the assurance rates of P = 95%, 75%, and 50%, the rate of water shortage decreased by 10.3%, 8.0%, and 5.2%, respectively. Under the planning work situation, the amount of water increased by 2,800 million m3 even during the period of extreme drought. Based on the results, it also provided an effective plan for the hydraulic engineering to optimize the allocation and management of water resources. It is helpful for policy makers to mitigate water shortage in Jiangsu Province and other areas with water transfer projects in China and other countries.
Introduction
Water is one of the most important resources for human survival and development. As the second largest economic body with dramatically increasing water demand, China has been suffering water scarcity, uneven spatiotemporal distribution, and low utilization. Water allocation has great significance on easing the contradiction between the supply and demand of water resources and promoting regional socioeconomic development (Wada, et al., 2014; Nazemi and Wheater, 2015). Water resources allocation involves several aspects such as engineering, finance, technology, and management (Xu, et al., 2013; Li M, et al., 2015; Zhong et al., 2015). In this modeling, through engineering and nonengineering measures, advices are given for allocation of the limited water resources of different forms in a certain area to meet the water demand of various levels, objectives, and water use.
Studies on optimized allocation of water resources started in the early 1960s. A large number of studies on the theory and application of water resources emerged with mathematics (Li M, et al., 2015), computer technology (Xu et al., 2001; Yao et al., 2018), large-scale reservoirs (Li C, et al., 2015), multiobjective optimization (Li et al., 2017), and the increasing prominent contradiction of supply and demand for water (Wang, 2006; Abed Elmdoust and Kerachian.2013).Among them, many scholars actively studied optimized allocation of water resources with the South-to-North Water Transfer Project (Yang et al., 2007; Sang et al., 2018; Liu et al., 2020). The South-to-North Water Diversion Project is a major strategic project to alleviate the serious shortage of water resources in North China. It is divided into three lines: east, central, and west. Among them, the eastern route of the South-to-North Water Diversion Project is a state-level transprovincial regional project that transports water from Jiangdu Water Conservancy Project in Yangzhou, Jiangsu, through Jiangsu, Shandong, and Hebei provinces to North China. Of the related study, self-optimization simulation model technical program is widely used in the water transfer project under a macroscopic scale because of its succinct and compact hierarchical structure, fast convergence rate, and so on. Wang et al. (2001) set up the three-level hierarchical model. The principle and methods of hierarchical analysis for this large-scale system are applied to solve the problems of optional water operation for the middle route of the South-to-North Water Diversion Project. On the fulfillment of the total system water supply objects, the optimal regulation diagram of the reservoir is determined via simulation technique combined with the optimization methods. In addition, considering the problems that occurred in the process of large-scale water transfer, some scholars constructed the South-to-North Water Transfer Project water allocation simulation system and water-scheduling model with modern computer simulation technology (Zhao et al., 2002; Liu et al., 2003; Zeng et al., 2018).Previous studies on the South-North Water Transfer Project water allocation model focused more on macro-scale water allocation (Wang et al., 2001; Sang et al., 2018). There was a certain disconnection between water users’ actual microscopic demand and its universality; the practicality and operability were weak. At the same time, the study area has a complicated river system and dense river networks (Xu et al., 2020).
As a very important section of the east route of the South-to-North Water Diversion Project, water allocation in Jiangsu Province is vital for the water transfer to North China, but water allocation in Jiangsu Province lacks operational basis with scientific simulation background. As the construction and operation of the east route of the South-to-North Water Diversion Project, it is very urgent to study water allocation (Zhao et al., 2012). The purpose of this study was to improve the allocation and utilization efficiency of water resources based on the micro-level simulation of water supply and demand. Taking the South-to-North Water Transfer Project intake in Jiangsu Province as the research area, researchers estimated water supply and demand in the intake district and proposed two water allocation schemes under different engineering conditions (benchmark and planning) that were compared accordingly. In the simulation calculation of water resource supply and demand, the data used are accurate to the water intake lock of the water use. Therefore, the model can simulate and output the multi-scale calculation results of different administrative units, such as villages, counties, and cities, as well as segments, trunk lines, and water resources zoning. It is helpful to solve the disconnection between simulation calculation and water resource management. Based on the results, it also provided an effective plan for the hydraulic engineering sector to optimize the allocation and management of water resources. The study is helpful for policy makers to mitigate the water shortage in Jiangsu Province and other areas with water transfer projects in China and other countries.
Methodology
Study Area
The study area is between 32°27′N–34°50′N latitude and 117°57′E–119°34′E longitude covering all of Huaian, Suqian, Xuzhou, and Lianyungang in Jiangsu Province and Jiangdu, Gaoyou, and Baoying in Yangzhou as well as Funing in Yancheng. It covers 43143.7 km2, and the total population is about 24 million. It is a subtropical and warm temperate transition zone with an annual average temperature of 14–17°C, annual average rainfall of 700–1,300 mm, and evaporation of 900–1,100 mm. There is flat open terrain, many lakes, and a densely covered drainage network. From south to north, the main five storage lakes are Gaoyou Lake, Baima Lake, Hongze Lake, Luoma Lake, and Nansi Lake. The main river channels include Liyun River, the main irrigation artery in north Jiangsu as well as Zhongyun River, Xuhong River, Hanzhuang River, and Bulao River. The scope of the study area is shown in Figure 1.
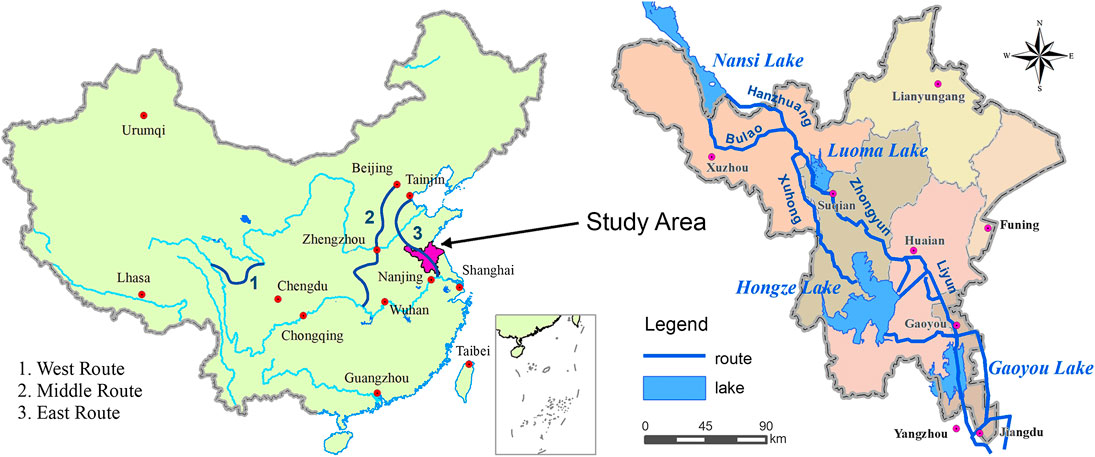
FIGURE 1. Jiangsu intake district of the South-to-North Water Diversion Project.
Water Allocation Model
The water resource allocation model constructed by the research team mainly includes submodules such as confluence, water resource supply and demand, and water engineering scheduling. The main steps include river network generalization, data collection, water resource demand calculation, water supply priority determination, water resources scheduling, water resources allocation scheme, and so on.
Model Building
Framework
The framework is shown in Figure 2. The steps of model are as follows:
1) Survey and basin information collection such as rainfall, evaporation, land use and land cover, drainage features, lock station properties, lock scheduling, and categories and distribution of different types of water use.
2) Water supply network generalization including water channel, nodes, and lakes. Of these, the water channel is divided into main waterline, branch waterline, and other watercourse; nodes are generalized into pump and lock station, water use, management, boundary, ordinary water channel, and so on. The result is shown in Table 1 and Figure 3.
3) Runoff and confluence modeling, water supply and demand calculation, water allocation, and other submodels. The calculation of runoff is divided into four types with different LUCC such as water, paddy field, dry land, and town. The confluence calculation is classified into plain area, hilly, and lakes water confluence. The curve confluence method was used for plain area confluence (Zeng et al., 2014). The unit confluence method was used for the hilly area (Zeng et al., 2014) and direct confluence for lakes. The calculation formula of runoff is as follows, and the parameter meanings are shown in Table 2.
Water Runoff: The runoff of water is formed by the difference between the rainfall and evaporation, and if precipitation is less than evaporation, the value of surface runoff generation is negative. The calculation formula is as follows:
Paddy Field Runoff: The formula for calculating the runoff in paddy field is as follows:
If H2
Dry Land Runoff: The formulas for calculating the runoff in dry land are as follows:
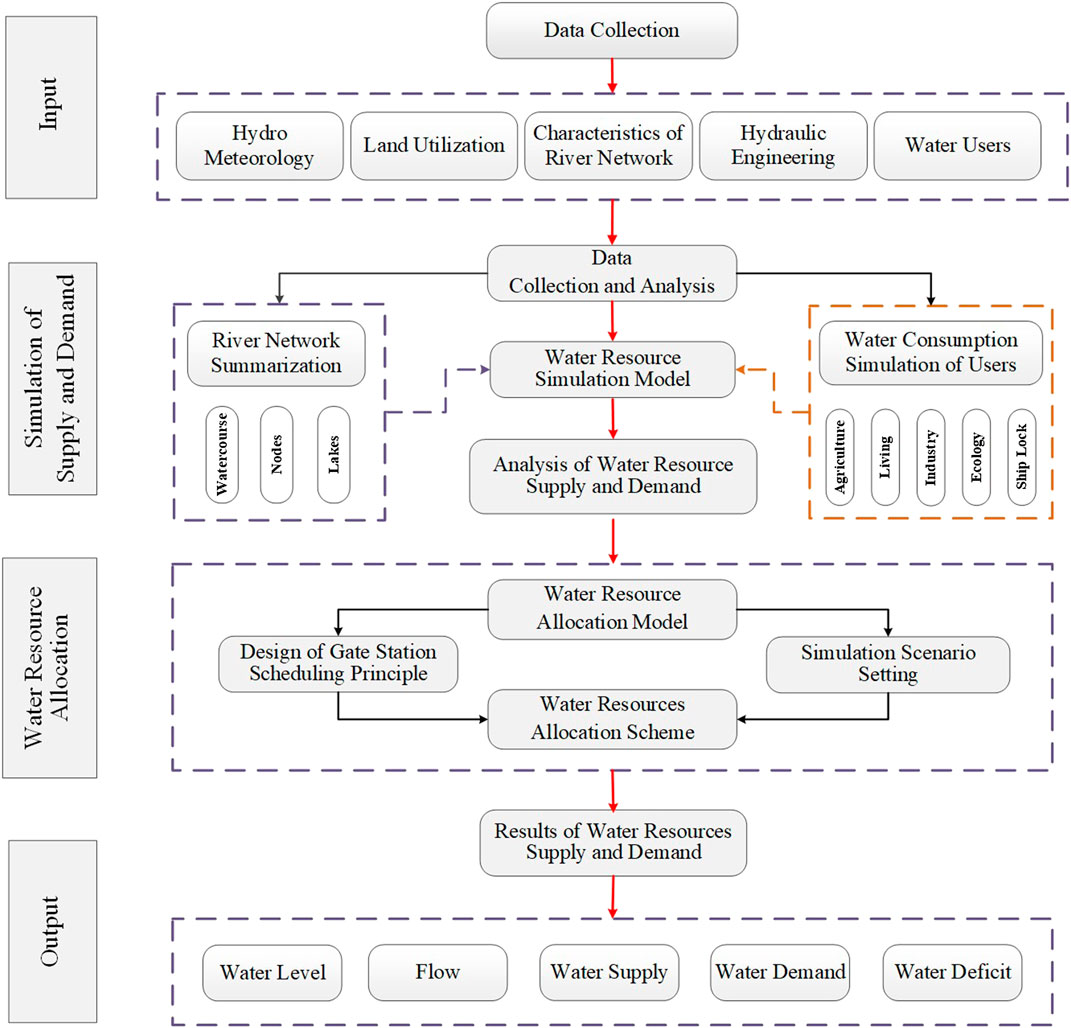
FIGURE 2. Framework of water allocation.
Town Runoff: On comprehensive consideration of the urban road runoff coefficient, the model can be simply expressed as:
Data
The data and the main parameters that the model required are listed as follows (Zeng et al., 2018). IData: Based on annual precipitation data from 1956 to 2000, typical years are selected according to row frequency—Pearson three curve. Three typical years are 50% assurance representative year (normal flow year), 75% assurance typical years (general drought years), and 95% assurance representative years (special drought years). The benchmark and planning year are selected for the simulation and calculation of the model, which are determined according to the matching of the new construction of the South-to-North Water Diversion Project, so that the model can provide the optimal water resource allocation scheme under different water conservancy project operation and management. Moreover, for the benchmark year and the typical representative years, hydrology, meteorology, surface covering, five categories of water users, river characteristics, brake properties and scheduling, policies in the utilization of water resources, and other related data were collected and calculated, which were provided by the Jiangsu Provincial Water Resources Department. Hydrology, meteorology, land use (Figure 3), water conservancy, river network, water users, and other data are monitored and predicted by water conservancy departments. Among them, the calculation description of the five water users is shown in the part 2.2.2.
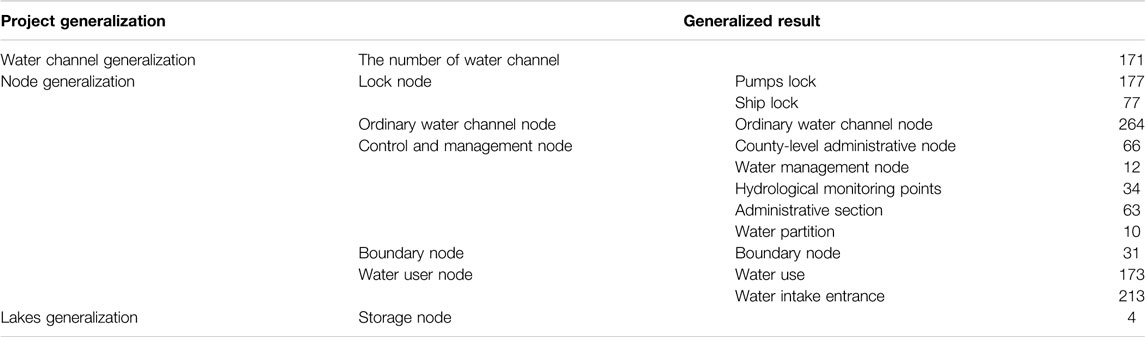
Table 1. Generalization of water supply network nodes.
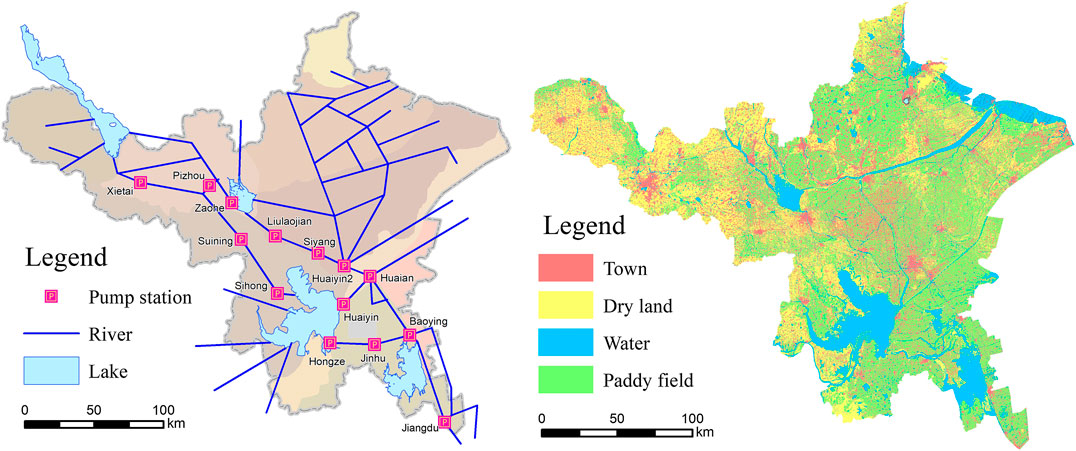
FIGURE 3. (A) River channel generalization and (B) LUCC.
Water Demand and Supply Calculation
(1) Water Demand Calculation: Water use in the study area is mainly classified into river channel water use and surface water use. The river channel water use means to take water from the trunk channel. The surface use means the water is used before drain into rivers. The river channel water use include agriculture, industry, domestic, ecology, and ship lock use, which need to take water from the generalized water channel. The agricultural water use demand is calculated by the irrigation system. The other four classes of nonagricultural use and surface water users’ demand are calculated by the quota method.
I. Agricultural water user (irrigation and water area) demand scale is calculated according to the system of irrigation and irrigation area. The irrigation water use coefficient of field is between 0.91 and 0.94, and the irrigation water use coefficient of the river channel is between 0.609 and 0.738 (Xiong et al., 2008; Peng and Ai, 2012). The calculation formula is given as follows:
where Wd (m3) is the agricultural water use, Aa (m2) is the area of farmland, Ku (m3/m2) is the water consumption per square meter of farmland, Jf is the field use coefficient of irrigation water, and Jc is the water consumption per rural resident.
II. Domestic water use demand scale intake from the river channel (urban and rural water use). The calculation formula is as follows:
where Wd (m3) denotes domestic water use, Nu (person) the urban population, Ku (m3/person) water consumption per urban resident, Nr (person) the rural population, person, and Kr (m3/person) water consumption per rural resident.
III. Industrial water use: Its demand-scale use (self-built water engineering, specializing in industrial plant) is determined according to the design of the survey data. The calculation formula is as follows:
where Wi (m3) denotes the industrial water use, Ni (million RMB) industrial production, and Ki (m3/million RMB) water consumption per million RMB industrial product.
IV. Ecological water use (river ecological water users who take water from the main rivers): the minimum value of the demand scale is determined according to the lowest navigable water level of lock design and the lowest water level of water inlet design in the water plant as well as the results of integrated water resources planning research project of ecological water demand in Jiangsu Province. The ecological water requirement out of the river channel without intake from the main rivers as surface water demand is figured out by survey and calculation. The calculation formula is as follows:
where We (m3) denotes ecological water use, Ae (m2) the area of green plants, and Ke (m3/m2) water consumption per square meter of green plants.
V. Ship lock use is determined according to water consumption every time the lock is opened and the times of daily use of the lock. The calculation formula is as follows:
where Wsl (m3) denotes ship locks water use, Nsl (time) the times of daily use of the lock, and Ksl (m3/time) water consumption per use of the lock.
(2) Water Supply: Water supply is determined by considering the minimum value of the three, such as water use demand, water channel supply, and supply ability of water intake locks. According to the actual needs of the development of national economy, agricultural, industrial, domestic, ecological, and ship lock water have different reliabilities. Thus, water use order is given according to the priority of water use, which is originally proposed by the research team. And it is applied to this study for the first time. Domestic water demand takes first priority. Industrial demand is in second place followed by ship lock water, ecological water, and agricultural water. Specific priorities are listed as follows:
I. Domestic water use and industrial water users should keep the river flowing normally and healthy ecology when water is retrieved from the water channel.
II. Agriculture, ship locks, and green plant ecological water use should keep the water channel level higher than the ecological water level when water is drained for use from the water channel. Defining the priority of water supply can prevent the water channel from drying up to meet the water use demand, especially when water use demand is particularly large.
III. The ecological water level is set in the model, which is the bottom line that the river can provide agricultural water, ship locks water, and ecological water demand. It is designed to avoid excessive intake of water from the river channel, which would affect the ecological health of the river channel and lead to drying. The determination of the ecological water level has not yet set a clear standard. In this research, mainly the Beijing-Hangzhou Canal canalized water level from the first phase of the Eastern Route Project feasibility study report (I), river ecological water table in Jiangsu Province, and the lowest navigable water level of the lock are used to estimate the ecological water level of the generalized rivers in the South-to-North Water Diversion Project.
IV. If at least one of the above three levels is in the same water channel or node location, then it adopts the lowest water level. If not, then formulate via interpolation methods.
(3) Supply and Demand Balance: Different statistical calibration methods were used as the calculating unit. These include the prefectural-level administrative region, water resource division, trunk channel, and others. Researchers balanced the supply and demand of the water source, entrance, and water channel according to the supply ability of the water resources, water conservancy project, and water demand in the study area. If the locks supply size is smaller than the water demand scale, then the insufficient part is the lack of water locks supply ability. Otherwise, it does not result in water shortage. Thus, the water supply is the minimum value of water demand at the water locks and resource. If water supply is less than the water demand, then record the accumulated water shortage. This is supplied through the optimized water allocation in the South-to-North Water Transfer Project. Researchers also analyze the balance of different calibers and formulate an optimized water allocation scheme for the demand, supply, and shortage of entire study area and mains. The main means of the optimization method, on the one hand, adopt the dual objective constraint of minimum water shortage and minimum water diversion of the Yangtze River. On the other hand, the regional lake regulation and storage capacity can be used to balance the abundance and depletion, via storing water in advance to reduce the water shortage caused by the limitation of water supply capacity.
(4) 4 Water Resource Dispatch: The scheduling scheme was developed for the operation of the North-to-South Water Transfer Project in Jiangsu Province based on different time periods, control nodes, and water resources conditions. Time periods include flood period, nonflood period, drainage period, nondrainage period, and irrigation period. Control nodes include ship locks nodes and lake nodes. Water resources conditions mainly include water, flow, and rain.
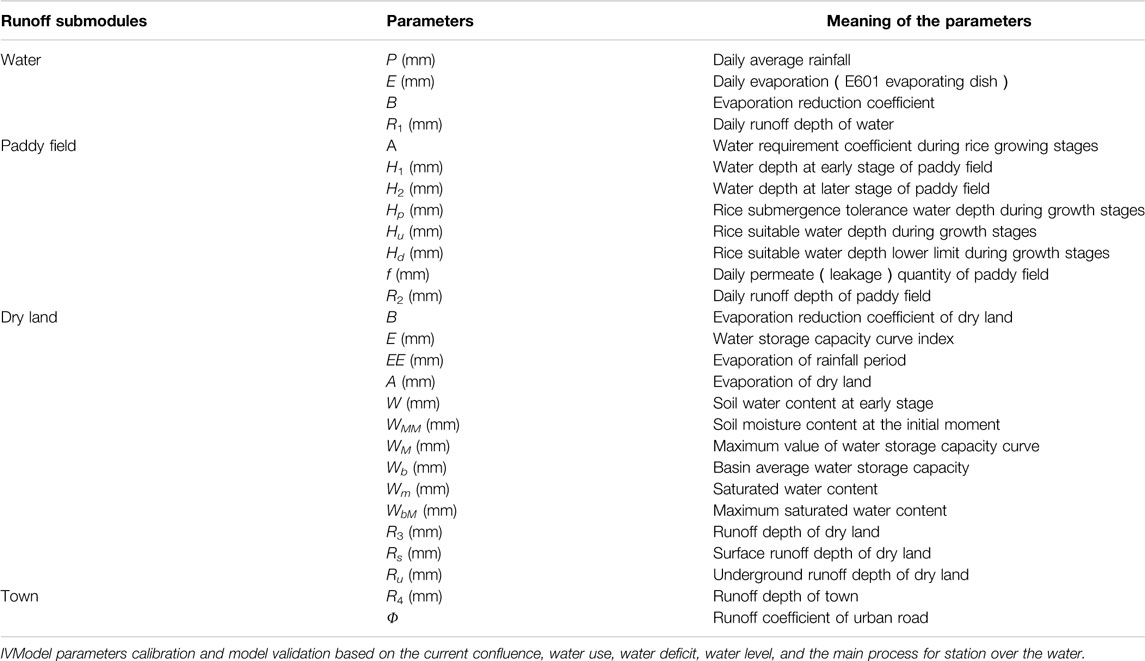
Table 2. Parameters of runoff module.
Results
Simulation Results and Analysis
The research is based on the status and planning of two different processes of engineering and water resource allocation simulation. The process of benchmark engineering is based on the projects which are used to divert water from the Yangtze River to the north of Jiangsu Province. The process of planning engineering, based on the benchmark engineering, adds new construction engineering of the South-to-North Water Transfer Project, which expands the pumping capacity of the river to 500 m³/s. There is 8,900 million m3 of pumped river water and 1,900 million m3 supply in Jiangsu Province. According to actual irrigation assurance rate level in Jiangsu, water demand and water deficit under water frequency are 95%, P = 75%, and P = 50%.
Results of Water Resources Supply and Demand
As shown in Table 3, according to the simulation results, contrast variation of water demand for the planning year and benchmark year, the water demand of P = 95, 75, and 50% increases by 0.8, 4.5, and 5%. It is concluded that when the assurance rate of water demand becomes low, the amount of water demand change increases. In the drought situation, the ship locks, industrial, domestic, and ecological water demand remain constant, but agricultural water demand increases. Agriculture water demand increases by 3 million m3 in the special drought year vs. average year. Under the same assurance rate, but a different pumped ability of the engineering, the transport remains constant and agriculture and ecological water demand change slightly; industry and living water demand change markedly (41% and 65%, respectively, vs. benchmark). For planning vs. benchmark years, the water demand when P = 95% increases by 13.0%. When water demand is P = 75%, it increases by 13.8%, and at P = 50%, it increases by 10.8%. It is concluded that the water supply increases. Based on analysis, under different processes of engineering or under the assurance rate, water supply and demand trends are held consistent (Table 4).
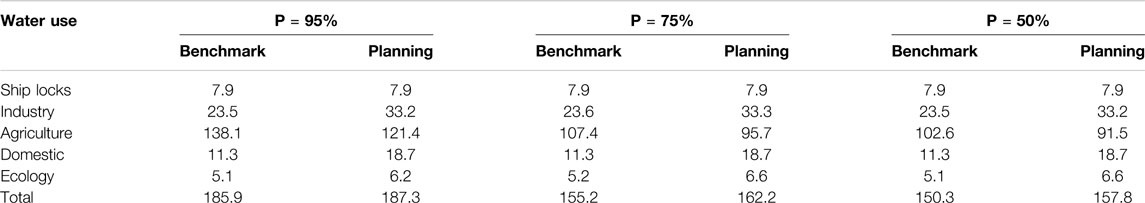
TABLE 3. Water demand based on different pump engineering situation (unit: 100 million m³).

TABLE 4. Water supply based on different engineering progresses (unit: 100 million m³).
Table 5 shows that under the same pump engineering situation, the amount of the water deficit increases when the assurance rate becomes higher, especially the amount of the water deficit is 276 million m3 under the typically drought and benchmark engineering situations. The water deficit of agriculture use is rather prominent, which receives 88.4% of the water deficit. In contrast to the same assurance rate but planning pump engineering situation, it is easy to recognize that water deficit greatly reduces for planning pump’s operation. The water deficit decreases to 69.2% at P = 95%, decreases to 75.8% at P = 75%, and decreases to 70.4% at P = 50%. Of these, water deficit for ship locks remains, water deficit for industry remains unchanged, but it decreases to 75% in the special drought year and general drought year. Under the three typical years, the agriculture water deficit was between 26.6 and 78%, and the domestic water deficit was between 50 and 80%. The most apparent is the ecological water deficit, which is decrease by 94% in a special drought year.
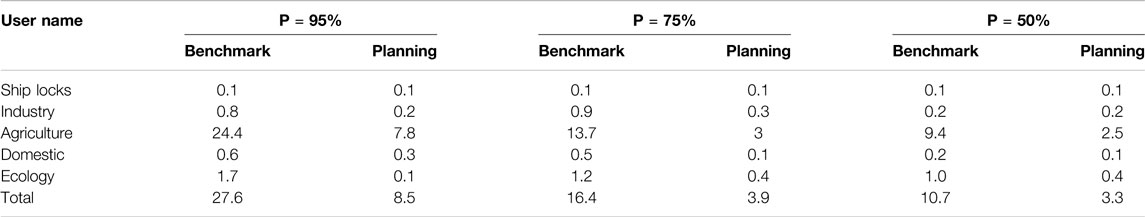
TABLE 5. Water deficit based on different engineering progresses (unit: 100 million m³).
Temporal Variations
The month was chosen as the unit of time to analyze the distribution characteristics of water demand, water supply, and water deficit. The water demand, supply, and deficit results of planning engineering contrasted with the benchmark engineering situation under different assurance rates (Figure 4). The values in Figure 4 are the result of the planning situation minus the benchmark situation. According to the results, water supply all increased under planning engineering vs. benchmark engineering. Water demand reduced in June to August, while it increased in the other months. The variations of water demand, water supply, and water deficit seem alike in January to May, while in June to December, changes are obvious. Changes are greatest during the rainy season. Under assurance rate P = 95%, water demand increases the most in December. The maximum change amount is 400 million m3; water supply changes a large amount in December and August. In the other months, the water supply is between 80 and 200 million m3. The water deficit decreases the most during June to September in the amount of 1,450 million m3, which is 75% of the rest of the year.
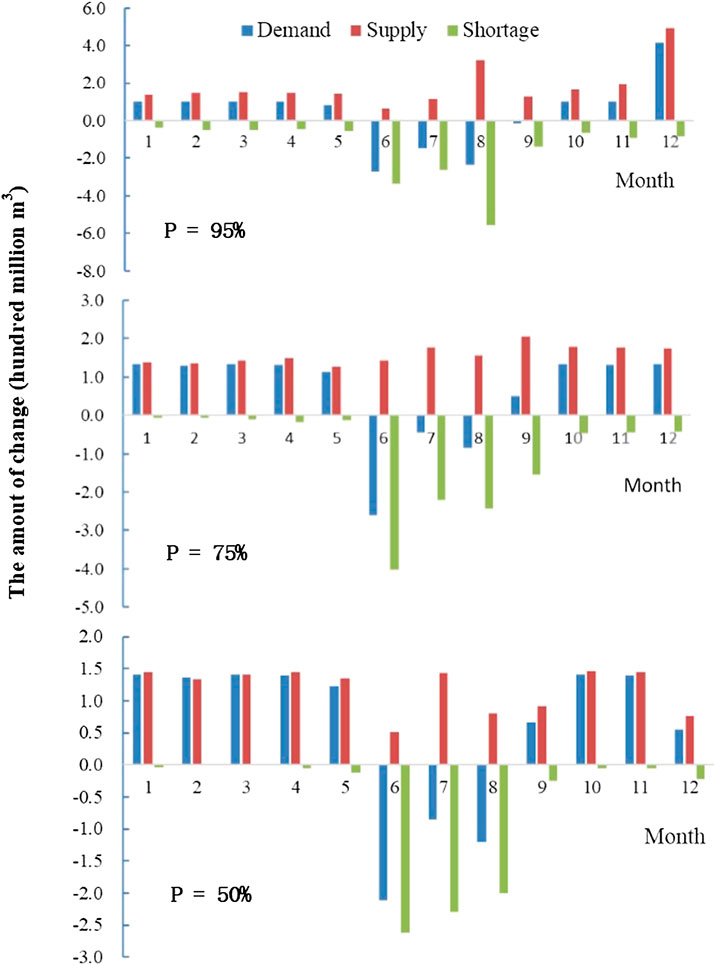
FIGURE 4. Contrast variation of water supply, water demand, and water deficit for planning and benchmark engineering situation under the 95%, 75%, and 50% assurance.
At an assurance rate of P = 75%, in contrast to the benchmark engineering situation, the water demand decreased in June to August in planning situation. Most of the decrease was in June. The maximum change value is 260 million m3. The added value of water demand in drought typical year is stable and is between 110 and 14,000 million m3. The added value of water supply in each month changes is about 150 million m3. The water deficit decreases every month. The water deficit decreases most during June to September with an amount of 1,020 million m3 and 83% of the total deficit amount of the whole year. Under an assurance rate P = 50%, the change in water demand is the same for every month similar to a general drought year. In June, water demand decreases the most at a maximum value of 210 million m3. The water supply increases the least of a minimum value of 30 million m3. Water deficit decreases every month, but it is not clear in drought season. In June to September, it decreases the most for a total of 690 million m3 or 91% of the year.
According to model simulation results, the water supply would definitely improve by 2020 and the total water deficit will decrease by a large margin in Jiangsu Province. In the years when P = 95%, the water deficit value is 850 million m3, and the water deficit rate is 4.5% which is decrease 10.3%. When P = 75%, the water deficit value is 390 million m3, and the water deficit rate is 2.4% which is decrease 8.0%. When P = 50%, the water deficit value is 330 million m3, and the water deficit rate is 2.0% which is decrease 5.2%. The water security of the region is obviously improved via the South-to-North Water Diversion Project.
Discussion and Conclusions
Researchers studied the intake area of the South-to-North Water Transfer in Jiangsu Province and realized a combination of macro-allocation of water resources and microdemand of water use. The water resource allocation model of this study is built based on agricultural irrigation water demand and optimal water resource allocation, so the proposed water resource allocation scheme is conducive to efficient utilization and protection of water resources. It is used to describe the water security both local and overall including temporal components and overall demand for water resources. Researchers also used benchmark and planning engineering situation to analyze and compare water supply, water demand, and water shortages under different conditions. The planning pump engineering is effective. And the results provide a scientific basis to water resources allocation in the eastern route of the South-to-North Water Transfer Project.
On the basis of water resources quantity estimation, water supply and demand forecast, and analysis and the research of water resource regulation, a reasonable allocation of water resources had been studied. Furthermore, water resources allocation schemes of benchmark and planning engineering situation were put forward. The model can provide different configurations of water supply based on benchmark and planning pump engineering under a different assurance rate of P = 50%, 75%, and 95%. Results showed that the water demand of planning engineering situation increased slightly compared with that in benchmark, and water supply increased obviously. Water deficit is greatly reduced, especially in the common drought typical situation; water deficit of planning engineering situation decreased 76.1% compared with that of benchmark. According to the simulated results of water pumped ability in different typical years based on the benchmark and planning engineering, it was proved that water pumped ability significantly increased in the planning engineering situation, which helps to improve regional water shortage.
It is concluded that when the assurance rate of water demand becomes low, the amount of water demand change will increase. During drought event, the ship locks, industrial, domestic, and ecological water demand remain constant, but agriculture water demand increases. The water deficit of agriculture use is rather prominent, and it is the main part of water shortage. Under the three typical precipitation situation, the agriculture water deficit was between 26.6 and 78%. According to model simulation results, the water supply will definitely improve by 2020 and the total water deficit will decrease by a large margin in Jiangsu Province. Water supply in each period all increased with planning approach vs. benchmark engineering. Water deficit is significantly reduced in June to August, which is helpful to solve the agricultural water shortage.
Data Availability Statement
All datasets generated for this study are included in the manuscript/supplementary material.
Author Contributions
CZ is the first author and led this research as well as the preparation of the manuscript. Corresponding author is Professor LW offered technical guidance. The second author is Professor JM, and he is the main programmer of the model used in this article. MC helped with hydrological data processing and also evaluated the results. WQ is responsible for preparing figures and CX has assisted with revising the English manuscript.
Conflict of Interest
The authors declare that the research was conducted in the absence of any commercial or financial relationships that could be construed as a potential conflict of interest.
Funding
This study has been financially supported by National Natural Science Funds of China (Grant numbers 41401021), Chongqing natural science foundation project (cstc2019jcyj-msxmX0227), Chongqing Normal University Fund Project (No. 19XL13 011), the china scholarship council (No. 201606195014) and Science and Technology Project of Jiangsu Provincial Water Resources Bureau (Grant No. 2014016).
Acknowledgments
We thank LetPub (www.letpub.com) for its linguistic assistance during the preparation of this manuscript.
References
Abed-Elmdoust, A., and Kerachian, R. (2013). Incorporating economic and political considerations in inter-basin water allocations: a case study. Water Resour. Manag. 27, 859–870. doi:10.1007/s11269-012-0219-6
Li, C., Zhou, J., Ouyang, S., Wang, C., and Liu, Y. (2015). Water resources optimal allocation based on large-scale reservoirs in the upper reaches of Yangtze River. Water Resour. Manag. 29, 2171–2187. doi:10.1007/s11269-015-0934-x
Li, M., Guo, P., and Ren, C. F. (2015). Water resources management models based on two-level linear fractional programming method under uncertainty. J. Water Resour. Plann. Manag. 141, 05015001. doi:10.1061/(asce)wr.1943-5452.0000518
Li, Y., Cui, Q., Li, C., Wang, X., Cai, Y., Cui, G., et al. (2017). An improved multi-objective optimization model for supporting reservoir operation of China’s South-to-North water diversion project. Sci. Total Environ. 575, 970–981. doi:10.1016/j.scitotenv.2016.09.165
Liu, J., Li, M., Wu, M., Luan, X., Wang, W., and Yu, Z. (2020). Influences of the south-to-north water diversion project and virtual water flows on regional water resources considering both water quantity and quality. J. Clean. Prod. 244, 118920. doi:10.1016/j.jclepro.2019.118920
Liu, J. L., Ma, B., Xie, J. C., and Zhao, Y. (2003). Simulation model of multi-reservoir and multi-consumer and multi-work for water unite regulation of cross-drainage basin for example of the East-route of South-to-North water transfer project. J. Soil Water Conserv. 17, 75–79.
Nazemi, A., and Wheater, H. S. (2015). On inclusion of water resource management in Earth system models–Part 2: representation of water supply and allocation and opportunities for improved modeling. Hydrol. Earth Syst. Sci. 19, 63–90. doi:10.5194/hess-19-63-2015
Peng, S. Z., and Ai, L. K. (2012). Improving irrigation water use coefficient and ensuring national food and water safety. Water Resour. Prot. 28, 79–82.
Sang, X., Wang, H., Wang, J., Zhao, Y., and Zhou, Z. (2018). Water resources comprehensive allocation and simulation model (WAS), part Ⅰ. theory and development. Shuili Xuebao. 49, 1451–1459.
Wada, Y., Wisser, D., and Bierkens, M. F. P. (2014). Global modeling of withdrawal, allocation and consumptive use of surface water and groundwater resources. Earth Syst. Dynam. 5, 15–40. doi:10.5194/esd-5-15-2014
Wang, H. (2006). The present and future of water resources allocation. Water Resour. Hydropower Eng. 37, 7–14.
Wang, Y. T., Hu, S. Y., Zhou, Q. L., Wen, D., Wang, F. Q., and Wu, Z. Y. (2001). Optimal water operation for the water transfer project from south to north (middle route). Adv. Water Sci. 12, 72–80.
Xiong, J., Cui, Y. L., and Xie, X. H. (2008). Spatial distribution of irrigation water use efficiency and its isogram. J. Irrig. Drain. 27, 1–5.
Xu, J., Tu, Y., and Zeng, Z. B. (2013). Bilevel optimization of regional water resources allocation problem under fuzzy random environment. J. Water Resour. Plann. Manag. 139, 246–264. doi:10.1061/(asce)wr.1943-5452.0000248
Xu, Y., Liu, X., and Xu, L. (2020). A dynamic expert contribution-based consensus model for hesitant fuzzy group decision making with an application to water resources allocation selection. Soft Comput. 24, 4693–4708. doi:10.1007/s00500-019-04229-3
Xu, Z. X., Ito, K., Schultz, G. A., and Li, J. Y. (2001). Integrated hydrologic modeling and GIS in water resources management. J. Comput. Civ. Eng. 15, 217–223. doi:10.1061/(asce)0887-3801(2001)15:3(217)
Yang, S. T., Jiang, Y., and Hua, P. (2007). Result analysis of water resources allocation in Jiangsu Province. China Water Resour. 5, 22–25.
Yang, Y., Yin, L., and Zhang, Q. (2015). Quantity versus quality in China’s South-to-North water diversion project: a system dynamics analysis. Water 7, 2142–2160. doi:10.3390/w7052142
Yao, Z., Zeng, C., Li, Y., Cao, M., Ma, J., and Wang, L. (2018). Development and application of complex water resources joint dispatching system based on information technology. Taking the Jiangsu section of the East route of South-to-North water diversion project as an example. Water Resour. Hydropower Eng. 49. 30–37.
Zeng, C., Ma, J., Cao, M., Yang, S., Geng, J., and Wang, L. (2018). The key technology of water resources utilization assessment research based on the strictest water resources management system taking the Jiangsu section of the east route of South-to-North water diversion project as an example. Water Resour. Hydropower Eng. 49, 22–29.
Zeng, C. F., Yang, S. T., Wang, L. C., and Song, D. D. (2014). “Research on water resources allocation of the East route of the South-to-North water diversion project in Jiangsu province. Water science and disaster prevention and mitigation under changing environment,” in Proceedings of the 12th China water forum, Beijing, China (China Water Resources and Hydropower Press), 182–189.
Zhao, H. Q., Chang, B. C., Yang, S. T., and Wang, L. C. (2012). A preliminary discussion on water shortage in water-receiving areas in Jiangsu Province in South-to-North water diversion project area based on water allocation model. Water Resour. Prot. 28, 24–28.
Zhao, Y., Xie, J. C., and Ma, B. (2002). Water dispatch of east-route of South-to-North Water transfer project based on system simulation method. J. Hydraul. Eng. 11, 38–43.
Zhao, Z.-Y., Zuo, J., and Zillante, G. (2017). Transformation of water resource management: a case study of the South-to-North water diversion project. J. Clean. Prod. 163, 136–145. doi:10.1016/j.jclepro.2015.08.066
Zhong, S., Shen, L., Sha, J., Okiyama, M., Tokunaga, S., Liu, L., et al. (2015). Assessing the water parallel pricing system against drought in China: a study based on a CGE model with multi-provincial irrigation water. Water 7, 3431–3465. doi:10.3390/w7073431
Keywords: water transfer system simulation, water resources allocation modeling, water supply and demand, South-to-North Water Transfer Project, extreme drought
Citation: Zeng C, Ma J, Cao M, Xu C, Qi W and Wang L (2020) Modeling Water Allocation under Extreme Drought of South-to-North Water Diversion Project in Jiangsu Province, Eastern China. Front. Earth Sci. 8:541664. doi: 10.3389/feart.2020.541664
Received: 10 March 2020; Accepted: 01 September 2020;
Published: 06 October 2020.
Edited by:
Xingcai Liu, Chinese Academy of Sciences, ChinaReviewed by:
Danlu Guo, The University of Melbourne, AustraliaXiaofan Zeng, Huazhong University of Science and Technology, China
Copyright © 2020 Zeng, Ma, Cao, Xu and Wang. This is an open-access article distributed under the terms of the Creative Commons Attribution License (CC BY). The use, distribution or reproduction in other forums is permitted, provided the original author(s) and the copyright owner(s) are credited and that the original publication in this journal is cited, in accordance with accepted academic practice. No use, distribution or reproduction is permitted which does not comply with these terms.
*Correspondence:Lachun Wang, wang6312@263.net.cn Chunfen Zeng, cfzeng18@163.com