A Regional Earth System Data Lab for Understanding Ecosystem Dynamics: An Example from Tropical South America
 Lina M. Estupinan-Suarez1,2*
  Fabian Gans1
  Alexander Brenning2,3
  Victor H. Gutierrez-Velez4 Maria C. Londono5 Daniel E. Pabon-Moreno1
  Germán Poveda6 Markus Reichstein1,3,7 Björn Reu8
  Carlos A. Sierra1,9 Ulrich Weber1
  Miguel D. Mahecha1,7,10,11
- 1Max Planck Institute for Biogeochemistry, Jena, Germany
- 2Department of Geography, Friedrich Schiller University Jena, Jena, Germany
- 3Michael Stifel Center Jena for Data-Driven and Simulation Science, Jena, Germany
- 4Department of Geography and Urban Studies, Temple University, Philadelphia, PA, Unites States
- 5Alexander Von Humboldt Biological Resources Research Institute, Bogotá, Colombia
- 6Department of Geosciences and Environment, Universidad Nacional de Colombia, Medellín, Colombia
- 7German Centre for Integrative Biodiversity Research (iDiv) Halle-Jena-Leipzig, Leipzig, Germany
- 8School of Biology, Faculty of Science, Universidad Industrial de Santander, Bucaramanga, Colombia
- 9Department of Ecology, Swedish University of Agricultural Sciences, Uppsala, Sweden
- 10Remote Sensing Centre for Earth System Research, Leipzig University, Leipzig, Germany
- 11Helmholtz Centre for Environmental Research-UFZ, Leipzig, Germany
Tropical ecosystems experience particularly fast transformations largely as a consequence of land use and climate change. Consequences for ecosystem functioning and services are hard to predict and require analyzing multiple data sets simultaneously. Today, we are equipped with a wide range of spatio-temporal observation-based data streams that monitor the rapid transformations of tropical ecosystems in terms of state variables (e.g., biomass, leaf area, soil moisture) but also in terms of ecosystem processes (e.g., gross primary production, evapotranspiration, runoff). However, the underexplored joint potential of such data streams, combined with deficient access to data and processing, constrain our understanding of ecosystem functioning, despite the importance of tropical ecosystems in the regional-to-global carbon and water cycling. Our objectives are: 1. To facilitate access to regional “Analysis Ready Data Cubes” and enable efficient processing 2. To contribute to the understanding of ecosystem functioning and atmosphere-biosphere interactions. 3. To get a dynamic perspective of environmental conditions for biodiversity. To achieve our objectives, we developed a regional variant of an “Earth System Data Lab” (RegESDL) tailored to address the challenges of northern South America. The study region extensively covers natural ecosystems such as rainforest and savannas, and includes strong topographic gradients (0–6,500 masl). Currently, environmental threats such as deforestation and ecosystem degradation continue to increase. In this contribution, we show the value of the approach for characterizing ecosystem functioning through the efficient implementation of time series and dimensionality reduction analysis at pixel level. Specifically, we present an analysis of seasonality as it is manifested in multiple indicators of ecosystem primary production. We demonstrate that the RegESDL has the ability to underscore contrasting patterns of ecosystem seasonality and therefore has the potential to contribute to the characterization of ecosystem function. These results illustrate the potential of the RegESDL to explore complex land-surface processes and the need for further exploration. The paper concludes with some suggestions for developing future big-data infrastructures and its applications in the tropics.
1 Introduction
Novel data streams in the Earth system sciences are becoming available at unprecedented rates (Boulton, 2018). Given that many data streams are regularly improved and frequently its spatio-temporal resolution is increased, we overall face a quasi-exponential growth of data volumes (Guo, 2017; Reichstein et al., 2019). The “data rich world” has become a challenge widely acknowledged across disciplines, but also opened a novel window of opportunity. For example, in the Earth system sciences, we expect a deeper understanding of a wide range of processes that remain to be insufficiently understood today (Scholze et al., 2017; Gentine et al., 2018; Reichstein et al., 2019). In particular, these data have large potential to reduce uncertainties in the quantification of global hydrological fluxes (Miralles et al., 2011; Beck et al., 2016; Ciabatta et al., 2018; Shen et al., 2018), atmosphere-biosphere exchange of carbon, water and energy (Dorigo et al., 2011, 2017; Green et al., 2017; Konings and Gentine, 2017; Papagiannopoulou et al., 2017; Ryu et al., 2019; Jung et al., 2020), the estimation of biodiversity patterns (Asner et al., 2015; Ma et al., 2020), and the interactions of all these processes as mediated by key ecosystem functional properties (Reichstein et al., 2014; Musavi et al., 2015; He et al., 2019).
The reason for this optimism comes especially from emerging opportunities in interpreting a wide array of data streams that jointly monitor the same system from different viewpoints. Examples are the monitoring of land ecosystems with multiple sensors at different wavelengths via satellite remote sensing, e.g., from the optical to the radar domain (Joshi et al., 2016; Anaya et al., 2020; Heckel et al., 2020), the joint analysis of field measurements and remotely sensed data (Mahecha et al., 2017; Meyer et al., 2019), and productions of ensembles of multiple data sets that integrate process-based understanding (Musavi et al., 2017). In general, it is the multitude of climate data sets that allow researchers to understand the multivariate and multifaceted nature of land-dynamics in relation to climate variability (Kraemer et al., 2020; Mahecha et al., 2020). Big-data perspectives of this kind in the Earth system context are therefore highly relevant to improve our understanding of ecological processes, e.g., effects of land use and climate change, and other fundamental transformations on the functioning of land ecosystems.
Given that many of the relevant data streams are retrieved from space, they create a unique opportunity to understand dynamics, trends and tipping points in those regions of the Earth that often lack dense in-situ observation networks. This is an advantage for low and mid-income countries, which nevertheless experience the fastest and most severe ecological and social transformations (Hansen et al., 2013; Leblois et al., 2017; McNicol et al., 2018; Song et al., 2018). We specifically point out to tropical ecosystems for two reasons. On the one hand, these regions experience fast ecological transitions e.g., due to rapid socioeconomic development (Dávalos et al., 2011; Bathiany et al., 2018; Armenteras et al., 2019a). For instance, the tropical Andes are the most critical hotspot for biodiversity in the world due to human encroachment, deforestation and land use change (Orme et al., 2005; Etter et al., 2008; Poveda et al., 2011). On the other hand, tropical ecosystems constitute relevant controls on the global carbon and water cycles. The Amazon forest, for instance, plays a significant role in the global carbon balance (Chambers et al., 2001; Pan et al., 2011; Phillips and Lewis, 2014; Hubau et al., 2020), and strongly regulates water and moisture recycling at the continental scale (Poveda et al., 2006; Zemp et al., 2014, 2017). In turn, the Andes and the low-lying Amazon constitute a coupled system whereby the low-lying Amazon exports atmospheric water to the Andes by the winds, while the Andes export surface water, sediments and nutrients to the Amazon, which highlights their mutual interdependence and the deleterious impacts of deforestation on both sides for the integrity of the system’s functioning (Builes-Jaramillo et al., 2018). Additionally, other ecosystems play a crucial role in biogeochemichal cycles. In general, savannas have been considered main drivers of interannual variability in the carbon cycle (Ahlström et al., 2015), and wetlands, including flooded savannas and swamp forest, are significant contributors of methane emissions (Bloom et al., 2017).
However, the countries hosting these highly relevant ecosystems often happen to be those where knowledge on Earth system dynamics happens to be at a comparatively early stage. Limited resources for science and technology often hinder dealing with these highly interdisciplinary challenges. One practical reason might be that research e.g., into large-scale biosphere-atmosphere interactions may require big-data infrastructures, data hosting facilities, and numerical preparation that is hardly achievable by local institutions in the long-term. This is why great hopes are today on global data facilities that may become fundamental game changers in this context. Specifically, we refer to such facilities that are not only providing data access but also provide users’ independence for developing and executing analysis. Prominent examples such as Google Earth Engine (GEE) (Gorelick et al., 2017; Tamiminia et al., 2020), or the Climate Data Store give access to a wide set of data streams accompanied by analytics facilities. However, these platforms usually provide the data as is, which means they are a collection of satellite images that are stored image by image for example as a stack of GeoTIFFS or as NetCDF files chunked as latitude-longitude maps. If the task is understanding the complex dynamics of time series or spatio-temporal patterns, having efficient computational access to the time dimension is key for boosting temporal studies at individual pixels or selected regions. Therefore, a certain amount of data pre-processing is necessary to give analytical tools the possibility for efficient access to data along all axes of the n-dimensional cube (e.g., latitude, longitude, time, variables, ensemble members, etc.). In addition, none of these platforms are particularly developed for the analysis of tropical ecosystems in terms of specific data availability and analytic capacity to trigger the understanding of regional Earth system processes.
In an ongoing joint European-Colombian collaboration since 2016, we identified the lack of open platforms that not only share free and open data, but enable analyzing them for specific problems such as regional conservation issues that should accompany a suite of regional monitoring and synthesis efforts (Sierra et al., 2017), let alone with the accompanying meta-data information. Starting from there, we have worked on the conceptual outline of a data infrastructure to study land ecosystem dynamics in space and time in tropical South America. We developed a regional Earth System Data Lab (RegESDL) for northern South America to facilitate big-data analytics efficiently based on cloud infrastructures. Our approach is twofold: first, it provides analysis ready data cubes (ARDCs) that can be augmented by almost any other conventional spatial data set. Second, and this is key, it provides the opportunity to apply any arbitrary set of user-defined functions and algorithms on the generated data cubes. The idea is that time, space, and variables, are all dimensions that can be equally relevant to the problem under investigation and therefore need to be treated alike (Mahecha et al., 2020).
Many regional data cube efforts have recently emerged around the Open Data Cube (ODC) concept that was originally developed for Australia (Lewis et al., 2017). Mostly, ODCs facilitate access to pre-processed satellite imagery. This idea is now applied to e.g., Armenia (Asmaryan et al., 2019), Colombia (Ariza-Porras et al., 2017; Bravo et al., 2017), Kenya (Killough, 2019), Switzerland (Giuliani et al., 2017), among other countries. Previous work has focused on the implementation and perspectives of these and related initiatives that vary from the software development to its establishment as national projects for supporting decision making (Giuliani et al., 2017; Killough, 2019). However, these initiatives are based on a latitude-longitude grid for data storage. This dramatically limits efficient access to time series which comes with an expensive computational cost when operating on the raw data directly because the spatial dimensions is the main unit of access and processing. Compared to all these initiatives, our approach is committed to support efficient access to any suite of geographical dataset. This allows users to explore time, variables, space, and other dimensions in its equal right (Mahecha et al., 2020). We also regard it as essential to take user-defined functions seriously and prioritize them. Users should be able to use the full power of a programming language to write algorithms, including calling into third-party libraries and map them over the entire data cube in a way that is equally efficient. In this study, we support moderate spatial resolution for understanding Earth System interactions addressing regional challenges; varying from technical aspects of data quality, acquisition and management, to high complexity due to landscape heterogeneity.
The purpose of this paper is to introduce the RegESDL for northern South America and illustrate its potential to characterize land-surface processes in relation to climatic and land use drivers. Using the example of ecosystems complex seasonality, we illustrate the approach by combining dimensionality reduction and time series analytics tools. The paper is structured as follows: First, we briefly introduce the RegESDL architecture, the implemented facilities and computational approach. Second, we describe the available datasets and the regional context. Third, we showcase how to operate on the RegESDL by characterizing seasonal dynamics in tropical ecosystems. For this, we use a multivariate set of remote sensing derived indicators related to ecosystem productivity. Seasonality in the tropics is well characterized from a climatological point of view, but hardly described from the point of view of ecosystem functioning. Finally, we discuss the findings of our study and provide some guidance on how the RegESDL should help to advance research in the tropics across disciplines such as biodiversity from both a conceptual and technical standpoint.
2 Methods
2.1 The Regional Earth System Data Lab Architecture
The RegESDL is a twofold approach for big-data analytics of spatio-temporal variables. It is conceptually and technically an extension of the the Earth System Data Lab (ESDL) (Mahecha et al., 2020), and its guiding principle is to treat all data dimensions such as latitude, longitude, time, variables, and new dimensions (i.e., outcomes from processing), all alike. Thus, all data sets are treated as elements of the same “hypercube”. A formal mathematical definition of data cubes and how to operate on them is provided in Mahecha et al. (2020). The first fold is based on ARDCs which are a set of data cubes gridded at the same spatio-temporal resolution (see section 2.2). The second fold is the analytics software that tackles the issue of working with large datasets that are too big to fit into a computer’s RAM. With our approach this is not any longer a critical limitation given that many user functions do not operate on the whole dataset at once, but can operate independently on slices of the data cube along a given dimension.
Traditionally, there are many tools for analyzing data sliced along the space dimensions and well established libraries like the Geospatial Data Abstraction Library (GDAL/OGR Contributors, 2020) used as main dependency in geospatial libraries of different geographical information system software such as QGIS and programming languages such as R and Python. However, in our cubing approach, slicing is not only efficient along the space dimension but also along all dimensions i.e., time, variables, and any other thinkable dimension a cube might have (e.g., frequency domain after time series decomposition). The idea is that users only have to define and implement their basic functions at the minimum dimensions that the computation would operate individually in the data cube. The system then handles each operation efficiently, i.e., the implemented logic for slicing can be applied to solve spatial, temporal, or multivariate problems all in the same highly efficient way.
The ESDL software uses split-apply-combine methods (Wickham, 2011) to facilitate the repeated application of user-defined functions to sub-cubes. Thus, in the Julia interface, in order to implement a customized function to be applied to the entire cube or its lower-dimensional sub-cubes, the user first simply implements it for the lowest possible dimensionality. As an example, an operation on a single time series only needs to be implemented as a function that takes a vector (i.e., one-dimensional array) as its input. Likewise, a function intended to operate on two-dimensional latitude-longitude slices of the data only needs to be designed in a way that it expects a matrix argument, not a three or four-dimensional cube. The user simply ignores the fact that later the function is applied to a higher-dimensional object, for example along variables or any remaining cube dimension. Then this function is passed to a higher-level processing pipeline, along with the definition of input and output dimensions and a highly optimized computation kernel is generated by the processing package.
The users can, too, allow any ARDCs axis to interact with data stored in other formats such as one or multi-dimensional arrays. For example, indices of climate variability such as El Niño Southern Oscillation (ENSO) could either be defined simply as a vector or transformed into a one-dimensional cube. In both cases, the index interacts with the corresponding ARDCs axis in a similar way than an apply function in the time domain. These split-apply-combine methods are common tools in data-science oriented languages like R, Python and Julia for in-memory datasets. However, for larger-than memory datasets it is not so easy to find a suitable solution at hand. While frameworks like Apache Hadoop and Spark (Vavilapalli et al., 2013; Zaharia et al., 2016) provide solutions for unstructured, table-like data, they would not fit for the challenges provided by structured n-dimensional arrays. A very promising approach is the combination of xarray and dask for efficient and scalable split-apply-combine computations in combination with Zarr as a storage backend.
The implementation of this data cube approach takes advantage of the latest cloud-ready formats for big chunked spatio-temporal data sets. Here we use the Zarr format (https://zarr.readthedocs.io/en/stable/spec.html) that focuses in cloud technologie storage and can be efficiently handled in Python (https://zarr.readthedocs.io/en/stable/) and Julia (https://github.com/meggart/Zarr.jl). In addition to the Python xarray interface we offer another interface implemented in Julia, a novel high-level programming language for scientific computing, in the ESDL.jl package by Fabian Gans (co-author), and the most up-to-date documentation is always available in the respective GitHub repository https://github.com/esa-esdl/ESDL.jl (last visit Apr 17, 2020). All the Julia ESDL.jl packages and facilities have been transferred to the RegESDL offering a very flexible and efficient way for processing. The ESDL software is open source and available under the MIT license.
2.2 Analysis Ready Data Cubes
In our study, we defined ARDCs as spatio-temporal datasets, usually provided by different sources, stored in a uniform grid and located at common chunks. Figure 1 shows a schematics of the ARDCs main features and the stepwise generation. ARDCs support immediate interaction between different data sources. Rechunking is unnecessary for analysis along the spatial or temporal dimension speeding up the processing. ARDCs in the RegESDL extend from latitude 14° N to 14° S and longitude –83° W to –60° W. The spatial resolution is 0.0083° × 0.0083° (approximately 0.9 km × 0.9 km at the equator). We consider this spatial resolution a good compromise for regional studies, preserving sufficient spatial details for general climate patterns, ecosystem gradients and main relief features. Nevertheless, it is limited in very steep areas and heterogeneous landscapes in the Andes. The temporal resolution is 8-daily and the covered period is from 2001 to 2014. When necessary, data has been resampled or interpolated to match the spatio-temporal grid. Temporal and spatial aggregation was done using the package gridtools (https://github.com/esa-esdl/gridtools), further details are included in Table S1. The total size of the ARDCs is 3.03 TB. We present the RegESDL ARDCs in three categories; time series, descriptive variables and national layers. A comprehensive list of the data with details of the original resolution, interpolation method, spanning time, source and license is in the Supplementary Tables S1–S5.
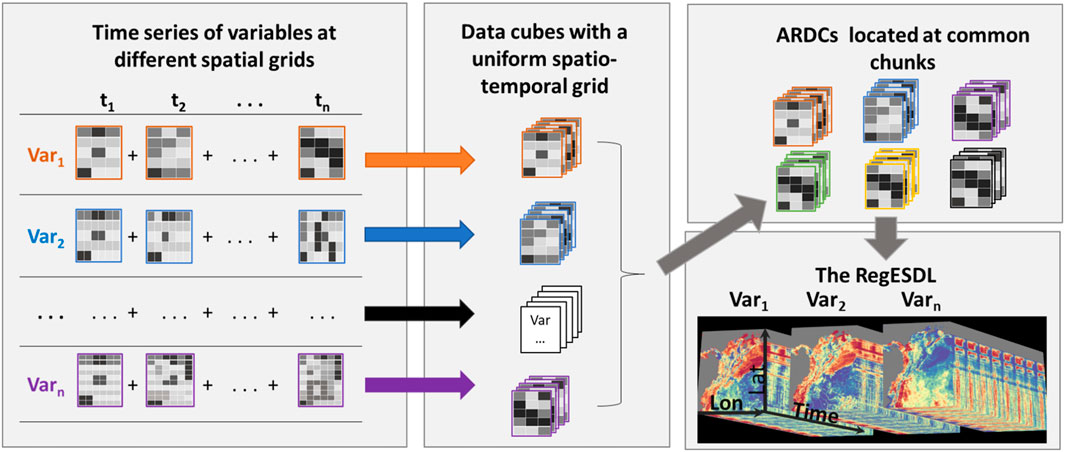
FIGURE 1. Workflow of the Analysis Ready Data Cubes (ARDCs) generation and dimensions of the Regional Earth System Data Cube (RegESDL). Lat: latitude. Lon: longitude t: time, Var: variables.
Time series are mainly data sets from models or satellite products related to vegetation and climate (Supplementary Table S1). We compiled data of gross primary productivity (GPP), evapotranspiration, shortwave radiation, photosynthetically active radiation (PAR) and diffuse PAR from the Breathing Earth System Simulator (Ryu et al., 2011; Jiang and Ryu, 2016; Ryu et al., 2018) describing ecosystem functioning. The selected products from the Moderate Resolution Imaging Spectroradiometer (MODIS) are 8-daily composites of leaf area index, fraction of absorbed photosynthetically active radiation (FPAR), and 16-daily composites of the enhanced vegetation index (EVI) and normalized difference vegetation index (NDVI) which are values of standing vegetation and greenness. Day and night land surface temperature was also obtained from MODIS. Albedo data was acquired from the Quality Assurance for Essential Climate Variables project (http://www.qa4ecv.eu/). Precipitation data was provided from two sources; the Tropical Rainfall Measuring Mission (TRMM, https://trmm.gsfc.nasa.gov/) and The Climate Hazards Group Infrared Precipitation with Stations (Funk et al., 2015). Time series with different temporal resolutions were also included such as the annual land cover maps from the European Space Agency (ESA) (ESA, 2017), annual vegetation cover fraction from MODIS, monthly annual averages of cloud coverage (Wilson and Jetz, 2016) and monthly fire data from MODIS. We also incorporated quality flags from MODIS products. The quality flag criteria was implemented on the original files (i.e., sinusoidal projection) and it is documented in Supplementary Table S2. After defining the pixels with acceptable quality, data was reprojected to WGS84. For detailed information of all data products refer to the original documentation, references are included in the supplementary and bibliography.
Another important element relates to descriptive ecosystem variables. This category collects global datasets without a time dimension and describes some ecosystem features (Supplementary Table S3). There are 45 layers in total; canopy height (Simard et al., 2011), 11 variables of the Harmonized World Soil Database (FAO and ISRIC, 2012) and 23 of Soil Grids (Hengl et al., 2014) associated with soil composition and chemical properties at different strata. These ecosystem variables reflect a specific ecosystem state which is of importance for characterization, but they lack on offering a dynamic perspective. Alternative products bring the possibility for investigating soil water dynamics (e.g., soil moisture), however the coarse spatial resolution constrains its current use in our study.
Because the RegESDL also aimed to support the Colombian Biodiversity Observation Network (BON) geographical layers of Colombia were included (Supplementary Table S4). These data layers have been ingested from governmental web portals or from scientific publications. Layers in vector format were transformed to the target grid. Borders of administrative units (IGAC, 2010) and national natural parks (PNN, 2015) were included. Maps of wetlands (Flórez et al., 2016), agriculture frontier (MADR-UPRA, 2017) and biotic units (Londoño et al., 2017) were also added for further ecological analyses, as well as comparative interpolations of mean annual precipitation (Álvarez-Villa et al., 2011).
The RegESDL can be operated through different ways. First, the RegESDL can be accessed locally using Julia. In this case, the loaded datasets are exclusively the ones required for the analysis. Second, the RegESDL can be completely downloaded to any local machine using Python. Explanatory scripts of how to access the RegESDL are included in the supplementary and at http://doi.org/10.5281/zenodo.5068004.
It is important to highlight that datasets described previously are the first core of the RegESDL. Nevertheless, the RegESDL is prepared for interacting with new data sources and can be easily expanded by users ingesting their own data as NetCDF or CSV files using the ESDL.jl package. The imported data layers must share the same grid extent to warranty Interoperability among multiple datasets. Vector files i.e., shapefiles are also supported, they can be loaded and converted to a grid for further processing in the ESDL environment.
2.3 The Regional Earth System Data Lab Coverage
The RegESDL focuses on tropical ecosystems of northern South America. It covers Colombia, Ecuador, Venezuela, and partially Brasil, Bolivia, Panama and Peru. From now on we refer as regional scale to the area covered by the RegESDL, and local scale to the country level and finer geographical units. We selected this region because it is facing a rapid ecosystem transformation due to land use change and urgently needs tools that help to understand ecosystem dynamics, contributing to fill a knowledge gap in the countries that encompass this region. Having a ready RegESDL to facilitate big-data analytics for ecosystem function is key on understanding one of the most diverse regions of the world.
This region is dominated by extensive natural tropical ecosystems, and multiplicity of climates related to topographic gradients, trade winds, and the meridional migration of the Intertropical Convergence Zone that drives annual variability. The highest altitude is in the peruvian Andes in Cordillera Blanca with more than 6,500 masl. Dominant land cover types are broadleaved evergreen forest open or close > 15% (4,740,043 km2), grassland (474,959 km2) and shrubland (266,967 km2) according to the ESA land cover classification (ESA, 2017) (Figure 2). Regional climate interaction with the Andes creates a variety of microclimates that cause two major hydrological regimes; unimodal and bimodal seasonal dynamics in many hydro-meteorological processes. In general, all feedbacks in the water cycle are governed by complex lateral interactions across the Amazon and the Andes, but also locally caused by precipitation recycling due to orographic gradients (Poveda et al., 2006; Bedoya-Soto et al., 2019; Espinoza et al., 2020). The mean annual precipitation records in the RegESDL area range from less than 100 mm in the Peruvian coast, upper limit with Atacama desert, to more than 11,000 mm in the Choco region of Colombia, which is perhaps the rainiest region on Earth (Poveda and Mesa, 2000; Yepes et al., 2019). The diurnal cycle of temperatures is the most salient feature of tropical climatology. Variations in temperature are often larger within a day than throughout the year (Hastenrath, 1991), with strong effects on the diurnal cycle of precipitation in the tropical Andes (Poveda et al., 2005). The region currently faces increasing rates of deforestation and land cover change.
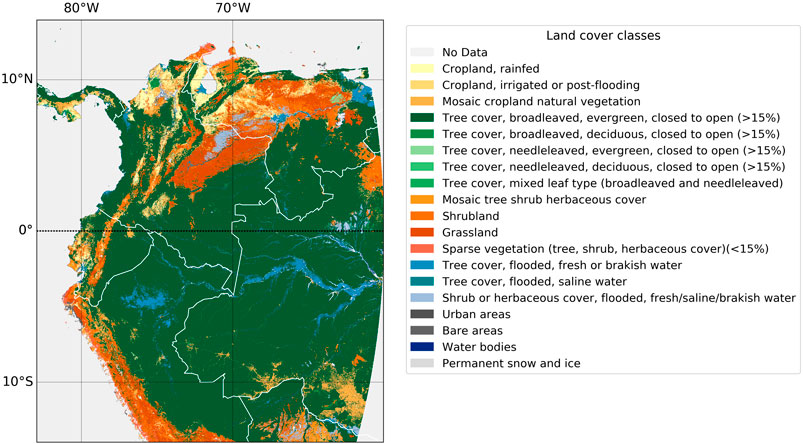
FIGURE 2. Regional Earth System Data Lab extent with land cover classes. White lines correspond to national borders (Data from ESA land cover 2014).
In the following, we emphasize the territory of Colombia which is considered the third most biodiverse country and a hotspot for biological conservation (Myers et al., 2000; Andrade, 2011). Currently, Colombia is facing a massive transformation of natural ecosystems due to various socioeconomic transitions (Baptiste et al., 2017; Sierra et al., 2017; Salazar et al., 2018). Deforestation is now reaching national protected areas (Armenteras et al., 2019b; Clerici et al., 2020), and the agricultural frontier is also expanding to other natural ecosystems (Miles et al., 2006; Etter et al., 2008; Bianchi and Haig, 2013; Patino and Estupinan-Suarez, 2016; Correa Ayram et al., 2020). The RegESDL incorporated national layers to facilitate analysis at this scale with a special focus on biodiversity and ecosystems research (see section 2.2). Moreover, some variables were selected to provide seasonal and longer-term information to Biomodelos (http://biomodelos.humboldt.org.co/es) aiming to get a more dynamic perspective of species distribution models. For this particular reason they both share the same grid extent. The RegESDL also aimed to contribute to the development of Essential Biodiversity Variables (EBVs) in mega-diverse tropical countries. In this case we thought on a top-down approach for biodiversity monitoring. The Colombia BON, one of our partners, has done an extensive development and implementation on the topic.
2.4 Case Study Question
In the following, we showcase the potential of using the RegESDL for assessing seasonality in northern South America. Here, we investigated the joint variability of multiple time series, and contextualized the identified patterns in different spaces (i.e., climate space, geographical space, along biodiversity gradients). This analysis had two purposes. One was to carry out a seasonality analysis pixel wise for the region. The other one emphasized on the Colombian territory and its biotic units. A schematic of the RegESDL and a workflow overview is in Figure 3.
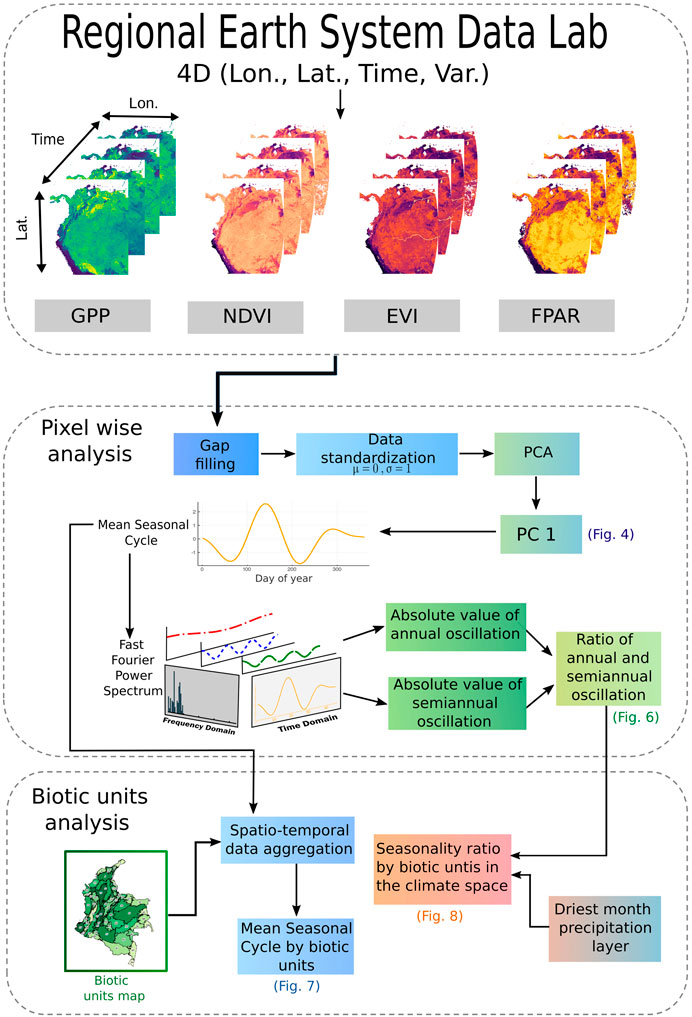
FIGURE 3. Workflow of the multivariate vegetation dynamics analysis pixel wise and by biotic units.
2.4.1 Seasonality in Northern South America
We focused on seasonal phenology, one of the fundamental dynamics of most ecosystems of the world (Schwartz, 1998). In tropical ecosystems, however, seasonal dynamics are hardly understood and not well characterized (Wu et al., 2016). On the one hand, this is due to data quality issues, but on the other hand it reflects the fact that the tropics embrace extremely heterogeneous landscapes. For northern South America, a large level of annual variability in phenological variables has been reported, particularly for savannas, dry forest and wetlands (Estupinan-Suarez et al., 2015; Hamunyela et al., 2016; Fagua et al., 2019). Subannual data acquired from tree ring cores (Giraldo et al., 2020), and from space via solar induced fluorescence (SIF) (van Schaik et al., 2018) recently also suggested annual seasonality in tropical rainforest. From the functional perspective, Nemani et al. (2003) reported radiation as a limiting factor of plant growth and net primary productivity in the tropics that likewise hints at some seasonality.
What remains unclear from the literature is: i) how strongly are seasonal patterns reflected by terrestrial ecosystem dynamics, ii) whether we can delineate unimodal or bimodal regions, and iii) how do patterns of annual and semi-annual seasonality distribute spatially. If we understand where unimodal and bimodal seasonailities predominate in land-atmosphere interactions, we could achieve a better predictive understanding of the imprints of extreme climate events such as ENSO, and climate change signals on ecosystems.
Terrestrial seasonal dynamics should be contained in all remote sensing indicators related to green biomass and primary production. Available data sets in the RegESDL are partly direct remote sensing vegetation indices of greenness, i.e., NDVI (Tucker and Sellers, 1986) and EVI (Huete et al., 1997, 2002). But also, we can analyze GPP and FPAR that are closely related to vegetation activity. Conceptually, these variables represent different processes which are related and physiologically connected, but they are not exchangeable. Of course, the closer to the actual process under interest (e.g., GPP), the more model assumptions are contained in the data (Jiang and Ryu, 2016). The advantage of the original remote sensing signals is that they are closer to the purely observational signal, but not necessarily directly related to the process of interest. Yet, we can assume that all these time series somehow reflect the seasonal cycle of vegetation productivity, yet coupled via more or less direct mechanisms that all reflect seasonal dynamics of green vegetation.
2.4.2 Characterization of the Mean Seasonal Cycle Pixel Wise
In order to capture the seasonal variability of vegetation while accounting for the redundancy of the different vegetation related signals, we conducted a principal components analysis (PCA). PCA is a dimensionality reduction method that seeks new dimensions (components) in the feature space to explain the largest variance, and does it recursively based on orthogonal basis functions. In this sense, it provides common modes of variability at the pixel level that serve to assess seasonality. For our analysis, we selected GPP, NDVI, EVI and FPAR variables spanning from 2001 to 2014 (data set size = 111.24 GB). Variables were gap filled using the Mean Seasonal Cycle (MSC) method. Gaps were clustered in rivers and waterbodies and its amount varied among variables; while GPP excluded all data pixels related to water, MODIS products preserve or exclude them irregularly. The next step was to standardize the time series to mean zero and variance of one (
Based on the Fast Fourier power spectrum, we estimated the contribution of annual and semiannual oscillations of the MSC pixel wise using the discrete Fast Fourier transform library (FFTW) included in the Julia programming language. Here, the idea is that the ratio between the spectral power of the annual and semiannual oscillations can be quantified if the annual or semiannual oscillations dominate the seasonality of the signal. Theoretically, values of <1 indicate a dominance of the semiannual oscillations, values close to 1 are related to an equal contribution of seasonal and semi-annual modes, while values of >1 reflect a dominance of the annual oscillation. We classified the FFTW outcomes as follows: The first component is the sinusoidal function offset, the second component corresponds to the annual oscillation, whereas the third and fourth components together (6 and 4 months respectively) correspond to the semiannual oscillation. Subsequently, we computed the contribution of both annual and semiannual oscillation to the entire signal. Only pixels with at least one direct retrieval at each MSC time step were included in the analysis. The quantification of direct retrievals was based on the quality flags from MODIS variables (Supplementary Table S2). The computation is documented in Jupyter notebooks included as supplementary material and at the GitHub repository https://github.com/linamaes/Regional_ESDL.
2.4.3 Seasonality Characterization of Biotic Units in Colombia
For our second study, we used the biotic units map of Colombia produced by Londoño et al. (2017) as a level of aggregation, aiming to bring a functional understanding of units with biological diversity connotation. The delineation of these biotic units was based on a Beta diversity criteria defined as the taxonomic composition variation (Supplementary Figure S1). Each unit was defined by having a unique set of species that was significantly different to the species set of all other units. Beta diversity was computed from species distribution models of amphibians, birds, mammals, reptiles and plants available in Biomodelos, a collaborative platform that integrates models and expert knowledge (Olaya-Rodríguez et al., 2018; Velásquez-Tibatá et al., 2019). Our approach looks at biodiversity based on the hierarchical concept developed by Noss (1990), and seeks a functional perspective including different taxa similar to Radeloff et al. (2019). It is not related to spectral diversity for ecosystem function assessment.
We calculated the MSC of biotic units using the first principal components (PC) obtained from the pixel wise analysis. First, we computed the average and standard deviation of all pixels within each unit. Then, we calculated the ratio and fraction values of the averaged MSC based on the Fast Fourier power spectrum as we explained in section 2.4.2. We also analyzed the biotic units outcomes in light of climatic variability. For this, we selected variables that describe annual bioclimatic conditions such as precipitation of the driest month, maximum temperature of the warmest month, mean temperature of the driest quarter from WorldClim (Fick and Hijmans, 2017), and median annual cloud frequency (Wilson and Jetz, 2016). These variables were used in the climate space and were related to the MSC ratio by biotic units.
All analysis ran in Julia 1.3 using the ESDL package v0.8.4. Processing was done in an Intel®Xeon®Processor E5-2687W v4 CPU (30M Cache, 3.00 GHz), and used six cores.
3 Results
3.1 Summarizing Multivariate Vegetation Dynamics
The first PCs from the PCA captured the largest vegetation variability pixelwise (Figure 4). When exploring pixels from different land cover types, we found overall that PC1 captured the main MSC features of each variable (Supplementary Figure S2). In general, for broadleaf evergreen trees and grassland the variables’ trajectories and peaks overlapped most of the time, although the signal amplitude differed. The shrubs-herbaceous flooded cover was the one presenting the most contrasting trajectories between variables. The main contributors to PC1 are different along the regions (Supplementary Figure S3), NDVI contributed the most in arid and semiarid regions such as the Caribbean and Orinoquia savannas and at the Pacific coast of Ecuador and Peru, whereas EVI is the larger contributor in the Amazon and Biographic Choco i.e., the wettest regions. Some pixels were excluded from the analysis due to data quality. They are mainly located along the Pacific coast, in the higher Andenean mountains, and in the transition between the mountains and lowlands.
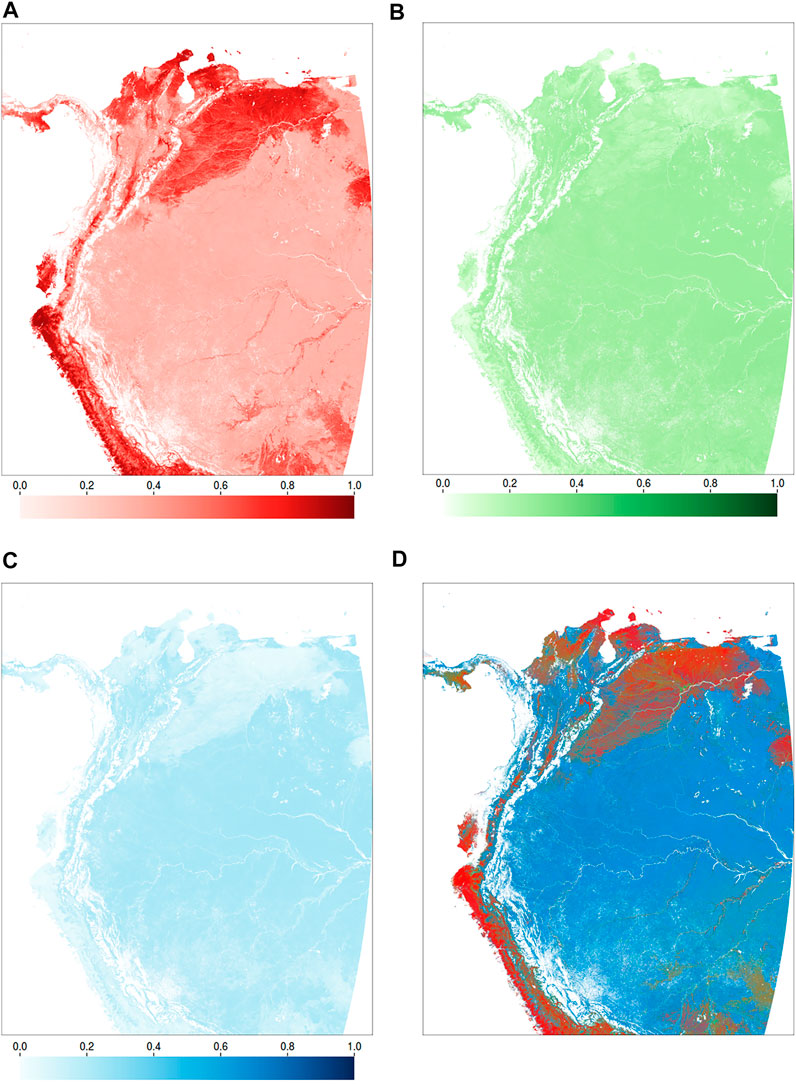
FIGURE 4. Variance explained by principal components. Variance explained by the first, second and third component in (A,B,C) respectively. (D) RGB map of the variance explained by the components 1, 2 and 3 in red, green and blue channels respectively. Note that the red channel represents variability in the range (0.28–0.86), the green (0.07–0.31), and blue (0.03–0.24).
We observed different regional patterns of variance explained by the three principal components. PC1 (Figure 4A) explains the largest variance in ecosystems mainly dominated by savannas in the Orinoco and Caribbean basins of Colombia and Venezuela, and lowlands of the Magdalena-Cauca river basin. Similar pattern occurs in the Pacific coast of Ecuador and Peru. These regions are characterized by very low precipitation during the dry season and are dominated by grassland. PC2 (Figure 4B) shows a homogeneous spatial pattern, being slightly lower in arid and semiarid ecosystems. Otherwise, PC3 (Figure 4C) dominates the broadleaf evergreen forest. The explained variance by the PCs range from; 0.28 to 0.86 for PC1, 0.07–0.31 for PC2, and 0.03–0.24 for PC3. These shows that variance PC2 and PC3 can carry similar amount of variance in some regions. Overall, Figure 5 shows that PC1 explains more than 40% of variance in grassland, shrublands and herbaceous cover with shrubs and trees. But it is certainly limited in broadleaf evergreen forest where captures between 20% and 40%, which is also a region known by large data gaps due to clouds.
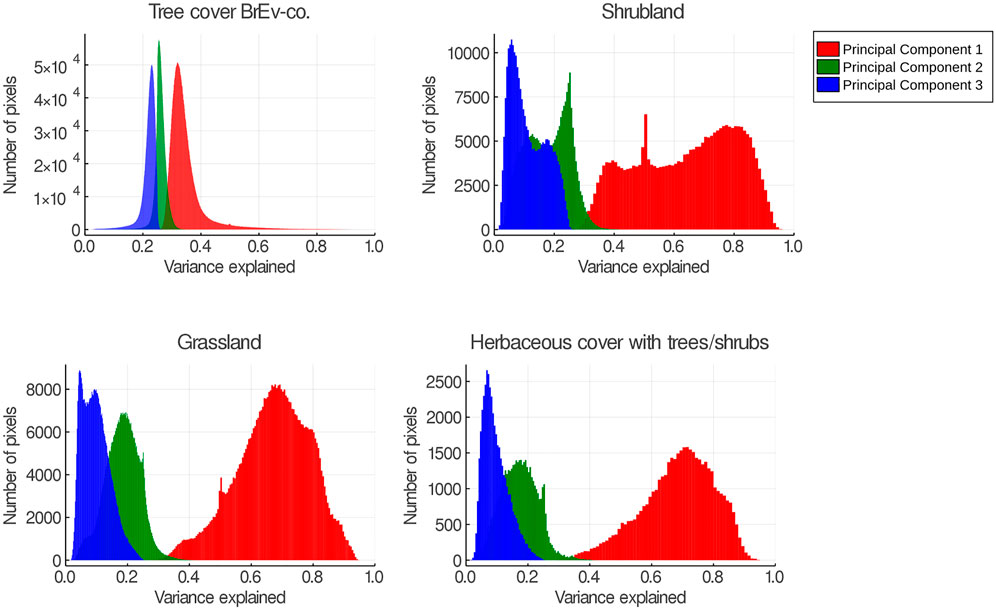
FIGURE 5. Histogram of variance explained by the first three principal components for different ESA land cover classes in 2014. Tree cover BrEv-co: Tree cover, broadleaved, evergreen, closed to open (>15%). Herbaceous cover with trees/shrubs: Mosaic herbaceous cover (>50%)/tree and shrub (<50%).
3.2 Quantification of Temporal Dynamics
The map of seasonality ratios (Figure 6) depicts a spatially heterogeneous dominance of annual variability in the region that can be associated to the major landscapes. Annual cycles dominate the land-surface dynamics along the Ecuadorian and Peruvian coast and northern Venezuela. Large-scale patches of semi-annual oscillations are found in the flooded savannas of Orinoquia, and inter-Andean valleys in Colombia. Similar contributions of annual and semi-annual oscillations are observed partly in the Caribbean coast and foothills. The northwestern Amazon basin does not have a uniform pattern, although it shows a slight trend with dominance of bimodality close to the Equator (the wettest region), and unimodality toward South. Yet, it is hard to determine due to the optical sensors limitations in the rainforest. However, care must be taken in interpreting this figure, taking into the account the variability represented from the total signals (Figure 4) and the amplitude of the oscillations. In this regard, we estimated the fraction between both assessed oscillations (i.e., annual and semiannual) and the entire signal based on the power spectrum of Fast Fourier. These values are found in Figures 6, 7.
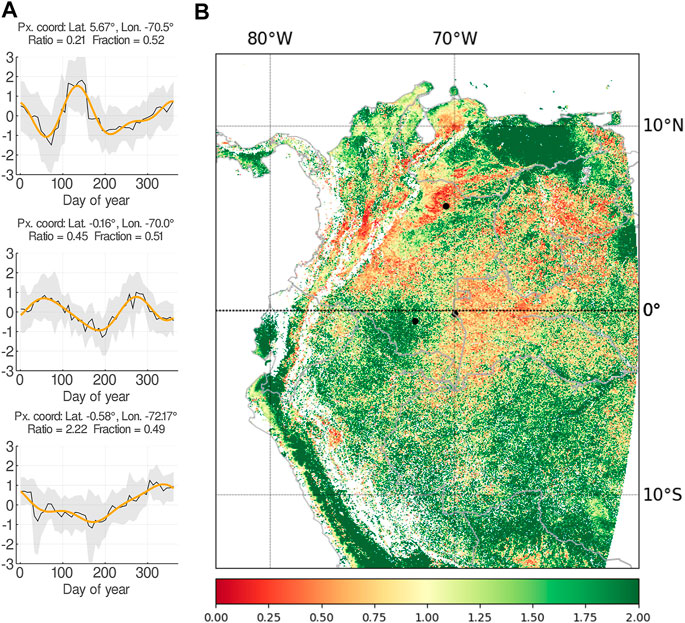
FIGURE 6. Seasonality ratio of annual and semiannual oscillations pixel wise from the first PCA component of vegetation variables. (A) Mean Seasonal Cycle (MSC) of three pixels represented as black dots in the map. (B) Ratio map of the MSC. Values of 1 show an equal contribution of annual and semiannual oscillation, values of >1 means higher contribution of annual in comparison to semiannual oscillation, and values of <1 conversely. Note that the color scheme is cut in 2 (54% of pixels values <2). Ratio: Ratio of annual and semiannual oscillation. Fraction: Fraction of annual and semiannual oscillation in comparison to the entire signal.
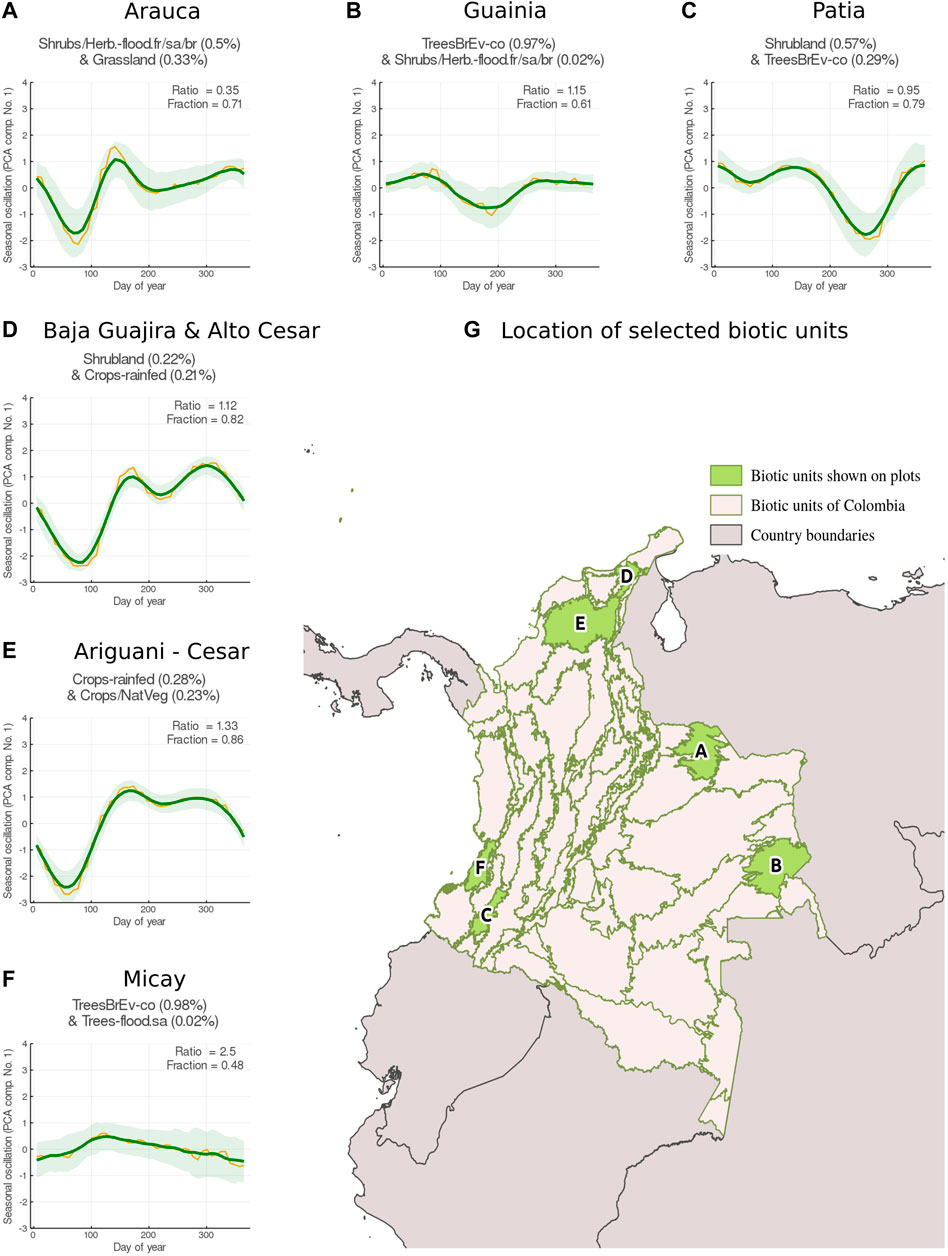
FIGURE 7. (A–D) Mean Seasonal Cycle of the first PCA component (yellow solid line) aggregated by biotic units of Colombia. Green solid line is the smoothed time series and the ribbon is the standard deviation. Dominant land cover type percentages from ESA 2014 are on each subplot, and follow the next abbreviations. Crops-rainfed: Cropland, rainfed. Grass: Grassland. Shrubs: Shrubland. Shrubs/Herb.-flood.fr/sa/br: Shrub or herbaceous cover, flooded, fresh/saline/brakish water. TreeBrEv-co: Tree cover, broadleaved, evergreen, closed to open (>15%).Trees-flood. sa: Tree cover, flooded, saline water. Ratio: Ratio between annual and semiannual oscillations. Fraction: Fraction between annual and semiannual oscillations to the entire signal. (G) Geographical location of BU shown from (A–D).
3.3 Seasonal Dynamics of Colombian Biotic Units
In order to understand the spatial variability of vegetation seasonality and its links to biodiversity we used the biotic units of Colombia. We observe that the units with higher amplitude are also the ones where annual and semiannual variability have a fraction value of >0.7 (Figure 7). Overall, we observe that seasonality in the biotic units is extremely different; peaks of vegetation activity are reached at different times across Colombia, unimodal and bimodal seasonality are equally important at the national level, and regions with lower variability explained by these regimes have to be further explored. These could be associated with the dominance of fast oscillations as reported by Linscheid et al. (2020) for some tropical regions.
We used bioclimatic variables as a first proxy to understand seasonal variability. We selected precipitation of the driest month, maximum temperature of the warmest month, mean temperature of the driest quarter (Fick and Hijmans, 2017), and median annual cloud frequency Wilson and Jetz (2016). As an overview, six biotic units with contrasting patterns are presented. We observe that the lowest values of monthly annual precipitation differ significantly within biotic units. In Arauca and Baja Guajira-Cesar values are less than 30 mm (Figures 8A,D) whereas in Micay values are above 300 mm on average (Figure 8F). Interestingly, in the region Magdalena-Medio & Depresion Momposina, there are two clear hotspots (Figure 8E). Pixels with precipitation in the driest month of >50 mm show a bimodal dynamics in vegetation dynamics, while pixels with drier conditions show a higher importance of annual oscillations. This could be associated with the distribution of different land cover types, i.e., broadleaf evergreen trees and rainfed croplands, based on the rainfall patterns. When assessing the maximum values of annual temperature, biotic units in the lowlands are very confined in the space gradients. Andean biotic units are the ones showing higher levels of variability such as in the Patia region (Supplementary Figure S4). It is important to highlight that in Colombia, the largest temperature variability is mostly found on a diurnal basis than along the year (Hastenrath, 1991).
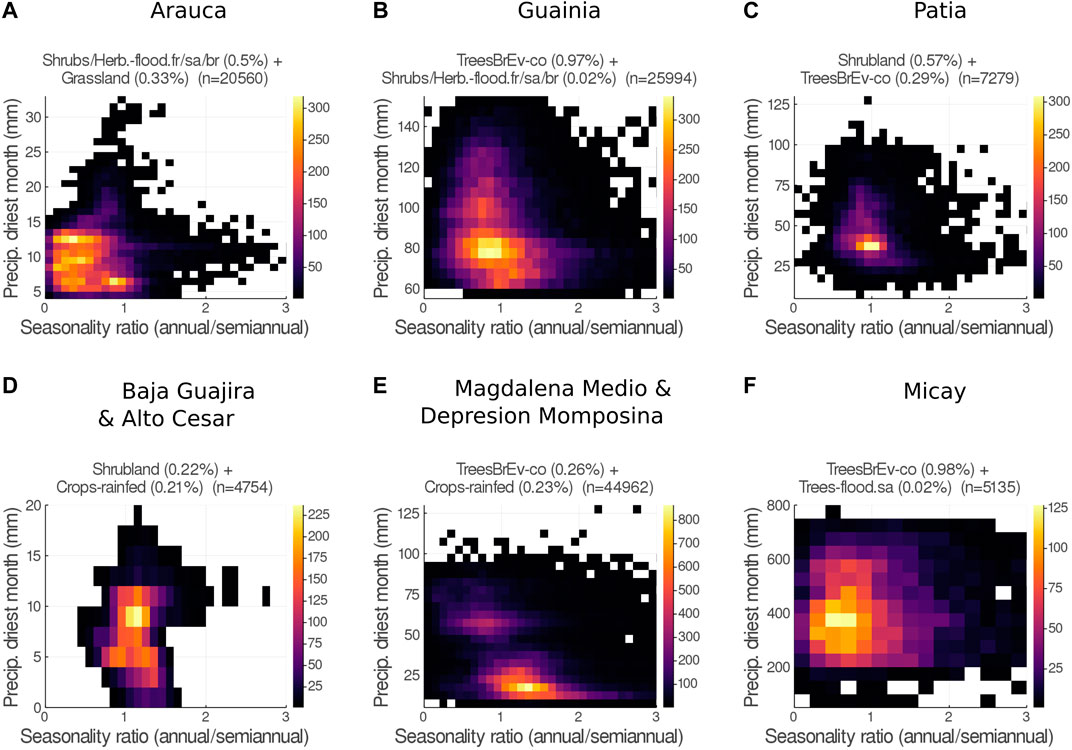
FIGURE 8. Seasonality ratio of annual and semiannual oscillation (x-axis) and precipitation of the driest month (y-axis) in six biotic units (A–F). Dominant land cover type percentage from ESA 2014 are on each subplot, and follow the next abbreviations. Crops-rainfed: Cropland, rainfed. Grass: Grassland. Shrubs: Shrubland. Shrubs/Herb.-flood.fr/sa/br: Shrub or herbaceous cover, flooded, fresh/saline/brakish water. TreeBrEv-co: Tree cover, broadleaved, evergreen, closed to open (>15%). Trees-flood. sa: Tree cover, flooded, saline water. Note that the y-axis range varies from 0 to 30 to 800 mm, and the color scheme range differs between plots. “n” is the total number of pixels in each biotic unit.
Due to the orographic conditions of our study area, clouds are a major limitation for passive sensors, however recording these conditions is also informative in an ecological context. Biotic units with a strong dry season are the ones with lower values of annual cloud frequency. Nevertheless, they either show a centralized pattern as Baja Guajira or a large spectrum as Magdalena Medio, similar to the one observed in Patia (Supplementary Figure S5). Micay exposes high cloud cover as it is expected due to its location in the biogeographic Choco region, one of the wettest places on Earth (Poveda and Mesa, 2000; Yepes et al., 2019).
As we have shown in this case study, the seasonal land-surface dynamics in northern South America is surprisingly complex and not trivially explainable by climatic factors alone. Our results are a step forward to reveal interactions between biotic and abiotic components in tropical ecosystems. From a technical perspective, we show that multi-dimensional analysis in any dimension i.e., along physical variables, time, and space, can be performed very efficiently with a few lines of code. The code (available at http://doi.org/10.5281/zenodo.5068004) can be applied to any other data cube, e.g., the ones that are now emerging from the Coupled Model Intercomparison Project Phase 6 (CMIP6) archive and used to understand if patterns as reported here, are similarly identifiable in such global simulations. If they were not, this would suggest that one of the most basic processes of land-surface dynamics in state-of-the-art models is not well represented yet.
3.4 Computational Performance of the Regional Earth System Data Lab
During the multivariate vegetation analysis, we used a set of four variables (i.e., GPP, NDVI, EVI, FPAR) available as ARDCs at the RegESDL with a total size of 111.24 GB. The estimated time processing for the main steps was: 27 min for the time series standardization, 2.5 min for PCA and 2.8 min for computing the Fast Fourier spectrum. All these computations were carried out at the pixel level using the RegESDL for time series analysis. Overall, these estimates are broad because timing for data loading and processing are hardly discernible, furthermore speed is also affected by other features as parallel processing in other cores. Nevertheless, these timing values bring a general picture of the computational performance. A comparison between the spatial and temporal RegESDL computational performance, for time series analysis, is in the supplementary (Supplementary Table S6) and the code is available at http://doi.org/10.5281/zenodo.5068004.
4 Discussion
Open data and open source software can be seen as the major triggers for recent advances in environmental and Earth system sciences. A remarkable example are the achievements after the Landsat archive was opened for ecosystem monitoring, assessment of climate impacts, among others (Wulder et al., 2016). Moreover, data streams are continuously improved; spatio-temporal and radiometric resolutions increased with the development of new satellites and sensors (e.g., the Sentinel constellation). This increasing data availability also raises enormous challenges for data management and ways to interact with them. Data cubes have been a common solution for tackling this problem bridging the code to the data, and therefore simplifying data storage and processing (Lewis et al., 2017; Giuliani et al., 2019; Gomes et al., 2020; Tamiminia et al., 2020; Yao et al., 2020). Nevertheless, most initiatives prioritize spatial grids for data storing (Gorelick et al., 2017; ODC, 2021), and work with specific data sets such as climate or satellite products exclusively. In comparison, our approach considers that all data dimensions are equally important whether they are space, time, variables, or frequency. This has two main advantages: i) Facilitate access to other axes different from latitude and longitude. ii) Implement the cube structure to outputs as is for inputs. With the ESDL package new-axes can be easily added to cubes during processing. Users have full functionality for defining new-axes of a “hypercube”, assign their name and type class. In addition, the RegESDL links data across disciplines offering a multidimensional perspective for environmental sciences. Thus, we are capable of analyzing multiple data sources efficiently at spatial and temporal dimensions which is key for tropical regions facing rapid transformation.
4.1 Perspectives of the Regional Earth System Data Lab
The RegESDL started as an initiative for supporting analysis that integrate Earth science and biodiversity within a tropical geographical range. The main objectives were to get a dynamic perspective of environmental conditions for biodiversity, to contribute to the understanding of ecosystems functioning and to explore atmosphere-biosphere interactions. Until now, studies have focused mostly on evaluating land cover and ecosystems structure for the region. This has been pivotal for the assessment of deforestation and in some extent forest degradation (Armenteras et al., 2016; Pacheco-Pascagaza et al., 2018; Ramírez-Delgado et al., 2018; Meyer et al., 2019; Anaya et al., 2020). As well, different passive and active sensors have been used for ecosystems delineation (Estupinan-Suarez et al., 2015; Flórez et al., 2016), estimation of vegetation biomass and extraction of canopy features from individual trees and forest using Lidar (Asner et al., 2012; Li et al., 2012; Ferraz et al., 2016; Jeronimo et al., 2018; Ferraz et al., 2020). However, fewer studies are carried out for investigating ecosystem function even though global products such as GPP are available from several sources i.e., GPP estimates derived from satellite retrievals (Running et al., 2004), coupled to process-based models (Ryu et al., 2011; Jiang and Ryu, 2016), and data driven methods (Jung et al., 2011, 2020). This can be partially related to the large uncertainties regarding tropical ecosystems due to atmospheric conditions and limited ground data for models calibration and validation. But also to the early state of Earth science development in the region.
The growing availability of new retrievals from upcoming satellite missions and advanced mathematical methods offer new information and alleviate some gaps regarding data accuracy and quality. Promising variables such as SIF open a possibility to improve estimates of GPP and phenological changes (Porcar-Castell et al., 2014; Walther et al., 2016; Sun et al., 2017; Merrick et al., 2019). Recently launched and upcoming satellites missions will deliver hyperspectral and lidar data globally that will facilitate structure and functional biodiversity assessment. Satellite missions such as the DLR Earth Sensing Imaging Spectrometer, the Global Ecosystem Dynamics Investigation (GEDI) or the Surface Biology program will provide key information for evaluating vegetation stress, vegetation traits, and improving carbon and water fluxes estimation. Thus, tools and long-term projects are needed to warrant timely and efficient access to these new data streams. In this sense, the ESDL software offers a suitable framework to address the technical developments required by the unprecedented volume of coming datasets, and most importantly for integrating different suites across research disciplines. Recently, Cremer et al. (2020) implemented the ESDL for higher resolution analysis, specifically for assessing Sentinel-1.
In fact, the RegESDL is an example of a regional effort for offering a common ground to assess Earth system science, ecosystem function, and explore links to biodiversity that could be realized in practice. Specifically during our showcase we presented different modes of seasonality in the region. Studies of bimodal precipitation regimes have been carried out globally (Knoben et al., 2019) and regionally in East and Central Africa, and northern South America (Poveda et al., 2006; Hawinkel et al., 2015). Nevertheless, such patterns are poorly explored at the ecosystem level. In East and Central Africa double peaks of vegetation greenness were observed by Hawinkel et al. (2015) at annual scales. Recently, Turner et al. (2020) reported bimodality in vegetation activity for savannas in California based on SIF measurements that were previously jeopardized when using vegetation indices. Our outcomes revealed that these double peaks on vegetation activity are also occurring in regions of northern South America. But further analysis are needed to understand the mechanistic process of bimodality in the region. For example, it is expected to observe different timing for leaf flushing in savannas. Hypothetically, this might be driven by water pulses and different vegetation strata. Otherwise, studies using passive sensors are limited in some regions despite of having more than 10 years data. In this context, data integration from upcoming missions with higher spatial and multispectral resolution and active sensors is key. Moreover, the biotic units analysis showed that the dominance and intensity of seasonality in the tropics is very heterogeneous, and it requires deeper analysis on the drivers that are not covered in this paper.
Future studies in the RegESLD aim to exploit time series analysis to evaluate tropical ecosystems dynamics at different time scales. Also, a next step to increase our understanding of how biodiversity is related to ecosystem function is to integrate species distribution data, from platforms such as the Global Biodiversity Facility (GBIF), with data from the RegESDL. This will allow the scientific community to understand how the spatial distribution of specific taxa (not necessarily plants) could respond not only to abiotic variables but also to dynamics of the land surface. Moreover, this can be a benchmark to predict patterns of species migrations by global warming.
4.2 Comparison with Alternative Regional Projects
Colombia has done a major effort to develop strategies for big data generation and management. The National Institute of Environmental Studies and Meteorology has released the latest Climate Forecast System Reanalysis models for the region from hourly to daily temporal resolution, as well as national climate change scenarios and analyses of extreme events thresholds (Ruiz M.et al., 2020) (http://bart.ideam.gov.co/wrfideam/). Another example is the development of the Colombian ODC (Ariza-Porras et al., 2017; Bravo et al., 2017) to reduce redundancy in satellite imagery acquisition, pre-processing and storage. Simultaneously, the scientific community is taking advantage of GEE to assess rapid socio ecological challenges such as deforestation using satellite imagery or products derived from passive (Clerici et al., 2020) and active sensors (Anaya et al., 2020). From the biodiversity perspective, Colombia is contributing significantly in an international context; it is the only country with a National BON in the tropics, its biodiversity information system (SIB Colombia, https://sibcolombia.net/) contributes to the GBIF, and since 2017 different projects are supporting the assessment and implementation of EBVs; specifically for improving species distribution model platforms (Velásquez-Tibatá et al., 2019), supporting biodiversity decision making (http://biotablero.humboldt.org.co/, http://www.bosproject.org/en/), and participates in the calibration of new satellites missions such as GEDI in tropical dry, moist and rain forest (Fagua et al., 2019), TRMM and the Global Precipitation Measurement (Vallejo-Bernal et al., 2020). All of these efforts point to an urgent necessity for developing a common framework that improves data access and management and facilitates ecosystem assessments with a more dynamic and functional perspective, but also for evaluating the rapid natural and anthropogenic changes that are occurring. The RegESDL aimed to bring the initial foundations for these developments, integrating data from biospheric, and atmospheric variables with biodiversity.
4.3 Technical Challenges for the Future
One of the major challenges of all data cube facilities is that data is constantly being updated. Not adopting a “living data paradigm” is one of the major obstacles that reduces the user-update of project-based infrastructures. Also in our case, no matter how convincing the concept and implementation might be, it will not persist as a stand-alone implementation next to a machinery that can update the underlying data archives in near-real time. This is why we hope that the analytic framework as it was developed here can soon be coupled to data cube facilities that solve the underlying data availability issue. In fact, in Europe, for instance, the Data and Information Access Services initiatives are about to realize such an approach such that initiatives like the RegESDL can be placed on top of them. The difficulty today remains that the cube type of data access along all dimensions remains often not well addressed and that the idea is rarely to give the full spectrum of functionalities to the users as ESDL does. This is to enable users to map arbitrary functions. Otherwise, initiatives centered on specific satellites products have opted for automated ingestion based on rapid data acquisition from platforms as GEE (Giuliani et al., 2017). However, this alternative is hard to extrapolate when working with multiple data sources.
We believe that in the future, the ESDL software should not merely be a facility that hosts predefined ARDCs but become a service to generate them tailored to individual user needs. These user-defined cubes should be able to ingest arbitrary gridded and non-gridded data. Particularly, higher resolution datasets are requested when moving from regional to local studies or for in-situ data up scaling. Here, accessing high-resolution and latest global data products e.g., SIF from various sources on demand and in tandem with other existing data suites is key. In this sense, ARDCs may be static and pre-processed, transient, automatically updated, or lazy, whatever suits best its intended usage. This means that the ESDL needs to serve data streams from multiple sources, and therefore handle multi-resolution data within the same framework.
Only if we can convince the major infrastructure providers of our concept, we soon will address the most pressing data analytic bottlenecks that remain open: That is, the need to further generalize spatio-temporal data analytics. The current methods implemented in the ESDL are highly efficient in exploiting high-dimensional time series and maps, but lack one fundamental requirement: Spatio-temporal interactions and spatio-temporal contextualized data analytics are essentially not possible and limit our capacity to study e.g., telecouplings at large scales or lateral transport processes. This is of particular relevance, when aiming to simulate e.g., water transport in space and time via e.g., surface hydrology or atmospheric interactions. Another challenge for the future is certainly brining in latest advances in machine learning i.e., Deep Learning (DL), as one of the most relevant and rapidly developing fields. In principle this is possible already today, but whenever a DL model requires dealing with e.g., structured data (either spatial, temporal or spatio-temporal as in the Earth sciences), the cube-slicing approach is suboptimal and needs to be redesigned to efficiently map DL methods on the cube. This is particularly promising for understanding e.g., biotic dynamics in the tropics that are often not well constrained by our ecohydrological understanding.
Another major challenge is Interoperability. The exponential data generation and advancements in computer and software technology reinforced the urgency of data exchange between research infrastructure systems. This has to be accompanied by common metadata conventions, open algorithms and software documentation (Kissling et al., 2015; Wilkinson et al., 2016; Hardisty et al., 2019). For Earth observation data cubes, Giuliani et al. (2019) defined two tiers to approach this issue: an upstream tier which is the ODC infrastructure, and a downstream tier which is centered on the user’s interaction. Here, we focused on data ingestion from several data sources which was crucial for multivariate analysis. With this approach we achieved to integrate different environmental layers from the biosphere and atmosphere. The usage of Zarr format for data storage, that is in the process of becoming the standard for the Open Geospatial Consortium (OGC, 2020), facilitates exchange with other geo initiatives such as the CMIP6 model. As well, the implementation of downstream software as xarray opens the possibility to develop backends with existing data cubes. We followed the Climate and Forecast metadata conventions (http://cfconventions.org/) that supports properties of the data. What is still remaining is the possibility of working with multi-resolution data, which is one of the following steps. These characteristics are favorable to Interoperability, but this is indeed a topic on constant development by the community.
4.4 Engaging the User Community
A long-term sustainability of the RegESDL requires an active users community. On one hand, the ESDL software is open, documented and its main features, i.e., the cube generation and analytical tools, can operate independently which brings versatility for forward software development and applications. On the other hand, consolidating such a community requires active dissemination and training to operate the RegESDL efficiently, besides constant technical support. Having a consolidated community is a key step for warranting the establishment and development of our tool. We see as potential users research groups and universities that are interested in the spatio-temporal understanding of the biosphere-atmosphere interactions, implications of climate variability, land cover change, and biodiversity loss in tropical ecosystems.
Moreover, embracing big data initiatives, such ours, is also beneficial for supporting environmental studies that support environmental policy. For example, the Colombian government has appointed a roadmap for a strong bioeconomy development to the International Mission of Experts in Science, Technology and Innovation (https://minciencias.gov.co/mision-sabios/documentos), but there are many unknowns about ecosystems dynamics and functioning nation wise that need to be solved for creating such a plan. Studies bringing new insights for informing the sustainable goals, or the Intergovernmental Panel on Climate Change as well as research for understanding ecosystems functioning and ecosystem resilience under climate change scenarios could be efficiently carried out in the RegESDL. In this sense, our initiative could contribute to existing platforms that provide scientific input for decision making at local level.
5 Conclusion
To our knowledge the ESDL is the first data cube implementation with an emphasis on representing interactions across the water cycle, carbon cycle, and climate system (Mahecha et al., 2020). It has been successfully used to understand biosphere-atmosphere interactions at multiple time-scales (Linscheid et al., 2020), analyzing specific variables of ecosystems to climate extremes (Flach et al., 2020), and has enabled studying the multivariate nature of land-surface dynamics globally (Kraemer et al., 2020). The RegESDL has been developed to more specifically explore biodiversity as yet another thematic domain. Our goal was bridging the gap between Earth science and biological diversity that includes ecosystems composition, structure and function (Noss, 1990; Randin et al., 2020).
In this regard, the satellite era has brought us the possibility of gaining ecosystems dynamics understanding from systematic measurements over time and at larger spatial scales. Advances in the EBVs (Pereira et al., 2013), functional traits and functional ecosystem properties (Reichstein et al., 2014; Musavi et al., 2015) are supporting this development. And it is increasingly recognized that one has to consider the functional dimension of biodiversity in its own right, which requires working with high temporal resolutions. In particular, remote sensing observations are of uttermost importance for the analysis of the EBVs (Skidmore et al., 2015; Pettorelli et al., 2016; Giuliani et al., 2020; Randin et al., 2020). Recently, the EBVs for Species Population started to develop a framework for working with space-time-species cubes and proposed it as a suitable model for the oncoming challenges of big data (Jetz et al., 2019) (European BON http://biodiversity.eubon.eu/essential-biodiversity-variables). As well, Randin et al. (2020) provided a detailed review of possible synergies between remote sensing products and biophysical process variables that are key for species distribution models. Furthermore, Hardisty et al. (2019) developed a framework for Interoperability between research infrastructures related to EBVs. Hence, the successful implementation of the RegESDL for studying ecosystem dynamics in northern South America can be seen as a step forward on the development of EBVs related to function and structure in tropical ecosystems.
Specifically on our case study, we show the variety of seasonal trajectories in northern South America. We computed simple metrics to compare semiannual and annual regimes, derived from vegetation variables of productivity, greenness and standing vegetation available at the RegESDL. Nevertheless, our seasonality analysis approach relies on passive sensors which are limited in rainy regions despite of having long time series. This reinforced the necessity of synergies between multiple sensors and data sources. Using the biotic units map of Colombia, we observed heterogeneity on the seasonality modes and the timing of maximum activity among units that are characterized by Beta diversity values. Our findings contribute to elucidate the large seasonal variability in hotspots of biodiversity which is key for differentiated management of tropical ecosystems. Complementary analysis in light of local climate variability needs to be further investigated to identify the main drivers.
Data Availability Statement
The RegESDL can be accessed using Julia or Python. The dataset is available for free download using Python. Complementary, data can also be accessed locally using Julia. In this case, only data used in the analysis is loaded. Explanatory scripts of how to access the RegESDL, and how to reproduce the main analysis and figures are available in the supplementary and at http://doi.org/10.5281/zenodo.5068004. Supplementary Table S7 lists all the scripts and their location. The most up-to-date code can be found at https://github.com/linamaes/Regional_ESDL.
Author Contributions
LE-S performed all analyses. The study was designed by LE-S and MM. LE-S and MM wrote the paper with substantial input from all other authors. FG, UW, and LE-S acquired and pre-processed the data. FG and LE-S worked in the RegESDL cube generation.
Funding
This research has been supported by the European Space Agency via the Earth System Data Lab Project https://www.earthsystemdatalab.net/. LE-S was funded by the German Academic Exchange Service (DAAD) 57395813 grant. DP-M was funded by the European Union’s Horizon 2020 research and innovation program via the TRuStEE project under the Marie Sklłodowska-Curie grant agreement no. 721995T. The article processing charges for this open-access publication were covered by the Max Planck Society.
Conflict of Interest
The authors declare that the research was conducted in the absence of any commercial or financial relationships that could be construed as a potential conflict of interest.
Acknowledgments
The authors thank the European Space Agency for funding the Earth System Data Lab project. All authors thank PEACE 2016 meeting participants where the project initiative started. The authors thank the reviewers for their insightful comments that contributed to the improvement of this manuscript. LE-S acknowledges the support of DAAD and its Graduate School Scholarship Program, as well as the International Max Planck Research School for Global Biogeochemical Cycles. The Colombian BON and the Alexander von Humboldt Institute for Biological Research were key institutions for starting the project as part of the subvention USAID AID-OAA-A-11-00012.
Supplementary Material
The Supplementary Material for this article can be found online at: https://www.frontiersin.org/articles/10.3389/feart.2021.613395/full#supplementary-material.
References
Ahlström, A., Raupach, M. R., Schurgers, G., Smith, B., Arneth, A., Jung, M., et al. (2015). The Dominant Role of Semi-arid Ecosystems in the Trend and Variability of the Land CO2 Sink. Science 348, 895–899. doi:10.1126/science.aaa1668
Álvarez-Villa, O. D., Vélez, J. I., and Poveda, G. (2011). Improved Long-Term Mean Annual Rainfall fields for Colombia. Int. J. Climatol. 31, 2194–2212. doi:10.1002/joc.2232
Anaya, J. A., Gutiérrez-Vélez, V. H., Pacheco-Pascagaza, A. M., Palomino-Ángel, S., Han, N., and Balzter, H. (2020). Drivers of Forest Loss in a Megadiverse Hotspot on the Pacific Coast of Colombia. Remote Sensing 12, 1235. doi:10.3390/rs12081235
Andrade, M. G. (2011). Estado del conocimiento de la biodiversidad en Colombia y sus amenazas. Consideraciones para fortalecer la interacción ciencia-política. Revista de la Academia Colombiana de Ciencias Exactas, Físicas y Naturales 35, 491–508.
Ariza-Porras, C., Bravo, G., Villamizar, M., Moreno, A., Castro, H., Galindo, G., Cabera, E., Valbuena, S., and Lozano, P. (2017). “CDCol: A Geoscience Data Cube that Meets Colombian Needs,” in Colombian Conference on Computing, September 19–22, 2017 Cali, Colombia: Springer, 87–99. doi:10.1007/978-3-319-66562-7_7
Armenteras, D., González, T. M., Retana, J., and Espelta, J. M. (2016). Degradación de bosques en Latinoamérica: síntesis conceptual, metodologías de evaluación y casos de estudio nacionales. IBERO-REDD+.
Armenteras, D., Negret, P., Melgarejo, L. F., Lakes, T. M., Londoño, M. C., García, J., et al. (2019a). Curb Land Grabbing to Save the Amazon. Nat. Ecol. Evol. 3, 1497. doi:10.1038/s41559-019-1020-1
Armenteras, D., Schneider, L., and Dávalos, L. M. (2019b). Fires in Protected Areas Reveal Unforeseen Costs of Colombian Peace. Nat. Ecol. Evol. 3, 20–23. doi:10.1038/s41559-018-0727-8
Asmaryan, S., Muradyan, V., Tepanosyan, G., Hovsepyan, A., Saghatelyan, A., Astsatryan, H., et al. (2019). Paving the Way towards an Armenian Data Cube. Data 4, 117. doi:10.3390/data4030117
Asner, G. P., Martin, R. E., Anderson, C. B., and Knapp, D. E. (2015). Quantifying forest Canopy Traits: Imaging Spectroscopy versus Field Survey. Remote Sensing Environ. 158, 15–27. doi:10.1016/j.rse.2014.11.011
Asner, G. P., Mascaro, J., Muller-Landau, H. C., Vieilledent, G., Vaudry, R., Rasamoelina, M., et al. (2012). A Universal Airborne LiDAR Approach for Tropical forest Carbon Mapping. Oecologia 168, 1147–1160. doi:10.1007/s00442-011-2165-z
Baptiste, B., Pinedo-Vasquez, M., Gutierrez-Velez, V. H., Andrade, G. I., Vieira, P., Estupiñán-Suárez, L. M., et al. (2017). Greening Peace in Colombia. Nat. Ecol. Evol. 1, 1–3. doi:10.1038/s41559-017-0102
Bathiany, S., Dakos, V., Scheffer, M., and Lenton, T. M. (2018). Climate Models Predict Increasing Temperature Variability in Poor Countries. Sci. Adv. 4, eaar5809. doi:10.1126/sciadv.aar5809
Beck, H. E., van Dijk, A. I. J. M., De Roo, A., Miralles, D. G., McVicar, T. R., Schellekens, J., et al. (2016). Global-scale Regionalization of Hydrologic Model Parameters. Water Resour. Res. 52, 3599–3622. doi:10.1002/2015wr018247
Bedoya-Soto, J. M., Aristizábal, E., Carmona, A. M., and Poveda, G. (2019). Seasonal Shift of the Diurnal Cycle of Rainfall over Medellin's Valley, Central Andes of Colombia (1998-2005). Front. Earth Sci. 7, 92. doi:10.3389/feart.2019.00092
Bianchi, C. A., and Haig, S. M. (2013). Deforestation Trends of Tropical Dry Forests in central Brazil. Biotropica 45, 395–400. doi:10.1111/btp.12010
Bloom, A. A., Bowman, K. W., Lee, M., Turner, A. J., Schroeder, R., Worden, J. R., et al. (2017). A Global Wetland Methane Emissions and Uncertainty Dataset for Atmospheric Chemical Transport Models (WetCHARTs Version 1.0). Geoscientific Model. Dev. 10, 2141–2156. doi:10.5194/gmd-10-2141-2017
Boulton, G. (2018). The Challenges of a Big Data Earth. Big Earth Data 2, 1–7. doi:10.1080/20964471.2017.1397411
Bravo, G., Castro, H., Moreno, A., Ariza-Porras, C., Galindo, G., Cabrera, E., Valbuena, S., and Lozano-Rivera, P. (2017). “Architecture for a Colombian Data Cube Using Satellite Imagery for Environmental Applications,” in Colombian Conference on Computing, September 19–22, 2017 Cali, Colombia: Springer, 227–241. doi:10.1007/978-3-319-66562-7_17
Builes-Jaramillo, A., Marwan, N., Poveda, G., and Kurths, J. (2018). Nonlinear Interactions between the Amazon River basin and the Tropical North Atlantic at Interannual Timescales. Clim. Dyn. 50, 2951–2969. doi:10.1007/s00382-017-3785-8
Chambers, J. Q., Higuchi, N., Tribuzy, E. S., and Trumbore, S. E. (2001). Carbon Sink for a century. Nature 410, 429. doi:10.1038/35068624
Ciabatta, L., Massari, C., Brocca, L., Gruber, A., Reimer, C., Hahn, S., et al. (2018). SM2RAIN-CCI: a New Global Long-Term Rainfall Data Set Derived from ESA CCI Soil Moisture. Earth Syst. Sci. Data 10, 267–280. doi:10.5194/essd-10-267-2018
Clerici, N., Armenteras, D., Kareiva, P., Botero, R., Ramírez-Delgado, J. P., Forero-Medina, G., et al. (2020). Deforestation in Colombian Protected Areas Increased during post-conflict Periods. Sci. Rep. 10, 4971–5010. doi:10.1038/s41598-020-61861-y
Correa Ayram, C. A., Etter, A., Díaz-Timoté, J., Rodríguez Buriticá, S., Ramírez, W., and Corzo, G. (2020). Spatiotemporal Evaluation of the Human Footprint in Colombia: Four Decades of Anthropic Impact in Highly Biodiverse Ecosystems. Ecol. Indicators 117, 106630. doi:10.1016/j.ecolind.2020.106630
Cremer, F., Urbazaev, M., Cortés, J., Truckenbrodt, J., Schmullius, C., and Thiel, C. (2020). Potential of Recurrence Metrics from Sentinel-1 Time Series for Deforestation Mapping. IEEE J. Sel. Top. Appl. Earth Observations Remote Sensing 13, 5233–5240. doi:10.1109/jstars.2020.3019333
Dávalos, L. M., Bejarano, A. C., Hall, M. A., Correa, H. L., Corthals, A., and Espejo, O. J. (2011). Forests and Drugs: Coca-Driven Deforestation in Tropical Biodiversity Hotspots. Environ. Sci. Tech. 45, 1219–1227.
Dorigo, W. A., Wagner, W., Hohensinn, R., Hahn, S., Paulik, C., Xaver, A., et al. (2011). The International Soil Moisture Network: a Data Hosting Facility for Global In Situ Soil Moisture Measurements. Hydrol. Earth Syst. Sci. , 15, 1675, 1698. doi:10.5194/hess-15-1675-2011
Dorigo, W., Wagner, W., Albergel, C., Albrecht, F., Balsamo, G., Brocca, L., et al. (2017). ESA CCI Soil Moisture for Improved Earth System Understanding: State-Of-The Art and Future Directions. Remote Sensing Environ. 203, 185–215. doi:10.1016/j.rse.2017.07.001
ESA (2017). Land Cover CCI Product User Guide Version 2. Available at: maps.elie.ucl.ac.be/CCI/viewer/download/ESACCI-LC-Ph2-PUGv2_2.0.pdf
Espinoza, J. C., Garreaud, R., Poveda, G., Arias, P. A., Molina-Carpio, J., Masiokas, M., et al. (2020). Hydroclimate of the Andes Part I: Main Climatic Features. Front. Earth Sci. 8, 64. doi:10.3389/feart.2020.00064
Estupinan-Suarez, L. M., Florez-Ayala, C., Quinones, M. J., Pacheco, A. M., and Santos, A. C. (2015). Detection and Characterizacion of Colombian Wetlands Using Alos Palsar and MODIS Imagery. Int. Arch. Photogramm. Remote Sens. Spat. Inf. Sci. XL-7/W3, 375–382. doi:10.5194/isprsarchives-xl-7-w3-375-2015
Etter, A., McAlpine, C., and Possingham, H. (2008). Historical Patterns and Drivers of Landscape Change in Colombia since 1500: a Regionalized Spatial Approach. Ann. Assoc. Am. Geogr. 98, 2–23. doi:10.1080/00045600701733911
Fagua, J. C., Jantz, P., Rodriguez-Buritica, S., Duncanson, L., and Goetz, S. J. (2019). Integrating LiDAR, Multispectral and SAR Data to Estimate and Map Canopy Height in Tropical Forests. Remote Sensing 11, 2697. doi:10.3390/rs11222697
FAO, I., and ISRIC, I. (2012). JRC: Harmonized World Soil Database (Version 1.2). Rome, Italy and IIASALaxenburg, Austria: FAO.
Ferraz, A., Saatchi, S. S., Longo, M., and Clark, D. B. (2020). Tropical Tree Size-Frequency Distributions from Airborne Lidar. Ecol. Appl. 30, e02154. doi:10.1002/eap.2154
Ferraz, A., Saatchi, S., Mallet, C., Jacquemoud, S., Gonçalves, G., Silva, C., et al. (2016). Airborne Lidar Estimation of Aboveground forest Biomass in the Absence of Field Inventory. Remote Sensing 8, 653. doi:10.3390/rs8080653
Fick, S. E., and Hijmans, R. J. (2017). WorldClim 2: New 1‐km Spatial Resolution Climate Surfaces for Global Land Areas. Int. J. Climatol 37, 4302–4315. doi:10.1002/joc.5086
Flach, M., Brenning, A., Gans, F., Reichstein, M., Sippel, S., and Mahecha, M. D. (2020). Vegetation Modulates the Impact of Climate Extremes on Gross Primary Production. Biogeosciences Discuss. 18, 39–53. doi:10.5194/bg-18-39-2021
Flórez, C., Estupiñán-Suárez, L., Rojas, S., Aponte, C., Quiñones, M., Acevedo, O., et al. (2016). Identificación espacial de los sistemas de humedales continentales de Colombia. Biota Colombiana 17, 44–62. doi:10.21068/c2016s01a03
Funk, C., Peterson, P., Landsfeld, M., Pedreros, D., Verdin, J., Shukla, S., et al. (2015). The Climate Hazards Infrared Precipitation with Stations—A New Environmental Record for Monitoring Extremes. Scientific Data 2, 1–21. doi:10.1038/sdata.2015.66
GDAL/OGR Contributors (2020). Geospatial Data Abstraction Software Library. Open Source Geospatial Foundation.
Gentine, P., Pritchard, M., Rasp, S., Reinaudi, G., and Yacalis, G. (2018). Could Machine Learning Break the Convection Parameterization Deadlock?. Geophys. Res. Lett. 45, 5742–5751. doi:10.1029/2018gl078202
Giraldo, J. A., del Valle, J. I., Sierra, C. A., and Melo, O. (2020). Dendrochronological Potential of Trees from America’s Rainiest Region BT - Latin American Dendroecology: Combining Tree-Ring Sciences and Ecology in a Megadiverse Territory. In Latin American Dendroecology, eds. M. Pompa-García, and J. J. Camarero (Cham: Springer International Publishing), Chapter 5. 79–119. doi:10.1007/978-3-030-36930-9˙5
Giuliani, G., Camara, G., Killough, B., and Minchin, S. (2019). Earth Observation Open Science: Enhancing Reproducible Science Using Data Cubes. Data 4, 147. doi:10.3390/data4040147
Giuliani, G., Chatenoux, B., De Bono, A., Rodila, D., Richard, J.-P., Allenbach, K., et al. (2017). Building an Earth Observations Data Cube: Lessons Learned from the Swiss Data Cube (SDC) on Generating Analysis Ready Data (ARD). Big Earth Data 1, 100–117. doi:10.1080/20964471.2017.1398903
Giuliani, G., Egger, E., Italiano, J., Poussin, C., Richard, J.-P., and Chatenoux, B. (2020). Essential Variables for Environmental Monitoring: What Are the Possible Contributions of Earth Observation Data Cubes?. Data 5, 100. doi:10.3390/data5040100
Gomes, V., Queiroz, G., and Ferreira, K. (2020). An Overview of Platforms for Big Earth Observation Data Management and Analysis. Remote Sensing 12, 1253. doi:10.3390/rs12081253
Gorelick, N., Hancher, M., Dixon, M., Ilyushchenko, S., Thau, D., and Moore, R. (2017). Google Earth Engine: Planetary-Scale Geospatial Analysis for Everyone. Remote Sensing Environ. 202, 18–27. doi:10.1016/j.rse.2017.06.031
Green, J. K., Konings, A. G., Alemohammad, S. H., Berry, J., Entekhabi, D., Kolassa, J., et al. (2017). Regionally strong Feedbacks between the Atmosphere and Terrestrial Biosphere. Nat. Geosci 10, 410–414. doi:10.1038/ngeo2957
Guo, H. (2017). Big Earth Data: A New Frontier in Earth and Information Sciences. Big Earth Data 1, 4–20. doi:10.1080/20964471.2017.1403062
Hamunyela, E., Verbesselt, J., De Bruin, S., and Herold, M. (2016). Monitoring Deforestation at Sub-annual Scales as Extreme Events in Landsat Data Cubes. Remote Sensing 8, 651. doi:10.3390/rs8080651
Hansen, M. C., Potapov, P. V., Moore, R., Hancher, M., Turubanova, S. A., Tyukavina, A., et al. (2013). High-resolution Global Maps of 21st-century forest Cover Change. Science 342, 850–853. doi:10.1126/science.1244693
Hardisty, A. R., Michener, W. K., Agosti, D., Alonso García, E., Bastin, L., Belbin, L., et al. (2019). The Bari Manifesto: An Interoperability Framework for Essential Biodiversity Variables. Ecol. Inform. 49, 22–31. doi:10.1016/j.ecoinf.2018.11.003
Hastenrath, S. (1991). Climate Dynamics of the Tropics. (Updated ed., Atmospheric sciences library; v.8). Dordrecht, Boston. Kluwer Academic.
Hawinkel, P., Swinnen, E., Lhermitte, S., Verbist, B., Van Orshoven, J., and Muys, B. (2015). A Time Series Processing Tool to Extract Climate-Driven Interannual Vegetation Dynamics Using Ensemble Empirical Mode Decomposition (EEMD). Remote Sensing Environ. 169, 375–389. doi:10.1016/j.rse.2015.08.024
He, N., Liu, C., Piao, S., Sack, L., Xu, L., Luo, Y., et al. (2019). Ecosystem Traits Linking Functional Traits to Macroecology. Trends Ecol. Evol. 34, 200–210. doi:10.1016/j.tree.2018.11.004
Heckel, K., Urban, M., Schratz, P., Mahecha, M., and Schmullius, C. (2020). Predicting Forest Cover in Distinct Ecosystems: The Potential of Multi-Source Sentinel-1 and -2 Data Fusion. Remote Sensing 12, 302. doi:10.3390/rs12020302
Hengl, T., de Jesus, J. M., MacMillan, R. A., Batjes, N. H., Heuvelink, G. B., Ribeiro, E., et al. (2014). SoilGrids1km--global Soil Information Based on Automated Mapping. PloS one 9, e105992. doi:10.1371/journal.pone.0105992
Hubau, W., Lewis, S. L., Phillips, O. L., Affum-Baffoe, K., Beeckman, H., Cuní-Sanchez, A., et al. (2020). Asynchronous Carbon Sink Saturation in African and Amazonian Tropical Forests. Nature 579, 80–87. doi:10.1038/s41586-020-2035-0
Huete, A., Didan, K., Miura, T., Rodriguez, E. P., Gao, X., and Ferreira, L. G. (2002). Overview of the Radiometric and Biophysical Performance of the MODIS Vegetation Indices. Remote Sensing Environ. 83, 195–213. doi:10.1016/s0034-4257(02)00096-2
Huete, A., Liu, H. Q., Batchily, K. V., and Van Leeuwen, W. (1997). A Comparison of Vegetation Indices over a Global Set of TM Images for EOS-MODIS. Remote Sensing Environ. 59, 440–451. doi:10.1016/s0034-4257(96)00112-5
IGAC (2010). Cartografía vectorial a escala 1:100.000 con cobertura total de la República de Colombia. C. Referido al sistema de coordenadas MAGNA-SIRGAS. Bogotá DC: Instituto Geográfico Agustín Codazzi.
Jeronimo, S. M. A., Kane, V. R., Churchill, D. J., McGaughey, R. J., and Franklin, J. F. (2018). Applying LiDAR Individual Tree Detection to Management of Structurally Diverse forest Landscapes. J. For. 116, 336–346. doi:10.1093/jofore/fvy023
Jetz, W., McGeoch, M. A., Guralnick, R., Ferrier, S., Beck, J., Costello, M. J., et al. (2019). Essential Biodiversity Variables for Mapping and Monitoring Species Populations. Nat. Ecol. Evol. 3, 539–551. doi:10.1038/s41559-019-0826-1
Jiang, C., and Ryu, Y. (2016). Multi-scale Evaluation of Global Gross Primary Productivity and Evapotranspiration Products Derived from Breathing Earth System Simulator (BESS). Remote Sensing Environ. 186, 528–547. doi:10.1016/j.rse.2016.08.030
Joshi, N., Baumann, M., Ehammer, A., Fensholt, R., Grogan, K., Hostert, P., et al. (2016). A Review of the Application of Optical and Radar Remote Sensing Data Fusion to Land Use Mapping and Monitoring. Remote Sensing 8, 70. doi:10.3390/rs8010070
Jung, M., Reichstein, M., Margolis, H. A., Cescatti, A., Richardson, A. D., Arain, M. A., et al. (2011). Global Patterns of Land—Atmosphere Fluxes of Carbon Dioxide, Latent Heat, and Sensible Heat Derived from Eddy Covariance, Satellite, and Meteorological Observations. J. Geophys. Res. Biogeosciences 116. doi:10.1029/2010jg001566
Jung, M., Schwalm, C., Migliavacca, M., Walther, S., Camps-Valls, G., Koirala, S., et al. (2020). Scaling Carbon Fluxes from Eddy Covariance Sites to globe: Synthesis and Evaluation of the FLUXCOM Approach. Biogeosciences 17, 1343–1365. doi:10.5194/bg-17-1343-2020
Killough, B. (2019). “The Impact of Analysis Ready Data in the Africa Regional Data Cube,” in IGARSS 2019-2019 IEEE International Geoscience and Remote Sensing Symposium, Yokohama, Japan, 28 July-2 Aug. 2019 (IEEE), 5646–5649. doi:10.1109/IGARSS.2019.8898321
Kissling, W. D., Hardisty, A., García, E. A., Santamaria, M., De Leo, F., Pesole, G., et al. (2015). Towards Global Interoperability for Supporting Biodiversity Research on Essential Biodiversity Variables (EBVs). Biodiversity 16, 99–107. doi:10.1080/14888386.2015.1068709
Knoben, W. J. M., Woods, R. A., and Freer, J. E. (2019). Global Bimodal Precipitation Seasonality: A Systematic Overview. Int. J. Climatol 39, 558–567. doi:10.1002/joc.5786
Konings, A. G., and Gentine, P. (2017). Global Variations in Ecosystem‐scale Isohydricity. Glob. Change Biol. 23, 891–905. doi:10.1111/gcb.13389
Kraemer, G., Camps-Valls, G., Reichstein, M., and Mahecha, M. D. (2020). Summarizing the State of the Terrestrial Biosphere in Few Dimensions. Biogeosciences 17, 2397–2424. doi:10.5194/bg-17-2397-2020
Leblois, A., Damette, O., and Wolfersberger, J. (2017). What Has Driven Deforestation in Developing Countries since the 2000s? Evidence from New Remote-Sensing Data. World Dev. 92, 82–102. doi:10.1016/j.worlddev.2016.11.012
Lewis, A., Oliver, S., Lymburner, L., Evans, B., Wyborn, L., Mueller, N., et al. (2017). The Australian Geoscience Data Cube - Foundations and Lessons Learned. Remote Sensing Environ. 202, 276–292. doi:10.1016/j.rse.2017.03.015
Li, W., Guo, Q., Jakubowski, M. K., and Kelly, M. (2012). A New Method for Segmenting Individual Trees from the Lidar point Cloud. Photogramm Eng. Remote Sensing 78, 75–84. doi:10.14358/pers.78.1.75
Linscheid, N., Estupinan-Suarez, L. M., Brenning, A., Carvalhais, N., Cremer, F., Gans, F., et al. (2020). Towards a Global Understanding of Vegetation-Climate Dynamics at Multiple Timescales. Biogeosciences 17, 945–962. doi:10.5194/bg-17-945-2020
Londoño, M. C., Bello, C., Velásquez, J., Norden, N., Ortiz, C., Gónzalez, I., et al. (2017). “Documento Técnico: Componente Biótico Mapa de Ecosistemas Continentales, Marinos y Costeros de Colombia,”. Escala 1:100.000. Tech. rep. (Bogota D.C: Instituto de Investigación de Recursos Biológicos Alexander von Humboldt).
Ma, X., Migliavacca, M., Wirth, C., Bohn, F. J., Huth, A., Richter, R., et al. (2020). Monitoring Plant Functional Diversity Using the Reflectance and Echo from Space. Remote Sensing 12, 1248. doi:10.3390/rs12081248
MADR-UPRA, (2017). “Identificación general de la frontera agrícola en Colombia. Ministerio de Agricultura y Desarrollo Rural Agropecuario - Unidad de Planificación Rural Agropecuaria,”. Tech. rep. (Bogota D.C: Ministerio de Agricultura y Desarrollo Rural Agropecuario - Unidad de Planificación Rural).
Mahecha, M. D., Gans, F., Brandt, G., Christiansen, R., Cornell, S. E., Fomferra, N., et al. (2020). Earth System Data Cubes Unravel Global Multivariate Dynamics. Earth Syst. Dynam. 11, 201–234. doi:10.5194/esd-11-201-2020
Mahecha, M. D., Gans, F., Sippel, S., Donges, J. F., Kaminski, T., Metzger, S., et al. (2017). Detecting Impacts of Extreme Events with Ecological In Situ Monitoring Networks. Biogeosciences 14, 4255–4277. doi:10.5194/bg-14-4255-2017
McNicol, I. M., Ryan, C. M., and Mitchard, E. T. A. (2018). Carbon Losses from Deforestation and Widespread Degradation Offset by Extensive Growth in African Woodlands. Nat. Commun. 9, 3045. doi:10.1038/s41467-018-05386-z
Merrick, T., Pau, S., Jorge, M. L. S. P., Bennartz, T. S. F., and Silva, R. (2019). Spatiotemporal Patterns and Phenology of Tropical Vegetation Solar-Induced Chlorophyll Fluorescence across Brazilian Biomes Using Satellite Observations. Remote Sensing 11, 1746. doi:10.3390/rs11151746
Meyer, V., Saatchi, S., Ferraz, A., Xu, L., Duque, A., García, M., et al. (2019). Forest Degradation and Biomass Loss along the Chocó Region of Colombia. Carbon Balance Manage 14, 2. doi:10.1186/s13021-019-0117-9
Miles, L., Newton, A. C., DeFries, R. S., Ravilious, C., May, I., Blyth, S., et al. (2006). A Global Overview of the Conservation Status of Tropical Dry Forests. J. Biogeogr. 33, 491–505. doi:10.1111/j.1365-2699.2005.01424.x
Miralles, D. G., Holmes, T. R. H., De Jeu, R. A. M., Gash, J. H., Meesters, A. G. C. A., and Dolman, A. J. (2011). Global Land-Surface Evaporation Estimated from Satellite-Based Observations. Hydrol. Earth Syst. Sci. 15, 453–469. doi:10.5194/hess-15-453-2011
Musavi, T., Mahecha, M. D., Migliavacca, M., Reichstein, M., van de Weg, M. J., van Bodegom, P. M., et al. (2015). The Imprint of Plants on Ecosystem Functioning: A Data-Driven Approach. Int. J. Appl. Earth Observation Geoinformation 43, 119–131. doi:10.1016/j.jag.2015.05.009
Musavi, T., Migliavacca, M., Reichstein, M., Kattge, J., Wirth, C., Black, T. A., et al. (2017). Stand Age and Species Richness Dampen Interannual Variation of Ecosystem-Level Photosynthetic Capacity. Nat. Ecol. Evol. 1, 48. doi:10.1038/s41559-016-0048
Myers, N., Mittermeier, R. A., Mittermeier, C. G., Da Fonseca, G. A. B., and Kent, J. (2000). Biodiversity Hotspots for Conservation Priorities. Nature 403, 853–858. doi:10.1038/35002501
Nemani, R. R., Keeling, C. D., Hashimoto, H., Jolly, W. M., Piper, S. C., Tucker, C. J., et al. (2003). Climate-driven Increases in Global Terrestrial Net Primary Production from 1982 to 1999. Science 300, 1560–1563. doi:10.1126/science.1082750
Noss, R. F. (1990). Indicators for Monitoring Biodiversity: a Hierarchical Approach. Conservation Biol. 4, 355–364. doi:10.1111/j.1523-1739.1990.tb00309.x
Olaya-Rodríguez, M. H., Velásquez-Tibatá, J., and Estupiñán-Suárez, L. M. (2018). Integrando la información de sensores remotos con modelos de distribución de especies para el monitoreo de la biodiversidad. Caso de estudio para las especies Zamia amazonum y Zamia chigua. Biodiversidad en la Práctica 3, 74–98.
Orme, C. D. L., Davies, R. G., Burgess, M., Eigenbrod, F., Pickup, N., Olson, V. A., et al. (2005). Global Hotspots of Species Richness Are Not Congruent with Endemism or Threat. Nature 436, 1016–1019. doi:10.1038/nature03850
OGC (2020). Considering Zarr as Community Standard; seeks Public Comment on New Work Item. The Open Geospatial Consortium. https://www.ogc.org/pressroom/pressreleases/3275. (Accessed August 21, 2020).
Pacheco-Pascagaza, A. M., Garcia, M., Rodríguez-Veiga, P., and Balzter, H. (2018). “The Use of Multifrequency SAR Data for Assessing Levels of Forest Disturbance in Bajo Calima Colombia,” in IGARSS 2018-2018 IEEE International Geoscience and Remote Sensing Symposium, Valencia, Spain, 22-27 July 2018 (IEEE), 7015–7018. doi:10.1109/IGARSS.2018.8518871
Pan, Y., Birdsey, R. A., Fang, J., Houghton, R., Kauppi, P. E., Kurz, W. A., et al. (2011). A Large and Persistent Carbon Sink in the World's Forests. Science 333, 988–993. doi:10.1126/science.1201609
Papagiannopoulou, C., Miralles, D. G., Decubber, S., Demuzere, M., Verhoest, N. E. C., Dorigo, W. A., et al. (2017). A Non-linear Granger-causality Framework to Investigate Climate-Vegetation Dynamics. Geosci. Model. Dev. 10, 1945–1960. doi:10.5194/gmd-10-1945-2017
Patino, J. E., and Estupinan-Suarez, L. M. (2016). Hotspots of Wetland Area Loss in Colombia. Wetlands 36, 935–943. doi:10.1007/s13157-016-0806-z
Pereira, H. M., Ferrier, S., Walters, M., Geller, G. N., Jongman, R. H. G., Scholes, R. J., et al. (2013). Essential Biodiversity Variables. Science 339, 277–278. doi:10.1126/science.1229931
Pettorelli, N., Wegmann, M., Skidmore, A., Mücher, S., Dawson, T. P., Fernandez, M., et al. (2016). Framing the Concept of Satellite Remote Sensing Essential Biodiversity Variables: Challenges and Future Directions. Remote Sens Ecol. Conserv 2, 122–131. doi:10.1002/rse2.15
Phillips, O. L., and Lewis, S. L. (2014). Evaluating the Tropical forest Carbon Sink. Glob. Change Biol. 20, 2039–2041. doi:10.1111/gcb.12423
PNN (2015). Áreas protegidas registradas en el registro único de áreas protegidas. Registro único Nacional de Áreas Protegidas RUNAP. Decreto único 1076 del 2015. Shapefile. Bogotá: Parques Nacionales Naturales de ColombiaAvailable at http://mapas.parquesnacionales.gov.co/services.
Porcar-Castell, A., Tyystjärvi, E., Atherton, J., Van der Tol, C., Flexas, J., Pfündel, E. E., et al. (2014). Linking Chlorophyll a Fluorescence to Photosynthesis for Remote Sensing Applications: Mechanisms and Challenges. J. Exp. Bot. 65, 4065–4095. doi:10.1093/jxb/eru191
Poveda, G., Álvarez, D. M., and Rueda, Ó. A. (2011). Hydro-climatic Variability over the Andes of Colombia Associated with ENSO: a Review of Climatic Processes and Their Impact on One of the Earth's Most Important Biodiversity Hotspots. Clim. Dyn. 36, 2233–2249. doi:10.1007/s00382-010-0931-y
Poveda, G., and Mesa, O. J. (2000). On the Existence of Lloró (The Rainiest Locality on Earth): Enhanced Ocean-Land-Atmosphere Interaction by a Low-Level Jet. Geophys. Res. Lett. 27, 1675–1678. doi:10.1029/1999gl006091
Poveda, G., Mesa, O. J., Salazar, L. F., Arias, P. A., Moreno, H. A., Vieira, S. C., et al. (2005). The Diurnal Cycle of Precipitation in the Tropical Andes of Colombia. Monthly Weather Rev. 133, 228–240. doi:10.1175/mwr-2853.1
Poveda, G., Waylen, P. R., and Pulwarty, R. S. (2006). Annual and Inter-annual Variability of the Present Climate in Northern South America and Southern Mesoamerica. Palaeogeogr. Palaeoclimatol. Palaeoecol. 234, 3–27. doi:10.1016/j.palaeo.2005.10.031
Radeloff, V. C., Dubinin, M., Coops, N. C., Allen, A. M., Brooks, T. M., Clayton, M. K., et al. (2019). The Dynamic Habitat Indices (Dhis) from Modis and Global Biodiversity. Remote Sensing Environ. 222, 204–214. doi:10.1016/j.rse.2018.12.009
Ramírez-Delgado, J., Galindo, G., Yepes, A., and Cabrera, E. (2018). Estimación de la degradación de bosques de Colombia a través de un análisis de fragmentación. Bogota D.C.: Instituto de Hidrología, Meteorología y Estudios Ambientales – IDEAM, Ministerio de Ambiente y Desarrollo Sostenible – MADS, Programa ONU-REDD Colombia.
Randin, C. F., Ashcroft, M. B., Bolliger, J., Cavender-Bares, J., Coops, N. C., Dullinger, S., et al. (2020). Monitoring Biodiversity in the Anthropocene Using Remote Sensing in Species Distribution Models. Remote sensing Environ. 239, 111626. doi:10.1016/j.rse.2019.111626
Reichstein, M., Bahn, M., Mahecha, M. D., Kattge, J., and Baldocchi, D. D. (2014). Linking Plant and Ecosystem Functional Biogeography. Proc. Natl. Acad. Sci. 111, 13697–13702. doi:10.1073/pnas.1216065111
Reichstein, M., Camps-Valls, G., Stevens, B., Jung, M., Denzler, J., Carvalhais, N., et al. (2019). Deep Learning and Process Understanding for Data-Driven Earth System Science. Nature 566, 195–204. doi:10.1038/s41586-019-0912-1
Running, S. W., Nemani, R. R., Heinsch, F. A., Zhao, M., Reeves, M., and Hashimoto, H. (2004). A Continuous Satellite-Derived Measure of Global Terrestrial Primary Production. Bioscience 54, 547–560. doi:10.1641/0006-3568(2004)054[0547:acsmog]2.0.co;2
Ryu, Y., Baldocchi, D. D., Kobayashi, H., Van Ingen, C., Li, J., Black, T. A., et al. (2011). Integration of MODIS Land and Atmosphere Products with a Coupled-Process Model to Estimate Gross Primary Productivity and Evapotranspiration from 1 Km to Global Scales. Glob. Biogeochem. Cycles 25, a–n. doi:10.1029/2011GB004053
Ryu, Y., Berry, J. A., and Baldocchi, D. D. (2019). What Is Global Photosynthesis? History, Uncertainties and Opportunities. Remote Sensing Environ. 223, 95–114. doi:10.1016/j.rse.2019.01.016
Ryu, Y., Jiang, C., Kobayashi, H., and Detto, M. (2018). MODIS-derived Global Land Products of Shortwave Radiation and Diffuse and Total Photosynthetically Active Radiation at 5 Km Resolution from 2000. Remote Sensing Environ. 204, 812–825. doi:10.1016/j.rse.2017.09.021
Salazar, A., Sanchez, A., Villegas, J. C., Salazar, J. F., Ruiz Carrascal, D., Sitch, S., et al. (2018). The Ecology of Peace: Preparing Colombia for New Political and Planetary Climates. Front. Ecol. Environ. 16, 525–531. doi:10.1002/fee.1950
Scholze, M., Buchwitz, M., Dorigo, W., Guanter, L., and Quegan, S. (2017). Reviews and Syntheses: Systematic Earth Observations for Use in Terrestrial Carbon Cycle Data Assimilation Systems. Biogeosciences 14, 3401–3429. doi:10.5194/bg-14-3401-2017
Shen, C., Laloy, E., Elshorbagy, A., Albert, A., Bales, J., Chang, F.-J., et al. (2018). HESS Opinions: Incubating Deep-Learning-Powered Hydrologic Science Advances as a Community. Hydrol. Earth Syst. Sci. (Online) 22, 5639–5656. doi:10.5194/hess-22-5639-2018
Sierra, C. A., Mahecha, M., Poveda, G., Álvarez-Dávila, E., Gutierrez-Velez, V. H., Reu, B., et al. (2017). Monitoring Ecological Change during Rapid Socio-Economic and Political Transitions: Colombian Ecosystems in the post-conflict Era. Environ. Sci. Pol. 76, 40–49. doi:10.1016/j.envsci.2017.06.011
Simard, M., Pinto, N., Fisher, J. B., and Baccini, A. (2011). Mapping forest Canopy Height Globally with Spaceborne Lidar. J. Geophys. Res. Biogeosciences 116. doi:10.1029/2011jg001708
Skidmore, A. K., Pettorelli, N., Coops, N. C., Geller, G. N., Hansen, M., Lucas, R., et al. (2015). Environmental Science: Agree on Biodiversity Metrics to Track from Space. Nature 523, 403–405. doi:10.1038/523403a
Song, X.-P., Hansen, M. C., Stehman, S. V., Potapov, P. V., Tyukavina, A., Vermote, E. F., et al. (2018). Global Land Change from 1982 to 2016. Nature 560, 639–643. doi:10.1038/s41586-018-0411-9
Sun, Y., Frankenberg, C., Wood, J. D., Schimel, D. S., Jung, M., Guanter, L., et al. (2017). OCO-2 Advances Photosynthesis Observation from Space via Solar-Induced Chlorophyll Fluorescence. Science 358, eaam5747. doi:10.1126/science.aam5747
Tamiminia, H., Salehi, B., Mahdianpari, M., Quackenbush, L., Adeli, S., and Brisco, B. (2020). Google Earth Engine for Geo-Big Data Applications: A Meta-Analysis and Systematic Review. ISPRS J. Photogrammetry Remote Sensing 164, 152–170. doi:10.1016/j.isprsjprs.2020.04.001
Tucker, C. J., and Sellers, P. J. (1986). Satellite Remote Sensing of Primary Production. Int. J. Remote Sensing 7, 1395–1416. doi:10.1080/01431168608948944
Turner, A. J., Köhler, P., Magney, T. S., Frankenberg, C., Fung, I., and Cohen, R. C. (2020). A Double Peak in the Seasonality of California's Photosynthesis as Observed from Space. Biogeosciences 17, 405–422. doi:10.5194/bg-17-405-2020
Vallejo-Bernal, S. M., Urrea, V., Bedoya-Soto, J. M., Posada, D., Olarte, A., Cárdenas-Posso, Y., et al. (2020). Ground Validation of TRMM 3B43 V7 Precipitation Estimates over Colombia. Part I: Monthly and Seasonal Timescales. Int. J. Climatology 41, 1–24.
van Schaik, E., Killaars, L., Smith, N. E., Koren, G., van Beek, L. P. H., Peters, W., et al. (2018). Changes in Surface Hydrology, Soil Moisture and Gross Primary Production in the Amazon during the 2015/2016 El Niño. Phil. Trans. R. Soc. B 373, 20180084. doi:10.1098/rstb.2018.0084
Vavilapalli, V. K., Murthy, A. C., Douglas, C., Agarwal, S., Konar, M., Evans, R., et al. (2013). “Apache Hadoop Yarn: Yet Another Resource Negotiator,” in Proceedings of the 4th annual Symposium on Cloud Computing, Santa Clara, California, New York, NY: Association for Computing Machinery, 1–16.
Velásquez-Tibatá, J., Olaya-Rodríguez, M. H., López-Lozano, D., Gutiérrez, C., González, I., and Londoño-Murcia, M. C. (2019). BioModelos: A Collaborative Online System to Map Species Distributions. PLoS One 14, e0214522. doi:10.1371/journal.pone.0214522
Walther, S., Voigt, M., Thum, T., Gonsamo, A., Zhang, Y., Köhler, P., et al. (2016). Satellite Chlorophyll Fluorescence Measurements Reveal Large-Scale Decoupling of Photosynthesis and Greenness Dynamics in Boreal evergreen Forests. Glob. Change Biol. 22, 2979–2996. doi:10.1111/gcb.13200
Wickham, H. (2011). The Split-Apply-Combine Strategy for Data Analysis. J. Stat. Softw. 40, 1–29. doi:10.18637/jss.v040.i01
Wilkinson, M. D., Dumontier, M., Aalbersberg, I. J., Appleton, G., Axton, M., Baak, A., et al. (2016). The FAIR Guiding Principles for Scientific Data Management and Stewardship. Scientific data 3, 1–9. doi:10.1038/sdata.2016.18
Wilson, A. M., and Jetz, W. (2016). Remotely Sensed High-Resolution Global Cloud Dynamics for Predicting Ecosystem and Biodiversity Distributions. Plos Biol. 14, e1002415. doi:10.1371/journal.pbio.1002415
Wu, J., Albert, L. P., Lopes, A. P., Restrepo-Coupe, N., Hayek, M., Wiedemann, K. T., et al. (2016). Leaf Development and Demography Explain Photosynthetic Seasonality in Amazon evergreen Forests. Science 351, 972–976. doi:10.1126/science.aad5068
Wulder, M. A., White, J. C., Loveland, T. R., Woodcock, C. E., Belward, A. S., Cohen, W. B., et al. (2016). The Global Landsat Archive: Status, Consolidation, and Direction. Remote Sensing Environ. 185, 271–283. doi:10.1016/j.rse.2015.11.032
Yao, X., Li, G., Xia, J., Ben, J., Cao, Q., Zhao, L., et al. (2020). Enabling the Big Earth Observation Data via Cloud Computing and DGGS: Opportunities and Challenges. Remote Sensing 12, 62.
Yepes, J., Poveda, G., Mejía, J. F., Moreno, L., and Rueda, C. (2019). CHOCO-JEX: A Research Experiment Focused on the Chocó Low-Level Jet over the Far Eastern Pacific and Western Colombia. Bull. Am. Meteorol. Soc. 100, 779–796. doi:10.1175/bams-d-18-0045.1
Zaharia, M., Xin, R. S., Wendell, P., Das, T., Armbrust, M., Dave, A., et al. (2016). Apache Spark. Commun. ACM 59, 56–65. doi:10.1145/2934664
Zemp, D. C., Schleussner, C.-F., Barbosa, H. M. J., Hirota, M., Montade, V., Sampaio, G., et al. (2017). Self-amplified Amazon forest Loss Due to Vegetation-Atmosphere Feedbacks. Nat. Commun. 8, 1–10. doi:10.1038/ncomms14681
Keywords: data cubes, data access, time series, dimensionality reduction, tropical ecosystems, ecosystem functioning, seasonality, biodiversity
Citation: Estupinan-Suarez LM, Gans F, Brenning A, Gutierrez-Velez VH, Londono MC, Pabon-Moreno DE, Poveda G, Reichstein M, Reu B, Sierra CA, Weber U and Mahecha MD (2021) A Regional Earth System Data Lab for Understanding Ecosystem Dynamics: An Example from Tropical South America. Front. Earth Sci. 9:613395. doi: 10.3389/feart.2021.613395
Received: 02 October 2020; Accepted: 28 June 2021;
Published: 20 July 2021.
Edited by:
Alexander Kokhanovsky, Telespazio Germany GmbH, GermanyReviewed by:
Gregory Giuliani, Université de Genève, SwitzerlandRabi Mohtar, American University of Beirut, Lebanon
Copyright © 2021 Estupinan-Suarez, Gans, Brenning, Gutierrez-Velez, Londono, Pabon-Moreno, Poveda, Reichstein, Reu, Sierra, Weber and Mahecha. This is an open-access article distributed under the terms of the Creative Commons Attribution License (CC BY). The use, distribution or reproduction in other forums is permitted, provided the original author(s) and the copyright owner(s) are credited and that the original publication in this journal is cited, in accordance with accepted academic practice. No use, distribution or reproduction is permitted which does not comply with these terms.
*Correspondence: Lina M. Estupinan-Suarez, lestup@bgc-jena.mpg.de