Quantitative Analysis of the Effects of an Earthquake on Rainfall Thresholds for Triggering Debris-Flow Events
 Shuang Liu
 Kaiheng Hu
 Qun Zhang2
 - 1Key Laboratory of Mountain Hazards and Earth Surface Processes, Institute of Mountain Hazards and Environment, Chinese Academy of Sciences, Chengdu, China
- 2Sichuan Institute of Land and Space Ecological Restoration and Geological Hazard Prevention, Chengdu, China
- 3College of Civil Engineering and Architecture, China Three Gorges University, Yichang, China
The impacts of destructive earthquakes on rainfall thresholds for triggering the debris flows have not yet been well investigated, due to lacks of data. In this study, we have collected the debris-flow records from the Wenchuan, Lushan, and Jiuzhaigou earthquake-affected areas in Sichuan Province, China. By using a meteorological dataset with 3 h and 0.1° resolutions, the dimensionless effective rainfall and rainfall intensity-duration relationships were calculated as the possible thresholds for triggering the debris flows. The pre- and post-seismic thresholds were compared to evaluate the impacts of the various intensities of earthquakes. Our results indicate that the post-quake thresholds are much smaller than the pre-seismic ones. The dimensionless effective rainfall shows the impacts of the Wenchuan, Lushan, and Jiuzhaigou earthquakes to be ca. 26, 27, and 16%, respectively. The Wenchuan earthquake has the most significant effect on lowering the rainfall intensity-duration curve. Rainfall threshold changes related to the moment magnitude and focal depth are discussed as well. Generally, this work may lead to an improved post-quake debris-flow warning strategy especially in sparsely instrumented regions.
Introduction
Massive earthquake-induced loose deposits on slopes or channels can be mobilized by heavy rainfalls and evolve into debris flows. The increased unconsolidated sediment reduces the rainfall threshold for the debris-flow occurrence and significantly augments the magnitude of post-quake debris flows (Chen and Petley, 2005; Ma et al., 2013). The post-quake hazards can remain highly frequent for 5–10 years, even longer as 20 years (Cui et al., 2011). Quantifying the impact of strong earthquakes on the rainfall threshold is essential for post-quake debris-flow early warning (Zhang and Zhang, 2017).
Numerous studies have reported the rainfall threshold variation after strong earthquakes. As an example, the mean value of the accumulated rainfall decreased from 867 mm for 67 debris flows in 1996 to 146 mm for 197 debris flows in 2001 in the intensive-ground-motion areas of the 1999 Chi-Chi earthquake in Taiwan (Liu et al., 2008). Similarly, the maximum effective cumulative precipitation decreased from 950 to 200 mm in the Mt. Ninety-Nine area of Taiwan during the first year after the earthquake (Shieh et al., 2009). After the 2008 Wenchuan earthquake, the accumulated rainfall threshold decreased by 15–22% while the critical value for the hourly rainfall intensity decreased by 25–32% (Tang et al., 2009). Likewise, a sudden drop in the rainfall threshold was found in the Gaochuan River basin near the Wenchuan earthquake’s epicenter (Li et al., 2016). The rainfall intensity-duration (I-D) thresholds normalized by the mean annual maximum hourly rainfall, indicate a reduction of at least 30% compared to the pre-quake level (Ma et al., 2017). Yu et al. (2014) found that the ratio of the thresholds before and after the earthquake decreased with increasing peak ground acceleration. However, due to data limitation, the impacts of destructive earthquakes on rainfall thresholds have not been well investigated quantitatively.
The recent three severe earthquakes occurred in Sichuan Province, Southwest China, namely the Wenchuan earthquake in 2008, the Lushan earthquake in 2013 and the Jiuzhaigou earthquake in 2017 have different magnitudes (Figure 1), which provides valuable cases to quantitatively examine the influence of the earthquake magnitude on the rainfall thresholds. We have collected debris-flow records in the Wenchuan earthquake-affected area (WEA), Lushan earthquake-affected area (LEA), and Jiuzhaigou earthquake-affected area (JEA) to examine how much an earthquake can affect the rainfall threshold for triggering debris flows. Two kinds of rainfall thresholds, including the dimensionless effective rainfall and the rainfall I-D curve, were calculated based on the China Meteorological Forcing Dataset from National Tibetan Plateau Data Center to show the seismic effects.
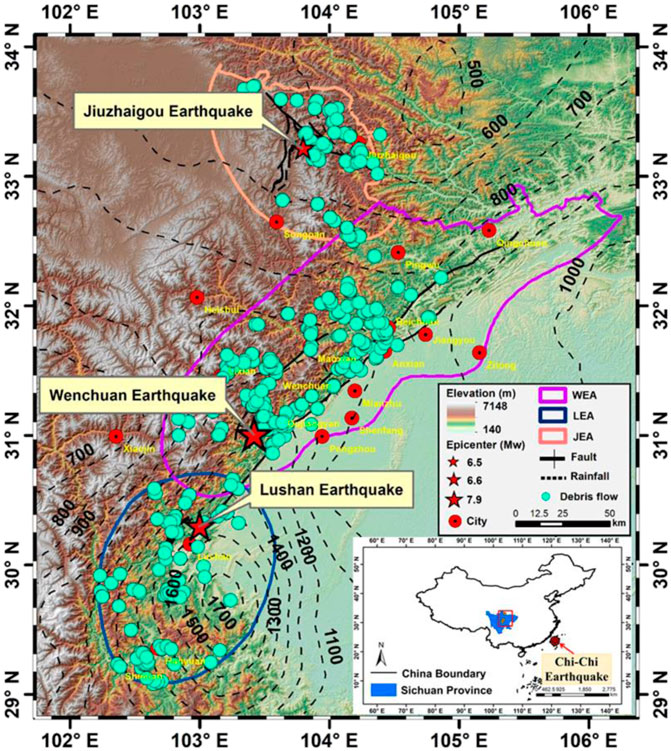
FIGURE 1. Location of study areas in Sichuan Province, China. The ranges, elevations, main faults, debris-flow records (filled dot), epicenters (pentagram), moment magnitude (Mw), and mean annual rainfall (contour with 100 mm interval) are shown for the WEA (Chinese seismic intensity ≥ VIII), LEA (Chinese seismic intensity ≥ VI), and JEA (Chinese seismic intensity ≥ VI), respectively. The location of the Chi-Chi earthquake in Taiwan Province is also marked in the subplot.
Materials and Methods
Study Area
The study area is located at the eastern edge of the Tibetan Plateau, which has been affected by the three earthquakes (Figure 1). The Mw 7.9 Wenchuan earthquake (the “5.12” earthquake) ruptured along the Longmenshan thrust belt on May 12, 2008 (Xu et al., 2009). The shock-induced collapses and landslides produced approximately 2.6 × 10⁹ m3 of loose material (Parker et al., 2011), indicating that debris flows may occur frequently following the earthquake (Cui et al., 2011). Huang and Li (2009) found that there were 8,627 geo-hazards, including 3,627 landslides, 2,383 slope collapses, and 837 debris flows in the 42 earthquake-hit regions of Sichuan Province. The Mw 6.6 Lushan earthquake occurred in the Longmen Shan fold-and-thrust belt, Sichuan Province, China, on April 20, 2013, causing 196 deaths and 13,484 injuries (Li et al., 2014). The earthquake has reduced hillslope stability and moderately increased the possibility of debris flows occurrence (Cui et al., 2014). On August 8, 2017, the Mw 6.5 earthquake with a focal depth of 20 km hit the Jiuzhaigou World Natural and Cultural Heritage site and its surroundings (Hong et al., 2018). The epicenter was at 33.2° N, 103.82° E, approximately 5 km west of the Jiuzhaigou core scenic area (Hu et al., 2019). 1883 earthquake-induced geological hazards were identified by remote sensing within the 840 km2 area affected by the earthquake (Fan et al., 2018).
Considering the sufficient earthquake intensity and available debris-flow records for comparisons, we choose the WEA with the Chinese seismic intensity ≥ VIII, the LEA with the intensity ≥ VI, and the JEA with the intensity ≥ VI as regions of interest. The moist monsoon dominates the regional climate, providing water conditions for debris flows (Cui et al., 2014). In addition, the Mw 7.6 Chi-Chi Earthquake in Taiwan is also used for discussion.
Data Sources
Collection of Debris-Flow Data
The debris flows mentioned in this study limit to the torrential flow of a mixture of water, mud, and debris in the gully or channel of a small catchment, even on a hill slope. The time span of the collected debris-flow events to the earthquakes does not exceed 15 years. Data of some debris-flow events when near-zero rainfall was recorded from a gridded rainfall dataset are excluded (more details in 2.2.2). Then, 267 debris-flow records for 2000–2010 in the WEA, 109 for 2000–2017 in the LEA, and 70 for 2010–2018 in JEA were collected through field survey and data gathering from Sichuan Provincial Natural Resources Department (Figure 1; Table 1). In the WEA, the debris flows that happened on the same day with the earthquake are classified as post-earthquake events, which can be used to show extremely post-seismic impacts on the rainfall conditions. Unlike debris flows in the WEA, we collected no co-seismic debris-flow records in the LEA and JEA.
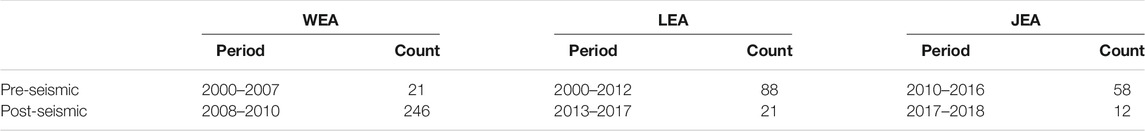
TABLE 1. Debris-flow numbers and the time range in each area.
Gridded Rainfall Data
The gridded near-surface meteorological dataset was developed for evaluating land surface processes in China (He et al., 2020). The dataset was made through the fusion of remote sensing products (e.g., Tropical Rainfall Measuring Mission 3B42 v7), a reanalysis dataset (e.g., Global Land Data Assimilation System and Modern-Era Retrospective Analysis), and in-situ observations at weather stations (e.g., daily data from approximately 700 stations of China Meteorological Administration and sub-daily data from the National Oceanic and Atmospheric Administration’s National Centers for Environmental Information). The time of the data ranges from January 1979 up to December 2018 with a temporal resolution of 3 h and a spatial resolution of 0.1°. For each 0.1° grid cell, a rainfall record with Greenwich Mean Time (GMT) stands for a mean value of rainfall intensities (mm/h) taken every three hours. So, each grid cell represents 8 records on each day. The data have been adjusted to match the Beijing time, i.e., 8 h ahead of the GMT.
Based on the data, the mean annual rainfall of 1979–2018 is ca. 950, 1,360, and 660 mm for the WEA, the LEA, and the JEA, respectively. According to the time ranges in Table 1, the mean annual rainfall of 937 mm after 2008 in the WEA is 7% higher than before 2008. However, the number of debris flows per year has increased ca. 30 times compared with the period before the Wenchuan earthquake. The decrease in the number of debris flows in both the LEA and the JEA cannot be directly linked with the change in the mean annual rainfall, suggesting that more short-term rainfall conditions should be discussed.
Regional Rainfall Threshold
Dimensionless Effective Rainfall
Effective rainfall is considered as a function of the regressive rainfall index (Li et al., 2011; Zhuang et al., 2015). We use the ratio of effective rainfall to annual rainfall as the dimensionless effective rainfall (DER) to eliminate the impacts of different annual climate. The equation for calculating DER can be written as:
where P0 is the total rainfall on the day of debris-flow occurrence; Pi is the accumulative daily rainfall (mm) on the ith day before the occurrence; Ki indicating K to the power of i is the decay factor of precipitation on the ith day before the occurrence; and Pannual is the total rainfall for each year. The study areas belong to the Hengduan Mountains in the southwest region of China, therefore, the K is empirically set to 0.84 (Liu et al., 2020). n is set to 3, 7, 11, and 15, respectively, for comparison. The median of DER in each earthquake-affected area is regarded as a proxy of regional rainfall threshold.
Rainfall Intensity-Duration Relationship
The so-called rainfall intensity-duration (I-D) relationship was proposed firstly by Caine (1980). It is a fairly common type of debris-flow threshold (Guzzetti et al., 2007). The original expression of the relationship is of discrepant dimension as the following:
where the term I denotes the mean hourly rainfall intensity (mm/h) of a continuous rainfall process that triggers a debris-flow event; D is the rainfall duration (h) for triggering a debris-flow event; and α and β are coefficients. Then, when the curve is drawn in a double logarithmic coordinate system, the α can reflect the intercept, while β can reflect the slope of the straight line. The rainfall conditions above the curve are more likely to trigger debris flows. Although some studies emphasize the physical interpretation of parameters in I-D curve, it is now restricted to some specific kind of debris flows such as runoff-generated debris flows with enough in-situ observations (Berti et al., 2020).
To eliminate the impacts of different annual climates before and after an earthquake, the ratio (Inew, h−1) of mean hourly rainfall intensity (mm/h) to annual rainfall (mm) is used to replace the term I in the Eq. 2 as follows:
where αnew and βnew are new coefficients. It is noteworthy that only the “day” information of debris-flow occurrence is available. It is assumed that a continue rainfall process begins if when averaged hourly rainfall intensity of grid cells covering the debris-flow gully is greater than 0.05 mm/h. Thus, the Inew and D of such rainfall event were used to describe the rainfall process for triggering debris flows.
Impacts of the Earthquake on the Thresholds
The impact of each earthquake on the thresholds is determined by the following equation:
where Threpre denotes the median DER or the parameters of I-D curve before the earthquake; and Threpost indicates those after the earthquake. For the DER, the positive value of Impact indicates the decrease of the regional rainfall threshold. For the parameters of I-D curve, the positive impact on α indicates a decrease of the scaling constant after an earthquake, αnew of Inew at D = 1 in the power-law relationship indicates that post-earthquake rainfall intensity is smaller or greater than the pre-earthquake intensity. The positive impact on βnew indicates a decrease of the shape slope, which should be combined with αnew change for threshold analysis.
Results and Discussion
Seismic Impacts on Dimensionless Effective Rainfall Thresholds
In the WEA, the regional rainfall thresholds are ca. 4.2, 5.8, 6.5, and 7.1% of the annual rainfall for effective antecedent rainy-day settings of 3, 7, 11, and 15, respectively, (Figure 2A). After the Wenchuan earthquake, the threshold decreased. When excluding the debris-flow samples on the day when the earthquake occurred, the thresholds are ca. 4.0, 5.1, 5.8, and 5.9% of the annual rainfall. When considering the debris-flow records on that day, the thresholds dropped more significantly (Figure 2B). The mean reduction of ca. 18% represent the most serious impact of Wenchuan earthquake on the rainfall condition. It suggests that once such earthquake happens, the short-term rainfall threshold could be much lower than that obtained from data in the following several years.
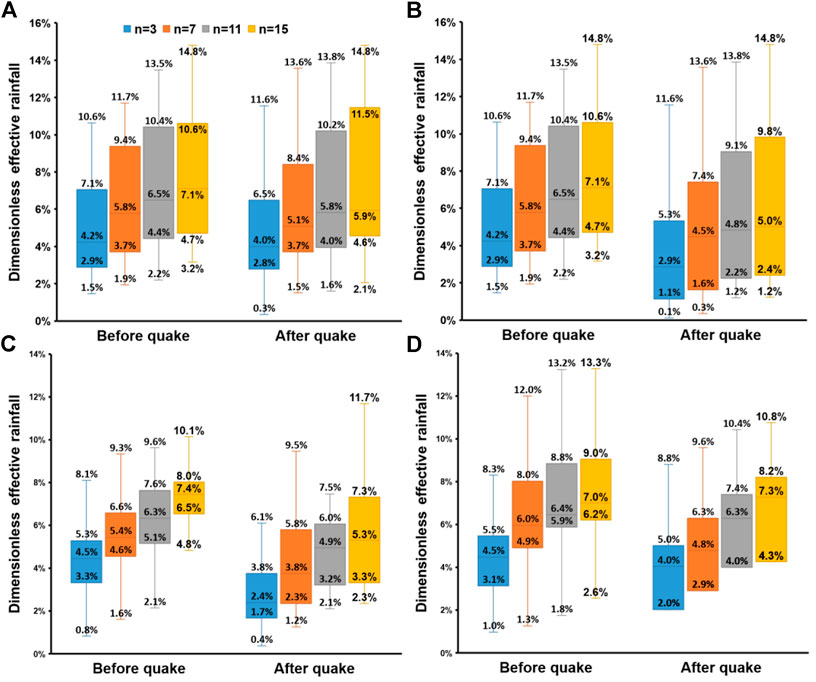
FIGURE 2. Boxplots of DER for Wenchuan (A, B), Lushan (C), and Jiuzhaigou (D) earthquakes. Subplot (A) excludes the debris flows occurring on May 12, 2008, while subplot (B) includes those events. n denotes effective antecedent rainy days. The first quartile marks the bottom of the box, and the third quartile marks the other end of the box. The backline in the box denotes the median.
Before the Lushan earthquake, the thresholds are ca. 4.5, 5.4, 6.3, and 7.4% of the annual rainfall. Then, they reduce to 2.4, 3.8, 4.9, and 5.3% after the quake (Figure 2C). Similarly, the thresholds in the JEA are ca. 4.5, 6.0, 6.4, and 7.0% before the earthquake (Figure 2D). After the shock, they decrease to ca. 4.0, 4.8, and 6.3% for antecedent rainy-day settings of 3, 7, and 11, respectively. However, the threshold unexpectedly increases slightly when the number of antecedent rainy days is set to 15.
In most cases, the earthquake lowered the DER thresholds (Figure 3). The regional impacts show a significant variation when n is set to 3. However, when n is set to other values rather than 3, the impacts only show lower variations. Based on the results with n = 7, 11, and 15, the mean impacts (mean level of seismic effects with different n settings) of the Wenchuan (including co-seismic events) and Lushan earthquakes are ca. 26 and 27%, respectively. When excluding the co-seismic samples (“5.12” events), the mean impact of Wenchuan is ca. 13%. When n is set to 11 and 15, the impacts are not significant in the JEA. Maybe the drier climate of Jiuzhaigou in the northern Sichuan province leads to fewer days of DER. When n is equal to 3 or 7, the mean impact of the Jiuzhaigou earthquakes is ca. 16%.
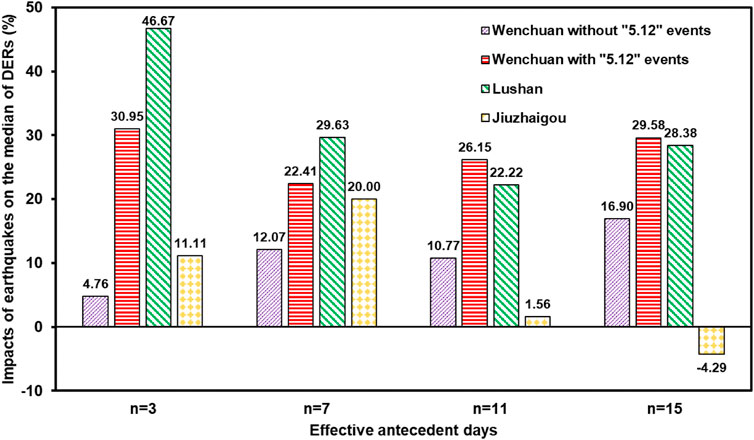
FIGURE 3. Impacts of each earthquake on rainfall thresholds with different n settings. n is effective antecedent rainy days. The positive value indicates the decrease of the regional rainfall threshold.
Seismic Impacts on Rainfall Intensity–Duration Relationships
All post-seismic I-D curves are lower than the pre-seismic ones, indicating that triggering post-quake debris flows needs smaller rainfall intensity or shorter duration (Figure 4). When drawing the “5.12” events for the Wenchuan earthquake in the picture (the purple crosses in Figure 4A), the triggering rainfall level becomes much lower than the post-seismic mean status, indicating extremely low rainfall threshold for co-seismic debris flows. For the WEA, there are more scattered debris-flow records for a shorter duration than a longer duration. Data shows more discrete records after Wenchuan earthquake than before the quake (Figure 4A). It may indicate more randomness on the rainfall intensity to trigger debris flows, which is consistent with the random effect of an earthquake on reducing the stability of the surface material (Zhao et al., 2020). Similar results occur at 3 and 9 h durations in both LEA and JLA (Figure 4B,C).
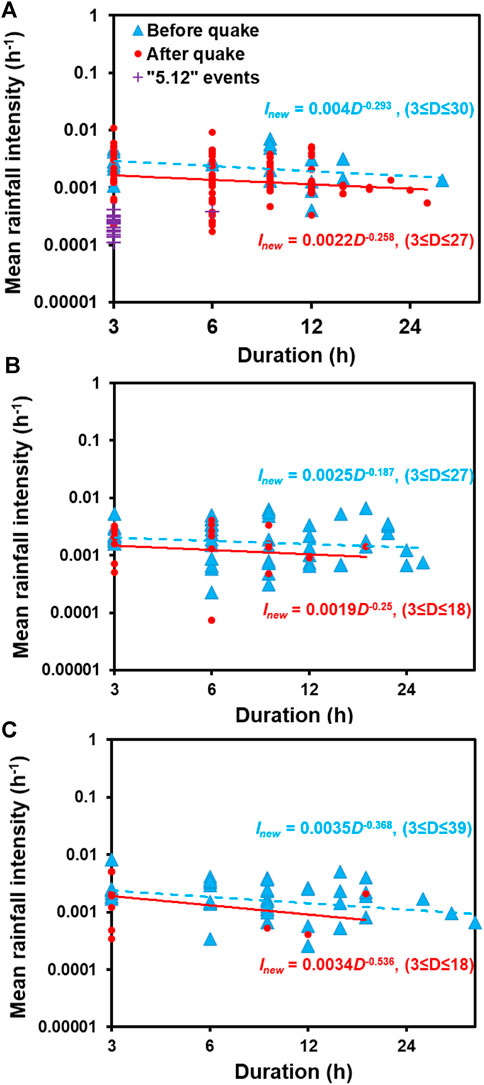
FIGURE 4. I-D curves for debris flows. The blue and red lines indicate I-D curves for debris flows before and after the Wenchuan (A), Lushan (B), and Jiuzhaigou (C) earthquakes. In the WEA, the pre-quake I-D curve is fitted with 21 debris-flow events from 2000 to 2007, while post-quake one is fitted with 183 events from 2008 to 2010 when excluding the samples on the day of “5.12” earthquake. The red circle denotes debris flows occurring after May 12, 2008, while the purple cross represents the debris flows occurring on that day. All sample points and fitted curves are drawn in the double logarithmic coordinate system.
According to the Eq. 3, impacts of earthquakes on the parameter αnew are ca. 45, 24, and 3% in the WEA, the LEA, and the JEA, respectively (Figure 5). Impact of the Wenchuan earthquake on the parameter βnew is ca. 12%, while those of the Lushan and Jiuzhaigou earthquakes are ca. −34 and ca. −46%. It indicates that, though the impacts of the Lushan and Jiuzhaigou earthquakes on αnew are smaller, the increased slopes also made the threshold lower (Figure 4B,C and Figure 5). However, it should be noted that a little change of βnew may not be important due to the limited rainfall duration indicated by the observations. Under these circumstances, the changes of the αnew could be considered as the more important aspect affected by the earthquakes.
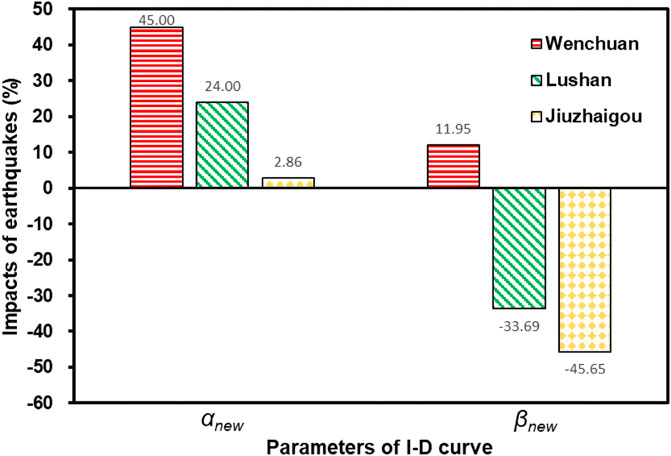
FIGURE 5. Impacts of each earthquake on the I-D curve parameters for debris flows. The positive impact on αnew indicates the decrease of the scaling constant. The positive impact on βnew means the decrease of the shape slope.
Discussion
Rainfall Threshold Change
The impact of the Wenchuan earthquake is reported to be ca. 20–30% (Tang et al., 2009; Ma et al., 2017). Compared with these studies, debris-flow records from more timely and detailed investigations after earthquakes have been collected, especially for the Wenchuan earthquake, meaning more debris flows with smaller rainfall have been included for statistical analysis. In addition, we supplemented the data analysis on the Lushan earthquake in 2013 and the recent Jiuzhaigou earthquake in 2017, and further explored the impacts of the earthquake on regional rainfall threshold. The impacts of the Lushan and Jiuzhaigou earthquakes on I-D rainfall thresholds are smaller, which may be due to the fact that moderate magnitude earthquakes (Mw 6–7) produce less landslide-associated loose materials (Stoffel et al., 2014).
Lin et al. (2004) concludes that the triggering thresholds such as cumulative antecedent rainfall and hourly rainfall intensity significantly decreased by 33% after the Chi-Chi Earthquake compared to the values before the earthquake. Shieh et al. (2009) surveyed the Wushihkeng watershed and the Mt. Ninety-Nine watershed in the Chi-Chi earthquake area. The maximum effective cumulative rainfall threshold was about 50% of that before the earthquake. Similar outcomes can be found in the Chen-Yu-Lan watershed (Chen, 2011). The 30–50% change caused by the Chi-Chi earthquake is indeed similar to that by the Wenchuan earthquake.
Implication for Post-quake Debris-Flow Warning
As shown in Table 2, the moment magnitude of the Wenchuan earthquake reached 7.9, much higher than the others. Although the change in the median DER is close to that influenced by the Lushan earthquake, the αnew of the I-D curve in the WEA has been changed by 45%, which is nearly double in the LEA. With a similar moment magnitude, different focal depths affect the results. The change in the median DER in the LEA with a 13 km focal depth is 11% larger than the JEA with 20 km focal depth.
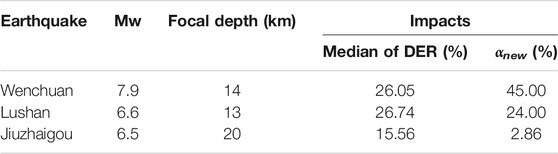
TABLE 2. Earthquake attributes and their impacts on regional rainfall thresholds.
A warning strategy, including the DER and I-D curves can be considered by using similar settings of methods and data as in this study. The DER threshold should be the initial focus. The antecedent rainfall can be obtained from up-to-date meteorological data, such as near-real-time precipitation produced by the land data assimilation system (CLDAS) from the China Meteorological Data Service Center (http://data.cma.cn/), satellite data, and in-situ observation. The daily rainfall data is obtained from the weather forecast. When the earthquake magnitude is ca. 6.5 and the focal depth is ca. 20 km, the change in the rainfall threshold condition can be estimated by referring to ca. 15% in the JEA. When the magnitude is greater than 6.5, but focal depth is less than 15 km, we can refer to a threshold change of 26% in the LEA and WEA. When the DER exceeds the median DER, we may think the rainfall can reach a warning level at the first stage. However, earthquake-affected areas responded differently to the statistical approaches (Table 2), which may be attributed to the heterogeneity of rainfall for triggering debris flows under different surface conditions. Thus, the hourly I-D curve can be used. The degree of I-D curve lowering after a strong shock are referred in Table 2. When the mean hourly rainfall intensity is above the curve, a regional warning should be issued.
Due to the lack of meteorological in-situ observations, advanced satellite-based rainfall data can be used as an effective alternative for near real-time analysis, which is widely adopted for disaster research (Jia et al., 2020). The Global Precipitation Measurement (GPM) mission, led by the National Aeronautics and Space Administration and the Japanese Aerospace Exploration Agency has been the latest generation of rainfall products since March 2014 (Hou et al., 2013). With the resolution of 0.1° and 0.5 h, the up-to-date GPM products may be suitable for near real-time analysis based on long-term historical records, which have been expanded back to start-ups (in 2000) by calibration (Huffman et al., 2019). We use the gridded rainfall dataset to check the reliability of the new GPM data for future application in debris-flow monitoring and warning. Correlation coefficients of 0.67, 0.53, and 0.56 are obtained for Jiuzhaigou, Wenchuan, and Lushan areas, respectively, (Figure 6), which indicates that the reliability needs to be further improved, as also confirmed by Liu et al. (2019). Though any satellite-based method will cause inevitable uncertainties (Carr et al., 2015), a combination with the methods used in this study could be an important supplement for debris-flow warning in ungauged areas with earthquakes.
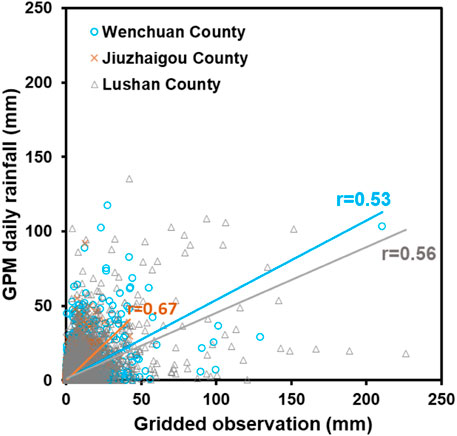
FIGURE 6. Comparison between GPM daily rainfall data and gridded observations.
Uncertainty and Limitation
The 40 years gridded rainfall data can provide enough information for this study, but the 3 h resolution and GMT format could cause uncertainty for determining the accurate time of debris-flow occurrence. Furthermore, even if eliminating the effects of fluctuant annual rainfall, the rainfall thresholds cannot avoid abnormal distribution of rainfall within certain year. The statistics in small regions (specified high earthquake-intensity areas) depend on the local information and temporal variability (Nikolopoulos et al., 2017; Gariano et al., 2020). However, most debris-flow disasters always occur in places where there is insufficient or ineffective instrumental observation.
Figure 4 shows that effects of the Lushan and Jiuzhaigou earthquake in the curves are not very obvious as that of Wenchuan earthquake. I-D scatters obtained by other study also support the point (Guo et al., 2021). Guo et al. (2021) pointed that debris flows after Lushan earthquake are triggered by shorter-duration rainfall than in most other regions, including the Wenchuan earthquake area, which may magnify the uncertainty from the rainfall data. In addition, some regional I-D threshold is difficult to be obtained, due to the limited data which cannot meet demand for a rigorous fitting. That is why we emphasize more on the change in the I-D relationships rather than the accurate threshold.
Van Asch et al. (2014) made a link between the rainfall thresholds and sediment material delivered by seismic landslides retained in gullies. Thousands of landslides triggered by the Lushan earthquake have become the material source of debris flows (Tang et al., 2015). But the erosion of channel deposits by overland runoff after Lushan earthquake was the dominant mechanism of debris-flow formation in the LEA (Guo et al., 2021). Compared with the WEA, the debris-flow volume in the LEA is smaller, which may be due to the smaller earthquake magnitude and the wetter climate for vegetation recovery. In addition, free placement of wastes produced in post-quake reconstruction can be initiated more easily to form debris flows. The complex spatial heterogeneity of natural and anthropogenic factors makes great differences of critical rainfall conditions for debris flows in different regions. Even so, it is still difficult to isolate any other factors for discussing the earthquake effects on rainfall for triggering the debris flows.
Conclusion
We collected the debris-flow records in the Wenchuan, Lushan, and Jiuzhaigou earthquake-affected areas in Sichuan Province, China. Based on the gridded meteorological dataset with 3 h and 0.1° resolutions, the DER and I-D thresholds were calculated. Then, comparison of the pre and post-seismic rainfall thresholds shows the impacts of the earthquakes with different magnitudes on the rainfall thresholds. Our results demonstrate that the post-quake thresholds are much smaller than the pre-seismic thresholds. The mean impacts of the Wenchuan, Lushan, and Jiuzhaigou earthquakes are ca. 26, 27, and 16%, respectively, with respect to the DER. For the Wenchuan earthquake we found a significantly lowered I-D curve. The impacts of the Wenchuan and Chi-Chi earthquakes are comparable. In general, this work is useful for calibrating and improving the rainfall thresholds of post-quake debris-flow warning.
Data Availability Statement
Because of tough field survey and requirements of the cooperative institutions, the debris-flow records should be requested upon approval of the corresponding author.
Author Contributions
SL and KH analyzed the results, and wrote the manuscript. SL, QZ, and DT documented all the data. KH, SZ, and XH reviewed and enhanced the paper.
Funding
This work was supported by the National Key R&D Program of China (2018YFC1505205, 2020YFD1100701), the Science and Technology Research and Development Plan of China State Railway Group Co., Ltd. (K2019G006), and Research and Demonstration Program of Precise Warning and the Emergence Disposal Technologies against geo-hazards in the Jiuzhaigou scenic area (KJ-2018–23).
Conflict of Interest
The authors declare that the research was conducted in the absence of any commercial or financial relationships that could be construed as a potential conflict of interest.
Acknowledgments
We sincerely appreciate all the constructive and detailed comments from the editor Tolga Gorum and the reviewers including Joern Lauterjung and Hans-Balder Havenith. We also thank the CAS “Light of West China” Program. The 90 m elevation data can be collected from the website (http://srtm.csi.cgiar.org/srtmdata/). The gridded meteorological dataset can be accessed from National Tibetan Plateau Data Center (https://data.tpdca.aca.cn) or the website of the journal Scientific Data (https://www.nature.com/articles/s41597-020-0369-y). GPM precipitation products can be accessed from the website (https://disca.gsfca.nasa.gov/).
References
Berti, M., Bernard, M., Gregoretti, C., and Simoni, A. (2020). Physical Interpretation of Rainfall Thresholds for Runoff-Generated Debris Flows. J. Geophys. Res. Earth Surf. 125, e2019JF005513. doi:10.1029/2019jf005513
Caine, N. (1980). The Rainfall Intensity - Duration Control of Shallow Landslides and Debris Flows. Geografiska annaler: Ser. A, Phys. Geogr. 62, 23–27. doi:10.1080/04353676.1980.11879996
Carr, N., Kirstetter, P.-E., Hong, Y., Gourley, J. J., Schwaller, M., Petersen, W., et al. (2015). The Influence of Surface and Precipitation Characteristics on TRMM Microwave Imager Rainfall Retrieval Uncertainty. J. Hydrometeorology 16, 1596–1614. doi:10.1175/jhm-d-14-0194.1
Chen, H., and Petley, D. N. (2005). The Impact of Landslides and Debris Flows Triggered by Typhoon Mindulle in Taiwan. Q. J. Eng. Geology. Hydrogeology 38, 301–304. doi:10.1144/1470-9236/04-077
Chen, J.-C. (2011). Variability of Impact of Earthquake on Debris-Flow Triggering Conditions: Case Study of Chen-Yu-Lan Watershed, Taiwan. Environ. Earth Sci. 64, 1787–1794. doi:10.1007/s12665-011-0981-4
Cui, P., Chen, X.-Q., Zhu, Y.-Y., Su, F.-H., Wei, F.-Q., Han, Y.-S., et al. (2011). The Wenchuan Earthquake (May 12, 2008), Sichuan Province, China, and Resulting Geohazards. Nat. Hazards 56, 19–36. doi:10.1007/s11069-009-9392-1
Cui, P., Zhang, J., Yang, Z., Chen, X., You, Y., and Li, Y. (2014). Activity and Distribution of Geohazards Induced by the Lushan Earthquake, April 20, 2013. Nat. Hazards 73, 711–726. doi:10.1007/s11069-014-1100-0
Fan, X., Scaringi, G., Xu, Q., Zhan, W., Dai, L., Li, Y., et al. (2018). Coseismic Landslides Triggered by the 8th August 2017 Ms 7.0 Jiuzhaigou Earthquake (Sichuan, China): Factors Controlling Their Spatial Distribution and Implications for the Seismogenic Blind Fault Identification. Landslides 15, 967–983. doi:10.1007/s10346-018-0960-x
Gariano, S. L., Melillo, M., Peruccacci, S., and Brunetti, M. T. (2020). How Much Does the Rainfall Temporal Resolution Affect Rainfall Thresholds for Landslide Triggering? Nat. Hazards 100, 655–670. doi:10.1007/s11069-019-03830-x
Guo, X., Chen, X., Song, G., Zhuang, J., and Fan, J. (2021). Debris Flows in the Lushan Earthquake Area: Formation Characteristics, Rainfall Conditions, and Evolutionary Tendency. Nat. Hazards 106, 2663–2687. doi:10.1007/s11069-021-04559-2
Guzzetti, F., Peruccacci, S., Rossi, M., and Stark, C. P. (2007). Rainfall Thresholds for the Initiation of Landslides in central and Southern Europe. Meteorol. Atmos. Phys. 98, 239–267. doi:10.1007/s00703-007-0262-7
He, J., Yang, K., Tang, W., Lu, H., Qin, J., Chen, Y., et al. (2020). The First High-Resolution Meteorological Forcing Dataset for Land Process Studies over China. Scientific Data 7, 25. doi:10.1038/s41597-020-0369-y
Hong, S., Zhou, X., Zhang, K., Meng, G., Dong, Y., Su, X., et al. (2018). Source Model and Stress Disturbance of the 2017 Jiuzhaigou Mw 6.5 Earthquake Constrained by InSAR and GPS Measurements. Remote Sensing 10, 1400. doi:10.3390/rs10091400
Hou, A. Y., Kakar, R. K., Neeck, S., Azarbarzin, A. A., Kummerow, C. D., Kojima, M., et al. (2013). The Global Precipitation Measurement Mission. Bull. Am. Meteorol. Soc. 95, 701–722.
Hu, X., Hu, K., Tang, J., You, Y., and Wu, C. (2019). Assessment of Debris-Flow Potential Dangers in the Jiuzhaigou Valley Following the August 8, 2017, Jiuzhaigou Earthquake, Western China. Eng. Geology. 256, 57–66. doi:10.1016/j.enggeo.2019.05.004
Huang, R. Q., and Li, W. L. (2009). Analysis of the Geo-Hazards Triggered by the 12 May 2008 Wenchuan Earthquake, China. Bull. Eng. Geol. Environ. 68, 363–371. doi:10.1007/s10064-009-0207-0
Huffman, G. J., Stocker, E. F., Bolvin, D. T., Nelkin, E. J., and Tan, Jackson. (2019). “GPM IMERG Final Precipitation L3 1 Day 0.1 Degree X 0.1 Degree V06,” in Goddard Earth Sciences Data and Information Services Center (GES DISC). Editor A. Savtchenko, (Greenbelt, MD: National Aeronautics and Space Administration).
Jia, G., Tang, Q., and Xu, X. (2020). Evaluating the Performances of Satellite-Based Rainfall Data for Global Rainfall-Induced Landslide Warnings. Landslides 17, 283–299. doi:10.1007/s10346-019-01277-6
Li, C., Ma, T., Zhu, X., and Li, W. (2011). The Power-Law Relationship between Landslide Occurrence and Rainfall Level. Geomorphology 130, 221–229. doi:10.1016/j.geomorph.2011.03.018
Li, T.-T., Huang, R.-Q., and Pei, X.-J. (2016). Variability in Rainfall Threshold for Debris Flow after Wenchuan Earthquake in Gaochuan River Watershed, Southwest China. Nat. Hazards 82, 1967–1980. doi:10.1007/s11069-016-2280-6
Li, Y., Jia, D., Wang, M., Shaw, J. H., He, J., Lin, A., et al. (2014). Structural Geometry of the Source Region for the 2013 Mw 6.6 Lushan Earthquake: Implication for Earthquake hazard Assessment along the Longmen Shan. Earth Planet. Sci. Lett. 390, 275–286. doi:10.1016/j.epsl.2014.01.018
Lin, C.-W., Shieh, C.-L., Yuan, B.-D., Shieh, Y.-C., Liu, S.-H., and Lee, S.-Y. (2004). Impact of Chi-Chi Earthquake on the Occurrence of Landslides and Debris Flows: Example from the Chenyulan River Watershed, Nantou, Taiwan. Eng. Geology. 71, 49–61. doi:10.1016/s0013-7952(03)00125-x
Liu, C.-N., Huang, H.-F., and Dong, J.-J. (2008). Impacts of September 21, 1999 Chi-Chi Earthquake on the Characteristics of Gully-type Debris Flows in central Taiwan. Nat. Hazards 47, 349–368. doi:10.1007/s11069-008-9223-9
Liu, S., Hu, K., Zhang, S., and Zeng, Y. (2019). Comprehensive Evaluation of Satellite‐Based Precipitation at Sub‐Daily Time Scales over a High‐Profile Watershed with Complex Terrain. Earth Space Sci. 6, 2347–2361. doi:10.1029/2019ea000855
Liu, S., Wei, L., and Hu, K. (2020). Topographical and Geological Variation of Effective Rainfall for Debris-Flow Occurrence from a Large-Scale Perspective. Geomorphology 358, 107134. doi:10.1016/j.geomorph.2020.107134
Ma, C., Hu, K., and Tian, M. (2013). Comparison of Debris-Flow Volume and Activity under Different Formation Conditions. Nat. Hazards 67, 261–273. doi:10.1007/s11069-013-0557-6
Ma, C., Wang, Y., Hu, K., Du, C., and Yang, W. (2017). Rainfall Intensity-Duration Threshold and Erosion Competence of Debris Flows in Four Areas Affected by the 2008 Wenchuan Earthquake. Geomorphology 282, 85–95. doi:10.1016/j.geomorph.2017.01.012
Nikolopoulos, E. I., Destro, E., Maggioni, V., Marra, F., and Borga, M. (2017). Satellite Rainfall Estimates for Debris Flow Prediction: An Evaluation Based on Rainfall Accumulation-Duration Thresholds. J. Hydrometeorology 18, 2207–2214. doi:10.1175/jhm-d-17-0052.1
Parker, R. N., Densmore, A. L., Rosser, N. J., De Michele, M., Li, Y., Huang, R., et al. (2011). Mass Wasting Triggered by the 2008 Wenchuan Earthquake Is Greater Than Orogenic Growth. Nat. Geosci 4, 449–452. doi:10.1038/ngeo1154
Shieh, C. L., Chen, Y. S., Tsai, Y. J., and Wu, J. H. (2009). Variability in Rainfall Threshold for Debris Flow after the Chi-Chi Earthquake in central Taiwan, China. Int. J. Sediment Res. 24, 177–188. doi:10.1016/s1001-6279(09)60025-1
Stoffel, M., Mendlik, T., Schneuwly-Bollschweiler, M., and Gobiet, A. (2014). Possible Impacts of Climate Change on Debris-Flow Activity in the Swiss Alps. Climatic Change 122, 141–155. doi:10.1007/s10584-013-0993-z
Tang, C., Ma, G., Chang, M., Li, W., Zhang, D., Jia, T., et al. (2015). Landslides Triggered by the 20 April 2013 Lushan Earthquake, Sichuan Province, China. Eng. Geology. 187, 45–55. doi:10.1016/j.enggeo.2014.12.004
Tang, C., Zhu, J., Li, W. L., and Liang, J. T. (2009). Rainfall-triggered Debris Flows Following the Wenchuan Earthquake. Bull. Eng. Geol. Environ. 68, 187–194. doi:10.1007/s10064-009-0201-6
Van Asch, T. W. J., Tang, C., Alkema, D., Zhu, J., and Zhou, W. (2014). An Integrated Model to Assess Critical Rainfall Thresholds for Run-Out Distances of Debris Flows. Nat. Hazards 70, 299–311. doi:10.1007/s11069-013-0810-z
Xu, X., Wen, X., Yu, G., Chen, G., Klinger, Y., Hubbard, J., et al. (2009). Coseismic Reverse- and Oblique-Slip Surface Faulting Generated by the 2008 Mw 7.9 Wenchuan Earthquake, China. Geology 37, 515–518. doi:10.1130/g25462a.1
Yu, B., Wu, Y., and Chu, S. (2014). Preliminary Study of the Effect of Earthquakes on the Rainfall Threshold of Debris Flows. Eng. Geology. 182, 130–135. doi:10.1016/j.enggeo.2014.04.007
Zhang, S., and Zhang, L. M. (2017). Impact of the 2008 Wenchuan Earthquake in China on Subsequent Long-Term Debris Flow Activities in the Epicentral Area. Geomorphology 276, 86–103. doi:10.1016/j.geomorph.2016.10.009
Zhao, L., Huang, Y., Chen, Z., Ye, B., and Liu, F. (2020). Dynamic Failure Processes and Failure Mechanism of Soil Slope under Random Earthquake Ground Motions. Soil Dyn. Earthquake Eng. 133, 106147. doi:10.1016/j.soildyn.2020.106147
Keywords: debris flows, seismic effects, regional rainfall threshold, early warning, disaster prevention
Citation: Liu S, Hu K, Zhang Q, Zhang S, Hu X and Tang D (2021) Quantitative Analysis of the Effects of an Earthquake on Rainfall Thresholds for Triggering Debris-Flow Events. Front. Earth Sci. 9:676470. doi: 10.3389/feart.2021.676470
Received: 05 March 2021; Accepted: 10 May 2021;
Published: 01 June 2021.
Edited by:
Tolga Gorum, Istanbul Technical University, TurkeyReviewed by:
Hans-Balder Havenith, University of Liège, BelgiumJoern Lauterjung, German Research Centre for Geosciences, Germany
Copyright © 2021 Liu, Hu, Zhang, Zhang, Hu and Tang. This is an open-access article distributed under the terms of the Creative Commons Attribution License (CC BY). The use, distribution or reproduction in other forums is permitted, provided the original author(s) and the copyright owner(s) are credited and that the original publication in this journal is cited, in accordance with accepted academic practice. No use, distribution or reproduction is permitted which does not comply with these terms.
*Correspondence: Kaiheng Hu, khhu@imde.ac.cn