A Sustainability 3D Framework of the 20 Regions of Italy and Comparison With World Countries
 Federico M. Pulselli
 Alessandro Sani1
  Luca Coscieme
 Simone Bastianoni
- 1Ecodynamics Group, Department of Physical, Earth and Environmental Sciences, University of Siena, Siena, Italy
- 2School of Natural Sciences, Trinity College, University of Dublin, Dublin, Ireland
An Input-State-Output (I-S-O) framework has been recently introduced to investigate the multidimensional aspects of sustainability (namely environmental, social and economic ones) of economic systems through a thermodynamically and logically ordered scheme. This approach provides an overall view of sustainability (the three dimensions together) facilitating the convergence of information from sets of indicators without aggregating results into single numbers and, consequently, losing information. In this paper we present the application of the I-S-O framework for the 20 regions of Italy. The emergy flow, the Gini Index of income distribution, and the regional Gross Domestic Product are used as systemic indicators for input, state, and output of the systems, respectively. We observe diversity among regions in the light of very different values of the three indicators. The per capita use of resources in the North of Italy is generally 2 to 4 times larger than in the South (excluding Puglia and Sardegna); the regional GDP per capita in the North doubles that of the Southern regions. The distribution of income, that is slightly better in two regions of the north (Trentino AA and Friuli VG), some of Center Italy, and Puglia in the South, only partially reflects that North-South discrepancy. Using the same measures, the 20 Regions are included in a global overview recently produced for 99 world countries. Regional values cover a wide range of countries; nevertheless, our values tend to be more similar to those of developed countries. Based on indicator values, Regions are also categorized, which enables interpretation of this overview at both sub-national and supra-national level.
Introduction
The performances of a national or regional system can be measured in many different ways, but the priority given to the economic signals, such as growth of Gross Domestic Product (GDP), per capita income or similar entities, over social, and environmental ones is evident. This condition leads to neglect several aspects which are however important to determine the level of well-being of a population, the state of the environment and, ultimately, the sustainability of the system, and the activities that it hosts. The concept of sustainability, in particular, is traditionally based upon the acknowledgment of three spheres, namely the economic, the social, and the environmental ones (Barbier, 1987), whose intersection represents the space, latu sensu, in which sustainability is achieved. This approach undoubtedly highlights the multi-aspect character of the concept, but it has been also criticized because of supposed substitutability among elements belonging to different spheres (i.e., I may accept worse environmental conditions if I improve my economic performance) and the risk that the economic goals overarch all other important features and needs (Lozano, 2008; Pulselli et al., 2015, for a wide critical overview, see Purvis et al., 2019).
After the EU “beyond GDP” initiative in 2009, a number of experiences aimed at combining indicators, datasets, dominions, dimensions, etc., have been proposed and implemented. Some examples, among others, are the Stiglitz Commission established in France (Stiglitz et al., 2009), the development of the BES framework (acronym for Benessere Equo e Sostenibile, i.e., equitable and sustainable well-being; see ISTAT CNEL., 2013, 2014; ISTAT., 2016), defined as “a measurement tool for progress in Italy” (Riccardini and De Rosa, 2016), and the UN—Sustainable Development Goals initiative (UN., 2015 see also http://www.un.org/sustainabledevelopment/sustainable-development-goals/). These experiences resulted from a combined action of experts in economic policy, indicators, management, social an environmental problems on one side, and govern leaders interested in their application, on the other. For this reason, sometimes these monitoring frameworks have been efficaciously translated into policies or, at least, the intent of considering sets of multidimensional indicators to evaluate policies, strategies or actions has been expressed. In Italy, for example, since 2017, a subset of 12 indicators belonging to the BES framework has been adopted by a Commission of experts for the Ministry of Economy and Finance (Ministero dell'Economia e delle Finanze., 2019) to assess the validity of economic policy measures. The BES indicators are representative of some environmental, social and economic aspects of the national community, such as income, poverty, inequality, education, employment, criminality, GHG emissions. Similarly, the consistency of given actions or programs may be also determined on the basis of the trend of SDG indicators (Eurostat., 2018; see also ASviS., 2018 for the case of Italy).
In these cases, to optimize the immediate functionality of a very complicated and variegated set of measures (“a dashboard of indicators,” see Ciommi et al., 2017), a selection of dimensions or indicators is necessary. This selection must however follow a logic rationale or model in order to combine informative power of the selected indicators and computation feasibility or data availability, after identifying the context in which the evaluation must be made (e.g., sustainability, well-being, etc.: for an overview of indicator-based approaches, see Pulselli et al., 2016).
Here we present a framework that helps select dimensions and indicators in the field of sustainability assessment, following a solution proposed by Pulselli et al. (2015) who introduced a “more rational” view of sustainability by considering the environment the society and the economy as an ordered series of compartments. In fact, sustainability is an opportunity to consider and strengthen our capacity to identify and measure the behavior of a system in different fields (economic, social, environmental), by means of simultaneous use of systemic indicators, in such a way that the overall performance might be progressively improved (see also Sala et al., 2015).
This representation is based upon evidence from the sustainability research: the environment is the material basis for the society that, in turn, contains and supports the economy (concentric circles, Figure 1A); the system first and continuously needs matter and energy inputs and other natural (ecosystem) services for its survival, these are captured and processed by virtue of an organized societal state, a part of which consists of the economic infrastructure that produces the economic output (oriented pyramid, Figure 1B).
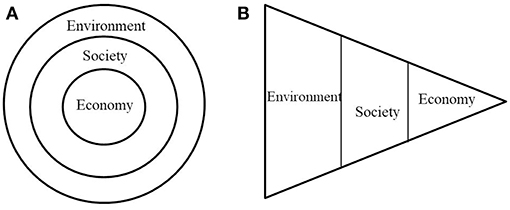
Figure 1. Representation of sustainability and the environmental, social and economic spheres: (A) concentric circles, adapted from Mitchell (2000), (B) oriented pyramid, adapted from Pulselli et al. (2015).
This framework thus describes the succession of phases of system or process dynamics, namely the acquisition of an input, the organizational/structural state of the system, and the production of an output. For this reason, it is called Input-State-Output (I-S-O) framework (Figure 2). The framework is consistent with the EU—“GDP and beyond” program, also in practical terms because multiple aspects are taken into consideration at the same time (European Statistical System, 2011).
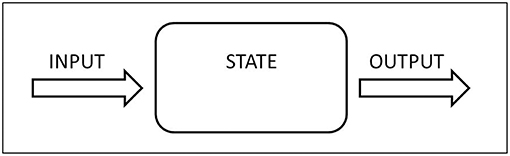
Figure 2. The I-S-O framework.
The I-S-O framework was introduced for studying and categorizing different ecosystems on the basis of systemic indicators to measure input, state/organization and useful output of ecosystems, respectively (Coscieme et al., 2013). Pulselli et al. (2015) adopted this framework to investigate the environmental, social, and economic salient characteristics of 99 national economies.
In this paper, the I-S-O approach will be applied to the 20 Regions of Italy in order to categorize regional systems and appreciate: (1) the amplitude of the “dot” representing Italy: how large are the differences among regions? Which ones are close to the Italian average and which ones distant? (2) similarities of Italian regions with other countries of the world: how wide would be the range of regional values, if these were included in the global context?
Methods
To operationalize the I-S-O framework a selection of three systemic indicators (triad), i.e., referred to the totality of the system, must be made, one per each dimension. In the case presented here, we selected a triad of systemic indicators representative of the three dimensions of sustainability: the emergy flow supporting the territories as input indicator (environmental); the Gini index of income distribution as state indicator (social); the Gross Regional Product, or regional GDP, as output indicator (economic). The emergy flow at both national and regional scale has been calculated based on a range of data from 2009 to 2014 from different sources, depending on data availability; data on the regional GDP and the Gini index of income distribution has been collected from ISTAT (the national institute of statistics) for the year 2012.
After collecting data for the three indicators, a 3D representation is produced using a three-axis diagram, in which the three dimensions are simultaneously, but separately, considered to identify points resulting from the combination of values, without losing information. The indicator values are distributed along three axes, occupying three segments equal in length, respectively, in which the median value is identified to separate low and high domains. The median values are forced in the middle of the segments, in such a way that 8 sub-cubes can be determined to facilitate categorization of systems on the basis of different characteristics (Figure 3).
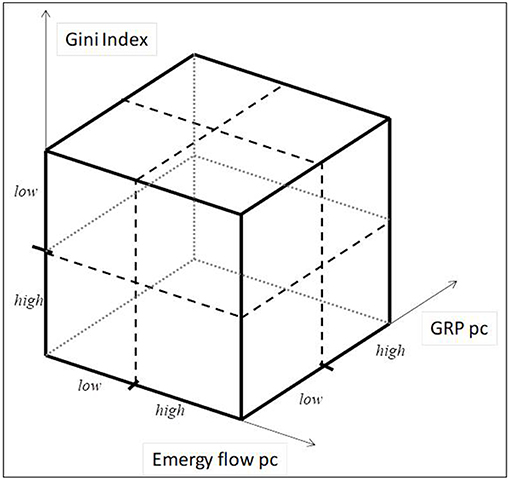
Figure 3. The three-axis diagram and the sub-cubes. The values for the three indicators are distributed along three equal segments divided into high and low domain by means of the median values. Eight sub-cubes are identified to facilitate categorization of systems.
Method Details
Emergy is a thermodynamics-based entity defined as the energy of one type that has been necessary to produce another type of energy (Odum, 1988, 1996). More specifically, the environmental accounting method based on emergy adopts solar energy as common denominator, so that all the flows of energy and matter used in a given system can be evaluated on the basis of how much solar energy has been directly or indirectly necessary to produce them (Brown et al., 2016). The investigation therefore results in a sum, expressed in solar equivalent joules (solar emjoules, sej), that represents the total efforts of Nature to capture and process solar energy to make resources available for human use. Therefore, the result depends on the amount and type of resources that are used in a production process or in a territorial system, because each one has a different story in terms of solar energy transformation. A large number of emergy studies applied to territorial systems have been produced in the last years. Among other examples, see the National Emergy Accounting Database (http://www.cep.ees.ufl.edu/nead/; Sweeney et al., 2007; Brown et al., 2009; this dataset has been recently updated and is available at: https://www.emergy-nead.com/home; Ulgiati et al., 1994; Campbell et al., 2004; Pulselli, 2010; Giannetti et al., 2013). These mainly aim at (a) quantifying all the flows of matter and energy feeding the systems independently of market values, (b) referring resource extraction, transformation and consumption to the whole area and its subsystems, and (c) representing the network of energy transformations in order to understand possible criticalities, overexploitation phenomena, renewable vs. non-renewable resource use, and other aspects highlighted by the emergy accounting system. In this paper, the emergy flow has been calculated for each region of Italy, combining together site-specific data, and information scaled down from the national values. The site-specific data is referred to meteorological phenomena, average characteristics of each area, such as diffuse geothermal heat and soil erosion, flows from local extraction activity, consumption of energy and water, among others. Scaled down data concerns the flow of imported goods: in practical terms the import of each region consists of what the system receives from outside Italy (the source is ISTAT, international commerce, available at https://www.istat.it/it/commercio-estero?dati) in such a way that the sum of regional imports equals the import at the national level. In other words, each region is considered as a part of the national system and the partition of the national import is considered, as suggested by Morandi et al. (2015). As a consequence, interregional commercial exchanges are not considered in this calculation.
To calculate the emergy of the 20 Italian regions, we followed the method used for emergy evaluation at the territorial scale—both national and regional—as presented, for example, by Ulgiati et al. (1994), Campbell (1998), Pulselli et al. (2007), Pulselli (2010), Morandi et al. (2015).
The Gini index is a measure of distribution of a variable. It is frequently applied to the distribution of income, thus representing the level of equality/inequality of a society. The index varies between 0 (perfect equality) and 1 (perfect inequality). Though this is an economics-based aggregate, here it is included in the social sphere because some factors may influence the index, such as among others, the level of employment or woman emancipation, and, at the same time, inequality often determines the health status of a population (see, for example, Wilkinson and Pickett, 2009, 2018). Therefore, its use is suitable to give an overall measure of the social condition of a system.
The Gross Domestic Product (GDP) is the most common measure of the economic output of a national economy. It is the sum of final goods and services produced by a system, expressed in economic terms, and it is often considered as the sole reference point for orienting the majority of policies, actions and strategies. Though criticized (Daly and Cobb, 1989), it is however a standardized and largely available tool to measure the economic performance of a given system. Here we consider the per-capita regional GDP as a measure of the economic output of a regional system.
Data for the Gini index and regional GDP per-capita of the 20 regions of Italy has been collected from the ISTAT dataset (available at dati.istat.it).
The combination suggested by the I-S-O framework enables “to maximize information with the minimum numerosity of indicators” (Pulselli et al., 2015) to represent the three dimensions of sustainability. The indicators chosen for the three stages of the framework generate complementary information, which implies that the three measures are not interchangeable. Not every aspect of the input to, the state of, and the output from the system can be described by a specific “optimal” triad, therefore different triads of measures can be composed capturing some characteristics of the system. Every indicator and, consequently, every triad may give different results. However, the use of this indicator framework helps visualize multiple information that gives an overall view of the systems and the three dimensions of sustainability. This perspective will be optimized if time series evaluations and continuous update of values are possible, essentially depending on data availability. In addition, starting from this approach, further elaborations may be developed, including different percentile division of dataset (es. quartiles instead of high and low domains) or cluster aggregation.
Results
Emergy, Gini Index and GDP Evaluation of Italy and Its Regions
The total emergy flow per-capita calculated for the 20 regions is shown in Table 1 (second column). Results for regional systems, though consistent with each other (same order of magnitude), reveal inequalities in availability of resources within the national area. The northern regions, especially Lombardia and Veneto, show the highest values of emergy per capita, which are mainly due to large urban and industrial settlements. On the contrary, the South of Italy is fed by smaller flows of resources and energy per capita, in particular Calabria and Campania. This fact, confirmed by the intermediate position of regions of central Italy, reflects to a certain extent the development trends along the country.
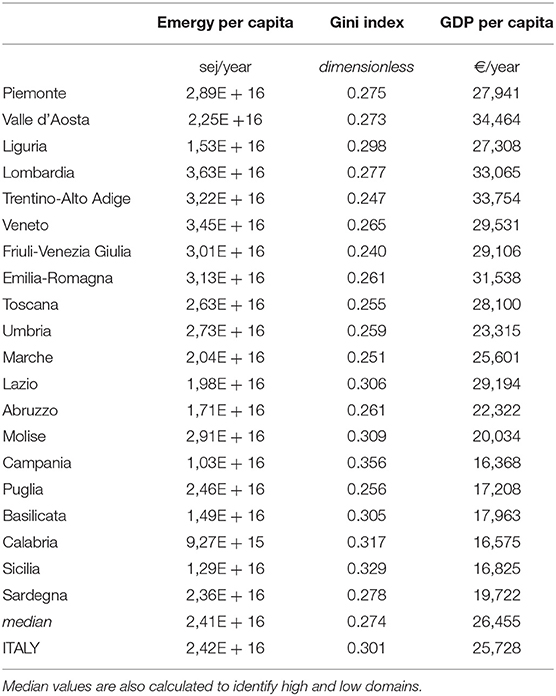
Table 1. The values of the three indicators for regional systems and Italy in 2012.
The main items, covering about 88 to 96% (slightly less for Calabria and Sardegna) of the total emergy flow, are: extraction activities (non-energetic minerals), energy sources, in particular electricity from the national grid which is mainly fed by fossil fuels, and import of goods from the rest of the world. At the national level, we observe that 22% of emergy is due to mineral extraction, 32% derives from import, 30% depends on energy sources (15% is electricity). Table 2 summarizes the percentage value of these resource categories for the 20 regions.
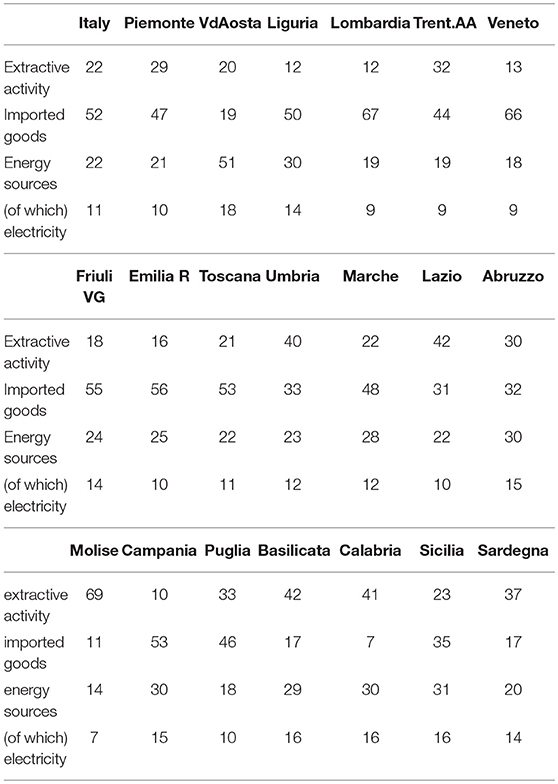
Table 2. Percentage importance of the main resource aggregates of Italy and the 20 regions.
Table 1 (third and fourth columns) shows the values of Gini index an regional GDP for 2012. The socio-economic data collected for this analysis confirms the heterogeneity of regional systems from different viewpoints, and helps highlight structural criticalities within the country. Moreover, it is well-known that the disparity highlighted by the differences in per capita GDP and the Gini index at the regional level (especially the difference between the North and the South) is a consolidated problem in the Italian context. Inequality is not necessarily correlated with income, but in the South of Italy lower income per capita corresponds to higher Gini index, mainly because of high unemployment rates especially among young people, who sometimes tend to move to the Northern regions. The North is more productive and more equal, though Liguria and Lombardia (the latter being among the richest ones) present values of the Gini index just above the median value. The most equal regions are Trentino AA, Friuli VG in the north and Toscana and Marche in central Italy.
Aggregation of Results in the I-S-O Framework
The 3-axis diagram enables identification of eight sub-sectors within which the regional systems can be classified on the basis of the combination of indicators. In particular, based on the distinction between low and high domains (discriminated by means of the median values) for each axis, a nomenclature is determined to acknowledge the characteristics of each sub-sector, as suggested by Pulselli et al. (2015).
Figure 4 represents the position of the sub-cubes within the 3-axis diagram, their names, the value (domains) of the indicators, and the regional systems they hosts. Sub-cubes correspond to volumes in which regions can be identified on the basis of three coordinates expressed by the values of the three indicators. This representation enables a first level analysis of a number of characteristics for each sub-system and, in case of time series data availability, also development trends and system dynamics.
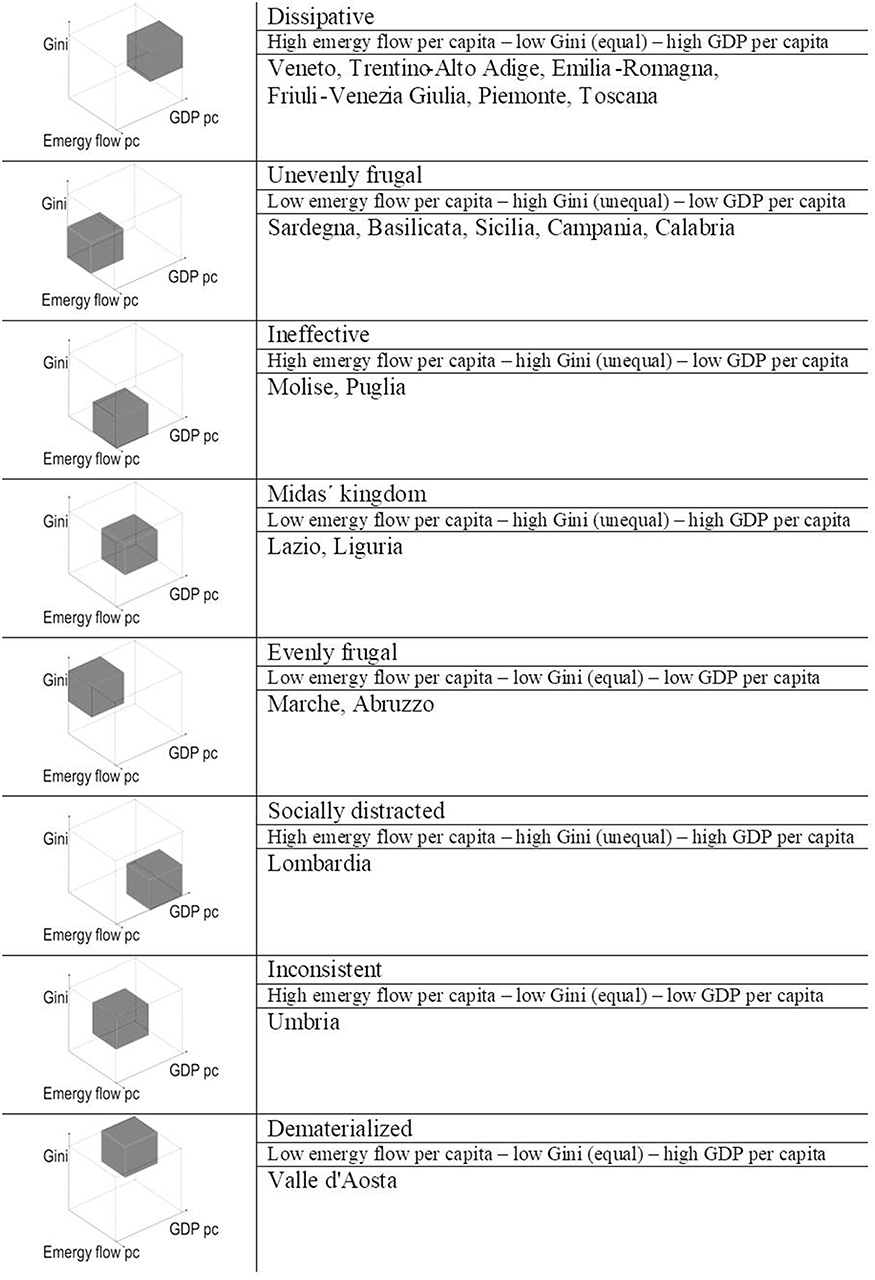
Figure 4. The 8 sub-cubes within the 3D space and categorization of regions.
Discussion
The Values at the Regional Level
As shown in Figure 4, all the sub-cubes are occupied at least by one point, which means that the 20 regions are characterized by diversity in the three dimensions. However, it must be noticed that some of them present indicator values very close to the respective median.
In general, the results reflect the discrepancy between the North and the South of Italy (Figure 5). In particular, on one hand, we find the “Dissipative” sub-cube, characterized by high domain for the three indicators and populated by regions of the North (Veneto, Trentino-Alto Adige, Friuli-Venezia Giulia, Piemonte) and Central-North (Emilia-Romagna, Toscana); on the other hand, we can group sub-cubes called “Unevenly frugal,” “Ineffective” and “Evenly Frugal” which present low domain values of indicators with the exception of two cases and in which Southern and Central-South regions are grouped (Sardegna, Basilicata, Sicilia, Campania, Calabria, Molise, Puglia, and Abruzzo—the Marche region belongs to this group though it is a region of Central Italy and presents better socio-economic conditions than southern regions). Lombardia, traditionally considered as the most developed region in Italy, stays in the “Socially distracted” space that includes systems that privilege transformation of large flows of resources (both locally extracted and imported, following the responsibility criterion of emergy evaluation) into market products, without paying sufficient attention to the general condition of the society. Though it is a very populated region, Lombardia presents the largest value of emergy per capita and the third-highest GDP per capita, but a level of income distribution slightly less fair that the median value (unequal distribution).
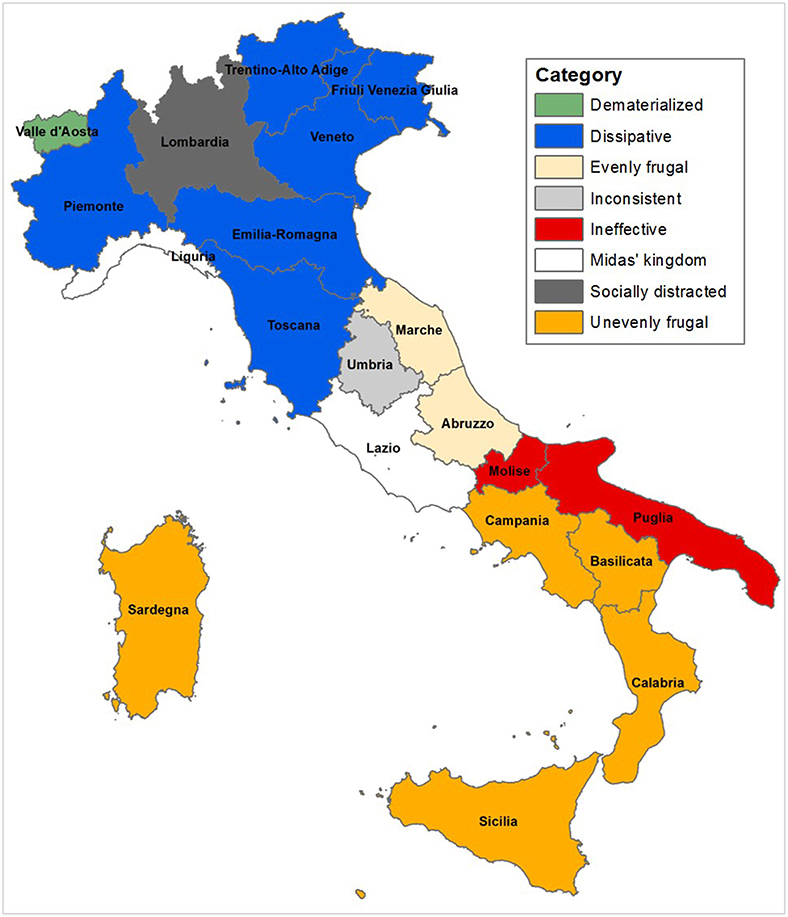
Figure 5. Distribution of I-S-O categories in the national context.
Rome, the capital city, is in Lazio which is located in the sub-cube called Mida's Kingdom. With this name, we indicate a condition of wealth obtained “from nothing,” i.e., seemingly without an adequate physical basis. In fact, the high level of GDP per capita is coupled with low levels of resource use and equality. In our opinion, it depends on the characteristics of a capital city, the political hearth of the nation, that centralizes the power and concentrates the economic resources; moreover Rome hosts millions of citizens, for whom many services must be provided (health care, transports, security, education, etc.), and is also one of the most important touristic destinations in the world. The political infrastructure and an economy strongly based on services and tourism, rather than industry and transformation, can justify the presence, in average, of high income per capita, though not well-distributed, corresponding to a less than average consumption of resources per capita.
The other regional system that produces wealth with a low value of emergy per capita and an income distribution close to the median is Valle d'Aosta, placed in the sub-cube called Dematerialized. Dematerialization is an ideal characteristic of more sustainable economic systems that is not yet achieved (see Pulselli et al., 2015) and Valle d'Aosta is not sufficiently representative to rebut this thesis because it is a low populated region, predominantly based on mountain tourism, though virtuous policies and strategies have been created to take advantage of the regional heritage.
Interpretation of Liguria and Umbria is more difficult. In particular, the presence of Umbria in the “Inconsistent” sub-cube is probably due to the agrarian predisposition of this area, that does not imply high income per capita, though income distribution is better than the median value. For Liguria, the values of the Gini index and per-capita GDP are close to the median; the emergy value lower than the median value results from the combination of a sectoral industrial activity (especially the mechanic sector along the coast and the floriculture in the western part of the region) and the service oriented economy of the harbor of Genoa and other similar infrastructures.
We can also observe the distance of each region from the Italian average, by normalizing the distance for the single dimension dividing by the average value for that dimension. Toscana, Umbria and Marche are the closest regions to the national “dot,” whereas, Calabria (around 3.6 times more distant than Toscana) and Campania are the farthest ones.
Comparing Values at the Global Level
Comparing Italian regions with each other results in a relative categorization and position of them within the “national” cube, because no absolute reference point is given. To broaden the observation, we consider the values calculated in this study within an international context. Reference values of the same indicators for a large number of countries can be extracted from the abovementioned study performed by Pulselli et al. (2015), based on 2008 data. The fact that our study is based on 2012 data, in our opinion, does not bias comparison because what is important is not the single value but the general distribution of points in a larger statistical horizon. However, to facilitate comparisons, data presented in Table 1 have been adapted to the values presented by Pulselli et al. (2015): in particular, the emergy values have been corrected by means of the ratio between the emergy flow for Italy in Pulselli et al. (2015) and the one presented in this paper; the Gini index and the GDP per capita have been collected for 2008.
Once Italy is identified in the 3D space for countries, one might imagine that the Italian regions are homogeneously distributed as a relatively small cloud surrounding the national “point.” On the contrary, the range of the regional values is surprisingly wide, covering the space occupied by many different countries.
Figure 6 highlights the position of the set of Italian regions, the range being limited by the minimum and maximum level of each indicator.
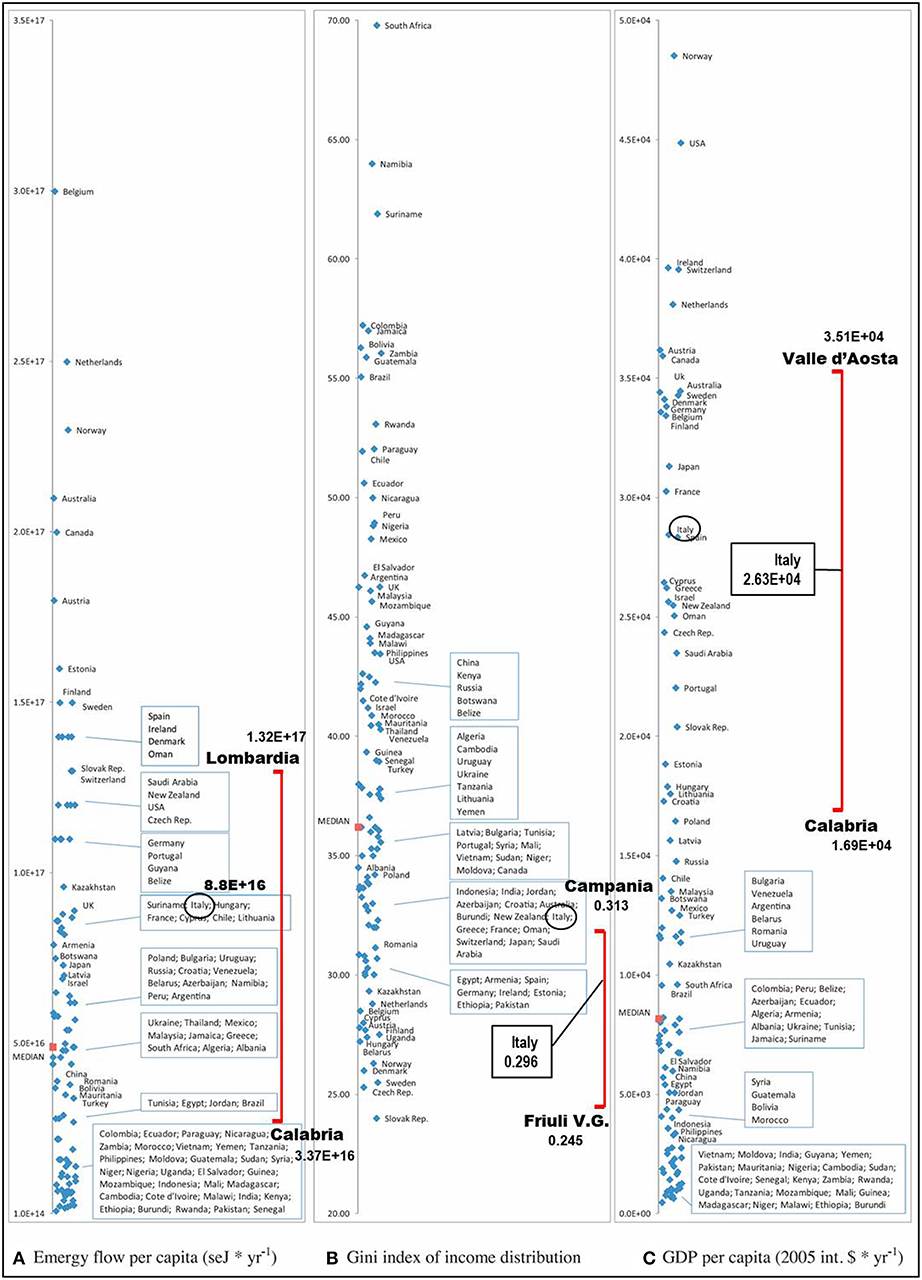
Figure 6. Range (min. and max. values of the three indicators) of Italian regions within the global distribution of world countries. Modified after Pulselli et al. (2015).
In the case of emergy values, representing availability and consumption of resources, Calabria would be located next to countries like Turkey and Mauritania, while Lombardia presents a value not far from that of Switzerland, Slovak Republic or United States. The Gini index varies from Friuli-Venezia Giulia, lower than Scandinavian countries, to Campania, similar to a cluster including Croatia, France, Switzerland, Saudi Arabia and India. GDP per capita, from Calabria to Valle d'Aosta value, covers a range limited by Latvia-Polonia and Canada-UK. Despite these differences, a crucial point is the position of the regional values relative to the word median values: almost all the emergy per capita values are above the global median; at the same time, the values of the Gini index and GDP per capita are always lower and higher, respectively, than the median values of the 99 countries of the world (Pulselli et al., 2015). This implies that in the global context, Italian regions would only belong to two different cubes: the Dematerialized for three regions with an emergy per capita lower than the world median, namely Calabria, Campania and Sicilia; the Dissipative for all the other region, mirroring the position of Italy and many other developed countries in the global context.
Notice that the values of indicators for Italy (the whole country) in the 2015 figure and the same values calculated in this study do not perfectly coincide because calculations have been performed using different datasets for the three indicators (especially in the case of Gini index: the 2008 World Bank database in the 2015 article; the 2012 value from ISTAT - Istituto Nazionale di Statistica, in this paper).
Investigation of Sub-national Systems
As a very high diversity exists between regions, efforts to produce and continuously update statistical data at the regional level should be maximized. In fact, national level statistics might not represent local realities, thus producing misleading signals that will risk fostering ineffective policies. Using data at the sub-national scale allows a detailed understanding of sustainability priorities, especially in countries characterized by heterogeneous environmental settings and substantial inequalities in income levels and distribution. Diversity in environmental resource availability and environmental risk, for instance in terms of soil erosion or flooding, influences the relative importance of preserving certain land-uses in specific territories, thus influencing human activities and policy planning (Coscieme et al., 2018).
Sustainability research has to consider sub-national diversity. As the aim of a national government should be to promote a prosperous and equally shared high-level of well-being for the entire population, subnational diagnosis is crucial, as well as an informed and carefully planned knowledge and data exchange among local statistical offices and research institutions. In this context, aggregate indicators computed at the national scale should be used carefully when referred to the local scale. We claim that the I-S-O framework is suitable for investigations at the sub-national scale. Taking into account the input and output flows that connote a local system informs on the relevance of the material input which the system relies upon and the useful output measured in economic terms. At the same time, specific attention must be paid to the societal organization of each sub-national system, as it seems delinked from the availability of resources and achievement of good economic results (Pulselli et al., 2015).
The I-S-O framework also helps highlight that diversities emerge in many different ways. Diversity is not only unequal distribution of wealth, but also access to resources, opportunities, development perspectives and, ultimately, economic options. For this reason, the policy action should be inspired by, and based on, combined information from different viewpoints. Italian regions are highly diverse, which implies that policy actions for sustainability should be tailored to the local context, or implemented in different groups of regions. In Italy, five regions have special administrative status, and, in general, regions and other territorial bodies can act by virtue of a certain degree of autonomy, which facilitates decentralization of some competencies (Pulselli et al., 2006). However, measures determined by the central government sometimes risk to neglect the specific needs of single peripheral areas, especially in a country that manifests such a level of diversity. At the same time, too diversified and decentralized policies risk to generate (instead of mitigate) diversities in such a way that the distance between rich, equal and sustainable regions and poor, unequal and unsustainable ones progressively increases, as it happens among countries at the global level. In other words, a complete decentralization of competencies at the regional level (autonomy) is not suitable for two reasons: some crucial policies, including those aimed at reducing inequalities in a country must be carried on and coordinated by the central government; diversities and inequality also emerge in different fields within intraregional systems (Betti et al., 2017) in such a way that a regional government is, in turn, probably unable to solve the same problems.
Conclusion
The I-S-O indicator framework is a systemic diagnostic tool that enables improvement of knowledge of sub-national systems. Diversity among areas within a country emerges in various forms which are identified and measured. The 20 regions of Italy present very different characteristics from the environmental, social and economic sustainability viewpoint, respectively, and are distributed in all the 8 sub-categories created by means of the three axis representation. In general, we find high concentration/use of resources in the north, coupled with high level of per-capita GDP, but sometimes less attention is paid to social well-being and equity; in the south we observe a lower level of resource use and income, but in some cases equity is preserved. The “dot” Italy (given by the combination of the three indicator values at the national level) is surrounded by a wide cloud of regions, some of which, in particular in the south, are quite far from the national values. This is also confirmed by the amplitude of the range of regional values included in a global context, i.e., comparing Italian regions to some countries of the world.
The I-S-O framework can be of great help in planning policies at both national and sub-national level, in line with the needs of different communities. A one-fits-all policy in such a diverse context risks to neglect peculiarities and diversities; at the same time, a particular/egoistic management of every single area in isolation from the others (extreme autonomy) will tend to create disaggregation and further diversity. In absence of a common policy that aims at reducing gaps, differences will tend to polarize further.
Author Contributions
FP, AS, and LC: performed the analysis. FP, AS, LC, GG, and SB: interpreted the results. FP, AS, LC, GG, and SB: drafted, refined, and concluded the paper.
Funding
LC was funded by an IRC/Marie Skłodowska-Curie CAROLINE Postdoctoral Fellowship (IRC-CLNE/2017/567).
Conflict of Interest Statement
The authors declare that the research was conducted in the absence of any commercial or financial relationships that could be construed as a potential conflict of interest.
References
ASviS. (2018). Italy and the Sustainable Development Goals. ASviS Report 2018. Available online at: http://asvis.it/public/asvis/files/ASviS_REPORT_2018_ENG_web.pdf (accessed June, 2019).
Barbier, E. (1987). The concept of sustainable economic development. Environ. Conserv. 14, 101–110. doi: 10.1017/S0376892900011449
Betti, G., Marchi, M., Neri, L., and Pulselli, F. M. (2017). “Evaluating sustainability through an input-state-output framework: the case of the Italian Provinces,” in Book of Abstracts of the International Conference “Trends in Inequality: Social, Economic and Political Issues,” (Bologna), 2017:44.
Brown, M. T., Campbell, D. E., De Vilbiss, C., and Ulgiati, S. (2016). The geobiosphere emergy baseline: a synthesis. Ecol. Modell. 339, 92–95. doi: 10.1016/j.ecolmodel.2016.03.018
Brown, M. T., Cohen, M. J., and Sweeney, S. (2009). Predicting national sustainability: the convergence of energetic, economic and environmental realities. Ecol. Modell. 220, 3424–3438. doi: 10.1016/j.ecolmodel.2009.08.023
Campbell, D., Meisch, M., Demoss, T., Pomponio, J., and Bradley, M. P. (2004). Keeping the books for environmental systems: an emergy analysis of West Virginia. Environ. Monit. Assess. 94, 217–230. doi: 10.1023/B:EMAS.0000016890.70068.f7
Campbell, D. E. (1998). Emergy analysis of human carrying capacity and regional sustainability: an example using the state of Maine. Environ. Monit. Assess. 51, 531–569. doi: 10.1023/A:1006043721115
Ciommi, M, Gigliarano, C, Emili, A, Taralli, S, and Chelli, F. M. (2017). A new class of composite indicators for measuring well-being at the local level: an application to the Equitable and Sustainable Well-being (BES) of the Italian provinces. Ecol. Indicat. 76, 281–296. doi: 10.1016/j.ecolind.2016.12.050
Coscieme, L., Niccolucci, V., Giannetti, B. F., Pulselli, F. M., Marchettini, N., and Sutton, P. C. (2018). Implications of land-grabbing on the ecological balance of Brazil. Resources 7:44. doi: 10.3390/resources7030044
Coscieme, L., Pulselli, F. M., Jørgensen, S. E., Bastianoni, S., and Marchettini, N. (2013). Thermodynamics-based categorization of ecosystems in a socio-ecological context. Ecol. Modell. 258, 1–8. doi: 10.1016/j.ecolmodel.2013.02.031
Daly, H. E., and Cobb, J. B. (1989). For the Common Good: Redirecting the Economy Towards Community, the Environment and a Sustainable Future. Boston, MA: Bacon Press.
European Statistical System (2011). Final Report of the Sponsorship Group on Measuring Progress. Well-being and Sustainable Development.
Eurostat. (2018). Sustainable Development in the European Union: Monitoring Report on Progress Towards the SDGs in an EU context. Luxembourg: Publication Office of the European Union.
Giannetti, B. F., Demétrio, J. F. C., Bonilla, S. H., Agostinho, F., and Almeida, C. M. V. B. (2013). Emergy diagnosis and reflections towards Brazilian sustainable development. Energy Policy 63, 1002–1012. doi: 10.1016/j.enpol.2013.08.085
ISTAT CNEL. (2013). BES Report 2013. Rome ISTAT Publishing. Available online at http://www.istat.it/it/archivio/84348 (accessed September, 2018).
ISTAT CNEL. (2014). BES Report 2014. Rome ISTAT Publishing. Available online at: http://www.istat.it/it/archivio/126613 (accessed September, 2018).
ISTAT. (2016). BES Report 2016. Rome ISTAT Publishing. Available online at: http://www.istat.it/it/files/2016/12/BES-2016.pdf (accessed September, 2018).
Lozano, R. (2008). Envisioning sustainability three-dimensionally. J. Clean. Prod. 16, 1838–1846. doi: 10.1016/j.jclepro.2008.02.008
Ministero dell'Economia e delle Finanze. (2019). Indicatori di benessere equo e sostenibile. Allegato al Documento di Economia e Finanza 2019, Rome. Available online at http://www.dt.tesoro.it/modules/documenti_it/analisi_progammazione/documenti_programmatici/def_2019/Allegato_-_BES.pdf (accessed May, 2018).
Mitchell, C. (2000). Integrating sustainability in chemical engineering practice and education. Trans. Institut. Chem. Eng. 78, 237–242. doi: 10.1205/095758200530754
Morandi, F., Campbell, D. E., Pulselli, F. M., and Bastianoni, S. (2015). Emergy evaluation of hierarchically nested systems: application to EU27, Italy and Tuscany and consequences for the meaning of emergy indicators. Ecol. Modell. 315, 12–27. doi: 10.1016/j.ecolmodel.2015.04.001
Odum, H. T. (1988). Self-organization, transformity, and information. Science 242, 1132–1139. doi: 10.1126/science.242.4882.1132
Odum, H. T. (1996). Environmental Accounting. Emergy and Environmental Decision Making. New York, NY: John Wiley and Sons.
Pulselli, F.M., Ciampalini, F., Tiezzi, E., and Zappia, C. (2006). The Index of Sustainable Economic Welfare (ISEW) for a local authority: a case study in Italy. Ecol. Econ. 60, 271–281. doi: 10.1016/j.ecolecon.2005.12.004
Pulselli, F. M., Coscieme, L., Neri, L., Regoli, A., Sutton, P. C., Lemmi, A., et al. (2015). The world economy in a cube: a more rational structural representation of sustainability. Global Environ. Change 35, 41–51. doi: 10.1016/j.gloenvcha.2015.08.002
Pulselli, F. M., Moreno Pires, S., and Galli, A. (2016). “The need for an integrated assessment framework to account for humanity's pressure on the Earth System,” in The Safe Operating Space Treaty: A New Approach to Managing Our Use of the Earth System, eds P. Magalhães, W. Steffen, K. Bosselmann, A. Aragão, V. Soromenho-Marques (Newcastle, UK: Cambridge Scholars Publishing, 213–245.
Pulselli, R. M. (2010). Integrating emergy evaluation and geographic information systems for monitoring resource use in the Abruzzo region (Italy). J. Environ. Manage. 91, 2349–2357. doi: 10.1016/j.jenvman.2010.06.021
Pulselli, R. M., Rustici, M., and Marchettini. (2007). An integrated framework for regional studies: emergy based spatial analysis of the province of cagliari. Environ. Monit. Assess. 133, 1–13. doi: 10.1007/s10661-006-9554-5
Purvis, B., Mao, Y., and Robinson, D. (2019). Three pillars of sustainability: in search of conceptual origins. Sustain. Sci. 14, 681–695. doi: 10.1007/s11625-018-0627-5
Riccardini, F., and De Rosa, D. (2016). How the nexus of water/food/energy can be seen with the perspective of people well being and the Italian BES framework. Agricult. Agricult. Sci. Procedia. 8, 732–740. doi: 10.1016/j.aaspro.2016.02.057
Sala, S., Ciuffo, B., and Nijkamp, P. (2015). A systemic framework for sustainability assessment. Ecol. Econom. 119, 314–325. doi: 10.1016/j.ecolecon.2015.09.015
Stiglitz, J. E., Sen, A., and Fitoussi, J. P. (2009). Report by the Commission on the Measurement of Economic Performance and Social Progress. Paris: Commission on the Measurement of Economic Performance and Social Progress.
Sweeney, S., Cohen, M. J., King, D., and Brown, M. T. (2007). “Creation of a global emergy database for standardized national emergy synthesis,” in Emergy Synthesis 4: Theory and Application of Emergy Methodology, ed M. Brown (Gainesville, FL), 23.1–23.15.
Ulgiati, S., Odum, H. T., and Bastianoni, S. (1994). Energy use, environmental loading and sustainability - an energy analysis of Italy. Ecol. Model. 73, 215–268. doi: 10.1016/0304-3800(94)90064-7
UN. (2015). Transforming our world: The 2030 Agenda for Sustainable Development (UN Doc A/RES/70/1, 25 September 2015. Available online at: http://www.un.org/ga/search/view_doc.asp?symbol=A/RES/70/1&Lang=E) (accessed August, 2018).
Keywords: regional level, input-state-output framework, categorization, equality, emergy, beyond GDP
Citation: Pulselli FM, Sani A, Goffetti G, Coscieme L and Bastianoni S (2019) A Sustainability 3D Framework of the 20 Regions of Italy and Comparison With World Countries. Front. Energy Res. 7:82. doi: 10.3389/fenrg.2019.00082
Received: 30 January 2019; Accepted: 31 July 2019;
Published: 14 August 2019.
Edited by:
Joni Jupesta, SMART Research Institute (SMARTRI), IndonesiaReviewed by:
Erik Grönlund, Mid Sweden University, SwedenLubos Buzna, University of Žilina, Slovakia
Copyright © 2019 Pulselli, Sani, Goffetti, Coscieme and Bastianoni. This is an open-access article distributed under the terms of the Creative Commons Attribution License (CC BY). The use, distribution or reproduction in other forums is permitted, provided the original author(s) and the copyright owner(s) are credited and that the original publication in this journal is cited, in accordance with accepted academic practice. No use, distribution or reproduction is permitted which does not comply with these terms.
*Correspondence: Federico M. Pulselli, fpulselli@unisi.it