Novel Power Allocation Approach in a Battery Storage Power Station for Aging Minimization
 Shu Wang1
  Shuran Liu
- 1Beijing Electric Power Economic Research Institute, Beijing, China
- 2ABB Power Grids Investment (China) Ltd., Beijing, China
A grid-scale battery energy storage station usually contains multiple battery containers and corresponding electric links. Each link and battery container could become a controllable subsystem when receiving network operators' orders. Battery containers will perform differently after long-term use, especially considering a mixed utilization of new and recycled batteries. Currently the storage inflow/outflow power is distributed equally among containers. The existing power allocation and control strategy in battery energy storage stations mainly focus on batteries' capacity constraint, rather than their performance, temperature, and aging conditions. This paper proposed a novel power allocation approach for multiple battery containers in a battery energy storage station considering batteries' state of charge, temperature, and potential aging caused. This method established the mathematical modeling between battery aging with state of charge, depth of discharge, operating temperature and charging state transition times, thus the potential battery aging can be accurately calculated. The battery aging is used as the optimization objective to ensure the total battery aging occurred in all containers is minimized when executing every power dispatch order. A methodological framework is conducted based on a pure-simulation case study to evaluate the potential benefits and aging risks of different power allocation strategies. The simulation results showed this novel method helps to balance the aging, temperature, and state of charge between battery containers, leading to a more reliable, and secure operation of battery energy storage station.
Introduction
A grid-scale Battery Energy Storage System (BESS) station usually contains multiple electric links. Each electric link is composed of one Power Conversion System (PCS), one or more Battery Management System (BMS), and Battery Container (BC) (Ye et al., 2016). The PCS achieves the conversion between DC and AC power, as well as controls the charging/discharging process. The BMS is responsible for detecting the operating status of every battery cell, module, rack and container, including their voltage, current, temperature, and other data. The data monitored by BMS is uploaded to the supervisory control and data acquisition (SCADA) and energy management system (EMS) system in the BESS station's control center for protection, control, and monitoring purposes. The BC, also called battery pack, is composed of several battery racks, hundreds of battery modules, and thousands of battery cells. Each BC works together with its BMS to ensure its reliable and secure operation. The SCADA and EMS system monitors the overall status of the station and controls the operation of each PCS (Babazadeh et al., 2014; Lei et al., 2015). A grid-scale BESS station usually consists of multiple BCs, for example of a 30 MW/30 MWh station, there are 15 individual links considering the size of each battery container and PCS is 2 MWh.
When a grid-scale BESS station takes the power grid operators' order for peak management and frequency regulation, each electric link could become an individual, and controllable subsystem (Babazadeh et al., 2014; Lei et al., 2015; Ye et al., 2016). An optimal power allocation strategy is required to calculate the storage inflow/outflow power for each link, for example of P1, …, PNbc. Then the calculated power will be distributed to each PCS and corresponding BC(s) to fulfill the total power inflow/outflow requirement from the external grid, Ptotal. Therefore, an optimal power allocation and control strategy between multiple BCs is one of key factor to ensure an economic, safe and reliable operation of the BESS station. A demonstration figure of power allocation among BCs within a BESS station is shown in Figure 1.
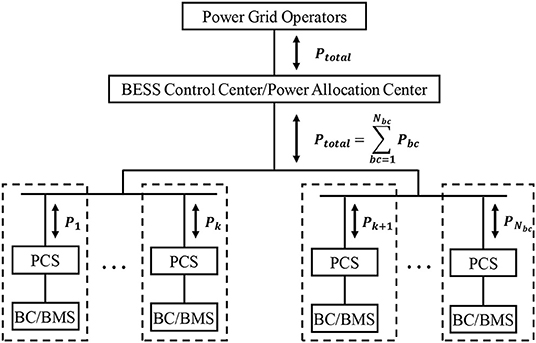
Figure 1. A demonstration figure of power allocation in BESS station.
Battery containers within a BESS station usually render performance differences, mainly due to three reasons. First reason is the quality differences during manufacturing: new-manufactured batteries will not be identical in characteristics and performances due to the various material and processing technology; Second reason is environmental condition differences during operation: due to external electrical, mechanical and thermal influencing factors, there are some differences in operating conditions of battery containers. This results in divergent aging performances and a greater inconsistency between different BCs. Thirdly, retired batteries from electric vehicles can be recycled and reused in BCs, which could greatly reduce the investment cost of BESS station and achieve the of cascade utilization of batteries. However, due to the poor quality and uneven performance of recycled batteries, there is a huge difference in operating and aging performances between recycled and new batteries (Ji, 2018; Li, 2018).
Nowadays, the BESS's control and operating strategy mainly focuses on the State of Charge (SoC) constraints of each battery container during charging and discharging (Chen et al., 2011; Li, 2018). But this strategy neglects the parameters affecting the batteries' lifetime and security, such as battery performance, operating temperature, aging behavior, and health condition. After a long-term operation under such strategy, battery aging, and lifetime reduction may occur in some BCs, even thermal overloads, and emergency events may happen afterwards.
There is only limited research on power allocation strategies between batteries containers within a BESS station. Most existing grid-scale BESS stations apply “Equal Allocation” strategy, which means an equalized charging/discharging power is distributed to each BC. However, a grid-scale BESS station needs to transition frequently between charging and discharging states to realize its functions, such as frequency regulation and peak management. This is different from EVs' power battery, which only needs to follow a simple “charge-discharge-charge” cycle. When utilizing the “Equal Allocation” strategy, every BC will transition between charging and discharging states when the BESS station takes the state change. However, frequency state transition will bring in extra losses, shorten the service lifetime and increase operation cost of BESS station. Some researchers investigated the power allocation of a hybrid storage system mixed with batteries and super capacitors, which applies super capacitors to assist the operation of batteries, avoid the frequent charging state transitions and reduce total operational costs (Ma et al., 2014; Zhang et al., 2017; Yulong et al., 2018). Some research about power allocation between BCs neglects the battery aging and impact of charging state transition on battery degradation, which, however, is a vital factor in BESS's operational cost and safe operation (Li et al., 2012; Wang et al., 2019).
Therefore, it is valuable to investigate the optimal power allocation strategy within a BESS station, allowing the charging and discharging power of each BC to be individually controlled and avoiding frequent transitions between charging and discharging states. This paper proposes an alternative power allocation method for battery containers to minimize the battery aging in a grid-scale BESS station. The mathematic modeling of battery capacity degradation is established considering the batteries' SoC, DoD, operating temperature and state transition times, thus the risk of battery aging can be comprehensively quantified. The optimization applies the total battery aging minimization as the objective and utilizes the SoC boundaries, as well as the maximum and minimum charging/discharging power as constraints. A case study is performed based on a pure-simulation study using actual BESS dispatch order and operational data. This paper contributes to the field with the following advancements:
• The integration of the SoC, DoD, the operating temperature and the state transition times into a battery aging calculation model of battery containers.
• A methodological framework based on a time-sequential simulation to evaluate the potential benefits and aging risks of different allocation strategies.
• A novel power allocation method to minimize the total battery aging by optimizing the power distribution among battery containers within a BESS station.
Proposed Methodology For Evaluating Different Allocation Strategies
Methodology Outline
To quantify the benefits and drawbacks of different power allocation strategies, the proposed methodology utilizes a time-sequential analysis to simulate the operating behaviors and aging performances of BESS. A grid-scale BESS station receives two types of BESS dispatch orders from grid operators indicating the storage inflow/outflow requirements, Preq: Automatic generation control (AGC) orders for frequency regulation are usually taken minutely, while peak shifting orders are often performed hourly. Therefore, analyses are performed through minutely iterations to simulate the BESS's operation after receiving minutely orders. The outline of the proposed methodology is shown in Figure 2.
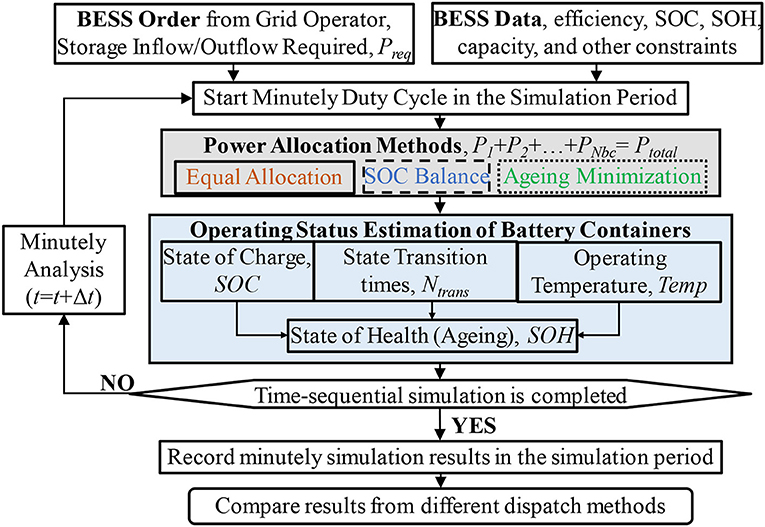
Figure 2. Methodological flowchart for evaluating different power allocation methods.
The BESS data comprises four types of data:
• Design characteristics, such as charging efficiency , discharging efficiency , energy capacity, ;
• Operating constraints, such as maximum allowable SoC , minimum allowable SoC , temperature limits, charging/discharging rate C-rate, ;
• Initial conditions, such as initial temperature, initial SoC, initial SoH of each container;
• Environmental condition, such as ambient temperature, Tamb.
After the input data are set the computations are initialized to simulate BESS's operating behavior following minutely duty cycle in the simulation period. The BESS station will try its best to fulfill the network operators' order and allow its actual inflow/outflow power Ptotal to match up the required Preq. Power allocation strategy enables a power distribution of the required power Preq among containers. As illustrated in Figure 1, the inflow/outflow power from each battery container, bc, converges into the actual inflow/outflow power of the BESS station, P1+P2+…+PNbc = Ptotal ≤ Preq.
Three power allocation methods are selected and modeled for comparison, and their complete modeling is detailed in section Power allocation methods.
1. Equal allocation: storage inflow/outflow power, Ptotal, is distributed equally among battery containers;
2. SoC balance: distributed unequally to balance the SoC of battery containers;
3. Aging minimization: distributed unequally to minimize total battery aging.
The proposed methodology integrates an operating status modeling of battery containers into the time-sequential analysis. The modeling captures the state of charge (SoC), operating temperature, T, state transition times between charging and discharging, Ntrans, of each battery container. The methodology assumes that the parameters, such as SoC, SoH, efficiency, of battery cells, modules, and racks within a container remains the same during operation, thus the internal differences between batteries in a container are neglected. A battery capacity degradation modeling, also known as aging modeling, is established to calculate the state of health (SoH) of each container. The aging modeling considers the overall impact of SoC, DoD, temperature, state transition times to calculate the amount of capacity degradation of each container in every minute, detailed in section Operating status modeling of battery containers.
The time-sequential computations are performed in minutely iterations until the analysis is completed, to capture the status changes of battery containers within the complete simulation periods.
Operating Status Modeling of Battery Containers
SoC Calculation of Battery Containers
Battery SoC calculation is always an obstacle in battery management. The main reason relies on the complex non-linear characteristics of battery systems. Thus, the batteries' charging and discharging characteristic is usually captured through experiments, and it is difficult to establish the mathematical model based on its theoretical inherent mechanism. In practice, the SOC of each battery rack, pack, or container is captured by BMS, and the quality of the SOC estimation impacts the proposed power allocation scheme.
This paper utilizes the well-known ampere-hour integral method which assumes the batteries' charging or discharging has a linear characteristic. Thus, the batteries' SoC can be calculated based on the integral of the current times the time. The battery modeling is described in (1), where Qbc(t) and Qbc(t-Δt) are the stored energy in the container bc at time t and t-Δt, (t) and (t) are the charging and discharging energy at time t for container bc, and are the charging/discharging efficiencies of the container bc, (t) and (t) are the charging and discharging power at time t for container bc. It is worth to notice that there is a mutual exclusion in between (t) and (t), as well as between (t) and (t), indicating the charging and discharging for one battery container cannot occur at the same time.
In the Equation (1), “+” indicates charging while “-” indicates discharging. The battery modeling is subjected to its capacity constraints and C-rate constraints as illustrated in Equation (2)–(5), where (t) is the faded capacity of battery container bc after potential degradation, is the C-rate of battery container bc when charging or discharging.
The state of charge of each battery container, SoCbc, can be described in (6), where is the rated energy capacity of the container bc. Thus, SoC → 1 and SoC → 0 indicates the battery containers tend to be fully charged or deep discharged, respectively. The depth of discharge of each battery container, DoDbc, indicates the percentage of the discharge to the rated capacity, which can be expressed by Equation (7).
Thermal Modeling of Battery Containers
A battery system includes completed equipment and system for heating ventilation air conditioning (HVAC). The battery containers usually adopt a forced air-cooling design, without the requirement of external cooling water. The HVAC system is designed with 20% redundant cooling power, with aim to keep the core temperature of each battery cell between 18° and 28°C. Meanwhile, the control system works together with BMS to monitor the operating temperature of every battery cell to ensure the consistency of battery temperature, aging, and operating conditions between cells. The HVAC system is designed to ensure the temperature difference between different battery modules and racks to be within 2°C. In this study, this temperature difference within containers is neglected.
To simulate the temperature variation of battery container under different operating condition (charging/discharging power, ambient temperature), a thermal modeling of battery container is established and described in Equation (8), where Tbc(t) is the temperature of battery container bc at time t, ΔTamb0 = Tamb(t)-Tamb(t-Δt) indicating the ambient temperature variation within Δt, PHVAC,bc(t) is the cooling power of air conditioning system of the container bc, Pheating,bc(t) is the heating power occurred within the container bc during charging or discharging, Cth,bc is the thermal mass of the battery container bc.
State Transition Calculation of Battery Containers
As discussed before, frequent transitions between charging, and discharging state of battery container would produce extra losses, shorten batteries' service lifetime and increase operation costs of BESS station. Therefore, it is necessary to capture the total state transition times Ntrans,bc(t) of the container bc as expressed in Equation (9) where CSTbc(t) is the binary variable indicating whether the state transition between charging and discharging occurred from t-Δt to t. The charging state transition CSTbc(t) of the battery container bc at time t is captured in Equation (10). CSTbc(t) indicates whether the container bc transits between charging and discharging states, where CSTbc(t) = 1 indicates there is a state transition between charging and discharging state of battery container from the t-Δt to t, while CSTbc(t) = 0 indicates there is no state transition.
The statebc(t) expresses the charging/discharging state of bc at t, as shown in Equation (11) where statebc(t) = “1” indicates charging, “0” indicates standby, and “−1” indicates discharging. Therefore, the when the product of statebc(t) and statebc(t-Δt) equals to −1, state transition between charging and discharging occurs. To avoid reducing the overall efficiency of BESS station, it is assumed that the state of any battery container statebc(t) cannot be contrary to the state of BESS station stateBESS(t), as indicated in equation (12).
Aging Modeling of Battery Containers
The power allocation strategy within a BESS station usually neglects battery degradation and the aging difference between containers. Thus, it is vital to estimate the battery degradation for the operation and maintenance of BESS stations. This degradation process depends on multiple factors, such as C-rate, DoD, SoC, ΔSoC, temperature, humidity and charging state transitions (Wang et al., 2016).
In this study, an aging modeling for each battery container is established to calculate its capacity degradation considering several influential parameters of SoC, DoD, temperature and state transitions. The battery degradation usually considers not only the shelf degradation, but also the cycle degradation (aging during charging or discharging cycling). The shelf degradation affects the calendar lifetime of the battery due to normal corrosion process during storage, which is independent from its cycling behavior. The cycle degradation affects the cycling lifetime of the battery, indicating the number of charging or discharging cycles that the battery can tolerate before the end of its lifetime.
Derived from accelerated aging tests, a shelf lifetime model and a cycle lifetime model for LiFePO4 (LFP) batteries are established in Equation (13) and (14), respectively (Stroe, 2014; Stroe et al., 2016).
In Equation (13), ΔEshelf,bc is the capacity fade of a battery container due to shelf degradation at standby condition, SoCst,bc is the SoC value of container bc at standby, Tst is the operating temperature at standby in Kelvin degrees, tst is the standby time in months. In equation (14), ΔEcyc,bc is the capacity fade of a battery container due to cycle degradation, SoCav is the average SoC during each charging/discharging cycle, Dcyc is the depth of the cycle, Ncyc is the number of cycles.
Typically, the cycle life is calculated as the number of cycles that the battery can be repeatedly charging and discharging in a specified DoD. However, the BESS stations are normally operated under irregular cycles, such as AGC orders. Thus, it is essential to capture the battery degradation considering irregular cycles. In this modeling, the degradation increase of each battery container ΔEbc in each time interval Δt is calculated as the sum of shelf degradation ΔEshelf, half of cycle degradation 0.5ΔEcyc, and the degradation due to state transition ΔEtrans as shown in (15). All three degradations are measured as a percentage reduction in battery usable capacity.
The battery lifetime model is performed for every time step to calculate the shelf aging ΔEshelf, cycle aging ΔEcycle, and the aging due to state transition ΔEtrans occurred within each time step using the calculated operational results, such as temperature, SOC and DOD. Some parameters in (13)–(15) are provided in (16), where 0.5 and Ncyc = 1 assumes that each charging or discharging process within Δt consumes half of one full cycle degradation, the parameter β is used to account for the additional capacity fade for each state transition between charging and discharging.
Figure 3 indicates the degradation vs. DoD curve. For example, if the battery container bc is discharged from 10 to 90% DoDbc in one period with a SOCav = 0.5 and no state transition, the battery degradation ΔEbc is 0.012% at 15°C, 0.014% at 25°C, 0.034% at 35°C. The faded capacity of each battery container (t) can be calculated in (17) by subtracting the total capacity fade occurred in every step from the rated capacity. The state of health of each battery container, SoHbc, can be described in (18).
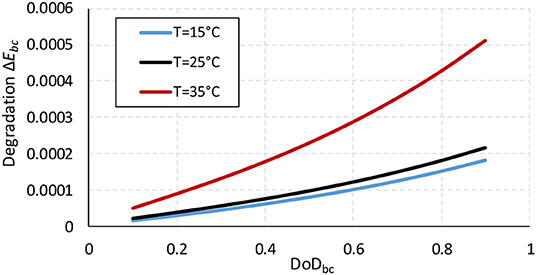
Figure 3. Battery degradation vs. DoD curve under different operating temperatures.
Power Allocation Methods
This section describes the presented three power allocation methods and their corresponding objective functions, as well as the constratints. In “SoC Balance” and “Aging Minimization” methods, a single-objective multivariate non-linear optimization is performed for every time step after receiving dispatch orders from grid operators. The “optimization” toolbox in MATLAB is used in the non-linear optimization as the solver. The optimization helps to optimally distribute the required inflow/outflow power Preq among BCs, and thus obtain the inflow/outflow power of each container, P1, …, PNbc.
Equal Allocation
“Equal Allocation” method enables the total storage inflow/outflow power of the BESS station Ptotal(t) to be distributed equally among battery containers. Thus, every container store or release at the same charging or discharging power at every time step which can be described as Equation (19).
Due to the inconsistency of battery containers' performances, such as charging/discharging efficiency or aging speed, “Equally Allocation” method may lead to a greater difference in SoC or aging condition between containers. This requires a more frequent maintenance for SoC balance or battery health check, which will result in much higher operation and maintenance costs.
SoC Balance
“SoC Balance” method is implemented to minimize the variance σ2(t) of battery containers' SoC values at time t. Thus, this method tends to balance the SoC of battery containers during normal operation of BESS station. This will significantly reduce the possibility of SoC imbalance situations, however the battery aging is totally neglected in this method. The objective function of this allocation method is modeled by Equation (20), where is the average of battery containers' SoC values at time t.
Aging Minimization
“Aging Minimization” method is implemented to minimize the total aging ΔEtotal(t) occurred in all battery containers at time t. This method considers the impact of DoD and state transition of BCs on battery degradation. By using this method, the BESS station can optimally control its containers and PCS to fulfill the total power inflow/outflow requirement from the main grid with a minimized battery aging. Therefore, the operation cost of the BESS station is also greatly reduced by less frequent battery replacement and maintenance. The objective function of this “Aging Minimization” method is modeled by (21), where the battery degradation ΔEbc(t) is described in section State transition calculation of battery containers.
Optimization Constraints
The optimizations are subject to the following constraints:
1. Power Balance: when a BESS station is taking the order from the grid, the total inflow or outflow power Ptotal from BCs should be equal to or less than the required Preq.
2. Power Constraints: each container has its upper and lower power constraints to charge/discharge. This paper assumes that the rated charging and discharging power equals to the C-rate of the battery.
3. SoC Constraints: the batteries are usually operated between a maximum and minimum allowable SoC range to avoid them to be overcharged or overdischarged, as well as to extend their service lifetime.
Simulation Results
Case Study Formation
The proposed methodology is applied on a case study of an example 30 MW/30 MWh BESS station with a total number of 15 battery containers. An example of the network topology of the target BESS station is similar to the demonstration in Figure 1. Each battery container is designed with a rated power/capacity of 2 MW/2 MWh for applications on both frequency regulation and peak management. Each PCS is rated at 2 MW power to allow a 1C charging or discharging rate of the BESS station. The C-rate of each battery container is matched with the PCS, indicating a maximum charging/discharging power PC-rate = 2MW. The maximum and minimum operating voltage of batteries is 714 and 1,000 Volts. The maximum and minimum SoC limits for batteries is SoCMax = 0.9 and SoCMin = 0.1. The time-sequential computations are performed in minutely iterations over a simulation horizon of 15 days in May.
Six scenarios are simulated considering three different power allocation strategies as well as the different BESS properties as described in Table 1. Base case scenario utilizes the existing “Equal Allocation” method with the same initial SoC values at 0.5 and the same charging/discharging efficiency at 90%, ηch = ηdisch = 90%, for all fifteen battery containers. Sc-1, Sc-2, and Sc-3 implement three power allocation strategies when three different initial SoC values of 0.3, 0.5, 0.7 are considered for battery containers bc = 1–5, 6–10, 11–15 separately, where SoC1−5(t0) = 0.3, SoC6−10(t0) = 0.5, SoC11−15(t0) = 0.7. Sc-4, Sc-5, and Sc-6 consider three different charging/discharging efficiencies of 89.5, 90, 90.5% for battery containers bc = 1–5, 6–10, 11–15 separately, where = = 89.5%, = = 90%, = = 90.5%. The simulation scenarios are well-designed to investigate the difference and impact of different power allocation strategies under different initial SOC values and different internal properties (charging/discharging efficiency) on BESS operation and performances.
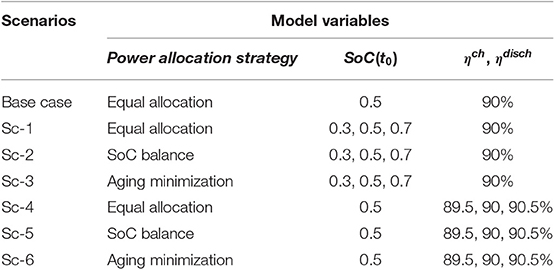
Table 1. Simulation scenarios considering different power allocation methods and BESS's properties.
Simulation Results
The minutely storage inflow/outflow orders received from grid operators within 15 days (21,600 min) are shown in Figure 4. As seen from the figure, the grid dispatch order is updated every minute to simulate the AGC order for frequency regulation proposes. The BESS requires a frequent transition between charging and discharging states, as well as short-term operation at maximum charging/discharging power for peak management proposes. Under those frequent and rapid variation of storage inflow/outflow power, battery containers produce divergent outputs under small performance differences within a short period of time.
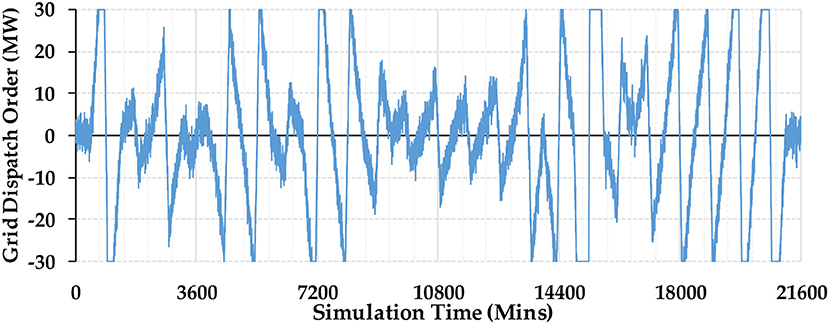
Figure 4. Minutely BESS power inflow/outflow orders from grid operators, Preq.
As shown in Figure 5, when the charging/discharging efficiencies of some BCs have a small deviation of 0.5% from the standard 90%, the “Equal Allocation” strategy enables the SoC differences to become larger over time. For example of Sc-4 in Figure 5A, the SoC in containers range from 0.68 to 0.28 at the end of simulation period (15 days) when a ±0.5% deviation from 90% is considered in charging/discharging efficiencies. This result indicates that small differences in battery containers' capability (such as efficiency) will lead to major performance differences after long or even short-term operations. This requires a more frequent SOC balancing maintenance within BESS stations, which will significantly reduce the available hours and operation time of BESS, and increase forced outage hours and more maintenance costs. However, when “SoC Balance” and “Aging Minimization” methods are applied, Sc-5 and Sc-6 achieved very similar SoC outputs as shown in Figure 5B. Although different internal properties remained in different BCs, these two approaches allows the SoCs of different containers to be balanced.
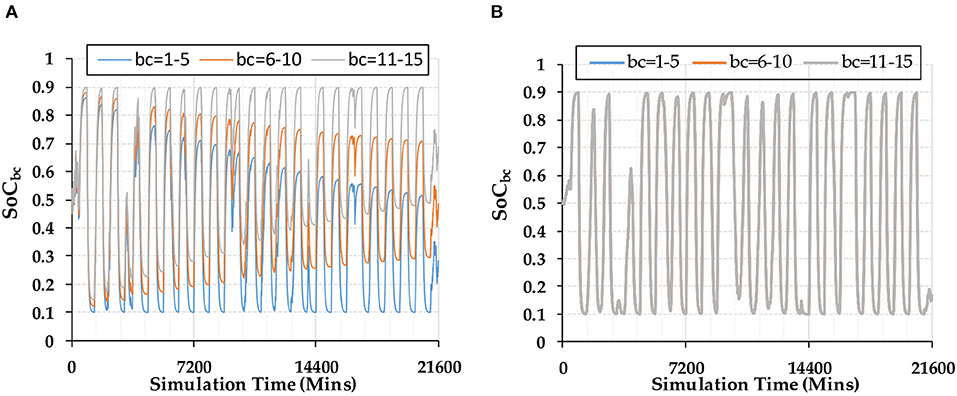
Figure 5. SoC outputs of Sc-4 (A) and Sc-5, 6 (B) in 15 days.
Sc-1, 2, and 3 allocate different initial SoC values to battery containers, SoC1−5(0) = 0.3, SoC6−10(0) = 0.5, SOC11−15(0) = 0.7. Figure 6 indicates the SoC values under different scenarios in the first 800 min, which helps to see the process of SoC convergence and variation. As indicated in Figure 6A, “Equal Allocation” method only allows the same charging/discharging power into all containers, thus the SoC differences remain at 0.2 from the beginning to the end of simulation. As indicated in Figure 6B, Sc-2 takes the balance of SoC values as the optimization objective, thus SoC divergence quickly converges within 400 min by distributing different inflow/outflow power to battery containers. As indicated in Figure 6C, Sc-3 tends to minimize the aging occurred in each minute, thus the variation of SoC in Sc-3 is much smoother than Sc-1 and Sc-2 which helps to produce a smaller DOD and battery aging. The SoC values in Sc-3 start to converge from 400 min mainly because the maximum inflow request from 400 min forces all containers to be fully charged. But the trend indicated Sc-3 tends to balance the SoCs, but also considered the aging effects during this convergence. Thus, “Aging Minimization” method choose to aggregate SoC values in a more smooth and gradual way, leading to a smaller DoD when executing grid orders.
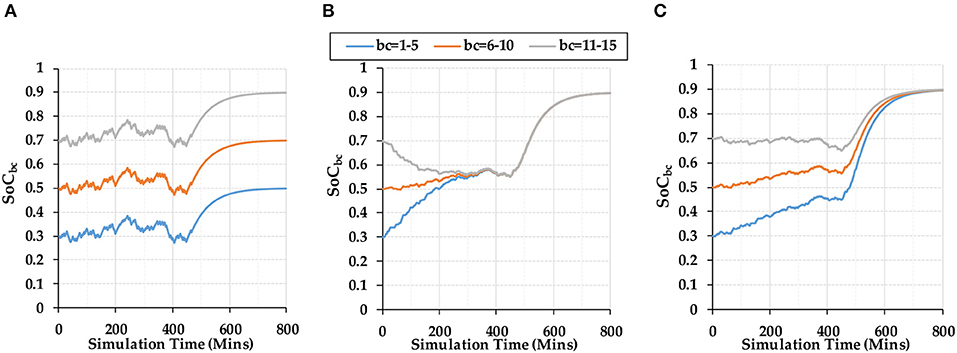
Figure 6. SOC outputs of Sc-1 (A), Sc-2 (B), and Sc-3 (C) in the first 800 min.
When utilizing “Equal Allocation” strategy, the maximum allowable inflow and outflow power of entire BESS station is constrained by the container with the largest SOC and the smallest SOC, respectively. Therefore, SOC inconsistency between containers will seriously limit the capability of entire BESS station, leading to more occasions that the grid order is not fully satisfied. As indicated in Table 2, the SOC divergence in Sc-1 leads to a greatly increased loss of required energy (LORE) which indicating the difference between the grid order Preq and the total supplied energy Ptotal. Sc-2 and Sc-3 balances the SOC values between containers, thus avoid the increased unsupplied energy LORE. The comparison of Sc-2,5 and Sc-3,6 suggests “SOC Balance” method produces a slightly more aging Cfade but a smaller variance σ2(t) of SOC values. These results testify the feasibility of both “SOC Balance” and “Aging Minimization” methods and reflect their different objectives in the optimization.
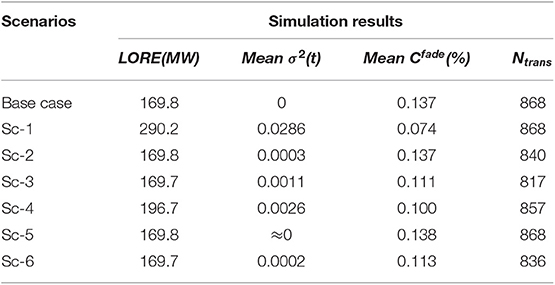
Table 2. Simulation results of modeled scenarios.
Conclusions
This paper proposes a novel power allocation strategy for a grid-scale BESS station to achieve an optimal power distribution among battery containers. The proposed method applies the total battery aging as the optimization objective, to minimize the aging occurred in all battery containers after receiving every grid dispatch order.
A case study based on a 30 MW/30 MWh BESS station with a total number of 15 battery containers is used to incorporate the internal properties of BESS and the minutely dispatch orders from grid operators. A time-sequential simulation is performed to assess the impact of the power allocation options on BESS performance and battery aging.
The simulation results indicated much more balanced SOC values can be obtained under battery performance differences, such as efficiency deviation (Sc-4, 5, and 6) and SOC divergence (Sc-1, 2, and 3). Compared to “SoC Balance” method, the “Aging Minimization” method helps to reduce the battery aging by 15%, and the charging/discharging state transition times by around 3%. This will significantly reduce the maintenance costs and battery replacement costs of BESS station. Compared to the traditional “Equal Allocation” method, the other two methods enable the balancing of SoC values between BCs, which will help the BESS station to maximize its capability to charge or discharge electrical energy, to unlock the constraints of maximum and minimum SoC values, thus the loss of required energy (LORE) is greatly reduced. Hence, the “Aging Minimization” method appears to be the best choice considering the three main aspects: aging costs, SoC balance, and the capability to execute grid dispatch order.
Further work is required to quantify more accurately the battery capacity degradation, maintenance, and operational costs due to aging. Additional BESS scenarios, such as mixed use of new and recycled batteries, different internal properties or different capacities of BCs, will further validate the value and accuracy of the proposed method.
Data Availability Statement
The datasets generated for this study are available on request to the corresponding author.
Author Contributions
SL and ShuW: conceptualization and writing—original draft preparation. SL: methodology. FY and ShuoW: writing—review and editing. XB and CY: supervision.
Funding
This research was funded by Beijing Electric Power Economic Research Institute, under research project Secondary Design of Battery Energy Storage Station Considering BESS Operation Strategy (SGTYHT/18-JS-206).
Conflict of Interest
SL, ShuoW, and CY were employed by the company ABB Power Grids Investment (China) Ltd.
The remaining authors declare that the research was conducted in the absence of any commercial or financial relationships that could be construed as a potential conflict of interest.
References
Babazadeh, H., Asghari, B., and Sharma, R. (2014). “A new control scheme in a multi-battery management system for expanding microgrids,” in ISGT (Washington, DC), 1–5. doi: 10.1109/ISGT.2014.6816484
Chen, C., Duan, S., and Cai, T. (2011). Optimal allocation and economic analysis of energy storage system in microgrids. IEEE Transact. Power Electron. 26, 2762–2773. doi: 10.1109/TPEL.2011.2116808
Ji, Y. (2018). Research on energy management and coordinated control strategy of battery storage power station. M.S. thesis, School of Electrical and Electronic Engineering, NCEPU, Beijing, China.
Lei, T., Wang, T., Yu, H., and Liu, H. (2015). “Power optimization allocation strategy for energy storage station responding to dispatch instruction,” in 2015 International Symposium on Smart Electric Distribution Systems and Technologies (EDST) (Vienna), 177–182.
Li, D. (2018). Modularly and independently controlled secondary use battery energy storage system. M.S. thesis, School of Electrical Engineering, Beijing Jiaotong University, Beijing, China.
Li, P., Hu, Y., and Xue, J. (2012). “Research on the wind power active power control strategies and the energy storage device optimal allocation,” 2012 IEEE International Conference on Power System Technology (POWERCON) (Auckland) 1–5.
Ma, Z., Jiang, J., Wen, F., Zheng, L., and Wei, S. (2014). Design of equilibrium strategy of echelon use li-on battery pack for energy storage system. Automation Electr. Power Syst. 38, 106–117. doi: 10.7500/AEPS20130330001
Stroe, D. (2014). Lifetime models for lithium ion batteries used in virtual power plants. Ph.D. thesis, Dept. of Energy Technology, Aalborg University, Aalborg, Denmark.
Stroe, D., Swierczynski, M., Stroe, A., Laerke, R., Kjaer, P., and Teodorescu, R. (2016). Degradation behavior of lithium-ion batteries based on lifetime models and field measured frequency regulation mission profile. IEEE Transact. Industry Appl. 52, 5009–5018. doi: 10.1109/TIA.2016.2597120
Wang, D., Xue, J., Ye, J., Xu, Q., and Fei, J. (2019). Economic optimization scheduling strategy for battery energy storage system based on particle swarm optimization. Renew. Energy Resour. 37, 714–719. doi: 10.12783/dteees/iceee2018/27818
Wang, Y., Zhou, Z., Dotterud, A., Zhang, K., and Ding, Q. (2016). Stochastic coordinated operation of wind and battery energy storage system considering battery degradation storage system considering battery degradation. J. Mod. Power Syst. Clean Energy 4, 581–592. doi: 10.1007/s40565-016-0238-z
Ye, J., Xue, J., Wu, F., Yang, B., and Liu, H. (2016). Economic optimization dispatching strategic of battery energy storage station. Chin. J. Power Sour. 40, 365–369. doi: 10.3969/j.issn.1002-087X.2016.02.039
Yulong, Z., Weida, W., Changle, X., Hui, L., and Langari, R. (2018). Research and bench test of nonlinear model predictive control-based power allocation strategy for hybrid energy storage system. IEEE Access. 6, 70770–70787. doi: 10.1109/ACCESS.2018.2876440
Keywords: battery aging, battery storage power system, power allocation, time-sequential simulation, optimization
Citation: Wang S, Liu S, Yang F, Bai X, Wang S and Yue C (2020) Novel Power Allocation Approach in a Battery Storage Power Station for Aging Minimization. Front. Energy Res. 7:166. doi: 10.3389/fenrg.2019.00166
Received: 31 October 2019; Accepted: 23 December 2019;
Published: 17 January 2020.
Edited by:
Soorathep Kheawhom, Chulalongkorn University, ThailandReviewed by:
Michael C. Georgiadis, Aristotle University of Thessaloniki, GreeceSorin Olaru, CentraleSupélec, France
Copyright © 2020 Wang, Liu, Yang, Bai, Wang and Yue. This is an open-access article distributed under the terms of the Creative Commons Attribution License (CC BY). The use, distribution or reproduction in other forums is permitted, provided the original author(s) and the copyright owner(s) are credited and that the original publication in this journal is cited, in accordance with accepted academic practice. No use, distribution or reproduction is permitted which does not comply with these terms.
*Correspondence: Shuran Liu, shuran.liu@cn.abb.com