A study of aerosol pollution episode due to agriculture biomass burning in the east-central China using satellite data
 Sonoyo Mukai
 Makiko Nakata
 Masayoshi Yasumoto
 Itaru Sano
 Alexander Kokhanovsky
- 1School of Applied Information Technology, The Kyoto College of Graduate Studies for Informatics, Kyoto, Japan
- 2Faculty of Applied Sociology, Kinki University, Higashiōsaka, Japan
- 3Faculty of Science and Engineering, Kinki University, Higashiōsaka, Japan
- 4EUMETSAT, Darmstadt, Germany
Aerosol distributions in East Asia are complicated owing to both natural factors and human activities. In recent years, influence of yellow sand and biomass burning aerosols generated by agricultural biomass burning (ABB) has been noted upon the severe air pollution episodes. This work intends to make the retrieval algorithm more efficient and to make the aerosol model more tractable as far as heavy air pollution caused by ABB is concerned. Aerosol retrieval in the hazy atmosphere is achieved based on radiation simulation method of successive order of scattering (MSOS) for the moderate resolution imaging spectroradiometer (MODIS) on AQUA data. The retrieved aerosol properties agree well with the ground measurements and numerical model simulations. Multi-angle observations with the polarization and directionality of the Earth's reflectances (POLDER) on the polarization & anisotropy of reflectances for atmospheric sciences coupled with observations from a lidar (PARASOL) are available for aerosol retrieval from a mixture of cloud and haze, and many potential applications of MSOS involving polarization information are expected to be available for cloud as well as aerosol episodes.
Introduction
It is well known that satellites play an important role in Earth observations on a global scale, and that they perform a systematic monitoring of the Earth with various spatial, spectral, and temporal resolutions. In addition, observations from space are particularly useful for heavy aerosol episodes; when extreme concentrations of aerosols in the atmosphere prevent aerosol monitoring with surface-level photometry, satellites can be used to observe the Earth's atmosphere from space. Large-scale air pollution is likely to continue because air pollution becomes severe due to both the increasing emissions of anthropogenic aerosols and the complicated behavior of natural aerosols. Aerosol distribution in East Asia is complicated and the concentration of aerosols is large with the famous yellow sand dust and small anthropogenic particles generated by emissions from human activities (Kahn et al., 2004). For instance, in recent years biomass-burning aerosols (BBA) generated by agricultural biomass burning (ABB) have influenced the severe haze episodes (Lee and Kim, 2010; Mukai et al., 2014). In this manner, increased emissions of anthropogenic particles cause concentrations of serious air pollution. In particular, large cities in eastern and south-western China have experienced heavy haze episodes over the past 30 years (Nakata et al., 2015). However, the aerosol properties of these events are still insufficiently understood.
This study is aimed at developing efficient algorithms for remote sensing of aerosol, especially for severe aerosol episodes. Our research group has been retrieving aerosol characteristics based on satellite data (Mukai et al., 1992), ground measurements (Sano et al., 2003; Mukai et al., 2005), and numerical model simulations (Mukai et al., 2008). We take advantage of the comprehension of Asian aerosols, because our ground observation site is located at the megacity of Osaka in Japan. All the instruments are collocated in a 10-m area.
It is natural to consider that incident solar light interacts multiply with the atmospheric aerosols due to the optically thick radiation field in such a heavy haze episode. Accordingly efficient and practical algorithms for radiation simulation are required to retrieve aerosol characteristics especially in heavy aerosol episodes. Here the radiation field is described with the four-dimensional Stokes vectors. The method of successive order of scattering (MSOS), which is available for the simulated radiation reflected from the optically semi-infinite atmosphere, has been already examined in our previous studies with the scalar form (Mukai et al., 2012b, 2014). Now we intend to make our MSOS-scalar code more efficient and practical, and further develop the MSOS-vector form. The biomass burning episode observed by Aqua/MODIS and PARASOL/POLDER in east-central China can be well simulated using a semi-infinite model. The aerosol model is made more tractable as far as BBA due to ABB is concerned. The retrieved results are evaluated with the ground measurements NASA Aerosol Robotic Network (AERONET) and an earth system model, named “MIROC-ESM” (Watanabe et al., 2011).
Agriculture Biomass Burning
The 5th IPCC report on global warming points out a warming effect of black carbon aerosols against the cooling effect of other kinds of aerosols (IPCC, 2013). Black carbon aerosols over the south-western part of the Atlantic Ocean are mostly due to the biomass burning in South America (Freitas et al., 2005; Evangelista et al., 2007). ABB is known to emit lots of aerosols, especially BBA and gaseous particles (Xue et al., 2012). ABB is a global phenomenon and provides global effect on the environment, climate, health, radiation forcing and so on. In this study, ABB in the east-central China is taken into account. There the ABB of straw and crop residues is done every year from May to October and it peaks in June (Li et al., 2010).
Figure 1A presents the distribution of hotspots (denoted by the red dots) accumulated during June in 2012 over the area within 15–50°N latitude and 95–145°E longitude provided by the Rapid Response System (MCD14 Collection 5.1) of MODIS (King et al., 1992). Figure 1A shows that the hot spots exist all over South-East Asia and especially concentrate around Shandong in this season. Our present study is focused on this area, the east-central China [30°N, 45°N] and [110°E, 125°E], shown by a square surrounded by a solid line in Figure 1A. Figure 1B presents the monthly average of aerosol optical thickness at a wavelength of 0.46 μm [AOT (0.46 μm)] in June of 2012 (MYD08_ Collection 5.1). It is clear from Figure 1B that the values of aerosol optical thickness increase as the distance from the center of ABB-area increases. This fact suggests that soot particles are mixed with other species as anthropogenic pollutants around urban cities during transportation on the wind (Li et al., 2010), particularly in large cities in eastern and south-western China that have experienced heavy haze episodes (dense concentrations of atmospheric aerosols). However, the aerosol properties of these events are still insufficiently understood. Here we deal with the aerosol retrieval in haze episodes influenced by BBA around urban areas in China, as shown in Figure 1.
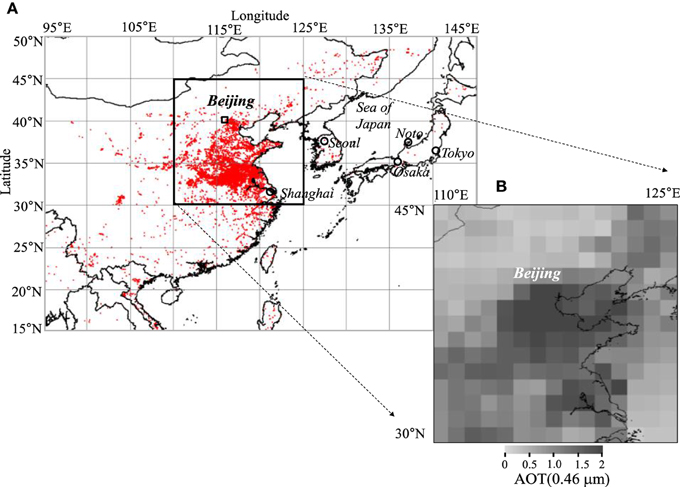
Figure 1. (A) Distribution of hot spots accumulated over June in 2012 in the East Asia (MCD14 Collec.5.1). (B) Monthly averaged AOT (0.46 μm) in June of 2012 in the east-central China (MYD08Collec. 5.1).
Aerosol Retrieval
Target Area
Figure 2 shows satellite products over the area referred to in Figure 1B. The left three columns in Figure 2 are derived from Aqua/MODIS observations: they respectively present color composite images, AOT (0.46 μm) distribution, and clear-cloud distinction map (MYD04 L2 Collection 6) from 16th to 22nd June, 2012. The right-hand side panels in Figure 2 present the simultaneously observed color composite images by PARASOL/POLDER. Since the spatial resolutions of both sensors are different from each other, simultaneous acquisition in relation to the narrow area in particular is rare. A square symbol (□) denotes the AERONET Beijing site (40°N, 116.4°E), and the points-A (40.1°N, 116.5°E) and B (37.6°N, 120.5°E) are the targets for aerosol retrieval in this study. The point-A is almost the same as the AERONET Beijing site. The small red dots in the lower part of the MODIS images denote hot spots, indicating ABBs. Figure 3 presents AOT (0.46 μm) at the points-A and B from 16th to 22nd June, 2012. The atmosphere over the points-A and B are clear on 16th and 17th June, and opaque on 19th and 21st June. No AOT data is available on the 20th due to contamination with cloud. Assuming values of AOT (0.46 μm) ≥5.0 as the criteria for semi-infinite atmosphere (Mukai et al., 2012b), both target points A and B lie beyond this criteria and are treated as aerosol episodes. Such criteria that AOT (0.46 μm) ~5.0 correspond to a semi-infinite atmosphere with respect to the reflected intensity from the top of atmosphere are validated by the radiation simulation in Appendix on Supplementary Materials. At a glance, this episode is partly caused by the biomass burnings represented by the hot spots, suggesting transportation of dense air parcels from the southeast (where ABB usually occurs during this season) to the northwest.
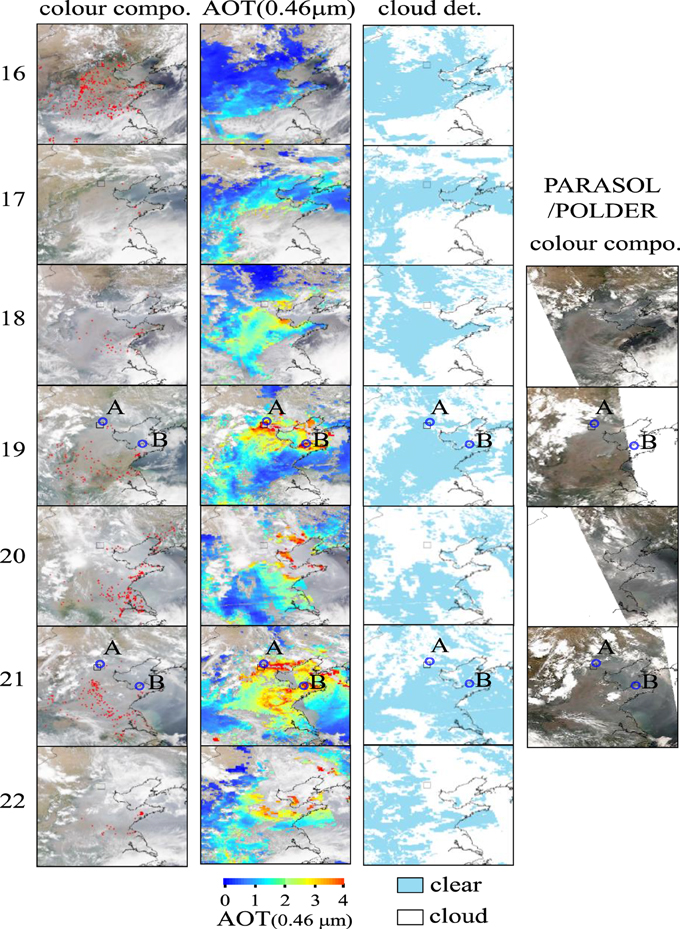
Figure 2. Aqua/MODIS images over east-central China from 16th to 22nd June, 2012, the left three columns presenting color composite images, distribution of AOT (0.46 μm) and cloud detection (MYD04 L2 Collection 6), and PARASOL/POLDER images in the right-hand side panels. The symbol (□) indicates the position of the AERONET Beijing site and points-A and B denote the targets for aerosol retrieval.
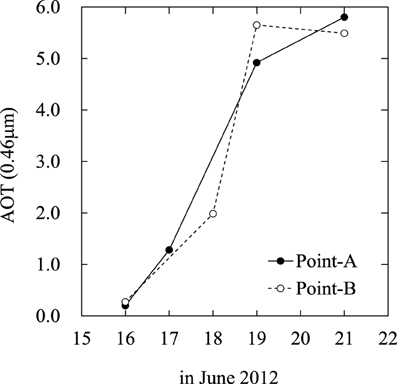
Figure 3. AOT (0.46 μm) at points-A (the solid line) and B (the dashed line) from 16th to 22nd June in 2012.
Radiative Transfer Method: MSOS
The successive scattering technique for the optically semi-infinite atmosphere model (van de Hulst, 1963; Sobolev, 1968; Uesugi and Irvine, 1969, 1970; Kokhanovsky, 2002) is available for radiation simulation for aerosol episodes. Here we describe the radiation simulation algorithms in a semi-infinite polarized radiation field. Consider a radiation of flux F in the direction (μ0, ϕ0) incident on the top of a semi-infinite atmosphere. Let the diffusely reflected radiation intensity vector be I(Ω); decomposing I(Ω) into the successively scattered intensity I(n : Ω),
The variable (Ω) represents the direction of radiation given by (Ω) = (μ, ϕ), d(Ω) = dμ/d(Ω) where μ is the cosine of the zenith angle θ (μ = cos θ) and ϕ is the azimuth angle. The diffusely reflected intensity I(Ω) denotes the emergent intensity from top of atmosphere (TOA) and it is derived by using reflection matrix ,
where the integration covers the inward hemisphere and the reflection matrix is expressed by the Stokes parameters (I, Q, U, V). Also we can define the nth order reflection in Equation (2) as:
where n is the number of scattering. The matrix is the nth order reflection describing the radiation emerging at TOA after scattering n times within the atmosphere, i.e., reflection can be calculated as the Neumann series of the nth order of reflectance .
The equation for the nth order of reflection will be derived here as follows. Now, let:
where E is the unity vector (1,1,1,1). We have an equation for as
Similarly, we have the second-order one as,
Generally, the equation for the nth order (n ≥ 3) can be derived in a similar manner as shown above.
Thus the polarized radiation field reflected from the optically semi-infinite atmosphere is calculated based on Equation (3) utilizing Equations (5–7). The space-borne sensors measure the increasing radiance at TOA, namely the reflectance () from the Earth's atmosphere. We name this technique “method of successive order of scattering” (MSOS) as a successive scattering method for semi-infinite atmosphere, which treat with a large number of scattering (n >> 1) and an asymptotic form is proposed for n > n* >> 1 (Mukai et al., 2012a). The standard successive scattering is fundamentally related to the probabilistic approach to the theory of radiative transfer. It takes long description to show a complete derivation process of MSOS. A work (Mukai et al., 2012a) is helpful for interested readers.
Aerosol Model
The single-scattering matrix in the previous section directly depends on the aerosol properties. The first and/or final step of aerosol retrieval is the setting up of and/or deriving the aerosol model. According to the automatic classification of accumulated NASA/AERONET data, atmospheric aerosols have been classified into six categories (Dubovik et al., 2002; Omar et al., 2005) as follows:
1. “desert dust” (DD) is assumed to be mostly mineral soil,
2. “biomass burning” (BB) is an aged smoke aerosol consisting primarily of soot and organic carbon,
3. “rural” (RU) is referred to be clean continental aerosol,
4. “continental pollution” (CP) represents an anthropogenic aerosol consisting of various species as sulfates (SO), nitrates (NO), OC, ammonium (NH) and soot,
5. “polluted marine” (PM) consists primarily of sea-salt with traces of polluted continental species, and
6. “dirty pollution” (DP) consists of the same but significantly larger amount of species as CP.
Table 1 presents the complex refractive indices and size distribution parameters for six aerosol types compiled by AERONET measurements are shown in the left side, and right side, respectively. The classification with respect to Asian aerosols is proposed using the measurements at Asian AERONET sites alone as (Ct−1, −2, −3, −4, −5, −6) (Lee and Kim, 2010). In this Asian classification, Ct-1, −2, −3, and −4 can be considered as variations of the global-CP type, and the other two categories Ct-5 and -6 are referred to as dusty aerosols of the global-DD type. Then in this study, global CP and DD types are assumed to be basic Asian aerosols, and the BB type is considered for fire breaking as ABB or forest fire.
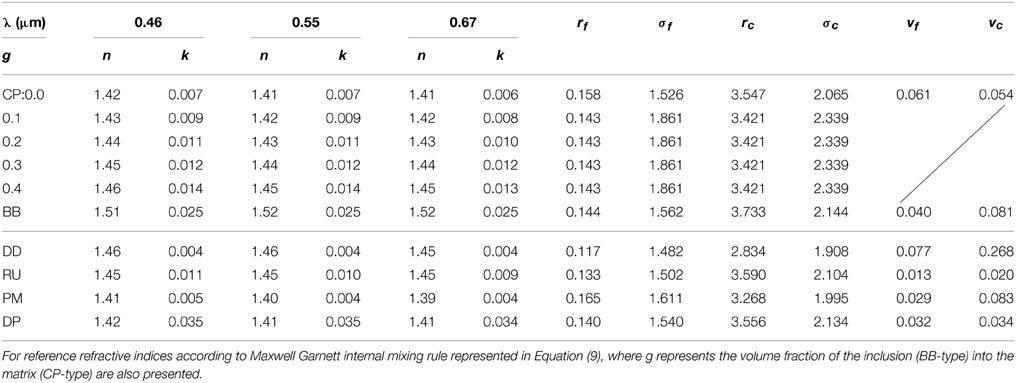
Table 1. The complex refractive indices mλ = nλ−kλ i at a wavelength λ, and size distribution parameters for six aerosol types compiled by AERONET measurements are shown in the left side, and right side, respectively.
The size distributions of these six aerosol types based on AERONET measurements have two modes for small (f: fine) and large (c: coarse) particles, and a bimodal log-normal distribution is assumed as:
Here, the left-hand side term represents the volume particle size distribution. The parameters Vf, rf, and σf are respectively the volume concentration, mode radius, and standard deviation of fine mode particles. The corresponding parameters for coarse mode particles are Vc, rc, and σc. It is self-evident that the six parameters are necessary for the definition of aerosol size, and also that six parameters are excessive for retrieving the optimized size of aerosols. Therefore, proper simplification is required for the aerosol size distribution function. We propose an approximated form of the same bimodal log-normal distribution function in Equation (8) but for the constant averaged value for mode radius and a maximum value for standard deviation with respect to fine and coarse modes, respectively. Namely, rf = 0.143, σf = 1.861, rc = 3.421, and σc = 2.339 (refer to Table 1). By adopting these constant values with respect to the size distribution function given by Equation (8), two parameters (Vf, Vc) should be required alone. As a result, the fine particle fraction (f) defined as f = Vf / (Vf + Vc) [refer to Equation (8)] becomes a unique parameter of size distribution function (Mukai et al., 2012b).
It is reasonable to consider that the mixing of the basic aerosol types exists in nature. We adopt an internal homogeneous mixing of the Maxwell Garnett mixing (MGM) type. The MGM provides a complex refractive index calculated from the following equation (Chýlek and Srivastava, 1977; Bohren and Wickramasinghe, 1983):
where ε denotes dielectric permittivity, subscripts m and j respectively represent matrix and inclusion, and g is the volume fraction of the inclusion limited ≤0.4. We know inhomogeneous mixing should be considered in the further work.
Using these AERONET products on clustering work, MGM suggests that two kinds of aerosol properties, refractive index and size, are respectively induced from the mixing of aerosol types with g and an approximate bimodal log-normal distribution defined by the fine particle fraction (f). In brief, aerosol retrieval parameters are reduced to two: g for component and f for size.
Results and Validation
Application to Satellite Data
First, we examined aerosol retrieval for the Aqua/MODIS data for 19th and 21st June in 2012 based on the previously mentioned method. Figure 4 represents the MODIS data at retrieval target points-A and B in Figure 2 and the simulated values of the reflected intensity calculated with MSOS in a two-channel diagram with wavelengths of 0.46 and 0.55 μm. The dots represent MODIS data within 10 × 10 km2 area around point-A (40.1°N, 116.5°E) and B (37.6°N, 120.5°E). In the simulation, the atmosphere consisted of CP and BB-type (denoted by filled circles) aerosols and MGM types of CP and BB. The MGM type has a complex refractive index calculated from Maxwell Garnett internal mixing rule represented in Equation (9), where g represents the volume fraction of the inclusion (BB) into the matrix (CP) (Fuller et al., 1999). Table 1 presents complex refractive indices calculated using Equation (9). The parameter f represents the fine particle fraction of the approximate bimodal log-normal size distribution function. In other words, f and g are the parameters for the MSOS simulations for MGM aerosol type. For reference, properties of six aerosol types compiled by AERONET measurements are shown in Table 1.
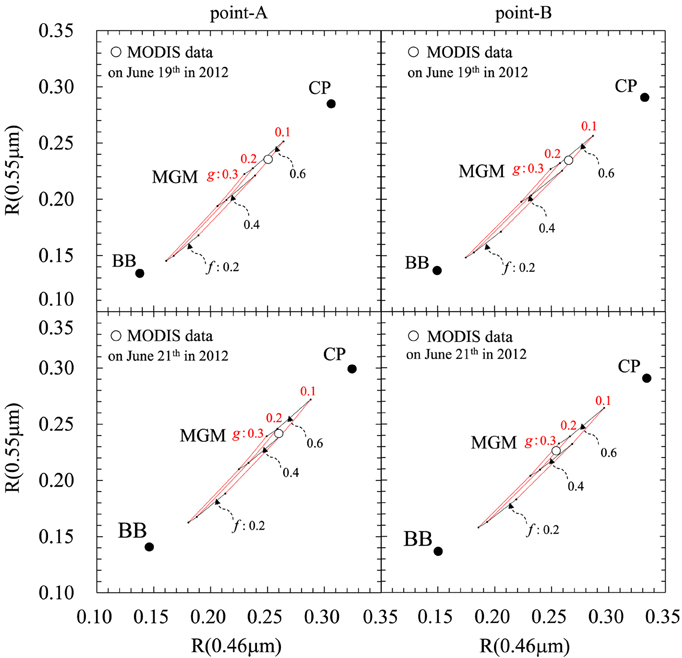
Figure 4. Simulated values of the reflected intensity for aerosol models of BB, CP and MGM in a two-channel diagram at wavelengths of 0.46 μm and 0.55 μm, where the red and black solid curves denote the results for various values of parameters g and f, respectively. The open circles denote MODIS data on June 19th and 21st in 2012 at the target points-A (left) and -B (right).
The upper and lower figures in Figure 4 show the results for 19th and 21st June 2012, respectively. Both the observed and calculated reflectance values show the decreasing trend with wavelength in the present wavelength region in Figure 4. This figure shows that the reflectance values from the CP-type are significantly higher and those from BB-type are significantly lower compared to the MODIS data, and the MGM-type aerosol is consistent with the MODIS data due to the fact that the value of albedo for single scattering (ω) increases with f. We can rank the retrieved aerosols according to their fit to the MODIS data from June 2012 in the east-central China, from most fitting to least fitting:
1. MGM type
2. CP type
3. BB type
Such two parameters of aerosol properties as size distribution and refractive index, i.e., (f, g), are determined in the two wavelength plane. Furthermore, Figure 4 shows that the optimized detail parameters of MGM type depend on time and place as follows: (f, g) = (0.49, 0.11) at point-A and (0.49, 0.14) at point-B on 19th June, and (0.47, 0.13) at point A and (0.50, 0.21) at point B on 21st June. These parameters were derived from two-dimensional interpolation in the (f, g) coordinates, which step size is 0.1 and 0.05, respectively, in order to fit the representative value of MODIS data within 10 × 10 km at each case. The MGM-type aerosol, which is the most suitable candidate for interpreting MODIS data, is the internal mixing of BB inclusions into the CP-type aerosol. Volume fraction (g) of BB in MGM rule decreased from Shandong (point-B) to Beijing (point-A) on both days. This suggests that some of the BBA were transported from areas of ABB in east-central China toward Beijing. Fine particle fraction (f) of MGM model also decreased a little from Shandong (point-B) to Beijing (point-A) on both days. This implies that the particle size increased with the progression of BBA mixing with anthropogenic particles. These phenomena suggest that the improved MSOS including the proposed aerosol model efficiently simulated dense aerosol episodes. Accordingly, our results suggest that space measurements with more detailed spatial and temporal scales are required for precise analysis of aerosols.
Validation of Retrieved Aerosols
Worldwide NASA/AERONET data are mostly available as ground-based sun-photometric products (Holben et al., 1998). They provide aerosol optical thickness (AOT) at wavelength λ. AOT resolution is higher than 0.01 in the visible wavelength region, and the obtained data are cloud screened before aerosol retrieval (Smirnov et al., 2000). Several other aerosol parameters, such as the Ångström exponent α defined by Equation (12), size distribution, and refractive index are derived from the basic data of spectral AOT(λ).
Values of α are closely related to the aerosol size distribution; small values of α indicate large particles and large values indicate small particles. In general, values of α from near 0 to 1.0 indicate large particles such as sea salt aerosols and soil dusts, whereas values of 1.0 < α < 2.5 indicate particles such as sulfate and those associated with biomass burning (O'Neill et al., 2001, 2003). The derivatives of the Ångström exponent (α′) are defined as follows (Eck et al., 1999):
The value of α′ indicates spectral variation in particle properties; negative and positive values correspond to dry and absorbing particles, respectively.
Now, we inferred the measurements at AERONET Beijing site in June 2012 in Figure 5. The top figure shows AOT at a wavelength of 0.44 μm at Beijing site (denoted by □), Seoul (·), and Noto (×). AERONET Version 2/Level 2 data are usually used by the public, but the Level 1.5 data are merged in order to recover the missing data for Level 2 on 18th June. Usually, aerosol episodes are simply defined as periods of high AOT values, which rapidly increased to 1.0 on 17th, 2.0 on 18th, and from 3.0 to 5.0 on 19th to 21st at Beijing. This is clearly presented by MODIS data as series of images (ref https://neptune.im.kindai.ac.jp/MODIS/IMAGE_MYD/2012/). From the MODIS imageries, the high AOT episode appears to be not only because of BB plume but also because of the blocking of air mass movement, which was due to easterly wind around Beijing area from a typhoon passing over Japan during 18th to 20th. An image from 20th June shows that high AOT and low AOT regions were clearly separated over the Yellow Sea. After the typhoon passed, the high AOT region covered Seoul on 22nd and 23rd. MODIS images from 23rd and 24th show that high aerosol density region rapidly disappeared across the Sea of Japan. Therefore, no high values of AOT were observed at Noto site during this period.
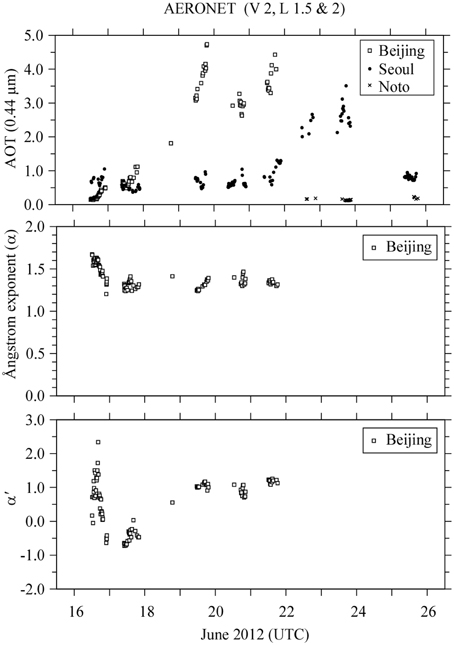
Figure 5. AERONET data in June 2012. The top, middle, and bottom figures represent AOT (0.44 μm), Ångström exponent (α) and the derivative of Ångström exponent (α′), where λ1, λ2, and λ3,are 0.87, 0.675, and 0.44 μm, respectively.
The middle panel represents the values of α, and the bottom shows α', where λ1, λ2, and λ3 were 0.87, 0.675, and 0.44 μm, respectively, at Beijing site; α was approximately 1.3. The hazy particles appeared to be dominated by fine mode particles. Values of α' increased with AOT values, being low on 17th and high from 19th to 22nd June. This feature of α' suggests the presence of carbonaceous aerosols during the aerosol episode starting on 19th June. These ground measurements suggest that this aerosol episode with small pollutants occurred around Beijing, and that carbonaceous aerosols played some role in this episode. Certainly, these carbonaceous aerosols originated from local sources such as industry and automobiles.
Next, retrieved results from satellite were examined through numerical simulations. We used an earth system model known as “MIROC-ESM” (Watanabe et al., 2011). It is based on a global climate model MIROC (Model for interdisciplinary research on climate) developed by the University of Tokyo, NIES (National Institute for Environmental Studies), and JAMSTEC (Japan Agency for Marine-Earth Science and Technology) (K-1 model developers, 2004). An aerosol module in MIROC, SPRINTARS, predicts the main troposphere aerosols including carbonaceous, sulfate, dust and sea salt (Takemura et al., 2002, 2005). Emission flux of carbonaceous aerosols by BB is estimated from hot spots derived by MODIS, shown in Figure 1A.
Figure 6A presents the distribution of simulated sulfate AOT components at a wavelength of 0.55 μm, and Figure 6B provides the same as Figure 6A but for carbonaceous ones. The values in Figure 6 represent the monthly mean of June in 2012. The following results are inferred from these distribution maps:
1. The sulfate component distributes all over the East Asia,
2. The carbonaceous one is concentrated in the South-East Asia,
3. Sulfate dominates carbonaceous throughout the regions,
4. The inventory variations with respect to place are similar to the results derived from Figure 4.
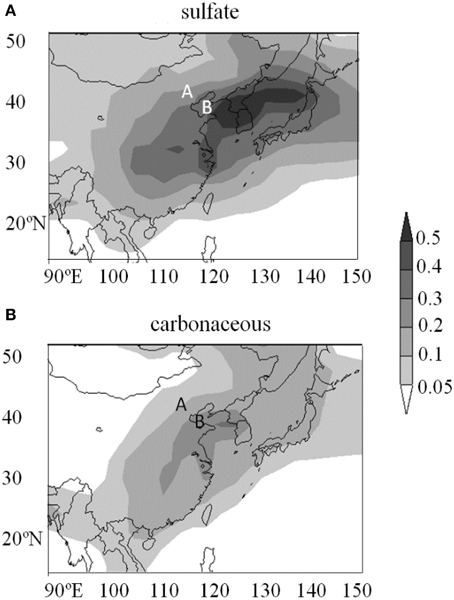
Figure 6. Results of numerical model simulations with MIROC5.0 at a wavelength of 0.55 μm in June in 2012. (A) Distribution of simulated monthly mean sulfate AOT components. (B) The same as (a) but for carbonaceous ones.
Discussions and Summary
POLDER (polarization and directionality of the Earth's reflectance) onboard the CNES/PARASOL satellite collects both reflectance and polarization information at 16 different viewing angles (Deschamps et al., 1994). Kokhanovsky et al. (2015) have reported that multi directional reflectance and polarization information are important in estimating aerosol properties on a global scale. Here, the data simultaneously obtained by PARASOL/POLDER are examined. As mentioned earlier, the spatial resolutions of POLDER and MODIS are different, and therefore, point-B was not observed with POLDER on 19th June 2012 (Figure 2). Figure 7 presents the reflectance at wavelengths of 0.49 and 0.56 μm and degree of polarization at 0.49 and 0.67 μm against scattering angle corresponding to 14 directions on 21st June. With respect to point-B, the magnitude of reflectance at both 0.49 and 0.56 μm was approximately 0.3 for all measurements. The magnitude also decreased with wavelength from 0.49 to 0.56 μm owing to extinction decreasing by fine mode particles. Strictly speaking real observational angles should be denoted by (θ, θ0, ϕ, ϕ0), and then radiation simulated results are also compared with the values functioned with these four variables. However the reflected radiance weakly depends on direction at the present condition (i.e., points-A and -B in this time and place). Thus, flat reflectance trend with scattering angle and the magnitude of the reflectance is a good indicator of very thick aerosol haze such as BB plume. Note that the magnitude of reflectance certainly coincided with MODIS and the values were half that of cloudy regions. Conversely, the degree of polarization was reasonably low for an optically thick atmosphere and its variation in relation to direction was weak.
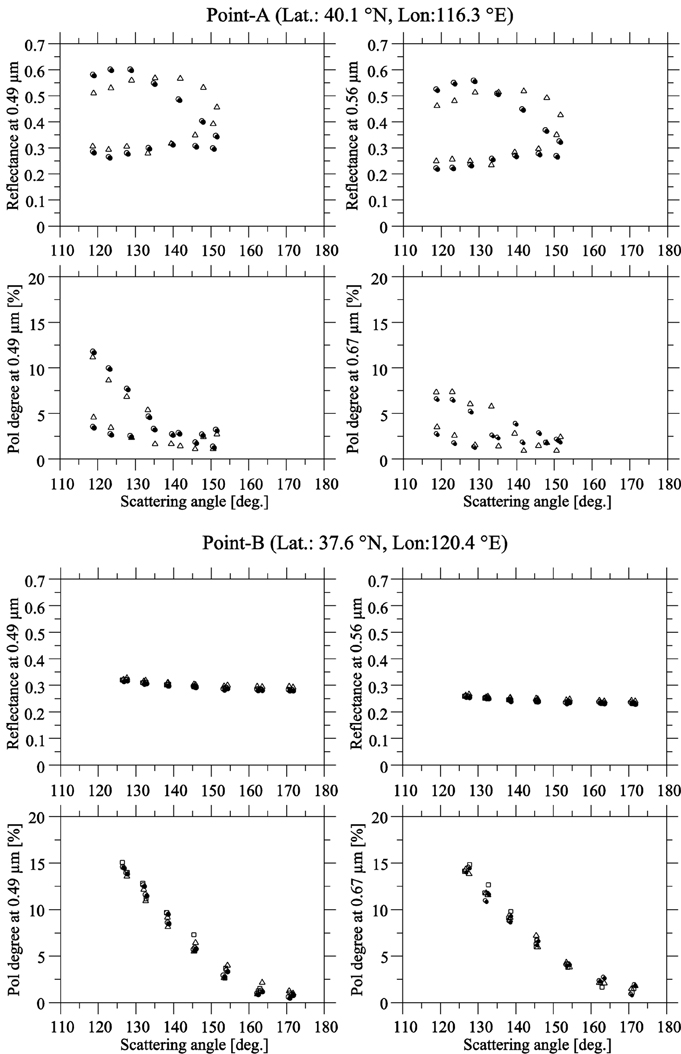
Figure 7. Reflectance and degree of polarization observed by PARASOL/POLDER at wavelengths of 0.49, 0.56 (only reflectance), and 0.67 μm (only polarization) at the observing points-A and B on 21st June 2012. Different symbols indicate nearby pixels.
Reflectance and polarization degree at point-A behaved clearly different from those at point-B. This may be due to the coarse pixel size (6 × 7 km at nadir) of POLDER sensor and registration errors around cloud edge region. Therefore, two clusters were available within a 6 × 7 km area of point-A; one group presents high intensity and polarization degree, and the other group presents low intensity and polarization degree. Further, the trend against scattering angle was also different between the two clusters. The latter is similar to haze behavior at point-B, but the former appears to reflect cloud properties (refer to Figure 2). It is clear from Figure 2 that the scattered clouds exist together with aerosols at point-A. The conclusions on this problem will be provided in a following work because this interesting subject has been engaging and further studies are required to analyse the degree of polarization. This combination analysis of POLDER and MODIS is expected to be useful for retrieval of cloud and haze mixture.
We have shown that dense aerosol episodes of anthropogenic particles involving BB soot can be well simulated by a semi-infinite radiation model comprising the proposed aerosol models. We conclude that air pollution around east-central China in June was mainly due to increased emissions of anthropogenic aerosols associated with economic growth, and to the complicated behavior of natural dust. Carbonaceous aerosols from ABB in Southeast China also contributed to the pollution. High-concentration soot was carried to Beijing from the source area. Aerosol retrieval in hazy atmosphere is achieved by radiative transfer simulation based on the MSOS. It is highly likely that large-scale aerosol episodes will continue to occur. Transmission of data in space-based observations can be hampered by an optically thick atmosphere. Air quality becomes worse particularly in urban areas, and therefore, high-resolution measurements of atmospheric aerosols at spatial, temporal, and spectral scales have been planned. Accordingly, many potential applications for the type of radiation simulation by MSOS involving polarization information are required (Kokhanovsky et al., 2015). In addition, MSOS is expected to be available for aerosol retrieval in a mixture case of cloud and haze. This work suggests that aerosol/cloud should be retrieved considering a variety of perspectives.
Conflict of Interest Statement
The authors declare that the research was conducted in the absence of any commercial or financial relationships that could be construed as a potential conflict of interest.
Acknowledgments
The authors thank NASA for distributing the MODIS data and the AERONET team for data processing, and CNES for POLDER data. This work was supported in part by the Global Change Observation Mission-Climate project by JAXA (JX-PSPC-308878 and JX-PSPC-422275). This study was also supported in part by the Global Environment Research Fund of the Ministry of Environment, Japan (S-12), and JSPS KAKENHI Grant Number 25340019 and 15K00528.
Supplementary Material
The Supplementary Material for this article can be found online at: https://www.frontiersin.org/article/10.3389/fenvs.2015.00057
References
Bohren, C. F., and Wickramasinghe, N. C. (1983). On the computation of optical properties of heterogeneous grains. Astrophys. Space Sci. 50, 461–472. doi: 10.1007/BF00641750
Chýlek, P., and Srivastava, V. (1977). Dielectric constant of a composite inhomogeneous medium. Phys. Rev. B 27, 5098–5106. doi: 10.1103/PhysRevB.27.5098
Deschamps, P.-Y., Bréon, F.-M., Leroy, M., Podaire, A., Bricaud, A., Buriez, J.-C., et al. (1994). The POLDER mission: instrument characteristics and scientific objectives. IEEE Trans. Geosci. Remote Sens. 32, 598–615. doi: 10.1109/36.297978
Dubovik, O., Holben, B. N., Eck, T. F., Smirnov, A., Kaufman, Y. J., King, M. D., et al. (2002). Variability of absorption and optical properties of key aerosol types observed in worldwide locations. J. Atmos. Sci. 59, 590–608. doi: 10.1175/1520-0469(2002)059<0590:VOAAOP>2.0.CO;2
Eck, T. F., Holben, B. N., Reid, J. S., Dubovik, O., Smirnov, A., O'Neill, N. T., et al. (1999). Wavelength dependence of the optical depth of biomass burning, urban, and desert dust aerosols. J. Geophys. Res. 104, 31333–31349. doi: 10.1029/1999JD900923
Evangelista, H., Maldonado, J., Godoi, R. H. M., Pereira, E. B., Koch, D., Tanizaki-Fonseca, K., et al. (2007). Sources and transport of urban and biomass burning aerosol black carbon at the South-West Atlantic Coast. J. Atmos. Chem. 56, 225–238. doi: 10.1007/s10874-006-9052-8
Freitas, S. R., Longo, K. M., Silva Dias, M. A. F., Silva Dias, P. L., Chatfield, R., Prins, E., et al. (2005). Monitoring the transport of biomass burning emissions in South America. Environ. Fluid Mech. 5, 135–167. doi: 10.1007/s10652-005-0243-7
Fuller, K. A., Malm, W. C., and Kreidenweis, S. M. (1999). Effects of mixing on extinction by carbonaceous particles. J. Geophys Res. 104, 15941–15954. doi: 10.1029/1998JD100069
Holben, B. N., Eck, T. F., Slutsker, I., Tanré, D., Buis, J. P., Setzer, A., et al. (1998). AERONET - A federated instrument network and data archive for aerosol characterization. Rem. Sens. Environ. 66, 1–16. doi: 10.1016/S0034-4257(98)00031-5
van de Hulst, H. C. (1963). A New Look at Multiple Scattering. New York, NY: NASA Institute for Space Studies.
IPCC. (2013). “Climate Change 2013: the physical science basis,” in Contribution of Working Group I to the Fifth Assessment Report of the Intergovernmental Panel on Climate Change (Cambridge University Press), 1535.
K-1 model developers. (2004). K-1 Coupled GCM (MIROC) Description. K-1 Technical Report No.1, Center for Climate System Research (Univ. of Tokyo). National Institute for Environmental Studies; Frontier Research Center for Global Change.
Kahn, R., Anderson, J., Anderson, T. L., T., Bates, Brechtel, F., Carrico, C. M., et al. (2004). Environmental snapshots from ACE-Asia. J. Geophys. Res. 109, D19S14. doi: 10.1029/2003jd004339
King, M. D., Kaufman, Y. J., Menzel, W. P., and Tanré, D. (1992). Remote sensing of cloud, aerosol, and water vapor properties from the Moderate Resolution Imaging Spectrometer (MODIS). IEEE Trans. Geosci. Remote Sens. 30, 2–27. doi: 10.1109/36.124212
Kokhanovsky, A. A. (2002). Statistical properties of a photon gas in random media. Phys. Rev. E. 66, 037601. doi: 10.1103/PhysRevE.66.037601
Kokhanovsky, A. A., Davis, A. B., Cairns, B., Dubovik, O., Hasekamp, O. P., Sano, I., et al. (2015). Space-based remote sensing of atmospheric aerosols: the multi-angle spectro-polarimetric frontier. Earth Sci. Rev. 145, 85–116. doi: 10.1016/j.earscirev.2015.01.012
Lee, K. H., and Kim, Y. J. (2010). Satellite remote sensing of Asian aerosols: a case study of clean, polluted and dust storm days. Atmos. Meas. Tech. 3, 1771–1784. doi: 10.5194/amt-3-1771-2010
Li, W. J., Shao, L. Y., and Buseck, P. R. (2010). Haze types in Beijing and the influence of agricultural biomass burning. Atmos. Chem. Phys. 10, 8119–8130. doi: 10.5194/acp-10-8119-2010
Mukai, M., Nakajima, T., and Takemura, T. (2008). A study of anthropogenic impacts of the radiation budget and the cloud field in East Asia based on model simulations with GCM. J. Geophys. Res. 113, D12211. doi: 10.1029/2007jd009325
Mukai, S., Sano, I., Masuda, K., and Takashima, T. (1992). Atmospheric correction for ocean color remote sensing: optical properties of aerosols derived from CZCS imagery. IEEE Trans. Geosci. Remote Sens. 30, 818–824. doi: 10.1109/36.158878
Mukai, S., Sano, I., and Holben, B. N. (2005). Aerosol properties over Japan by sun/sky photometry. Water Air Soil Pollut. 5, 133–143. doi: 10.1007/s11267-005-0731-2
Mukai, S., Sano, I., and Nakata, M. (2012a). “Algorithms for radiative transfer simulations for aerosol retrieval,” in Proceedings of SPIE - The International Society for Optical Engineering, 8534, Remote Sensing of Clouds and the Atmosphere XVII, and Lidar Technologies, Techniques, and Measurements for Atmospheric Remote Sensing VIII 85340T (Edinburgh, TX).
Mukai, S., Yasumoto, M., and Nakata, M. (2014). Estimation of biomass burning influence on air pollution around Beijing from an aerosol retrieval model. Sci. World J. 2014:649648. doi: 10.1155/2014/649648
Mukai, S., Yokomae, T., Sano, I., Nakata, M., and Kokhanovsky, A. (2012b). Multiple scattering in a dense aerosol atmosphere. Atmos. Meas. Tech. Discuss. 5, 881–907. doi: 10.5194/amtd-5-881-2012
Nakata, M., Sano, I., and Mukai, S. (2015). Air pollutants in Osaka (Japan). Front. Environ. Sci. 3:18. doi: 10.3389/fenvs.2015.00018
Omar, A. H., Won, J.-G., Winker, D. M., Yoon, S.-C., Dubovik, O., and McCormick, M. P. (2005). Development of global aerosol models using cluster analysis of Aerosol Robotic Network (AERONET) measurements. J. Geophys. Res. 110:D10S14. doi: 10.1029/2004jd004874
O'Neill, N. T., Dubovik, O., and Eck, T. F. (2001). Modified Angstrom exponent for the characterization of submicrometer aerosols. Appl. Optics 40, 2368–2375. doi: 10.1364/AO.40.002368
O'Neill, N. T., Eck, T. F., Smirnov, A., Holben, B. N., and Thulasiraman, S. (2003). Spectral discrimination of coarse and fine mode optical depth. J. Geophys. Res. 108, 4559. doi: 10.1029/2002JD002975
Sano, I., Mukai, S., Okada, Y., Holben, B. N., Ohta, S., and Takamura, T. (2003). Optical properties of aerosols during APEX and ACE-Asia experiments. J. Geophys. Res. 108, 8649. doi: 10.1029/2002jd003263
Smirnov, A., Holben, B. N., Eck, T. F., Dubovik, O., and Slutsker, I. (2000). Cloud-Screening and Quality Control Algorithms for the AERONET Database. Remote Sens. Environ. 73, 337–349. doi: 10.1016/S0034-4257(00)00109-7
Sobolev, V. V. (1968). Anisotropic Scattering of Light in a semi-infinite atmosphere I. Sov. Astron. A. J. 12, 202–208.
Takemura, T., Nakajima, T., Dubovik, O., Holben, B. N., and Kinne, S. (2002). Single-scattering albedo and radiative forcing of various aerosol species with a global three-dimensional model. Journal of Climate, 15, 333–352. doi: 10.1175/1520-0442(2002)015<0333:SSAARF>2.0.CO;2
Takemura, T., Nozawa, T., Emori, S., Nakajima, T. Y., and Nakajima, T. (2005). Simulation of climate response to aerosol direct and indirect effects with aerosol transport-radiation model. J. Geophys. Res. 110:D02202. doi: 10.1029/2004jd005029
Uesugi, A., and Irvine, W. M. (1969). Computation of synthetic spectra for a semi-infinite atmosphere. J. Atmos. Sci. 26, 973–978.
Uesugi, A., and Irvine, W. M. (1970). Multiple scattering in a plane-parallel atmosphere I. Successive scattering in a semi-infinite medium. Astrophys. J. 159, 127–135. doi: 10.1086/150296
Watanabe, S., Haijima, T., Sudo, K., Nagashima, T., Okajima, H., Nozawa, T., et al. (2011). MIROC-ESM (2010). model description and basic results of CMIP5-20c3m experiment. Geosci. Model Dev. 4, 845–872. doi: 10.5194/gmd-4-845-2011
Keywords: BBA, MSOS, MODIS, POLDER, AERONET, AEROSOL REMOTE SENSING
Citation: Mukai S, Nakata M, Yasumoto M, Sano I and Kokhanovsky A (2015) A study of aerosol pollution episode due to agriculture biomass burning in the east-central China using satellite data. Front. Environ. Sci. 3:57. doi: 10.3389/fenvs.2015.00057
Received: 09 May 2015; Accepted: 03 August 2015;
Published: 28 August 2015.
Edited by:
Yong Xue, London Metropolitan University, UKReviewed by:
Costica Nitu, Politehnica University of Bucharest, RomaniaIrina Melnikova, St. Petersburg State University, Russia
Copyright © 2015 Mukai, Nakata, Yasumoto, Sano and Kokhanovsky. This is an open-access article distributed under the terms of the Creative Commons Attribution License (CC BY). The use, distribution or reproduction in other forums is permitted, provided the original author(s) or licensor are credited and that the original publication in this journal is cited, in accordance with accepted academic practice. No use, distribution or reproduction is permitted which does not comply with these terms.
*Correspondence: Sonoyo Mukai, School of Applied Information Technology, The Kyoto College of Graduate Studies for Informatics, 7 Monzen-cho Tanaka, Sakyo-ku, Kyoto 606-8225, Japan, s_mukai@kcg.ac.jp