Estimation of phosphorus isotherm parameters: a simple and cost-effective procedure
 Biswanath Dari
 Vimala D. Nair
 James Colee2
 - 1Soil and Water Science Department, University of Florida, Gainesville, FL, USA
- 2Institute of Food and Agricultural Sciences-Statistics, University of Florida, Gainesville, FL, USA
Equilibrium models used for predicting phosphorus (P) loss from a site often use the Langmuir strength of P bonding, KL and the P sorption maximum, Smax, or the Freundlich adsorption coefficient, KF, obtained from traditional isotherms, as model input parameters. The overall objective of the study was to develop a protocol to allow estimation of isotherm parameters for soils using simple extraction techniques without generating time-consuming isotherms. A threshold P saturation ratio (PSR; molar ratio of P to [Fe+Al] in an oxalate- or soil test extracting solution) is the PSR value at which P release from a soil increases abruptly. The soil P storage capacity (SPSC) indicates the amount of P a soil can hold before becoming an environmental risk: SPSC = (Threshold PSR-Soil PSR)*(Fe+Al)*31 mg kg−1. Soil samples with varying P-impact levels from four manure-impacted sites were collected by horizon (Ap, E, and Bt). The PSR, SPSC and isotherm parameters (KL, KF, Smax) were determined for all soils and regression equations among various parameters evaluated. Equations were validated with soils data from three other sites. Relationship between predicted and determined parameters were significant (R2 = 0.98 for KL and 0.95 for KF and Smax) suggesting that isotherm parameters can be obtained from P, Fe, and Al in an oxalate or soil test solution without generating time- and resource-consuming isotherms.
Introduction
Eutrophication of water bodies caused by phosphorus (P) loss from manure and fertilizer-impacted sandy soils has become a major concern in several parts of the world including Canada (Chambers et al., 2009), Europe (Withers and Haygarth, 2007), New Zealand (McDowell and Monaghan, 2015), Sweden (Bergström et al., 2015), and the southeastern United States (Greening and Janicki, 2006; Lehrter, 2008; Paerl, 2009; Jarvie et al., 2013; Sharpley et al., 2013; King et al., 2015; Kleinman et al., 2015). Cost-effective tools are needed to identify locations within agricultural systems impacted by excess P that pose a threat to water quality. The P saturation ratio (PSR) was described (Sims et al., 2002) as the molar ratio of extractable P to extractable Fe and Al using P, Fe and Al concentrations in either an oxalate (Ox) solution (van der Zee and van der Riemsdijk, 1988) or in soil test solutions such as Mehlich 1, “M1” (Nair and Graetz, 2002; Beck et al., 2004) or Mehlich 3, “M3” (Maguire and Sims, 2002; Sims et al., 2002). A threshold PSR, or “change point,” has been identified as the PSR at which P release from a soil through runoff or leaching increases abruptly with further P addition (Casson et al., 2006). In Florida, the PSR concept has been shown to be applicable to the A, E, and Bt horizons of Ultisols (Chakraborty et al., 2012). Based on a threshold PSR value, the soil P storage capacity (SPSC) can be calculated (Nair and Harris, 2004). The SPSC indicates the amount of P a soil can hold before it becomes an environmental risk. The SPSC, unlike the PSR, provides an absolute calculation of remaining P storage (mg kg−1, kg ha−1, etc.) prior to P release at levels posing environmental risks (Nair and Harris, 2004, 2014).
The PSR and SPSC are not routinely determined when quantifying soil P sorption and subsequent risk on a site-specific basis. The widely used methods for soil P sorption and desorption studies are traditional batch P isotherm determinations (Barrow, 1978; Zhou and Li, 2001) for calculations of Langmuir (Berkheiser et al., 1980; Mehadi and Taylor, 1988; Taylor et al., 1996; Li et al., 2007) and Freundlich parameters (Chardon and Blaauw, 1998). The Langmuir isotherm provides valuable information on the maximum P sorption parameter, Smax, and a constant, KL related to the P bonding energy (Nair et al., 1998).
Phosphorus isotherm parameters are used in various field-scale models like the Agricultural Nutrient Model (ANIMO), (Groenendijk and Kroes, 1999) the Agricultural Policy Extender model (APEX), and the Soil and Water Assessment Tool (SWAT; Gassman et al., 2004). The isotherm parameters used in specific models are presented in Table 1. Models use P isotherm parameters, either the linear (McCray et al., 2005) or non-linear (e.g., the P bonding strength, Langmuir KL or the Freundlich adsorption coefficient, KF), as an input. A potential problem associated with using the linear isotherm equation in simulating P loss from soils at higher solution P concentration has been indicated (Knisel et al., 1991; Zhou et al., 1997). Therefore, the use of non-linear isotherm models is preferable to linear isotherm models for prediction of P loss under long-term animal agricultural production systems (Radcliffe and Cabrera, 2006; Nelson et al., 2007). The proper P loss risk assessment via mechanistic model can better be assessed by incorporating the values of isotherm parameters (either Langmuir or Freundlich equations) obtained site-specifically from real field situations.
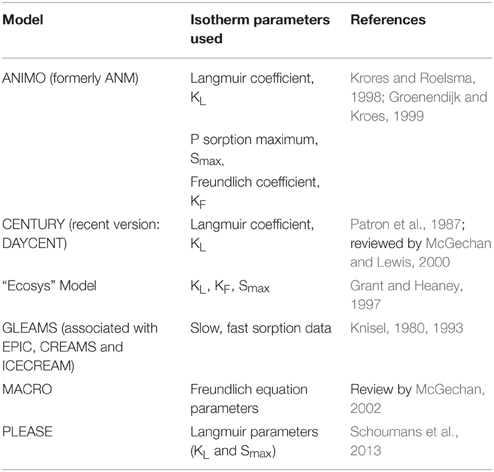
Table 1. Isotherm parameters used in various mechanistic phosphorus loss models.
Our hypothesis is that KL or KF would be variable below the threshold PSR and would tend toward zero as the threshold PSR is exceeded. Isotherm parameters below the threshold value will be related to SPSC. The KL or KF value will increase with increase in positive SPSC such that isotherm parameters may be predicted from P, Fe, and Al concentrations in an oxalate solution or soil test solutions like M1 or M3. Based on the above hypotheses, the overall objective of the study was to develop a protocol that would allow the estimation of KL or KF, and other isotherm parameters such as the Smax of a soil, without generating time-consuming isotherms. Specific objectives of the study were to: (i) develop a relationship between isotherm parameters (KL or KF) and values of PSR and SPSC for horizons of common soil orders in Florida and the southeastern USA (e.g., Ultisols/Alfisols/Entisols), (ii) perform cross validation by testing the predictive accuracy of the relationships using samples from other P-impacted sites, and (iii) develop and test the relationship for predicting Smax from Ox-[Fe+Al].
Materials and Methods
Soil Sampling and Sites Description
Sites for Protocol Development
Soil profiles from four dairy farms located in the Suwannee River Basin, southeastern USA (Sites 1–4; Figure 1) were sampled by horizon (Ap, lower depth ~25 cm; E, lower depth ~50 cm; Bt, lower depth of subsamples collected for this study ranged from about 0.5–2.0 m). Random locations within the four sites (1–4) were chosen for sampling (Supplementary Table S1). The total number of soil samples was 108. Samples from these four sites were used for the protocol development. Soils of all these locations within sites were Grossarenic and Arenic Paleudults.
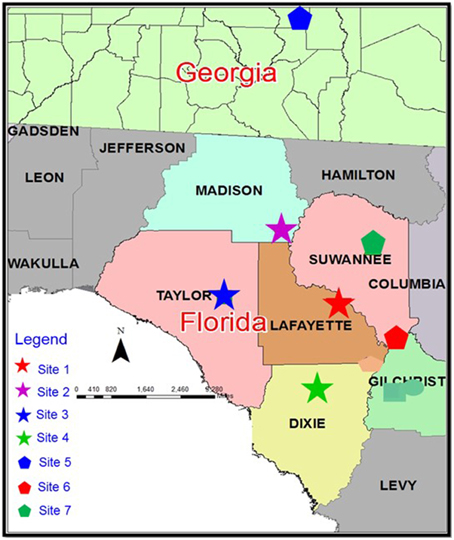
Figure 1. Location of the study sites. Sites 1–4 were sampled for Protocol Development and Sites 5–7 were sampled for Protocol Testing 1. All sites were sampled (different locations within the sites) in a subsequent year for Protocol Testing 2.
Sites for Protocol Testing 1
Locations were selected at random from three other sites (Sites 5–7) within the Suwannee River Basin. Soils were collected by horizon for a total of 66 samples (Supplementary Table S1). Sites 5 and 6 were dairy farms in Florida; Site 7 was a poultry farm in Georgia (Chrysostome et al., 2007; Figure 1). Soils from these sites included Grossarenic- and Arenic subgroups of Paleudults and Paleudalfs, and Typic Quartzipsamments.
Sites for Protocol Testing 2
Soil samples were collected in a subsequent year, after additional P loading, from locations within Sites 1–7 (total 135 samples, Supplementary Table S1).
Chemical Analyses
Soil Physico-chemical Properties Determination
Samples were homogenized, air-dried, and passed through a 2-mm sieve before analyses. Soil pH was measured with a suspension of soil in water at a 1:2 (w:v) soil-to-solution ratio using a glass electrode. Oxalic acid (0.1 M) and ammonium oxalate (0.175 M) solution, equilibrated at a pH of 3.0 (McKeague and Day, 1966), were used as the extracting agent to determine oxalate-extractable P (Ox-P), Fe (Ox-Fe), and Al (Ox-Al). The suspension was shaken in a mechanical shaker for 4-h in the dark, centrifuged, filtered through a 0.45-μm filter, and analyzed for P, Fe, and Al by inductively coupled plasma spectrometry (Thermo Jarrel Ash ICP 61E, Thermo Elemental, Franklin, MA; Loeppert and Inskeep, 1996). Water-soluble P (WSP) was determined by extracting each soil sample with deionized water at 1:10 (w:v) soil-to-water ratio, and analyzing P on the filtrate collected after passing through a 0.45 μm filter. Water-soluble P concentrations were determined by an autoanalyzer (USEPA, 1983) following the Murphy and Riley (1962) procedure.
Phosphorus Sorption Isotherms
Phosphate sorption was measured on all collected soil samples using 2 g of air-dried, homogenized soil treated with 20 mL of 0.01 M KCl solution containing 0, 0.1, 1, 5, 10, 25, 50, and 100 mg P L−1 added as KH2PO4 (Graetz and Nair, 1995) in 50 mL centrifuge tubes. Tubes were placed on a mechanical shaker for a 24-h equilibration period, centrifuged at 6000 rpm for 10 min and filtered through a 0.45-μm membrane filter. The filtrate was analyzed for soluble reactive P by an autoanalyser (USEPA, 1983) following the Murphy and Riley (1962) procedure. All extractions and determinations were done at room temperature (25 ± 1°C).
Calculations
Isotherm Parameters Calculation
The Langmuir KL (Langmuir, 1918) or P bonding strength was calculated from the modified Langmuir isotherm model (Nair and Reddy, 2013) (Equation 1) as:
Where, S = S′ + S0, the total amount of P sorbed (mg kg−1),
S′ = P sorbed by the soil solid phase (mg kg−1),
S0 = Originally sorbed P on the soil solid phase (mg kg−1),
C = Concentration of P after 24 h equilibration (mg L−1),
Smax = P sorption maximum (mg kg−1),
KL = A constant related to bonding energy (L mg−1),
S0 was estimated using a least square fit of S' measured at low equilibrium concentration (Nair et al., 1998). The procedure was illustrated to adjust the total amount of P sorbed taking into consideration the initial P present in the soil phase (Graetz and Nair, 1995). A typical example of a Langmuir isotherm plot from the current data including the procedure in estimating S0 and EPC0 is shown in Supplementary Figure S1.
The Freundlich adsorption coefficient or KF was calculated from non-linear Freundlich isotherm model (Freundlich, 1926) (Equation 2) as:
Where, A = amount of adsorbate adsorbed per unit mass of solid (mg kg−1),
C = equilibrium solution concentration of the adsorbate (mg L−1),
KF = Freundlich coefficient,
N = empirical constant.
The Freundlich equation becomes a linear relationship when N = 1. Subsequently, the Freundlich equation (Equation 2) can be log-linearized and Equation (3) can be obtained. Plotting of log C on the x-axis and log A on the y-axis showed a best-fit straight line with a slope of N, and log KF is its intercept. The log linearized form of the equation is:
PSR Calculations
The PSR of a soil from P, Fe, and Al concentrations can be calculated (Equation 4) as:
where, P, Fe, and Al are expressed in moles (Sims et al., 2002; Nair, 2014). The extracting reagent can be an acid ammonium oxalate extractant or a soil test solution such as M1 or M3. In this study, the PSR has been calculated using acid ammonium oxalate (Ox) extractant (Equation 5).
SPSC Calculation
SPSC (Equations 6 and 7) was calculated using the threshold PSR as:
Nair and Harris (2014), in a recent review of the SPSC concept they developed earlier (Nair and Harris, 2004), indicated the benefits of the procedure for environmental P risk assessment. The value for the threshold PSR (0.10; 95% Confidence interval of 0.05–0.15) was obtained as the “change point” in a water soluble P vs. PSR relationship (Nair, 2014). There is a strong (nearly 1:1) linear relationship between SPSC as calculated from oxalate P, Fe, and Al and from a soil test solution such as M3-P, Fe, and Al (Supplementary Figure S2). Hence results of this study are applicable for M3 extraction results as well as for ammonium oxalate. Andres and Sims (2013) used P, Fe, and Al in a Mehlich 3 solution to show how the inexpensive tests (PSR and SPSC) could be used to assess the impacts of a wastewater rapid infiltration basin system on groundwater quality in Delaware, USA.
Statistical Analyses
Empirical relationships developed between P isotherm parameters and soil test parameters (PSR and SPSC) were statistically obtained using correlation and regression analyses in Excel 2013. A proc non-linear split line (NLIN) model in SAS 9.3 (SAS, 2010) statistical software was used to determine the change point or threshold PSR as computed by others (McDowell and Sharpley, 2001; Casson et al., 2006; Chakraborty et al., 2011). The model describes linear relationships between WSP and PSR before and after the PSR vs. WSP change point (Nair, 2014). The model parameters sensitivity analyses were performed by random sub-sampling with replacement in R software (Team, 2012).
Results and Discussion
Soil Characterization
Soil samples analyzed for protocol development were acidic in nature with pH values ranging from 4.61 to 6.27 for all the locations in Sites 1–4 (Supplementary Table S2). Water-soluble P, an indicator of the amount of P that will be released from the soil when it is in contact with water from sources like rain or irrigation, showed a decreasing trend from Ap and E horizons to subsurface (Bt) horizons. The sandy Ap horizons generally had greater Ox-P content than subjacent horizons (Supplementary Table S2). The Bt horizons were characterized by highest amount of metal oxides concentration compared to overlying Ap and E horizons, with Ox-Fe values up to 662 mg kg−1 and Ox-Al values up to 921 mg kg−1, consistent with higher P adsorption capacity than for sandier overlying horizons. These data are consistent with those of other studies reporting on P distribution in Paleudult profiles of the southeastern USA Coastal Plain (Harris et al., 1996; Zhou et al., 1997; Chakraborty et al., 2012) with a wide range of P sorption capacities.
Protocol Development: Relationship of Soil PSR and SPSC to Isotherm Parameters
A plot of KL vs. PSR (Figure 2A, n = 108) showed that P bonding strength is high and variable below the threshold PSR and gradually decreases and approaches zero once the threshold value of PSR is reached. A similar trend was observed for KF vs. PSR (Figure 2B, n = 108). It was reported that equilibrium P concentrations (EPC0) showed a similar trend with PSR, being minimal below the threshold PSR but increasing above the threshold PSR for acid mineral soils of Florida (Chakraborty et al., 2012). The relationship between PSR and EPC0 is also applicable to wetland soils; organic matter in a wetland does not contribute to P retention below the threshold PSR (Nair et al., 2015). In the current study, there was a clustering of Bt samples below the threshold in the current study, of E samples near the threshold, and of Ap samples near to the threshold. These clustering trends reflect both depth proximity to the surface P deposition and greater P retention capacity of the Bt due to higher clay and metal content.
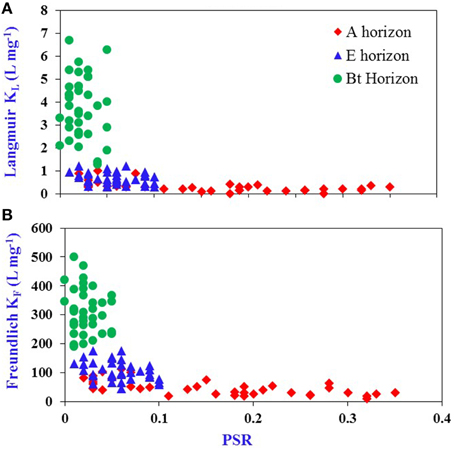
Figure 2. Relationship between: (A) KL and P saturation ratio (PSR) calculated using P, Fe, and Al in an oxalate extract and (B) KF and PSR for A, E, and Bt horizons of Ultisols/Entisols/Alfisols (n = 108).
The KL vs. SPSC relationship could provide a better risk estimation compared with the corresponding relationship with PSR, as SPSC takes into account the P that may be added to a soil prior to reaching the threshold PSR of 0.10 (Nair and Harris, 2014). The Langmuir KL increased with positive SPSC (Figure 3A) but such a trend was not evident for the KL vs. PSR relationship (Figure 2A) or when SPSC is negative such that KL is essentially zero. The KF vs. SPSC relationship gives two linear equations, one for positive SPSC and the other for negative SPSC (Figure 3B) independent of the horizon designations. Hence the Freundlich model could be used in cases of negative SPSC; such a relationship cannot be obtained for the Langmuir parameters since KL approaches zero for the A horizons in this study.
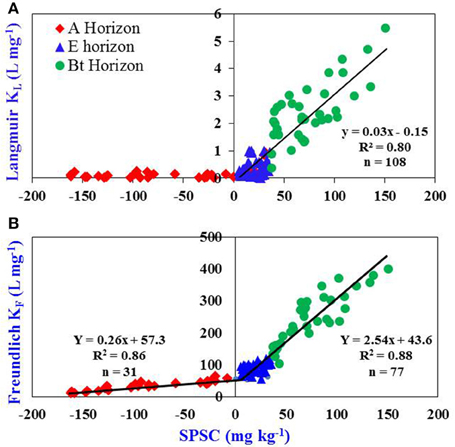
Figure 3. Relationship between: (A) KL and soil P storage capacity (SPSC) and (B) KF and SPSC for A, E, and Bt horizons of Ultisols/Entisols/Alfisols. The relationship between KL and positive SPSC is linear; y = 0.03x–0.15. The relationship between KF and SPSC has been divided into two parts: positive SPSC and negative SPSC. The relationship of KF under both the situations (positive and negative SPSC) is linear; y = 0.26x + 57.3 and y = 2.54x + 43.6, respectively. The units for each parameter in the linear equations are Y = L mg−1, X = mg kg−1, 0.03 = L mg−1, 0.15 = mg kg−1, 0.26 = L mg−1, 57.3 = mg kg−1, 2.54 = L mg−1, 43.6 = mg kg−1.
The SPSC vs. K (KL or KF) relationship allows KL or KF for soils to be estimated. The SPSC was not significantly related to KL or KF for A or E horizons analyzed individually due to clustering at very low values of SPSC. However, these relationships were highly significant for Bt horizon samples analyzed separately (R2 = 0.74 and p < 0.001). The approach of getting a relationship between isotherm parameters and soil test data across all horizons is especially important when considering P loss via leaching and subsurface movement through tile drainage resulting in water quality degradation (King et al., 2014). Since the PSR—SPSC concept is also applicable to wetland soils (Nair et al., 2015), relationships between isotherm parameters and soil test data obtained in this study would likely be useful in evaluating legacy P storage and release from wetland soils as well.
The KF and KL values as obtained from the relationships developed represent values obtained for soils under site-specific conditions. For example, addition of poultry manure to a soil, showed that when data were fitted to the Freundlich equation, the extent of adsorption was lowered (Bahl and Toor, 2002), and the ability to bind additional P reduced. Similarly, Nair et al. (1998) found that addition of dairy manure to a soil resulted in P release from a soil with minimal P-retaining properties since the high energy sorption sites were saturated (KL became 0), corresponding to the soil reaching the threshold PSR (or zero SPSC). Therefore, both KF and KL values are reduced with P additions and the values no longer represent the true binding affinity of a soil that is based on soil texture and composition.
Protocol Testing
Protocol Testing 1
Isotherms were performed for the soil samples collected from Sites 5–7 by the traditional batch incubation method; the KL, KF, and Smax were calculated by fitting the data into respective models. These isotherm parameters are referred to as determined values. The isotherm parameters for these sites obtained from the SPSC relationships developed from data in Sites 1–4 (Figures 3A,B) are referred to as the predicted values. The predicted isotherm values were then compared with determined values. A linear relationship was observed for predicted and determined KL with an R2-value of 0.98 (close to the 1:1 linear correlation line), indicating a good fit (Figure 4A).
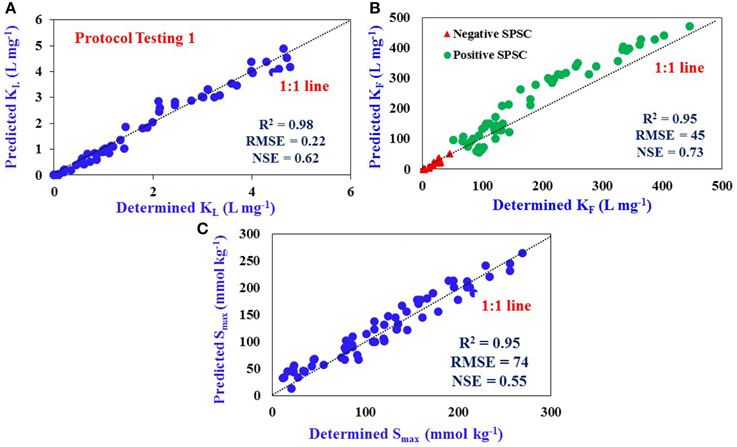
Figure 4. Comparison of determined and predicted values: (A) Langmuir KL (R2 = 0.98), (B) Freundlich KF (R2 = 0.95), and (C) P Sorption Maximum, Smax (R2 = 0.95) for Sites 5–7 using predictive equations developed from Sites 1–4 data. Dotted line represents 1:1 linear correlation. The number of samples used for Protocol Testing 1 is 66 (n = 66). The data represent samples from all three horizons.
The KF values for Sites 5–7 were predicted from the equations developed (Figure 3B) for positive and negative SPSC. However, it was possible to obtain a single predicted KF vs. determined KF relationship that was independent of the nature of SPSC (positive or negative; Figure 4B) since the slopes for the independent relations were identical. The R2-value of this relationship was 0.95, again indicating a good fit. The Smax of a soil could be predicted based on its relationship with [Fe+Al] and the predicted vs. determined Smax relationship indicated a good fit with R2 of 0.95 (Figure 4C).
The accuracy of model prediction was assessed by the root mean-square error (RMSE), Nash-Sutcliffe efficiency (NSE) for both Langmuir and Freundlich models as well as Smax testing graphs. The NSE values for all the three predictions were within optimum range of model prediction (0.62, 0.73, and 0.55 for KL, KF and Smax, respectively; 0–1 being optimum range), suggesting a good fit of model for testing the predictive equations. The determined vs. predicted relationship for KL (Figure 4A) and KF (Figure 4B) was used to verify the applicability of the equations developed to predict isotherm parameters across soil horizons and soil types. Properties of the soils at these sites (Supplementary Table S3) were similar to those at Sites 1–4 (Supplementary Table S2). The KL and KF values along with Smax, and N, the Freundlich coefficient, for all sites are provided in Supplementary Tables S4, S5. The soils used in validating the equations had a range of P impact levels (Supplementary Table S3) including Ap horizons with both positive (5 to 160 mg kg−1) and negative (−22 to −291 mg kg−1) SPSC values.
The Smax of a soil can be predicted based on its relationship with [Fe+Al] van der Zee and van der Riemsdijk, 1988. From the relationship between Smax and oxalate extracted-[Fe+Al] obtained for the soils in four sites (Supplementary Figure S3), Smax for the soils for Sites 5–7 was predicted. The relationship between oxalate extracted-[Fe+Al] and Mehlich-3 extracted-[Fe+Al] (Supplementary Figure S4) was evaluated. A 1:1 linear correlation was obtained between determined and predicted Smax (Figure 4C) with a R2-value of 0.95 (RMSE: 74 and NSE: 0.55) suggesting that Smax can be obtained from a soil test solution such as M3. Nair and Graetz (2002) obtained a similar relationship of Smax with [Fe+Al] for Florida soils in the Lake Okeechobee Basin dominated by Spodosols with a organically-complexed Bh (spodic) horizon, suggesting that the equation developed in this study would most likely be applicable across other mineral soils as well.
Protocol Testing 2
The predictive equations were also tested in different locations other than those were used for “protocol development” and “Protocol testing 1” within all the sites (Sites 1–7) in a subsequent year to verify their applicability. Again, the determined values of KL, KF, and Smax were compared with predicted values as obtained from SPSC values (Figures 4A–C). A good fit of all isotherm values as predicted from equations were noted with a close 1:1 linear correlation line. The values of RMSE, R2, and NSE (Figures 5A–C) are indicative of good model prediction for all sites in a subsequent year after additional P loading.
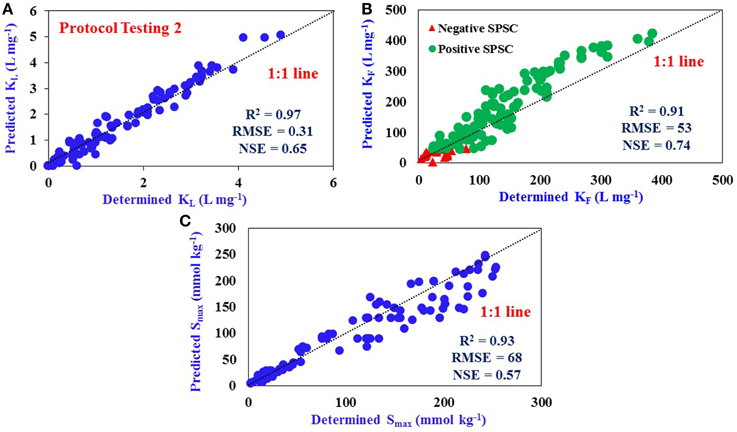
Figure 5. Comparison of determined and predicted values: (A) Langmuir KL (R2 = 0.97), (B) Freundlich KF (R2 = 0.91), and (C) P Sorption Maximum, Smax (R2 = 0.93) for various other locations within Sites 1–7 using predictive equations developed from Sites 1–4 data in a previous year. Dotted line represents 1:1 linear correlation. The number of samples used for Protocol Testing 2 is 135 (n = 135). The data represent samples from all three horizons.
Model Parameter Sensitivity Analysis
An alternative approach of model verification and parameter sensitivity was performed on all samples collected for both protocol development and testing through the use of random sub sampling with replacement. Two hundred random samples each of size 108 (the number of soil samples used in protocol development) where taken without replacement out of total of 309 soil samples used for both protocol development and testing (Politis and Romano, 1994). A linear regression model was then fit for each subsample and resulting parameter estimates were saved. The models were fit using the R software. A contour plot of the distribution of the parameter estimates is shown in Supplementary Figure S5 for Langmuir model (graph not shown for Freundlich model fit). The parameter estimates for the Langmuir isotherms fell within the 95% confidence interval (CI) of the experimental data (Supplementary Figure S6). Only one data point was outside the 95% CI for KF estimate for negative SPSC; most of the predicted values fell within the 95% CI for positive SPSC with a few outside the range (Supplementary Figure S7). Parameter estimates and their respective standard errors were calculated for KL and KF (Supplementary Table S6).
A mean value of 0.028 and median value of 0.029 (5th and 95th percentile: 0.00–0.04) were obtained for all the slope values of linear predictive equations (for Langmuir KL) from model sensitivity analyses indicated the average slopes of the linear equation would be 0.02. The estimate would vary little with change in data, based on the small width of the observed percentiles. Similarly, the average value of intercept of the predictive equation obtained was −0.10 (5th and 95th percentile: 0.05–0.15). Based on the model sensitivity analyses, we propose a more generalized equation of Y = 0.02X-0.12. Similarly, the more generalized form of predictive exponential equation for Freundlich KF would be Y = 1.24X + 5.12 (mean: 1.25 and median: 1.23; 5th and 95th percentile: 1.05–1.49). These generalized equations can potentially be used site-specifically to predict the isotherm parameters from soil test data for samples in regions where Fe and Al primarily control soil P retention. The generalized equations are, however, not very different from the predictive equations developed.
Conclusions
Extant P loss predictive models use the Langmuir KL or Freundlich KF obtained from P adsorption isotherms. Our study documents a practical and accurate means of estimating KL and KF, normally determined by more cumbersome adsorption techniques, using readily-determinable extraction data incorporated into the PSR and SPSC expressions. This faster, more cost-effective means of obtaining these adsorption parameters can enable more detailed, site-specific modeling of dynamics and potential environment impact of P in surface and subsurface soil environments. Further studies are needed to verify the validity of the predictive equations for a wide range of soil types across Europe, the US and elsewhere.
Conflict of Interest Statement
The authors declare that the research was conducted in the absence of any commercial or financial relationships that could be construed as a potential conflict of interest.
Acknowledgments
Archived soils used in this study were collected with partial support from the Florida Department of Environmental Protection and the USDA—IFAFS. Support from the USDA—Hatch Funds for various soil analyses is gratefully acknowledged. Thanks are due to P K Nair and Lynn Sollenberger for critically going through the manuscript. The authors would also like to thank Don Graetz, Myrlene Chrysostome, and lab personnel for their help with soil sampling, and Debolina Chakraborty and Dawn Lucas for help with the analytical procedures. We would also like to express our thanks to Dean Rhue for valuable discussions during the earlier stages of this work.
Supplementary Material
The Supplementary Material for this article can be found online at: https://www.frontiersin.org/article/10.3389/fenvs.2015.00070
References
Andres, A. S., and Sims, J. T. (2013). Assessing potential impacts of a wastewater rapid infiltration basin system on groundwater quality: a Delaware case study. J. Environ. Qual. 42, 391–404. doi: 10.2134/jeq2012.0273
Bahl, G. S., and Toor, G. S. (2002). Influence of poultry manure on phosphorus availability and the standard phosphate requirement of crop estimated from quantity–intensity relationships in different soils. Bioresour. Tech. 85, 317–322. doi: 10.1016/S0960-8524(02)00083-4
Barrow, N. J. (1978). The desorption of phosphate adsorption curves. J. Soil Sci. 29, 447–462. doi: 10.1111/j.1365-2389.1978.tb00794.x
Beck, M. A., Zelazny, L. W., Daniels, W. L., and Mullins, G. L. (2004). Using the Mehlich-1 extract to estimate soil phosphorus saturation for environmental risk assessment. Soil Sci. Soc. Am. J. 68, 1762–1771. doi: 10.2136/sssaj2004.1762
Bergström, L., Kirchmann, H., Djodjic, F., Kyllmar, K., Ulen, B., Lie, J., et al. (2015). Turnover and losses of phosphorus in Swedish agricultural soils: long-term changes, leaching trends, and mitigation measures. J. Environ. Qual. 44, 512–523. doi: 10.2134/jeq2014.04.0165
Berkheiser, V. E., Street, J. J., Rao, P. S. C., Yuan, T. L., and Ellis, B. G. (1980). Partitioning of inorganic orthophosphate in soil−water systems. Crit. Rev. Environ. Control. 10, 179–224. doi: 10.1080/10643388009381680
Casson, J. P., Bennett, D. R., Nolan, S. C., Olson, B. M., and Ontkean, G. R. (2006). Degree of phosphorus saturation thresholds in manure-amended soils of alberta. J. Environ. Qual. 35, 2212–2221. doi: 10.2134/jeq2006.0085
Chakraborty, D., Nair, V. D., and Harris, W. G. (2012). Compositional differences between alaquods and paleudults affecting phosphorus sorption-desorption behavior. Soil Sci. 177, 188–197. doi: 10.1097/SS.0b013e31824329ca
Chakraborty, D., Nair, V. D., Chrysostome, M., and Harris, W. G. (2011). Soil phosphorus storage capacity in manure-impacted Alaquods: implications for water table management. Agric. Ecosyst. Environ. 142, 167–175. doi: 10.1016/j.agee.2011.04.019
Chambers, P. A., Guy, M., Dixit, S. S., Benoy, G. A., Brua, R. B., Culp, J. M., et al. (2009). Nitrogen and Phosphorus Standards to Protect the Ecological Condition of Canadian Streams, Rivers and Coastal Waters. National Agri-Environmental Standards Initiative synthesis report No. 11. Environment Canada, (Gatineau, QC).
Chardon, W. J., and Blaauw, D. (1998). Kinetic Freundlich equation applied to soils with a high residual phosphorus content. Soil Sci. 163, 30–35. doi: 10.1097/00010694-199801000-00005
Chrysostome, M., Nair, V. D., Harris, W. G., and Rhue, R. D. (2007). Laboratory validation of soil phosphorus storage capacity predictions for use in risk assessment. Soil Sci. Soc. Am. J. 71, 1564–1569. doi: 10.2136/sssaj2006.0094
Gassman, P. W., Williams, J. R., Benson, V. W., Izaurralde, R. C., Hauck, L. M., Jones, C. A., et al. (2004). “Historical development and applications of the EPIC and APEX models,” in ASAE/CSAE Meeting Paper No. 042097, ASAE. (St. Joseph, MI).
Graetz, D. A., and Nair, V. D. (1995). Fate of phosphorus in Florida spodosols contaminated with cattle manure. Ecol. Eng. 5, 163–181. doi: 10.1016/0925-8574(95)00023-2
Grant, R. F., and Heaney, D. J. (1997). Inorganic phosphorus transformation and transport in soils: mathematical modeling in ecosystem. Soil Sci. Soc. Am. J. 61, 752–764. doi: 10.2136/sssaj1997.03615995006100030008x
Greening, H., and Janicki, A. (2006). Toward reversal of eutrophic conditions in a subtropical estuary: water quality and seagrass response to nitrogen loading reductions in Tampa Bay, Florida, USA. Environ. Manage. 38, 163–178. doi: 10.1007/s00267-005-0079-4
Groenendijk, P., and Kroes, J. G. (1999). Modeling the Nitrogen and Phosphorus Leaching to Groundwater and Surface Water with ANIMO 3.5 Report 144, DLO Winland Staring Centre, (Wageningen).
Harris, W. G., Rhue, R. D., Kidder, G., Brown, R. B., and Littell, R. (1996). Phosphorus retention as related to morphology of sandy coastal plain soil materials. Soil Sci. Soc. Am. J. 60, 1513–1521. doi: 10.2136/sssaj1996.03615995006000050032x
Jarvie, H. P., Sharpley, A. N., Spears, B., Buda, A. R., May, L., and Kleinman, P. J. A. (2013). Water quality remediation faces unprecedented challenges from “legacy phosphorus.” Environ. Sci. Technol. 47, 8997–8998. doi: 10.1021/es403160a
King, K. W., Williams, M. R., and Fausey, N. R. (2015). Contributions of systematic tile drainage to watershed-scale phosphorus transport. J. Environ. Qual. 44, 486–494. doi: 10.2134/jeq2014.04.0149
King, K. W., Williams, M. R., Macrae, M. L., Fausey, N. R., Frankenberger, J., Smith, D. R., et al. (2014). Phosphorus transport in agricultural subsurface drainage: a review. J. Environ. Qual. 44, 467–485. doi: 10.2134/jeq2014.04.0163
Kleinman, P. J. A., Church, C., Saporito, L. S., McGrath, J. M., Reiter, M. S., Allen, A. L., et al. (2015). Phosphorus leaching from agricultural soils of the Delmarva Peninsula, USA. J. Environ. Qual. 44, 524–534. doi: 10.2134/jeq2014.07.0301
Knisel, W. G. (ed.). (1980). CREAMS: A Field-scale Model for Chemicals, Runoff and Erosion from Agricultural Management Systems. Washington, DC: US Department of Agriculture, Conservation Research Report 26.
Knisel, W. G. (ed.). (1993). GLEAMS: Groundwater Effects of Agricultural Management Systems, Version 2.1. UGA-CPESBAED Pub. No 5, University of Georgia (Tifton).
Knisel, W. G., Leonard, R. A., Davis, F. M., and Sheridan, J. M. (1991). Water balance components in the Georgia Coastal Plain: a GLEAMS model validation and simulation. J. Soil and Water Conser. 46, 450–456.
Krores, J. G., and Roelsma, J. (1998). ANIMO 3.5; Users Guide for the ANIMO Version 3.5 Nutrient Leaching Model. Technical Document 46, DLO Winland Staring Centre for integrated land, soil and water research, (Wageningen).
Langmuir, I. (1918). The adsorption of gases on plane surfaces of glass, mica, and platinum. J. Am. Chem. Soc. 40, 1361–1403. doi: 10.1021/ja02242a004
Lehrter, J. C. (2008). Regulation of eutrophication susceptibility in oligohaline regions of a northern Gulf of Mexico estuary, Mobile Bay, Alabama. Mar. Pollut. Bull. 56, 1446–1460. doi: 10.1016/j.marpolbul.2008.04.047
Li, M., Hou, Y. L., and Zhu, B. (2007). Phosphorus sorption-desorption by purple soils of China in relation to their properties. Aust. J. Soil Res. 45, 182–189. doi: 10.1071/SR06135
Loeppert, R. L., and Inskeep, W. P. (1996) “Iron,” in Methods of soil analysis, Part 3 SSSA Book Series No. 5, ed D. L. Sparks (Madison, WI: ASA SSSA), 639–664.
Maguire, R. O., and Sims, J. T. (2002). Soil testing to predict phosphorus leaching. J. Environ. Qual. 31, 1601–1609. doi: 10.2134/jeq2002.1601
McCray, J. E., Kirkland, S. L., Siegrist, R. L., and Thyne, G. D. (2005). Model parameters for simulating fate and transport of on-site wastewater nutrients. Groundwater 43, 628–639. doi: 10.1111/j.1745-6584.2005.0077.x
McDowell, R. W., and Monaghan, R. M. (2015). Extreme phosphorus losses in drainage from grazed dairy pastures on marginal land. J. Environ. Qual. 44, 545–551. doi: 10.2134/jeq2014.04.0160
McDowell, R. W., and Sharpley, A. N. (2001). Approximating phosphorus release from soils to surface runoff and subsurface drainage. J. Environ. Qual. 30, 508–520. doi: 10.2134/jeq2001.302508x
McGechan, M. B., and Lewis, D. R. (2000). Watercourse pollution due to surface runoff following slurry spreading, Part 2: decision support to minimize pollution. J. Agril. Eng. Res. 75, 429–447. doi: 10.1006/jaer.2000.0527
McGechan, M. B. (2002). Sorption of phosphorus by soil, Part 2: measurement methods, results and model parameter values. Biosyst. Eng. 82, 115–130. doi: 10.1006/bioe.2002.0068
McKeague, J. A., and Day, J. H. (1966). Dithionate-and oxalate-extractable Fe and Al as aids in differentiating various classes of soils. Can. J. Soil Sci. 46, 13–22. doi: 10.4141/cjss66-003
Mehadi, A. A., and Taylor, R. W. (1988). Phosphate adsorption by two highly-weathered soils. Soil Sci. Soc. Am. J. 52, 627–632. doi: 10.2136/sssaj1988.03615995005200030005x
Murphy, J., and Riley, J. P. (1962). A modified single solution method for the determination of phosphate in natural waters. Anal. Chim. Acta. 27, 31–36. doi: 10.1016/S0003-2670(00)88444-5
Nair, V. D. (2014). Soil phosphorus saturation ratio for risk assessment in land use systems. Front. Environ. Sci. 2:6. doi: 10.3389/fenvs.2014.00006
Nair, V. D., Clark, M. W., and Reddy, K. R (2015). Evaluating Legacy Phosphorus Storage and Release from Wetland Soils. J. Environ. Qual. doi: 10.2134/jeq2015.03.0154. [Epub ahead of print].
Nair, V. D., and Graetz, D. A. (2002). Phosphorus saturation in spodosols impacted by manure. J. Environ. Qual. 31, 1279–1285. doi: 10.2134/jeq2002.1279
Nair, V. D., Graetz, D. A., and Reddy, K. R. (1998). Dairy manure influences on phosphorus retention capacity of spodosols. J. Environ. Qual. 27, 522–527. doi: 10.2134/jeq1998.00472425002700030007x
Nair, V. D., and Harris, W. G. (2004). A capacity factor as an alternative to soil test phosphorus in phosphorus risk assessment. New Zeal. J. Agric. Res. 47, 491–497. doi: 10.1080/00288233.2004.9513616
Nair, V. D., and Harris, W. G. (2014). Soil phosphorus storage capacity for environmental risk assessment. Adv. Agri. 2014:723064. doi: 10.1155/2014/723064
Nair, V. D., and Reddy, K. R. (2013). “Phosphorus sorption and desorption in wetland soils,” in Methods in Biogeochemistry of Wetlands, eds R. DeLaune, K. R. Reddy, C. J. Richardson, and P. Megonigal (Madison, WI: Soil Science Society of America Publication), 667–678. doi: 10.2136/sssabookser10.c34
Nelson, N. O., Parson, J. E., Radcliffe, D. E., and Cabrera, M. L. (2007). “Basic approaches to modeling phosphorus leaching,” in Modeling Phosphorus in the Environment, eds D. E. Radcliffe and M. L. Cabrera (Boca Raton, FL: CRC Press), 81–103.
Paerl, H. W. (2009). Controlling eutrophication along the freshwater-Marine continuum: dual nutrient (N and P) reductions are essential. Estuaries Coasts. 32, 593–601. doi: 10.1007/s12237-009-9158-8
Patron, W. J., Schimel, D. S., Cole, C. V., and Ojima, D. S. (1987). Analysis of factors controlling soil organic matter in Great Plains grasslands. Soil Sci. Soc. Am. J. 51, 1173–1179. doi: 10.2136/sssaj1987.03615995005100050015x
Politis, D. N., and Romano, J. P. (1994). The stationary bootstrap. J. Am. Stat Assos. 89, 1303–1313. doi: 10.1080/01621459.1994.10476870
Radcliffe, D. E., and Cabrera, M. L. (eds.). (2006). Modeling Phosphorus in the Environment. Boca Raton, FL; London; New York, NY: CRC Press.
SAS (2010). SAS Software, Version (9.3) of the SAS System for Windows. Copyright © (2010) SAS Institute Inc. Cary, NC.
Schoumans, O. F., Salm, C. V. D., and Groenendijk, P. (2013). PLEASE: a simple model to determine P lossses by leaching. Soil Use Manage. 29, 138–146. doi: 10.1111/sum.12008
Sharpley, A., Jarvie, H. P., Buda, A., May, L., and Kleinman, P. (2013). Phosphorus legacy: overcoming the effects of past management practices to mitigate future water quality impairment. J. Environ. Qual. 42, 1308–1326. doi: 10.2134/jeq2013.03.0098
Sims, J. T., Maguire, R. O., Leytem, A. B., Gartley, K. L., and Pautler, M. C. (2002). Evaluation of Mehlich 3 as an agri-environmental soil phosphorus test for the Mid-Atlantic United States of America. Soil Sci. Soc. Am. J. 66, 2016–2032. doi: 10.2136/sssaj2002.2016
Taylor, R. W., Bleam, W. F., and Tu, S. (1996). On the Langmuir phosphate adsorption maximum. Commun. Soil Sci. Plant Anal. 27, 2713–2722. doi: 10.1080/00103629609369734
Team, R. C. (2012). R: A Language and Environment for Statistical Computing (Version 2.15.2) [Computer software]. Vienna: R Foundation for Statistical Computing. www.R-project.org.
USEPA (1983). US Environmental Protection Agency (USEPA). Methods of Chemical Analysis of Water and Wastes. Cincinnati, OH: Environmental Monitoring and Support Lab.
van der Zee, S. E. A. T. M., and van der Riemsdijk, W. H. (1988). Model for long-term phosphate. J. Environ. Qual. 17, 35–41.
Withers, P. J. A., and Haygarth, P. M. (2007). Agriculture, phosphorus and eutrophication: a European perspective. Soil Use Manag. 23, 1–4. doi: 10.1111/j.1475-2743.2007.00116.x
Zhou, M., and Li, Y. (2001). Phosphorus-sorption characteristics of calcareous soils and limestone from the southern Everglades and adjacent farmlands. Soil Sci. Soc. Am. J. 65, 1404–1412. doi: 10.2136/sssaj2001.6551404x
Keywords: Freundlich, Langmuir, Mehlich 3, oxalate, soil phosphorus storage capacity, threshold phosphorus saturation ratio
Citation: Dari B, Nair VD, Colee J, Harris WG and Mylavarapu R (2015) Estimation of phosphorus isotherm parameters: a simple and cost-effective procedure. Front. Environ. Sci. 3:70. doi: 10.3389/fenvs.2015.00070
Received: 02 July 2015; Accepted: 06 October 2015;
Published: 21 October 2015.
Edited by:
Christophe Darnault, Clemson University, USAReviewed by:
Owen W. Duckworth, NC State University, USAFederico Maggi, The University of Sydney, Australia
Copyright © 2015 Dari, Nair, Colee, Harris and Mylavarapu. This is an open-access article distributed under the terms of the Creative Commons Attribution License (CC BY). The use, distribution or reproduction in other forums is permitted, provided the original author(s) or licensor are credited and that the original publication in this journal is cited, in accordance with accepted academic practice. No use, distribution or reproduction is permitted which does not comply with these terms.
*Correspondence: Vimala D. Nair, vdn@ufl.edu