Validation of an Integrative Methodology to Assess and Monitor Reductive Dechlorination of Chlorinated Ethenes in Contaminated Aquifers
 Sonia-Estelle Tarnawski
 Pierre Rossi
 Maria V. Brennerova3
  Monika Stavelova
 Christof Holliger
- 1Laboratory for Environmental Biotechnology, School of Architecture, Civil and Environmental Engineering, École Polytechnique Fédérale de Lausanne, Lausanne, Switzerland
- 2Central Environmental Laboratory, School of Architecture, Civil and Environmental Engineering, École Polytechnique Fédérale de Lausanne, Lausanne, Switzerland
- 3Department of Cell Molecular Microbiology, Institute of Microbiology, Academy of Sciences of the Czech Republic, Prague, Czech Republic
- 4AECOM CZ s.r.o., Prague, Czech Republic
Bioremediation of tetra-and trichloroethene-contaminated aquifers is frequently hampered due to incomplete dechlorination to the more toxic dichloroethene (DCE) and vinyl chloride (VC), indicating insufficient knowledge about the biological mechanisms related to aquifer functioning. A methodology based on the joint analysis of geochemical and microbiological datasets was developed to assess the presence of the biochemical potential for complete reductive dechlorination to harmless ethene and to explain the reasons for which degradation often stalls at the more toxic intermediates. This methodology is composed of three successive steps, with (i) the acquisition of geochemical data including chlorinated ethenes (CEs), (ii) the detailed analysis of the bacterial community structures (BCS) as well as the biochemical potential for complete dechlorination using microcosms and molecular detection of organohalide-respiring bacteria and key reductive dehalogenases, and (iii) a statistical Multiple Factor Analysis (MFA) combining the above mentioned abiotic and biotic variables in a functional modeling of the contaminated aquifer. The methodology was validated by analyzing two chlorinated ethenes-contaminated sites. Results from the first site showed that the full biochemical potential for ethene production was present in situ. However, redox potential was overall too high and locally manganese reduction out-competed CEs reduction, explaining the reasons for the local accumulation of DCE and VC to a lesser extent. The second contaminated aquifer was under bioremediation by successive cheese whey injections. Analysis demonstrated that cheese whey additions led to increasingly reduced redox conditions and that hampered reductive dechlorination was not due to competition with other anaerobic respiration processes. Complete reductive dechlorination to ethene was preferentially occurring under methanogenic conditions. DCE and VC accumulation was probably induced first by low pH resulting from whey fermentation and at a later stage by phosphate limitation. In conclusions, the proposed methodology successfully allowed the identification of biogeochemical processes limiting or supporting complete dechlorination in both aquifers. The integrative approach provided fundamental information about the functional heterogeneity of the contaminated aquifers in time and space, and can be used as a reliable tool to support corrective decision-making in the development of remediation strategies based on natural attenuation of CEs.
Introduction
Chlorinated ethenes (CEs) such as tetrachloroethene (PCE) and trichloroethene (TCE) have been primarily used in industry as safe organic solvents for degreasing and cleaning. Transport and storage accidents, improper elimination, and mismanagement have caused large amounts of CEs to be dispersed in the environment. Nowadays, PCE and TCE belong to the most often encountered contaminants in aquifers. Residence time of CEs in polluted sites is generally long and highly dependent upon several factors, such as the phase state (dense non-aqueous phase liquid, DNAPL, vs. water dissolved, or gaseous; Bourg et al., 1992) and local geochemical conditions (Christensen et al., 2000; McMahon and Chapelle, 2008; Tobiszewski and Namieśnik, 2012). Biotic factors play an important role in the elimination of these compounds, in terms of the inherent capacity of the polluted habitat to regain a former uncontaminated status through bacterial-mediated reduction and oxidation processes (Bradley, 2000; Aulenta et al., 2006; Pant and Pant, 2010). Under anaerobic conditions, reductive dechlorination reactions are carried out by organohalide-respiring bacteria (OHRB; Maphosa et al., 2010) that substitute chlorine by hydrogen and sequentially reduce PCE via TCE, dichloroethnene (DCE) and vinyl chloride (VC) to harmless ethene. After a first elimination of the pollutant source and a maximal recovery of DNAPLs, using reductive dechlorination for remediation of the contamination plume appears as an attractive treatment option that can be applied in remediation strategies such as monitored natural attenuation (MNA, Rugner et al., 2006; Declercq et al., 2012), enhanced reductive dechlorination (ERD, Aulenta et al., 2006) or bioaugmentation (Hood et al., 2008).
Regulatory protocols that provide guidance for natural attenuation of contaminants assess the success of a remediation on three major criteria: (i) decrease of CEs concentrations in the aquifer, (ii) proven presence of the biochemical potential for complete dechlorination at least in laboratory experiments with aquifer samples, and (iii) in situ occurrence of dechlorination in an effective and sustainable manner (Wiedemeier et al., 1998; Côme et al., 2007). Yet, the assessment and degree of implication of reductive dechlorination in the remediation of an aquifer can only be achieved with difficulty. Field investigations using traditional physicochemical measurements often indicated that reductive dechlorination of PCE/TCE was hindered and resulted in accumulation of DCE and/or VC.
Several site investigations have highlighted the importance of the characterization of the autochthonous microbial communities (e.g., Davis et al., 2002; Lowe et al., 2002) and the detection of specialized OHRB able to completely dechlorinate CEs (e.g., Davis et al., 2008) to supplement the traditional monitoring of geochemical parameters (Weiss and Cozzarelli, 2008) and reliably identify the site-specific factors that preclude the complete reductive dechlorination reaction. Recent studies of CEs contaminated sites analyzed in an integrative manner geochemical and microbiological data so as to exploit possible synergies and significant correlations using multivariate statistical methods. Results of these statistical analysis suggested that the long term monitoring of both indigenous microbial community and environmental variables significantly reduced the uncertainty about the ongoing processes occurring in the groundwater system (Imfeld et al., 2008; van der Zaan et al., 2010; Kotik et al., 2013; Shani et al., 2013; Yamazawa et al., 2014). Mouser et al. (2010) indicated that the follow-up of a site by direct monitoring of the microbial profiles (without excessive validation by sequencing) was a useful and inexpensive tool for the long-term management of polluted aquifers.
Based on our expertise in the field of reductive dechlorination (e.g., Holliger et al., 1993; Holliger and Schumacher, 1994; Holliger et al., 1997; Imfeld et al., 2011; Rossi et al., 2012), numerical ecology as well as bacterial community analyses (e.g., Fromin et al., 2002; Jossi et al., 2006; Rossi et al., 2009, 2012), a comprehensive methodology for the assessment of the in situ potential for complete reductive dechlorination in contaminated aquifers was established (Tarnawski et al., 2015). The methodology adopts an ecological approach (de Lorenzo, 2008; Chakraborty et al., 2012) and examines simultaneously geochemical and microbiological data sets to assess the aquifer functioning and the fate of the contaminants. The assessment procedure uses relatively simple and cost effective analyses from water chemistry, classical and molecular microbiology and multivariate statistics. It is designed to sequentially answer the following questions: (i) is in situ reductive dechlorination activity present, (ii) is there a potential for complete dechlorination to ethene, and (iii) what could explain incomplete or delayed reductive dechlorination in the aquifer?
This study aims at validating the integrative methodology on two contaminated aquifers. The first one was in the pre-investigation stage and the methodology was used for diagnosing the in situ potential for complete reductive dechlorination and identifying the reasons for the stalling of the reductive dechlorination process at DCE and VC. The second aquifer was under bioremediation by successive cheese whey injections and the goal was to monitor the reductive dechlorination process and the fate of the CEs with time.
Materials and Methods
Experimental Design
The flow chart of the developed assessment methodology is schematically presented in Figure 1. The proposed methodology is composed of three consecutive steps. Each step provides informative outputs about occurrence or not of in situ CEs dechlorination and provides indications about the possible bioremediation strategies to explore. Acquisition of key abiotic environmental data composes the first step. The second step is divided in two sections. On the one hand, specific biomarkers involved in the reductive dehalogenation process such as OHRB guild members and specific reductive dehalogenase genes are assessed by PCR detection. On the other hand, microcosms providing optimal conditions for the expression of the potential OHR activity are set in using water or aquifer solid material. The third step involves the analysis of the microbial community structures (T-RFLP) and a statistical Multiple Factor Analysis (MFA) combining all data sets. The output of this analysis provides a graphical representation of the biogeochemical status of the aquifer, as well as statistically significant correlations between reductive dechlorination reactions and terminal electron accepting processes (TEAPS), and between bacterial community structures (BCS) and single or group of environmental variables.
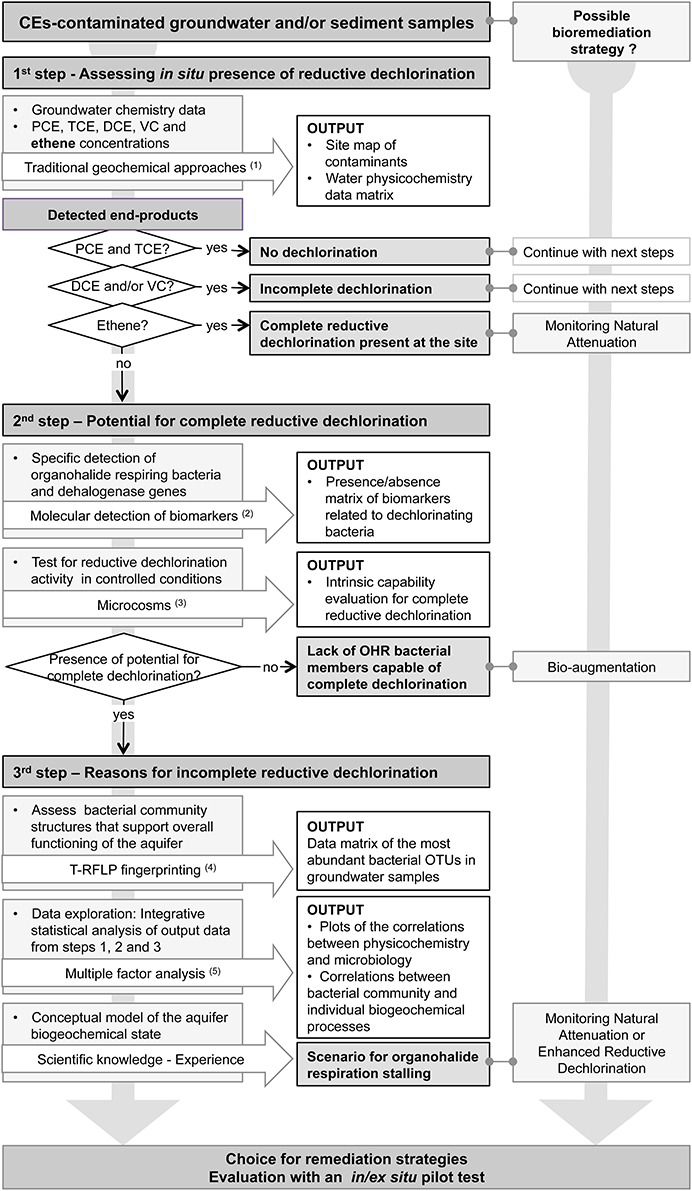
Figure 1. Diagram of the integrative methodology to assess in situ potential for reductive dechlorination at a chlorinated ethenes-contaminated site. OTU, Operational Taxonomic Unit defined by specific T-RF sizes; OHR, organohalide respiration; (1), (Appelo and Postma, 2005); (2), (Maphosa et al., 2010); (3), (Holliger et al., 1993); (4), (Rossi et al., 2009); (5), (Shani et al., 2013).
Sites Investigated
Site A
Site description
Site A is a former municipal landfill near Geneva, Switzerland, in use between 1949 and 1963 (Figure 2 Site A). This landfill was covered with a layer of inert geological material and debris (0.5 to 4 m of depth) and part of the site is currently occupied by private gardens. The landfill was embedded in an alluvial gravel and sandy loam formation with a depth ranging from 0.5 to 6.3 m that was unsaturated at low water level. The groundwater system was composed of an upper water-table of limited extent and a lower aquifer (Figure S1). Below 4 m, the aquifer is mainly composed by sandy loam of the Würmian supraglacial retreat. Water gradient (ca 1%) was directed North to South. The site was equipped with 24 monitoring wells and was mainly contaminated by PCE (max. 1500 μg/L), with an accumulation of both cisDCE (max. 368 μg/L) and VC (max. 5.7 μg/L), and showing no apparent ethene production.
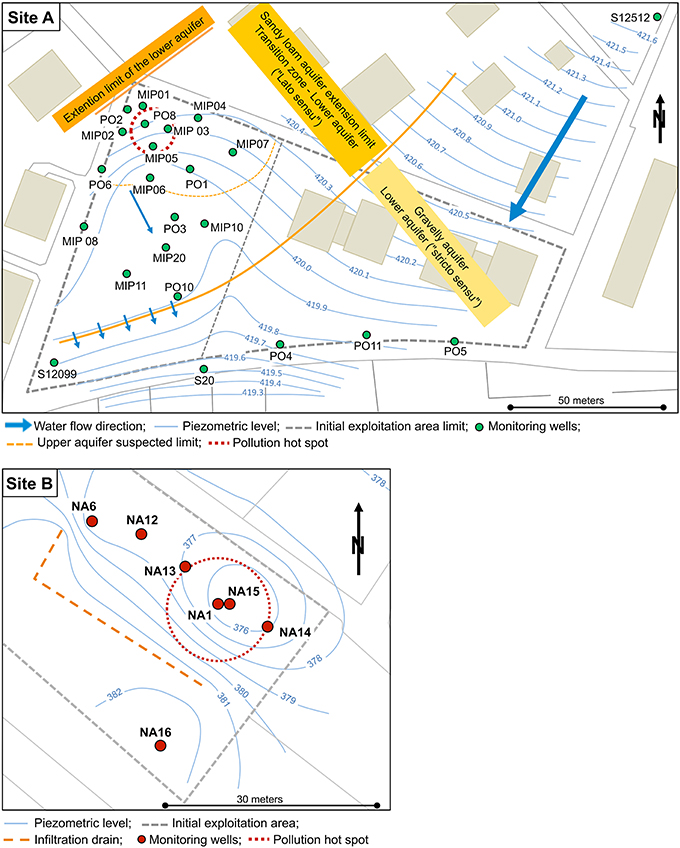
Figure 2. Maps of the contaminated Sites A and B. Monitoring wells are shown in green and red circles for sites A and B, respectively. Site A is composed of an upper water table of limited extent and of a lower aquifer. The water level of the lower aquifer is displayed on the figure only. Site B is composed of a single aquifer with a slow groundwater flow. For both sites, the former exploited areas are shown with dashed gray lines (the left part of the site A delimiting current private gardens).
Sampling and physicochemical analyses
In total, 25 water samples were collected in a sampling campaign in April 2013. Sampling wells were purged using a 12 V submersible pump (Whale submersible 921, Whale Water Systems, Northern Ireland) until temperature, conductivity (eC), dissolved oxygen (dO2), pH, and redox potential values (Eh) reached stable readings. Samples for chemical analyses were taken with the submersible pump whereas samples for microbiological analyses were collected at a flow rate of about 100 mL/min using a PTFE tubing connected to a surface peristaltic pump (Type P2.52, Eijkelkamp, Netherlands). Samples for CEs analysis were collected in 120-mL glass bottles sealed with PTFE-lined screw caps. Samples for major anions and total organic carbon (TOC) analyzes were collected in 125-mL polypropylene bottles. Those for cations and dissolved Fe2+ and Mn2+ measurements were filtered on-site through 0.45 μm nitrocellulose membranes (Merk Millipore, Schaffhausen, Switzerland), acidified to pH < 2 with ultrapure nitric acid and were collected in 50-mL bottles. Samples for molecular analyses were stored in sterile 1-L polypropylene Nalgene® bottles (Thermo Fisher Scientific, USA) and kept in the dark at 4°C until processing within 48 h.
Geological material dedicated to microcosm experiments were obtained after core drilling and the setting of new observation wells. Aquifer material was collected from wells PO7 (7.20 and 8.10 m), PO8 (6.20 and 7.10 m), PO10 (7.50 and 9.30 m), and PO11 (8.70 m, all depths measured from the surface level; Figure S1). Approximately 300 mL of sediment was collected from the center of the soil cores in a sterile glass jar, without headspace. The jar was hermetically sealed and stored at 4°C until analysis.
pH, electric conductivity (eC), oxidation-reduction potential (Eh), temperature (°C) and dO2 were measured on-site in a flow cell. , , , , , Mn2+, Fe2+, S2−/H2S, C2H6, C2H4, CH4, , Cl−, F−, K+, TOC as well as PCE, TCE, cisDCE, VC concentrations were analyzed by Scitec Research (Lausanne, Switzerland).
Site B
Site description
Site B is located in the vicinity of a former bicycle production plant near Námìš9D nad Oslavou, Czech Republic. The plant facilities were used for machine production since 1920. The site was primarily contaminated with PCE and TCE, and additionally with oil hydrocarbons (residual COD not higher than 22 mg/L). Site B is under ERD by the engineering company AECOM CZ s.r.o. since 2010. The ground water level is situated at 1.6–2.0 m below the surface. The ground water circulation is bound to two aquifers, an upper quaternary non-continuous and lower eluvial continuous circulation aquifer. The interconnectivity of the both aquifers was verified in 2010 by a tracer test using fluorescein. The saturation of the both collectors is influenced by series of half-insulator layers consisting of clayey sediments. The local saturation of the backfill plays a significant role in the limitation of the contamination expansion. The site is equipped with an infiltration drain, 6 wells (NA-1, NA-6, NA-12, NA-13, NA-14, NA-15) for plume monitoring, and one control well located outside of the contaminated area (NA-16; Figure 2 Site B). Wells NA-1 and NA-6 sample groundwater from the upper aquifer, all the others from the lower aquifer. The first stage of remedial activities from November 2008 to February 2010 consisted of LNAPL removal by pumping groundwater from wells NA-1, NA-6, NA-12, and NA-14, followed by a treatment in a mobile remediation station and reinjection into a 35 m long infiltration drain. The concentrations of oil hydrocarbons dropped below detection limits whereas the concentration of CE gradually increased in the pumped water. At this point, ERD was started to be implemented. Before the initiation of ERD, maximal concentrations of PCE and TCE were 1380 and 897 μg/L, respectively. Accumulation of cis-1,2 DCE (max. 3730 μg/L) and some VC (max. 6.2 μg/L) was detected but no ethene formation. The contaminant concentration legal limits targeted for the site were 350 μg/L for PCE, 85 μg/L for TCE, and 200 μg/L for DCE. An ERD pilot test with organic substrate application (e.g., cheese whey) through the infiltration drain and the monitoring wells was carried out during 6 months from May 2010 to November 2010. The subsequent full scale remediation lasted 13 months from October 2011 to October 2012. After a rebounding of CE has appeared half a year later, additional cheese whey was injected in September 2013. Details about substrate dosing over time are presented in Table S1.
Sampling and physicochemical analyses
Water sampling for microbial and chemical analyses were carried out from all monitoring wells and the control well (Figure 2 Site B) using pump with flow regulation (Gigant, Eijkelkamp) and in the same manner as for the site A. For microcosm experiments, groundwater was sampled during the April 2013 sampling campaign from wells NA-1, NA-14, NA-15, and NA-16. Sterile 120-mL glass bottles (Infochroma AG, Switzerland) were completely filled, sealed using PTFE-lined screw caps, and stored at 4°C until analysis.
The list of chemical parameters analyzed at this site is similar as the one provided for Site A, except that Cl−, F−, and were not analyzed. TOC was replaced indirectly by the measurement of chemical oxygen demand (COD) to assess the concentration of organic compounds. All chemical analyses were done in the accredited Analytical Laboratory Services (ALS Life Sciences, Praha, Czech Republic).
Microcosm Preparation
Anaerobic growth medium was prepared as detailed in Holliger et al. (1993), except that fermented yeast extract solution was replaced by 0.1 g/L of peptone. For one microcosm, 50 mL of sterilized anaerobic medium were completed with 5 mL of PCE dissolved in hexadecane (100 mM final concentration) and with 1 mL of sterile electron donor stock solution containing ethanol, butyrate, propionate (100 mM each). Gas phase was changed aseptically with N2/CO2 (4:1, vol/vol). The microcosms were inoculated with 20 g of aquifer material and 5 mL of aquifer water samples for sites A and B, respectively. Microcosms were incubated in the dark at 30°C for 3 months. An aliquot of 2 mL of electron donor stock solutions was added every 2 weeks. Gas phase was sampled regularly and analyzed using GC-FID for the quantification of the relative proportions of the dechlorination products TCE, cisDCE, VC, and ethene.
DNA Extraction for Molecular Analyses
Water samples from both sites were filtered through 0.2 μm sterile polycarbonate membranes (Isopore™ Membrane Filters, Millipore) with a mobile filtration system (Filter Funnel Manifolds, Pall Corporation) under a laminar flow hood. Filters were inserted into a sterile polypropylene plastic bag (Whirl-Pak, Nasco, USA) with 10 mL of phosphate buffer (0.12M, pH 8) and 1 mL SDS 10%. Bags were sealed and filters were incubated at 70°C for 30 min, followed by a second incubation at 65°C for 30 min with the adjunction of 50 μL of proteinase K (2.5U/mg, Promega, Switzerland). Filters were removed from the incubation solution that was transferred in a 50 mL centrifugation tube. The incubation solution was extracted two times with 40 mL of n-butanol (centrifuge 5 min. at 5000 rpm). An aliquot of 400 μL of the concentrated incubation solution containing the extracted DNA were processed using the Maxwell 16 Tissue DNA purification Kit in the Maxwell 16 Instrument configured with the Maxwell 16 SEV Hardware Kit according to the manufacturer protocols (all components from Promega, Switzerland). Extracted DNA samples were quantified with a ND-1000 Nanodrop spectrophotometer (Thermo Fisher Scientific, USA).
PCR Detection of 16S rRNA Genes of OHRB and Dehalogenase Genes
Detection of 16S rRNA genes of OHR bacterial guild members and dehalogenase genes (rdhA) was assessed by PCR amplification using primers listed in Table 1. All PCR reagents were provided by PeqLab Biotechnologie (Germany). Amplification reactions were carried out in a Thermal Cycler T3 Biometra (Biometra, Switzerland). PCR products were visually inspected on 1.5% agarose gels stained with GelRed (Stratec Molecular, Germany).
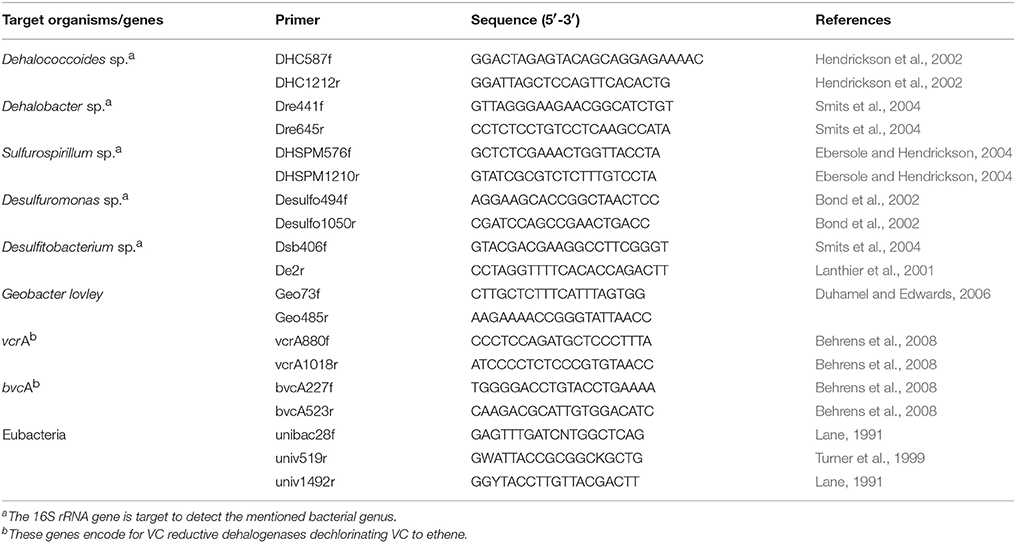
Table 1. PCR primers for the detection of targeted bacterial genera and catabolic genes so as to assess the presence of biochemical potential for reductive dechlorination of PCE.
The VC reductive dehalogenase genes vcrA and bvcA were amplified in 10 μL reaction mixture containing (final concentration): 1X Buffer S (including 1.5 mM MgCl2), 1.2 mM of dNTPs, 1X Enhancer P, 1 μM of each primer, 0.05 U/μL of PeqGOLD Taq polymerase, and 0.2 ng/μL of template DNA extract. The respective 247 and 139 base pairs DNA fragments were amplified as follows: 4 min 30 s preheating at 94°C, 40 cycles of 30 s denaturation at 94°C, 45 s of primer annealing at 55°C, 30 s of elongation at 72°C, then a 10 min final elongation step at 72°C.
Taxon-specific 16S rRNA genes were amplified with a nested PCR procedure. Gene pools were amplified first using Eubacterial primers Eub28f—Univ1492r in 30 μL reaction mixture containing (final concentrations): 1X Buffer S (including 1.5 mM MgCl2), 800 μM dNTPs, 1X Enhancer P, 0.5 μM of each primer, 0.05 U/μL PeqGOLD Taq polymerase, and 0.2 ng/μL of template DNA. Amplification of the 1480 pb fragment was carried out with the following program: 5 min preheating at 94°C, 30 cycles of 30 s denaturation at 94°C, 45 s of primer annealing at 50°C, 1 min of elongation at 72°C, then a 10 min final elongation step at 72°C. PCR products were diluted 10 to 100 folds prior to the second amplification step using taxon-specific pairs of primers (Table 1) in 10 μL reaction mixture containing (final concentrations): 1X Buffer Y (including 2 mM MgCl2), 3.2 mM dNTPs, 1X Enhancer P, 0.5 μM of each primers, 0.05 U/μL PeqGOLD Taq polymerase, and 1 μL of diluted PCR product. Amplification of the 510 bp fragment was carried out with the following program: 5 min preheating at 94°C, 30 cycles of 30 s denaturation at 94°C, 45 s of primer annealing at 55°C, 45 s of elongation at 72°C, then a 10 min final elongation step at 72°C.
Characterization of Bacterial Community Structures
BCS were analyzed using terminal-restriction fragment length polymorphism (T-RFLP). Technical processing of sample analysis and of numerical treatment of the raw data were done as described in Rossi et al. (2009) with the following modifications: (i) PCR products were generated with a combination of FAM-labeled Eub28f and Univ519r primers using 20 μL PCR reaction mix containing (final concentrations): 1X Buffer S (including 1.5 mM MgCl2), 800 μM dNTPs, 1X Enhancer P, 0.5 μM of 28f primer, 0.75 μM of 519r primer 0.05 U/μL PeqGOLD Taq polymerase, and 0.2 ng/μL of template DNA, and (ii) PCR products were purified with the MSB Spin PCRapace kit (Stratec Molecular, Germany) according to the manufacturer instructions.
Statistical Analyses of the Data
BCS and environmental data sets were explored jointly using (MFA, Borcard et al., 2011) as described previously (Shani et al., 2013). MFA is a generalization of Principal Component Analysis (PCA). This technique allows the analysis of several data sets collected on the same set of observations and evaluates the possible presence of relationships between variables or groups of variables (Abdi et al., 2013). The unconstrained multivariate analysis MFA was preferred to constrained multivariate analysis such as RDA and CCA since the data are analyzed without initial hypothesis that the environmental variables explain the distribution of taxa in the microbial communities. In this study, the collected data were categorized in different groups of variables: (i) a group “% CEs” containing the relative percentages of PCE, TCE, DCE, and CV over the totality of the CEs or “%PCE and %DP” containing the percentages of PCE and of its degradation products, including ethene and ethane, relative to the sum of their concentrations, for site A and for site B, respectively; both are an indication of the accumulation of each degradation product in the aquifer, (ii) group “TEAs” (for Terminal Electron Acceptors) included both environmental parameters related to TEAPs as well as CEs, (iii) group “Others” contained environmental parameters such as major cations and anions and physical parameters, and finally (iv) the last group “BCS” contained T-RFLP data.
MFA produces different graphical outputs displaying distribution of samples as points (individual factor map) according to their respective environmental and microbial collected measurements depicted as vectors (correlation circle) both in single two-dimensional graphics. Significant correlation (p < 0.05) between a measured parameter and one or both axes of the MFA indicates a variable contributing significantly to the MFA statistical model and consequently to the functioning of the system. Pairwise Pearson correlation coefficients and RV multivariate correlation coefficients as well as their associated asymptotic p-values were calculated to evaluate intra-relationships between environmental variables and inter-relationships between environmental variables and bacterial communities, respectively. Spearman pairwise correlations were computed between single T-RFs and single environmental variables so as to reveal significant correlations with the ongoing biogeochemical processes. The statistical analyses were performed using R software (R Core Team, 2014).
Results and Discussion
Site A—Diagnosis of the In Situ Potential for a Complete Reductive Dechlorination of PCE
Step 1: Assessment of In situ Reductive Dechlorination
CEs concentrations on site (Figure 3) showed that PCE exceeded locally 37.5 times the Swiss legal limit. Dechlorination products TCE, cisDCE, and VC were also present, with concentrations of cisDCE and VC exceeding the legal limits by 8.5 and 56 times, respectively. Ethene could not be detected indicating incomplete reductive dechlorination of PCE in the aquifer. Incomplete reductive dechlorination was observed regularly at CEs-contaminated sites and the reported causes were related either to specifically unfavorable environmental conditions (Shani et al., 2013) or to missing intrinsic OHRB within the autochthonous microbial community (Davis et al., 2008; Hood et al., 2008).
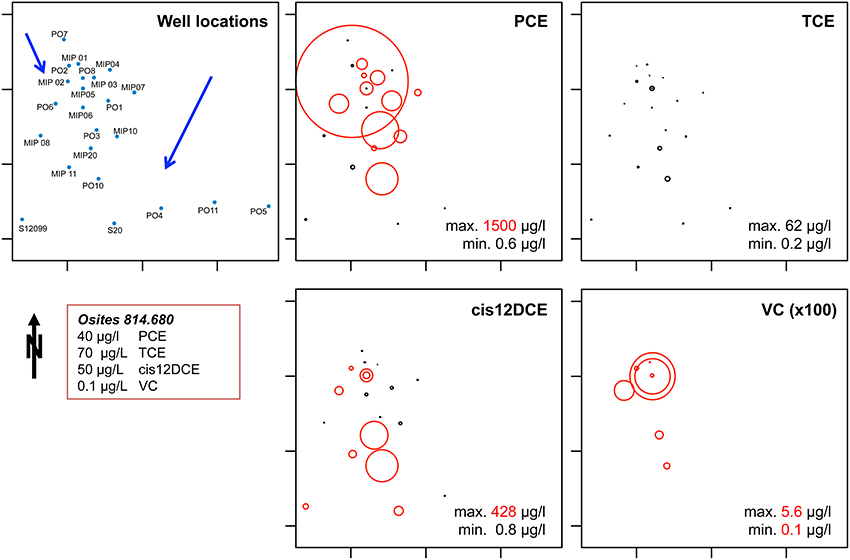
Figure 3. Map of the contaminants (PCE, TCE, cis 1-2 DCE, and VC) present at site A. The diameter of the circles is proportional to their respective concentrations. Red circles correspond to concentrations that exceed limits fixed in the Swiss Federal Ordinance on Contaminated Sites (OSites, shown in the red box). Black circles correspond to non-zero concentrations under OSites limits. The scale used to plot VC concentrations is 100 fold higher than the one use for others CEs.
Step 2: Assessment of Biochemical Potential for Complete PCE Dechlorination
Dehalococcoides spp. and the genes vcrA and bvcA were detected in 4, 5, and 3 of the 25 well samples analyzed, respectively. Two of these wells showed the presence of both Dehalococcoides and at least one of the two VC reductive dehalogenase genes (Table 2). Dehalobacter spp., an obligate OHRB known to dechlorinate PCE to cisDCE, was detected in three wells, two of which also showed presence of Dehalococcoides. The facultative OHRB Sulfurospirillum spp. was detected in two wells in which also Dehalococcoides was detected. Desulfitobacterium sp. and Desulfuromonas sp. were the most frequently detected OHRB genera which were found to the exclusion of any other OHRB or rdhA gene in 52% of the samples. In well MIP05-2, six of the seven biomarkers were detected, indicating that the highest natural enrichment of OHR activity occurred at this location. Microcosm experiments showed that after an incubation of 130 days, reductive dechlorination of PCE to VC was observed within 4 of the seven tested samples and that two samples even achieved ethene production (Table 3). Hence, microcosm results combined with molecular detection of both OHRB and VC reductive dehalogenase genes in water samples strongly suggested that the biochemical potential for complete dechlorination of PCE was present in situ. This potential could not be detected throughout the entire aquifer which might simply be related to the detection limits.
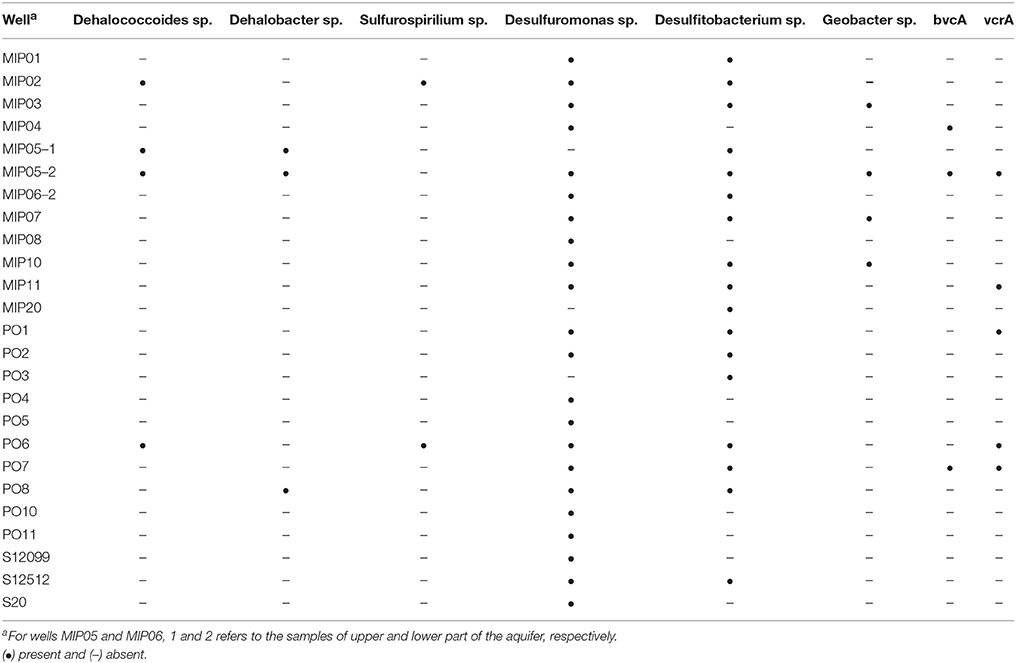
Table 2. PCR Detection of 16S rRNA genes of OHRB and of reductive dehalogenase genes bvcA and vcrA.
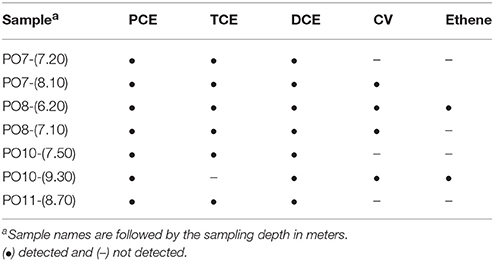
Table 3. Dechlorination products detected in microcosms inoculated with solid aquifer samples from Site A after 130 days of incubation.
Step 3: Reasons for Incomplete In situ Reductive Dechlorination
The establishment of full and effective reductive dechlorination of PCE to ethene in an aquifer requires the presence of suitable trophic and oxidation-reduction conditions, in close interactions with the bacterial communities that underlie the proper functioning of the aquifer (de Lorenzo, 2008; Chakraborty et al., 2012). The investigations carried out in steps 1 and 2 indicated that at site A, the environmental conditions were not globally favorable for the development of OHRB involved in the reduction of cisDCE and specifically VC since no ethene was detected in the aquifer.
MFA explored the correlations between bacterial communities and environmental parameters separated in the three groups of explicative variables “%CES,” “TEAs,” and “Others,” as well as the correlations between environmental parameters themselves. Environmental variables with significant correlations with one of both components of the MFA are displayed in Figure 4. A detailed analysis of the biogeochemical MFA model is presented in the Supplementary Material. On Figure 4, samples present in the left quadrants of the Individual factor map were discriminated by dO2 as shown in the Correlation circle graph. Presence of these overall aerobic conditions and high relative concentrations of PCE (%PCE) indicated that no or little dechlorination was occurring at these locations. In the right quadrants of the MFA, vectors of the significantly correlated variables MnII, , TCE, %TCE, cDCE, %cDCE, and VC (Table S3) were all pointing in the same direction, in opposition to oxygen. The position of these vectors clearly confirmed that PCE dechlorination was occurring in sampling locations where Mn(II) and were present. However, dechlorination products such as TCE and cisDCE were accumulating. Presence of Mn(II) and was interpreted here as products of anaerobic respiration processes, such as manganese reduction and dissimilatory nitrate reduction to ammonium (DNRA). Wells concerned by these processes were MIP05-lower, MIP11, MIP20, and MIP06-lower (Figure 4A). In terms of microbial respiration, manganese reduction has a very similar standard reduction potential (+0.52 volts; Norris, 1993; Christensen et al., 2000) as reductive dechlorination of PCE (+0.58 volts; Vogel et al., 1987; Norris, 1993) and TCE (+0.54) that might explain the co-occurrence of these respiration processes. Reductive dechlorination of cisDCE however has a lower standard reduction potential (+0.37). Consequently, this respiration process was apparently in competition with manganese reduction for electron donors leading to the accumulation of this latter dechlorination product.

Figure 4. Multiple Factor Analysis (MFA) exploring environmental and bacterial community structures of Site A. (A): Individual map factor, Showing sample (dis)similarity and distribution along the first two MFA axes. (B): Correlation circle, Integrating intra- and inter-correlations between environmental variables and bacterial populations (T-RFs) displays environmental variables (as vectors) that are significantly correlated with one or both axes (p = 0.05) in black, and vectors that are not correlated in gray. For better readability, significant vectors related to bacterial populations are not displayed on the correlation circle. They correspond to 46 T-RFs among a total of 272 different T-RFs described for the site. Three groups of variables are depicted: Terminal electron acceptors (TEAs, full arrows), relative proportions of chlorinated ethenes (%CEs, dashed arrows), and other variables (Others, dotted arrows).
In conclusion, these results indicated that the redox conditions in the contaminated aquifer at site A were overall too oxic for complete reductive dechlorination to occur. At locations where redox conditions were anoxic enough, manganese reduction, and eventually DNRA, out-competed cisDCE dechlorination. Since the biochemical potential for complete dechlorination of PCE was present at the site, bioremediation by the activity of OHRB could be recommended as a remediation strategy, however, only by an enhanced natural attenuation approach (ITRC, 2008).
Site B—Monitoring of Reductive Dechlorination during an ERD
Step 1: Assessment of In situ Reductive Dechlorination
At site B, PCE and reductive dechlorination daughter products have been followed-up for a period of 4 years, during which two cheese whey injections were carried out in a pilot test between sampling date 1 and 2, and 4 injections with different time intervals were carried out during full-scale bioremediation (Figure 5). The remediation objective for this site was the reduction of CEs concentrations to the legal limits of 350, 85, and 200 μg/L for PCE, TCE, and DCE, respectively. Temporal evolution of CEs throughout the remediation procedure at different monitoring wells is presented in Figure 6. Before cheese whey injection, only TCE and cisDCE have been detected as dechlorination products. PCE and TCE concentrations dropped below the concentration limits after only two cheese whey injections (pilot test) and remained low and stable during the whole monitoring period (Table S5). At the same time, VC and ethene were detected as additional dechlorination products, showing that cheese whey injection allowed activation of the biochemical potential to reductively dechlorinate cisDCE to ethene. Dechlorination seemed to stall at cisDCE at well NA-1 after the third cheese whey injection whereas at the other wells VC as well as ethene was an abundant dechlorination product. After the fourth injection (none at the clogged well NA-1), ethene was the major product at wells NA-14 and NA-15, and the fifth injection into these wells led to a clear predominance of ethene and to very low concentrations of CEs at the sampling date 7 (Table S5). No PCE and almost no dechlorination products were detected in wells NA-1 and NA-6 at the same sampling date.
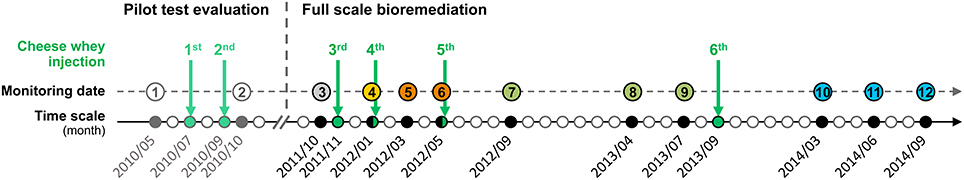
Figure 5. Timeline of the bioremediation based on biostimulation at Site B. Labeling of the monitoring dates 1 to 12 is indicated using colored circles. The identical color pattern is used for Figure 8. Bicolored circles (sampling dates 4 and 6) indicate that water sampling was carried out just before cheese whey injection.
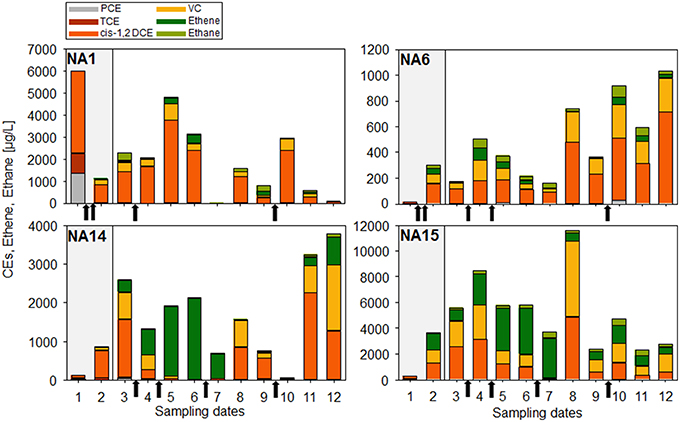
Figure 6. Concentrations of PCE and dechlorination products (TCE, cisDCE, VC, ethane, and ethane) present in the water samples of the monitoring wells NA-1, NA-6, NA-14, and NA-15 and measured at the different sampling dates (see Figure 5). The gray shaded area indicates the pilot test period. Black arrows indicate cheese whey injections. Please note the different scales.
A strong rebound of cisDCE and VC was observed 7 months later in all four wells (sampling date 8), a phenomenon which is rather typical for CEs-contaminated sites that underwent an in situ treatment (Early et al., 2006; Hood et al., 2008). The increase in contaminant concentrations often occurs due to the continuous dissolution of PCE from a source zone (e.g., DNAPL) that goes beyond the natural attenuation capacity of the groundwater system. A sampling campaign 3 months later showed a decrease of cisDCE and VC again, but no rebound of ethene. A sixth cheese whey injection that was done in all wells led to different patterns and evolution of dechlorination products at the different wells during the next 12 months of monitoring. However, both cisDCE and VC always were quite abundant whereas ethene was a minor dechlorination product.
Step 2: Assessment of Biochemical Potential for Complete PCE Dechlorination
Although the pilot test with cheese whey injections already showed that the biochemical potential for complete dechlorination of PCE was present and could be activated at the site, PCR detection of 16S rRNA genes of obligate OHRB and of VC reductive dehalogenases was done using DNA extracted from water samples originating from five wells during the bioremediation process. Dehalococcoides spp. was detected in almost all samples, whereas Dehalobacter spp. and vcrA and bvcA, initially present only sporadically, were detected constantly after the fifth cheese whey injection only (Table S6). Three out of four microcosms showed complete reduction of PCE to ethene and one accumulated VC as end product (Table 4). The presence of Dehalococcoides spp. is considered as a good indicator for complete reductive dechlorination of PCE and TCE to ethene (Lu et al., 2006; Popat and Deshusses, 2011), and increasing detection of Dehalococcoides spp. and VC reductive dehalogenase genes along with the biostimulation of PCE-contaminated aquifer has also been shown in other case studies (e.g., Davis et al., 2008; Scheutz et al., 2008).
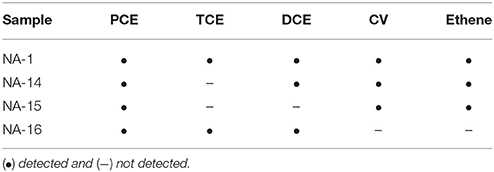
Table 4. Dechlorination products detected in microcosms inoculated with water samples from Site B samples after 86 days of incubation.
Step 3: Reasons for Incomplete In situ Reductive Dechlorination
Data obtained from the analysis of BCS and environmental parameters from the successive monitoring dates were collected and analyzed all together with MFA statistical analysis (Figure 7). Similarly to Site A, relations between vectors corresponding to CEs (concentrations and proportions), TEAPs and bacterial populations were analyzed. In this specific case, the goal was to assess the impact of the successive cheese whey injections and the potential success in the removal of CEs. Figure 7 presents the final monitoring MFA analysis of the full-scale bioremediation (data from sampling dates 3 to 12). Significance of the correlations between environmental parameters, and between environmental variables and the structures of the bacterial communities are provided in the Supplementary Material (Tables S6, S7, respectively) and will not be discussed in details in this section.
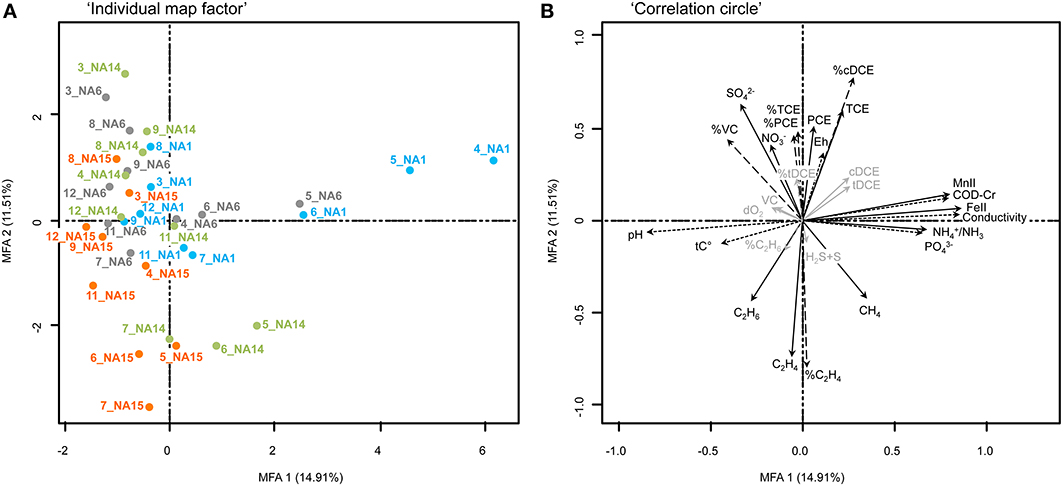
Figure 7. Multiple Factor Analysis (MFA) exploring environmental and bacterial community structures of Site B. The MFA graphical output was obtained from the analysis of nine sampling campaigns carried out to monitor reductive dechlorination with time during bioremediation with multiple cheese whey injections.(A): Individual map factor, Showing sample (dis)similarity and distribution along the first two MFA axes. Each colored dot corresponds to the barycenter of both environmental and bacterial community data obtained for the same sample. Four sampling wells are shown using different colors: NA-1 in blue; NA-6 in gray; NA-14 in green; NA-15 in orange. Numbers at the beginning of the sample names indicate the corresponding sampling date (from 3 to 12). (B): Correlation circle, Illustrating intra- and inter-correlations between environmental variables and bacterial populations (T-RFs). This figure shows environmental variable as vectors which are significantly correlated with one or both axes (p = 0.05) in black, and vectors that are not correlated in gray. For better readability, significant vectors related to bacterial populations are not displayed on the correlation circle. They correspond to 84 T-RFs among a total of 304 different T-RFs described for the site. Three groups of variables are depicted: Terminal electron acceptors (TEAs, full arrows), relative proportions of PCE and its degradation products (respectively, %PCE and %DP, dashed arrows), and other variables (Others, dotted arrows).
MFA computed initially with the data of all wells showed that the samples taken from the control well NA-16 located in an uncontaminated section of the aquifer, clustered together whatever the monitoring date, denoting a strong consistency in the structure of the microbial communities and groundwater chemistry (data not shown). In order to evaluate the influence of cheese whey injections at contaminated locations, data from this well were removed in the subsequent steps of the analysis. MFA including data from wells NA-1, NA-6, NA-14, and NA-15 showed that the majority of the samples clustered on the left side of the Individual factor map (Figure 7A), denoting environmental conditions characterized by higher pH and temperature (Table S5). The few samples plotted on the right Individual factor map were characterized by the presence of Fe(II) and Mn(II) as well as and CH4 indicating iron and manganese reductions concomitantly with DNRA and methanogenic conditions (see detailed correlations in Table S7). On the second MFA axis, a separation can be observed between samples of the upper and lower part. In the upper part, samples were influenced by conditions with higher redox potential, and nitrate and sulfate concentrations, and showed an incomplete dechlorination to TCE, cisDCE, and VC. In the lower part, samples were discriminated by higher concentration and accumulation of ethene as well as presence of ethane and methane indicating that samples taken from location in which methanogenic conditions prevailed showed the formation of large concentrations of ethene and ethane as reduction products.
A more detailed observation at the scale of the individual wells (Figure 8) showed that well NA-1 and NA-6 that sampled groundwater in the upper layers of the aquifer, went through a similar evolution in time. Upon the first full-scale injections, environmental conditions in these two wells evolved toward iron- and manganese-reducing conditions with some lag in well NA-6. Whereas, cisDCE was the major dechlorination product in well NA-1, VC and ethene were present in well NA-6. However, it is not certain that the incomplete dechlorination observed in wells NA-1 and NA-6 was due to a competition between OHRB dechlorinating cisDCE and VC and bacterial iron- and manganese-reducing populations since methane was produced equally in these locations. The detection of large amounts of methane at these locations, combined with the proven presence of the full OHR potential, indicated that the partial degradation of PCE was not a consequence of a lack of available electron donor (Table S5). A closer look at other variables showed that pH-values at wells NA-1 and NA-6 dropped to low values around 5.0–5.5, which are known to severely impede cisDCE and VC dechlorination (Lacroix et al., 2014). Overall, the pH was in general below 7.0 at all wells, probably a consequence of the mineralogical composition of the bedrock at this site, which is formed by minerals such as biotite, an iron- and manganese silicate, providing a weak pH-buffering capacity. Presence of low pH was probably a consequence of rapid fermentation of cheese whey leading to unfavorable conditions for complete reductive dechlorination but adequate for some methane producers (Ferry, 1993).
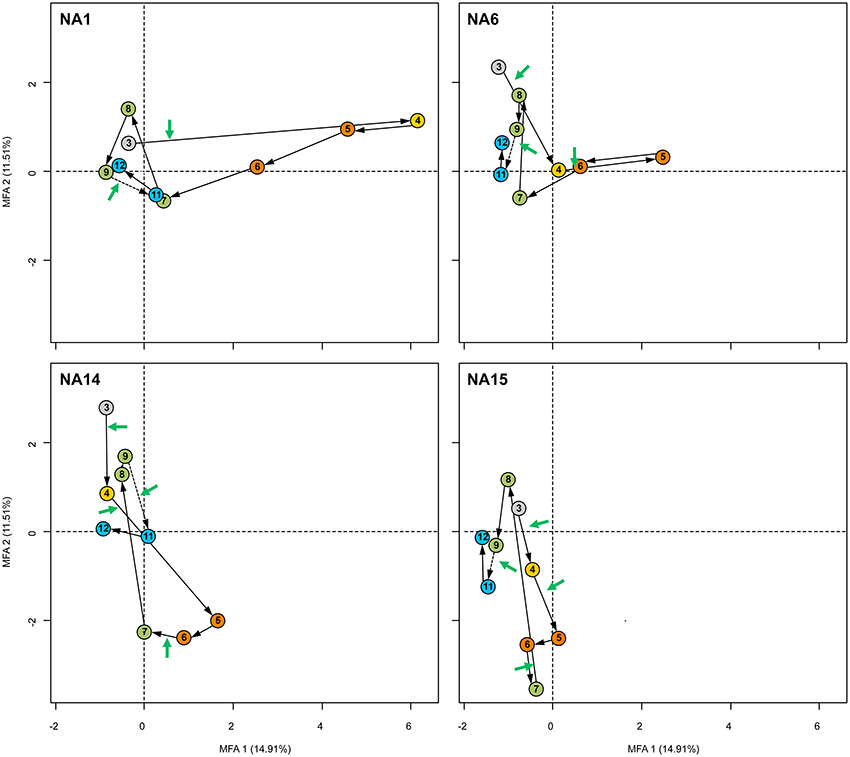
Figure 8. MFA “Individual factor map” graphs detailed for the sampling wells NA-1, NA-6, NA-14, and NA-15 showing samples collected with time along the bioremediation process. The figures show (dis)similarity and distribution of the four sampling wells separately along the first two axes of the MFA. Each colored dot corresponds to the barycenter of both environmental and bacterial community data obtained for the same sample. Black arrows illustrate the evolution of the wells with time. Cheese whey applications in between two sampling dates are shown with green arrows. The pattern of colors used for the samples corresponds to the one presented in Figure 5 and illustrate the different sampling dates.
The evolution during the first year of the full-scale bioremediation was rather different in wells NA-14 and NA-15 compared to the other two wells. Upon cheese whey injections 3 and 4, samples of these two wells shifted to the lower half of the Individual factor map, and were characterized by methanogenic conditions. In this section of the MFA individual factor map, ethene was the main dechlorination product (Figure 7B). The process occurred mainly during the monitoring period 5 to 7, with maximal concentrations of methane reaching 38,000 μg/L. In other studies, reductive dechlorination was shown to out-compete methanogenesis due to a higher affinity for hydrogen but only when this latter was found in low concentrations (Aulenta et al., 2002; Chambon et al., 2013). Conversely, high hydrogen concentrations were shown to promote methanogenesis and allowed only partial dechlorination to cisDCE (Freedman and Gossett, 1989; He et al., 2002; Major et al., 2002; Kean et al., 2003; Heimann et al., 2007). At this site however, cheese whey was apparently used by fermenting bacteria inherently present in the aquifers, creating favorable conditions not limited in hydrogen and allowing the co-occurence of both methanogenesis and complete reductive dechlorination of PCE.
Samples of the 4 wells originating from sampling dates 8 to 12 are located again in the same sector of the Individual factor map as compared with the initial samples of sampling date 3. The only exception is composed of some samples of well NA-15, that are still in the lower half of the Individual factor map and which contained the highest proportions of ethene. Vicinity of all other samples with the samples taken at the initiation of the remediation process indicated a strong similarity both in BCS and in environmental conditions. In other words, the aquifer returned to the initial conditions that were measured at the beginning of the full-scale remediation. Furthermore, reasons for the stalling of the remediation process at cisDCE and VC, even after an additional cheese whey injection 2 months after sampling date 9, might be explained by possible macro- and/or micro-nutrient limitations caused by the multiple electron donor injections. A possible candidate is phosphate that was often below the detection limit from sampling date 8 on (Table S5) and that was also negatively correlated with all samples present in the left side of the Individual factor map (Figure 7B).
In conclusion, the follow-up of environmental and microbial parameters, as well as the verification of the presence of the biochemical potential for complete reductive dechlorination in microcosms, have confirmed that in situ biostimulation could be considered as a promising remediation approach at Site B. The biological mechanisms induced by the addition of cheese whey assessed with the MFA showed that quite different geochemical processes that interfered or not with CEs dechlorination, occurred at very short distances in close monitoring wells that sampled groundwater at different depths from two communicating aquifers (e.g., wells NA-1 and NA-15). Transient biogeochemical conditions favoring (methanogenesis) or impeding (metal reduction) CEs reduction were juxtaposed spatially and temporally along the ERD remediation, delaying in time complete reductive dechlorination to ethene. These results reflected the site heterogeneity arising from ERD process which is observed often in aquifers but rarely included in the management of remediation strategies (Nelson et al., 2005; Meckenstock et al., 2015). Interestingly, incomplete reductive dechlorination of PCE seemed to be caused in the second half of the bioremediation process by nutrient limitations rather than competition for electron donors, a cause that has so far not yet been described in the bioremediation of CEs. Although the results may be specific to site B, the integrative numerical approach used to investigate the biogeochemical processes provided a framework to assess the site potential for successful reductive dechlorination and to diagnose sites that behave in undesirable or unexpected ways (Kean et al., 2003). The inhibition of complete dechlorination potentially caused by phosphate limitations could also be a factor at other sites where biostimulation was applied. A modified design of the application of electron donor according to the specific environmental conditions of the aquifer, for instance more frequent injections in lower amounts, could potentially contribute to a better removal efficiency of the contaminant (Miura et al., 2015).
Concluding Remarks
Reductive dechlorination of chloroethenes is an ecological process which is naturally occurring in complex microbial ecosystems, and which involves several co-occurring biological reactions and microbial populations in close interactions with members of the OHRB guild. The above described case studies have highlighted the heterogeneity and complexity of the spatial and temporal distribution of biogeochemical conditions within a contaminated aquifer (Goldscheider et al., 2006). This confirms findings showing that no linear physical continuity in the redox conditions is present (Meckenstock et al., 2015) and that synergetic or antagonistic processes rely in a time-dependent manner. A detailed understanding of the hydrogeological situation at a site will certainly improve the interpretation of data obtained with our assessment methodology, an issue that should be emphasized before carrying out the analysis of a specific contaminated site.
The primary objective of the methodology presented and validated in this study is to provide a simple, cost-effective and efficient diagnostic tool that could be applied to the study of the largest possible numbers of contaminated sites. The strength of the proposed methodology relies in the integrated analysis of the biological and environmental components of the aquifers. The methodology was successfully applied for diagnosing a Swiss aquifer for its in situ potential of complete reductive dechlorination of PCE, and for monitoring a Czech aquifer under bioremediation by successive cheese whey injections. In both cases, antagonist biogeochemical processes and unfavorable local environmental conditions were identified as the reasons for the stalling of reductive dechlorination at the level of toxic intermediates. This methodology could be integrated as a tool for feasibility investigations of aquifers for a bioremediation strategy based on natural attenuation, with or without an enhancement through electron donor injections. A detailed user-oriented manual is freely available and the authors would appreciate any feedback on strengths and weaknesses of the provided document (Tarnawski et al., 2015).
A limiting aspect that has not been specifically addressed in this study, but which is discussed in details in the user-oriented manual, is linked with the equipment of the contaminated sites with a sufficient number of monitoring wells, in order to produce reliable and significant statistical outputs. Based on our experience, at least 8 monitoring wells should equip a shallow aquifer showing a relatively simple geological matrix with a reasonably simple hydrological system (this study; Shani et al., 2013). A way to circumvent this limitation inherent to the MFA computation is to multiply the number of sampling campaigns (this study) so as to collect samples sufficiently separated in time and then increase the variance explained by the statistical model.
Author Contributions
ST performed the experiments, analyzed the data and wrote the manuscript. PR analyzed the data and revised the manuscript. MB and MS analyzed groundwater samples, carried out bioremediation project, and revised the manuscript. CH designed the work, analyzed the data and wrote the manuscript.
Funding
This study was financed by the Swiss Federal Office for the Environment (FOEN) and the grant No. TA02020534 - TECHTOOL of the Technology Agency of the Czech Republic.
Conflict of Interest Statement
The authors declare that the research was conducted in the absence of any commercial or financial relationships that could be construed as a potential conflict of interest.
Acknowledgments
We acknowledge Simon Pinzelli from BG Consulting Engineers (Lausanne, Switzerland) for full access to informations, data, and water samples of the Swiss site A. We thank Emmanuelle Rohrbach, Julie Luche, Morgane Baumgartner, Marie-Laure Gadolini (Laboratory for Environmental Biotechnology, EPFL, Lausanne, Switzerland) and Martina Praveckova (Institute of Microbiology, Academy of Sciences of the Czech Republic, Prague, Czech Republic) for their technical assistance in laboratory analyses.
Supplementary Material
The Supplementary Material for this article can be found online at: https://www.frontiersin.org/article/10.3389/fenvs.2016.00007
References
Abdi, H., Williams, L., and Valentin, D. (2013). Multiple factor analysis: principal component analysis for multitable and multiblock data sets WIREs. Comp. Stat. 5, 149–179. doi: 10.1002/wics.1246
Appelo, C. A. J., and Postma, D. (2005). Geochemistry, Groundwater and Pollution. Leiden: A.A. Balkema Publishers.
Aulenta, F., Majone, M., and Tandoi, V. (2006). Enhanced anaerobic bioremediation of chlorinated solvents: environmental factors influencing microbial activity and their relevance under field conditions. J. Chem. Technol. Biotechnol. 81, 1463–1474. doi: 10.1002/jctb.1567
Aulenta, F., Majone, M., Verbo, P., and Tandoi, V. (2002). Complete dechlorination of tetrachloroethene to ethene in presence of methanogenesis and acetogenesis by an anaerobic sediment microcosm. Biodegradation 13, 411–424. doi: 10.1023/A:1022868712613
Behrens, S., Azizian, M. F., McMurdie, P. J., Sabalowsky, A., Dolan, M. E., Semprini, L., et al. (2008). Monitoring abundance and expression of “Dehalococcoides” species chloroethene-reductive dehalogenases in a tetrachloroethene-dechlorinating flow column. Appl. Environ. Microbiol. 74, 5695–5703. doi: 10.1128/AEM.00926-08
Bond, D. R., Holmes, D. E., Tender, L. M., and Lovley, D. R. (2002). Electrode-reducing microorganisms that harvest energy from marine sediments. Science 295, 483–485. doi: 10.1126/science.1066771
Borcard, D., Gillet, F., and Legendre, P. (2011). Numerical Ecology with R. New York, NY: Springer Science & Business Media.
Bourg, A., Mouvet, C., and Lerner, D. (1992). A review of the attenuation of trichloroethylene in soils and aquifers. Q. J. Eng. Geol. Hydrogeol. 25, 359–370. doi: 10.1144/GSL.QJEG.1992.025.04.10
Bradley, P. M. (2000). Microbial degradation of chloroethenes in groundwater systems. Hydrogeol. J. 8, 104–111. doi: 10.1007/s100400050011
Chakraborty, R., Wu, C. H., and Hazen, T. C. (2012). Systems biology approach to bioremediation. Curr. Opin. Biotechnol. 23, 483–490. doi: 10.1016/j.copbio.2012.01.015
Chambon, J. C., Bjerg, P. L., Scheutz, C., Bælum, J., Jakobsen, R., and Binning, P. J. (2013). Review of reactive kinetic models describing reductive dechlorination of chlorinated ethenes in soil and groundwater. Biotechnol. Bioeng. 110, 1–23. doi: 10.1002/bit.24714
Christensen, T. H., Bjerg, P. L., Banwart, S. A., Jakobsen, R., Heron, G., and Albrechtsen, H.-J. (2000). Characterization of redox conditions in groundwater contaminant plumes. J. Contam. Hydrol. 45, 165–241. doi: 10.1016/S0169-7722(00)00109-1
Côme, J. M., Ropars, M., Kaskassian, S., Quintard, M., Vogel, T., Razakarisoa, O., et al. (2007). Natural Attenuation of Chlorinated Aliphatic Compounds in Aquifers - Methodological Guide - ADEME Collection. Available online at: http://www.ademe.fr/macaoh-rd-project-2001-2006-natural-attenuation-of-chlorinated-solvents-in-aquifers
Davis, G., Baldwin, B., Peacock, A., Ogles, D., White, G., Boyle, S., et al. (2008). Integrated approach to PCE−impacted site characterization, site management, and enhanced bioremediation. Remed. J. 18, 5–17. doi: 10.1002/rem.20178
Davis, J. W., Odom, J. M., Deweerd, K. A., Stahl, D. A., Fishbain, S. S., West, R. J., et al. (2002). Natural attenuation of chlorinated solvents at Area 6, Dover Air Force Base: characterization of microbial community structure. J. Contam. Hydrol. 57, 41–59. doi: 10.1016/S0169-7722(01)00217-0
Declercq, I., Cappuyns, V., and Duclos, Y. (2012). Monitored natural attenuation (MNA) of contaminated soils: state of the art in Europe - a critical evaluation. Sci. Total Environ. 426, 393–405. doi: 10.1016/j.scitotenv.2012.03.040
de Lorenzo, V. (2008). Systems biology approaches to bioremediation. Curr. Opin. Biotechnol. 19, 579–589. doi: 10.1016/j.copbio.2008.10.004
Duhamel, M., and Edwards, E. A. (2006). Microbial composition of chlorinated ethene-degrading cultures dominated by Dehalococcoides. FEMS Microb. Ecol. 58, 538–549. doi: 10.1111/j.1574-6941.2006.00191.x
Early, T. O., Borden, B., Heitkamp, M., Looney, B. B., Major, D., Waugh, W. J., et al. (2006). Enhanced Attenuation: A Reference Guide on Approaches to Increase the Natural Treatment Capacity of a System. WSRC-STI-2006-00083, Rev. 1, Oak Ridge TN, NJ: U. S. Department of Energy Office of Scientific and Technical Information.
Ebersole, R. C., and Hendrickson, E. R. (2004). Nucleic Acid Fragments for the Identification of Dechlorinating Bacteria. U.S. Patent No. 6,797,817. Washington, DC: U.S. Patent and Trademark Office.
Ferry, J. (1993). Methanogenesis: Ecology, Physiology, Biochemistry, and Genetics. New York, NY: Chapman & Hall Inc.
Freedman, D. L., and Gossett, J. M. (1989). Biological reductive dechlorination of tetrachloroethylene and trichloroethylene to ethylene under methanogenic conditions. Appl. Environ. Microbiol. 55, 2144–2151.
Fromin, N., Hamelin, J., Tarnawski, S., Roesti, D., Jourdain-Miserez, K., Forestier, N., et al. (2002). Statistical analysis of denaturing gel electrophoresis (DGE) fingerprinting patterns. Environ. Microbiol. 4, 634–643. doi: 10.1046/j.1462-2920.2002.00358.x
Goldscheider, N., Hunkeler, D., and Rossi, P. (2006). Review: microbial biocenoses in pristine aquifers and an assessment of investigative methods. Hydrogeol. J. 14, 926–941. doi: 10.1007/s10040-005-0009-9
He, J., Sung, Y., Dollhopf, M. E., Fathepure, B. Z., Tiedje, J. M., and Löffler, F. E. (2002). Acetate versus hydrogen as direct electron donors to stimulate the microbial reductive dechlorination process at chloroethene-contaminated sites. Environ. Sci. Technol. 36, 3945–3952. doi: 10.1021/es025528d
Heimann, A. C., Friis, A. K., Scheutz, C., and Jakobsen, R. (2007). Dynamics of reductive TCE dechlorination in two distinct H-2 supply scenarios and at various temperatures. Biodegradation 18, 167–179. doi: 10.1007/s10532-006-9052-z
Hendrickson, E. R., Payne, J. A., Young, R. M., Starr, M. G., Perry, M. P., Fahnestock, S., et al. (2002). Molecular analysis of Dehalococcoides 16S ribosomal DNA from chloroethene-contaminated sites throughout north America and Europe. Appl. Environ. Microbiol. 68, 485–495. doi: 10.1128/AEM.68.2.485-495.2002
Holliger, C., Gaspard, S., and Glod, G. (1997). Contaminated environments in the subsurface and bioremediation: organic contaminants. FEMS Microbiol. Rev. 20, 517–523. doi: 10.1111/j.1574-6976.1997.tb00334.x
Holliger, C., Schraa, G., Stams, A. J., and Zehnder, A. J. (1993). A highly purified enrichment culture couples the reductive dechlorination of tetrachloroethene to growth. Appl. Environ. Microbiol. 59, 2991–2997.
Holliger, C., and Schumacher, W. (1994). Reductive dehalogenation as a respiratory process. Antonie Van Leeuwenhoek 66, 239–246. doi: 10.1007/BF00871642
Hood, E. D., Major, D. W., Quinn, J. W., Yoon, W.-S., Gavaskar, A., and Edwards, E. A. (2008). Demonstration of enhanced bioremediation in a tce source area at launch complex 34, cape canaveral air force station. Ground Water Monit. Remediat. 28, 98–107. doi: 10.1111/j.1745-6592.2008.00197.x
Imfeld, G., Nijenhuis, I., Nikolausz, M., Zeiger, S., Paschke, H., Drangmeister, J., et al. (2008). Assessment of in situ degradation of chlorinated ethenes and bacterial community structure in a complex contaminated groundwater system. Water Res.42, 871–882. doi: 10.1016/j.watres.2007.08.035
Imfeld, G., Pieper, H., Shani, N., Rossi, P., Nikolausz, M., Nijenhuis, I., et al. (2011). Characterization of groundwater microbial communities, dechlorinating bacteria, and in situ biodegradation of chloroethenes along a vertical gradient. Water Air Soil Pollut. 221, 107–122. doi: 10.1007/s11270-011-0774-0
ITRC (2008). Enhanced Attenuation: Chlorinated Organics. EACO-1. Washington, D.C: Interstate Technology and Regulatory Council, Enhanced Attenuation: Chlorinated Organics Team. Available online at: www.itrcweb.org
Jossi, M., Fromin, N., Tarnawski, S., Kohler, F., Gillet, F., Aragno, M., et al. (2006). How elevated pCO2 modifies total and metabolically active bacterial communities in the rhizosphere of two perennial grasses grown under field conditions. FEMS Microbiol. Ecol. 55, 339–350. doi: 10.1111/j.1574-6941.2005.00040.x
Kean, J. A., Graves, D., and Lodato, M. (2003). “Enhanced reductive dechlorination and the relationship between Cis-1,2-DCE accumulation and methanogenesis,” in In Situ and On-Site Bioremediation - Proceedings of the 7th International In Situ and On-Site Bioremediation Symposium, eds V. S. Magar and M. E. Kelley (Orlando, FL: Columbus, OH: Battelle Press).
Kotik, M., Davidová, A., Voříšková, J., and Baldrian, P. (2013). Bacteria communities in tetrachlroethene-polluted groundwaters: a case of study. Sci. Total Environ. 454–455, 517–527. doi: 10.1016/j.scitotenv.2013.02.082
Lacroix, E., Brovelli, A., Barry, D. A., and Holliger, C. (2014). Utilization of silicate minerals for pH control during reductive dechlorination of chlorinated solvents by bacterial consortia. Appl. Environ. Microbiol. 80, 3858–3867. doi: 10.1128/AEM.00493-14
Lane, D. J. (1991). “16S/23S rRNA sequencing,” in Nucleic Acid Techniques in Bacterial Systematics, eds E. Stackebrandt and M. Goodfellow (Chichester: Wiley), 115–175.
Lanthier, M., Villemur, R., Lepine, F., Bisaillon, J. G., and Beaudet, R. (2001). Geographic distribution of Desulfitobacterium frappieri PCP-1 and Desulfitobacterium spp. in soils from the province of Quebec, Canada. FEMS Microb. Ecol. 36, 185–191. doi: 10.1111/j.1574-6941.2001.tb00839.x
Lowe, M., Madsen, E. L., and Schindler, K. (2002). Geochemistry and microbial diversity of a trichloroethene-contaminated Superfund site undergoing intrinsic in situ reductive dechlorination. FEMS Microbiol. Ecol. 40, 123–134. doi: 10.1111/j.1574-6941.2002.tb00944.x
Lu, X., Kampbell, D. H., and Wilson, J. T. (2006). Evaluation of the Role of Dehalococcoides Organisms in the Natural Attenuation of Chlorinated Ethylenes in Ground Water. U.S. EPA, Ada, OK. Report No: EPA 600-R-06-029, 121.
Major, D. W., McMaster, M. L., Cox, E. E., Edwards, E. A., Dworatzek, S. M., Hendrickson, E. R., et al. (2002). Field demonstration of successful bioaugmentation to achieve dechlorination of tetrachloroethene to ethene. Environ. Sci. Technol. 36, 5106–5116. doi: 10.1021/es0255711
Maphosa, F., de Vos, W. M., and Smidt, H. (2010). Exploiting the ecogenomics toolbox for environmental diagnostics of organohalide-respiring bacteria. Trends Biotechnol. 28, 308–316. doi: 10.1016/j.tibtech.2010.03.005
McMahon, P. B., and Chapelle, F. H. (2008). Redox processes and water quality of selected principal aquifer systems. Ground Water 46, 259–271. doi: 10.1111/j.1745-6584.2007.00385.x
Meckenstock, R. U., Elsner, M., Griebler, C., Lueders, T., Stumpp, C., Aamand, J., et al. (2015). Biodegradation: updating the concepts of control for microbial cleanup in contaminated aquifers. Environ. Sci. Technol. 49, 7073–7081. doi: 10.1021/acs.est.5b00715
Miura, T., Yamazoe, A., Ito, M., Ohji, S., Hosoyama, A., Takahata, Y., et al. (2015). The impact of injections of different nutrients on the bacterial community and its dechlorination activity in chloroethene-contaminated groundwater. Microbes Environ. 30, 164–171. doi: 10.1264/jsme2.ME14127
Mouser, P., Rizzo, D., Druschel, G., Morales, S., Hayden, N., O'Grady, P., et al. (2010). Enhanced detection of groundwater contamination from a leaking waste disposal site by microbial community profiles. Water Resour. Res. 46:W12506. doi: 10.1029/2010WR009459
Nelson, D. K., Payne, F. C., and Suthersan, S. S. (2005). “Enhanced reductive dechlorination – a broader perspective,” in Contaminated Soils, Sediments and Water: Science in the Real World, Vol. 9, eds E. J. Calabrese, P. T. Kostecki, and J. Dragun (New York, NY: Springer), 69–89.
Norris, R. D. (1993). In-Situ Bioremediation of Ground Water and Geological Material: A Review of Technologies. Darby, PA: Diane Publishing.
Pant, P., and Pant, S. (2010). A review: advances in microbial remediation of trichloroethylene (TCE). J. Environ. Sci. (China) 22, 116–126. doi: 10.1016/S1001-0742(09)60082-6
Popat, S. C., and Deshusses, M. A. (2011). Kinetics and inhibition of reductive dechlorination of trichloroethene, cis-1,2-dichloroethene and vinyl chloride in a continuously fed anaerobic biofilm reactor. Environ. Sci. Technol. 45, 1569–1578. doi: 10.1021/es102858t
R Core Team (2014). R: A Language and Environment for Statistical Computing. Vienna: R Foundation for Statistical Computing.
Rossi, P., Gillet, F., Rohrbach, E., Diaby, N., and Holliger, C. (2009). Statistical assessment of the variability of the T-RFLP analysis applied to complex microbial communities. Appl. Environ. Microbiol. 75, 7268–7270. doi: 10.1128/AEM.00135-09
Rossi, P., Shani, N., Kohler, F., Imfeld, G., and Holliger, C. (2012). Ecology and biogeography of bacterial communities associated with chloroethene-contaminated aquifers. Front. Microbiol. 3:260. doi: 10.3389/fmicb.2012.00260
Rugner, H., Finkel, M., Kaschl, A., and Bittens, M. (2006). Application of monitored natural attenuation in contaminated land management – a review and recommended approach for Europe. Environ. Sci. Policy. 9, 568–576. doi: 10.1016/j.envsci.2006.06.001
Scheutz, C., Durant, N., Dennis, V., Hansen, M., Jørgensen, V., Jakobsen, R., et al. (2008). Concurrent ethene generation and growth of dehalococcoides containing vinyl chloride reductive dehalogenase genes during an enhanced reductive dechlorination field demonstration. Environ. Sci. Technol. 42, 9302–9309. doi: 10.1021/es800764t
Shani, N., Rossi, P., and Holliger, C. (2013). Correlations between environmental variables and bacterial community structures suggest Fe (III) and vinyl chloride reduction as antagonistic terminal electron-accepting processes. Environ. Sci. Technol. 47, 6836–6845. doi: 10.1021/es304017s
Smits, T. H., Devenoges, C., Szynalski, K., Maillard, J., and Holliger, C. (2004). Development of a real-time PCR method for quantification of the three genera Dehalobacter, Dehalococcoides, and Desulfitobacterium in microbial communities. J. Microbiol. Methods. 57, 369–378. doi: 10.1016/j.mimet.2004.02.003
Tarnawski, S.-E., Rossi, P., and Holliger, C. (2015). Screening of the Bacterial Reductive Dechloration Potential of Chlorinated Ethenes in Contaminated Aquifers – A Technical Assistance Manual for Assessment of Natural Attenuation of Chloroethenes-Contaminated sites. Available online at: http://infoscience.epfl.ch/record/213613
Tobiszewski, M., and Namieśnik, J. (2012). Abiotic degradation of chlorinated ethanes and ethenes in water. Environ. Sci. Pollut. Res. Int. 19, 1994–2006. doi: 10.1007/s11356-012-0764-9
Turner, S., Pryer, K. M., Miao, V. P. W., and Palmer, J. D. (1999). Investigating deep phylogenetic relationships among cyanobacteria and plastids by small subunit rRNA sequence analysis. J. Eukaryot. Microbiol. 46, 327–338. doi: 10.1111/j.1550-7408.1999.tb04612.x
van der Zaan, B., Hannes, F., Hoekstra, N., Rijnaarts, H., de Vos, W. M., Smidt, H., et al. (2010). Correlation of Dehalococcoides 16S rRNA and chloroethene-reductive dehalogenase genes with geochemical conditions in chloroethene-contaminated groundwater. Appl. Environ. Microbiol. 76, 843–850. doi: 10.1128/AEM.01482-09
Vogel, T. M., Criddle, C. S., and McCarty, P. L. (1987). Transformations of halogenated aliphatic compounds. Environ. Sci. Technol. 2, 721–736.
Weiss, J. V., and Cozzarelli, I. M. (2008). Biodegradation in contaminated aquifers: incorporating microbial/molecular methods. Ground Water 46, 305–322. doi: 10.1111/j.1745-6584.2007.00409.x
Wiedemeier, T. H., Swanson, M. A., Moutoux, D. E., Gordon, E. K., Wilson, J. T., Wilson, B. H., et al. (1998). Technical Protocol for Evaluating Natural Attenuation of Chlorinated Solvents in Ground Water. Available online at: http://www3.epa.gov/epawaste/hazard/correctiveaction/resources/guidance/rem_eval/protocol.pdf
Keywords: natural attenuation, chloroethenes, organohalide-respiring bacteria, microcosm experiments, microbial community structure, multiple factor statistical analysis, contaminated aquifer monitoring
Citation: Tarnawski S-E, Rossi P, Brennerova MV, Stavelova M and Holliger C (2016) Validation of an Integrative Methodology to Assess and Monitor Reductive Dechlorination of Chlorinated Ethenes in Contaminated Aquifers. Front. Environ. Sci. 4:7. doi: 10.3389/fenvs.2016.00007
Received: 19 November 2015; Accepted: 18 January 2016;
Published: 05 February 2016.
Edited by:
Maria Dittrich, University of Toronto, CanadaReviewed by:
Matthias E. Kaestner, Helmholtz-Centre for Environmental Research, GermanySeung Gu Shin, Pohang University of Science and Technology, South Korea
Copyright © 2016 Tarnawski, Rossi, Brennerova, Stavelova and Holliger. This is an open-access article distributed under the terms of the Creative Commons Attribution License (CC BY). The use, distribution or reproduction in other forums is permitted, provided the original author(s) or licensor are credited and that the original publication in this journal is cited, in accordance with accepted academic practice. No use, distribution or reproduction is permitted which does not comply with these terms.
*Correspondence: Christof Holliger, christof.holliger@epfl.ch