Joint Occurrence of Heavy PM2.5 Pollution Episodes and Persistent Foggy Days in Central East China
 Caixia Yu
 Yuanjian Yang
 Dong Liu
- 1Key Laboratory of Atmospheric Optics, Anhui Institute of Optics and Fine Mechanics Chinese Academy of Sciences, Hefei Institutes of Physical Science, Chinese Academy of Sciences, Hefei, China
- 2Science Island Branch, Graduate School of USTC, Hefei, China
- 3Anhui Province Key Laboratory of Atmospheric Sciences and Satellite Remote Sensing, Anhui Institute of Meteorological Sciences, Hefei, China
- 4Shouxian National Climate Observatory, Typical Farmland Eco-Meteorology Field Scientific Test Base of China Meteorological Administration in Huaihe River Basin, Shouxian, China
- 5School of Remote Sensing and Geomatics Engineering, Nanjing University of Information Science and Technology, Nanjing, China
Although many severe pollution events in Central and East China have been analyzed in recent years, the heavy PM2.5 pollution episode happened on persistent foggy days from January 13 to 18, 2018 was unique, characterized by explosive increase and sharp decrease in PM2.5 (particles with kinetic equivalent diameter less than or equal to 2.5 microns) concentration. Based on hourly data of ground level meteorological parameters, PM2.5 data and CALIPSO-based (the Cloud-Aerosol Lidar and Infrared Pathfinder Satellite Observation) aerosol data, combined with ECMWF (European Centre for Medium-Range Weather Forecasts) reanalysis data and radiosonde temperature profile, a comprehensive analysis was conducted to reveal the meteorological reasons for the evolution of the episode at horizontal and vertical scales. The PM2.5 concentration experienced four stages: a slow-increase phase, rapid-increase phase, rapid-decrease phase, and rebound phase. Results show that because Central and East China (CEC) were located at the back of a high-pressure system, humid southerly winds and near surface inversion (NSI) were responsible for the slow accumulation of pollutants. The rapid-increase phase was attributed to pollution transport at both ground level and in the lower troposphere because of weak cold air invasion. The significant subsidence at 500 hPa and 700 hPa intensified the NSI and led to dense fog. In that case, corresponding to the supersaturated atmosphere, the particles entered the fog droplets and were scavenged partly by deposition at night and were resuspended on the next day when the atmosphere was unsaturated. Our findings provide convincing evidence that surface PM2.5 rapid-decrease phase and the rebound phase were closely associated with dense fog process.
Introduction
In recent years, severe air pollution events have received media and public coverage as common phenomena in China (Guo et al., 2011; Ding and Liu, 2014; Wang et al., 2019). High particulate matter levels are usually closely associated with high levels of precursor emissions (Markovicl et al., 2014; Holt et al., 2015). Therefore, the government took strong measures to improve those enterprises with high energy consumption, such as coal, to reduce pollution emissions (Liu et al., 2015; Guo et al., 2016; Gao et al., 2020). However, according to the statistics, humans still suffer from air pollution during most of the wintertime in some Chinese cities (Chen et al., 2013; Yang et al., 2020). Especially in the Beijing-Tianjin-Hebei region (BTH) and Yangtze River Delta region (YRD), large amounts of data indicate that air pollution has been very serious as a consequence of the phenomenal economic growth (Zhang et al., 2012; Wang et al., 2015; Zhang et al., 2015; Zheng et al., 2018). Fine particles suspended in the air contain high concentration of heavy metals, which enter the blood circulation through the respiratory system and then result in disease (Peters et al., 1996; Delfino et al., 2005; Pope and Dockery, 2006; Wei et al., 2017; Gu et al., 2020), which vitally affects social activities.
The formation mechanisms of typical PM2.5 pollution episodes over China have been extensively studied to provide references for local governments to take air pollution control measures (Gao et al., 2012; Zhou et al., 2015; Jin et al., 2017; Wu et al., 2020; Wang, et al., 2021a; Wang, et al., 2021b). Normally, meteorological factors play a significant role in the generation, development and end of pollution events through a complex combination of processes, including pollutant transitions, secondary particle production, particle hygroscopic growth and wet removal processes, and are principally responsible for heavy pollution episodes (Pasch et al., 2011; Wang and ChenSun, 2014; Wang et al., 2015; Miao et al., 2017; Yang et al., 2018). Many studies have been carried out to understand the correlation between climate and pollution episodes in China (Zhu et al., 2012; Li et al., 2016; Yang et al., 2018). It is generally believed that the weakening East Asia winter monsoons result in reductions in the number of strong cold outburst events and increases in stagnant weather conditions, both of which further lead to more heavy pollution events (Lin et al., 2018). In addition, studies have shown that pollutant accumulations are directly influenced by local adverse meteorological parameters (Chen et al., 2008; Deng et al., 2012; Ji et al., 2014). It has been indicated that reduced rainfall amounts, gentle winds and high relative humidity are key factors in the formation of heavy pollution (Sun et al., 2013; Shi et al., 2018; Chen et al., 2020).
Meanwhile, wet deposition of particulate matter caused by precipitation and fog are also important process to purified air and maintain the source-sink balance of suspended particles in the atmosphere. Previous studies reported that the air quality deteriorated during haze but improved in fog (Wang and ChenSun, 2014; Xu et al., 2017). Especially in the late stage of extremely dense fog episodes, particulate mass concentration reached the lowest value because of the progressive accumulated effect of wet deposition of large fog droplets (Yang et al., 2012). The observations showed also that in a core city of BTH region, the concentrations of PM2.5 and SO2 obviously decreased during the heavy fog period (Han et al., 2018). Compared with dry deposition, the wet deposition by fog formation led to pollutant lifetimes on the order of 6–12 h, while pollutant removal by ventilation of valley air required at least 5 days (Waldman and Hoffmann, 1987).
CEC lies in the north and south climate intermediate belts with time-varying weather conditions, and both increase the difficulty of studying pollution episodes. The formation and evolution of heavy PM2.5 pollution episodes are characterized by distinctive regional features. Even though studies have analyzed the characteristics and mechanisms of heavy PM2.5 pollution episode in CEC, few studies have reported the joint occurrence of persistent PM2.5 pollution episodes and foggy days. In this paper, the heavy air pollution episode accompanied by dense fog in CEC was taken as an example to comprehensively analyze the driving meteorological conditions for slow-increase, rapid-increase and short-term dissipation of PM2.5 pollution by using meteorological data (including high-resolution sounding data, surface observation data, and reanalysis data); real-time pollutant concentration monitoring data; and vertical aerosol extinction coefficient data that were monitored by CALIPSO.
Data and Methods
Region and Site
Severe PM2.5 pollution episodes occurred in central and eastern China (mainly in Shanxi, Hebei, Shandong, Henan and Anhui provinces) during January 13–18, 2018. In addition, Fuyang was selected as the representative city in this paper. Fuyang (115.82°E, 32.92°N, 39 m above sea level) is located in northwestern Anhui Province and has a seasonal temperate semi humid monsoon climate (Deng et al., 2019). The monsoon climate is clearly defined with concentrated rainy summers and cold winters. Northerly winds rule in winter, while southerly winds prevail in summer. Fuyang station possesses a modern observation system that can conduct surface meteorological observations and sounding measurements and provides abundant and reliable observational data for relevant research.
Air Quality Data
All the data and results in this study were presented at Beijing Standard Time (BST). The PM2.5 hourly concentration data were downloaded from the website of the Ministry of Environmental Protection of China. Based on the PM2.5 concentration, heavy air pollution was found to occur in central and eastern China on January 13–18 and accompanied by large-scale dense fog. During this episode, the areas with PM2.5 concentration greater than 150 μg/m3 expanded and moved southward. In addition, the characteristics of the pollutant concentration at different stages and their relationships with the meteorological parameters were analyzed, which included slow increases, rapid increases and sharp decreases in PM2.5 concentration. Figure 1 shows the topography of CEC and the surrounding areas and the location of the representative city, Fuyang, which experienced violent swings in the PM2.5 concentration during January 13–18.

FIGURE 1. The topography of Central East China, locations of representative cities and the CALIPSO satellite orbit used in this paper. The red letters indicate provinces (e.g., SX: Shanxi, HeB: Hebei, SD: Shandong, HN: Henan, HuB: Hubei, AH: Anhui, and JS: Jiangsu). The pink spot indicates a city (fy: Fuyang). The blue spots indicate the CALIPSO satellite orbit that passed over CEC on January 16.
Meteorological Data
The circulation patterns and vertical motions of the middle-lower troposphere are closely related to the surface meteorological conditions. The sea level pressure (SLP) and vertical velocity data with a resolution of 0.25°* 0.25° obtained from the ECMWF were obtained from the European Centre for Medium-Range Weather Forecasts were used to analyze the influence of the weather systems during the severe pollution episode.
To understand the effects of surface meteorological parameters on pollutant concentration, hourly ground meteorological observation data and sounding data from Fuyang station were obtained from the Anhui Information Center of Meteorology, where data quality control had been carried out and were utilized in the study. The surface meteorological variables included hourly ground level temperature, dew point temperature, wind speed, wind direction, relative humidity and visibility. The high-resolution (1.2 s) sounding data that were obtained at 07:00 and 19:00 at the Fuyang sounding station were used to determine the temperature inversions and vertical wind distributions. The accuracies of the radiosonde temperature data are within 0.1 K and have been broadly used to characterize the boundary layer structures in China (Guo et al., 2019). These observations are conducted by specially trained personnel and use the procedures established by the World Meteorological Organization (WMO).
CALIPSO Data
During the study period, CALIPSO passed over the contaminated area. The CALIOP instrument was launched in 2006 and has provided nearly continuous global measurements of aerosols and clouds with high vertical and spatial resolutions (David et al., 2009), which are important for studies of radiative forcing (Satheesh, 2002) and air quality (Al-Saadi et al., 2005). The level 2 products are reported both as layer products and as profile products. In this paper, the version 3.01 level 2 aerosol layer product was used to obtain the altitude-height distributions of the aerosol extinction coefficients and further investigate the vertical distributions of the aerosols. The product has a horizontal resolution of 333 m and vertical resolution of 30 m below 8 km.
The Pollution Process and Dense Fog Event
Spatiotemporal Variations in PM2.5 Concentration
Figure 2 depicts the PM2.5 concentration distributions at 06:00 for each day during January 13–18, 2018. We observed that a heavy pollution zone PM2.5 > 150 μg/m3) began in Shanxi Province on January 13 and worsened the next day. On January 15, the heavily contaminated area moved eastward to the BTH region and expanded southward to the border with Shandong and Hebei Provinces. On the morning of January 16, we found that the pollution zone moved southward and that the center of heavy pollution was located at the region where Henan, Shandong and Hubei Provinces intersect. On January 17, the heavily polluted area moved further southward and the air quality in eastern Hebei Province was improved, while the PM2.5 concentration for most parts of Henan rose to above 250 μg/m3. Meanwhile, it should be noted that PM2.5 concentration in northwest Anhui, where the Fuyang sounding station is located, sharply decreased to below 100 μg/m3 at 06:00 January 17. The air quality exhibited large differences between southeastern Henan and northwestern Anhui.
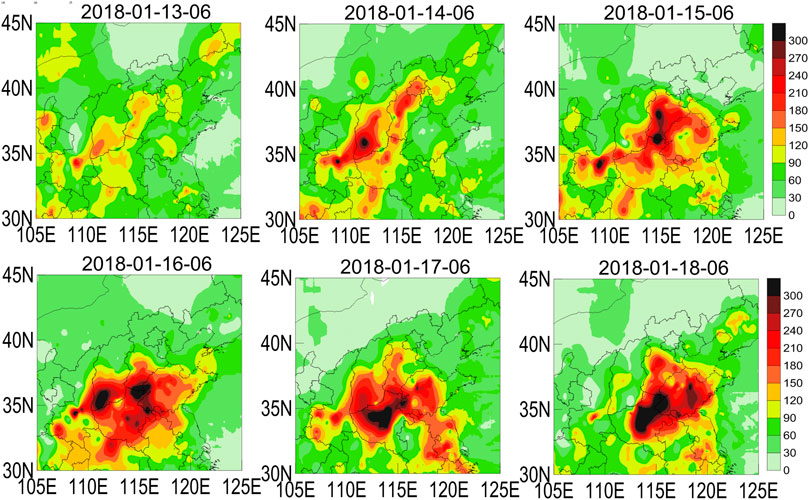
FIGURE 2. Distributions of PM2.5 (unit: μg/m3) concentration at 06:00 in Central-East China on 13–18 (A–F) January 2018.
Previous studies have shown that cold air intrusion and precipitation are the main removal mechanisms of large-scale severe pollution (Kang et al., 2019), especially in winter. However, improvements in air quality occurred in limited areas with no precipitation at 06:00 January 17, while the pollution in the surrounding areas remained, which indicated that local meteorological parameters played a role during the episode. On January 18, the pollutants again remained in the atmosphere above Henan, Shandong and their border with Anhui and Jiangsu Provinces.
The whole pollution process led to average PM2.5 concentration reach 120 μg/m3 from 04:00 January 13 to 04:00 January 18 in Fuyang city. Time series plots of the PM2.5 concentration are shown in Figure 3. We found that the PM2.5 mass concentration evolution trend in Fuyang could be divided into four phases (Table 1): 1) a slow-increase phase from 04:00 January 13 to 08:00 January 16, 2) rapid-increase phase from 08:00 January 16 to 20:00 January 16, 3) rapid-decrease phase from 20:00 January 16 to 07:00 January 17, and 4) rebound phase from 07:00 January 17 to 04:00 January 18. In the first stage, the PM2.5 mass concentration increased slowly to 139 μg/m3 from 43 μg/m3. The most severe PM2.5 pollution levels occurred in the second stage, with a peak value of 285 μg/m3 at 20:00 January 16. Thereafter, the PM2.5 mass concentration decreased sharply to 31 μg/m3 within 11 h. However, after short-term dissipation, the PM2.5 mass concentration rebounded to 166 μg/m3 in 1 day. This means that although the air quality improved quickly during the evening of January 16, the pollutants were not cleaned up.
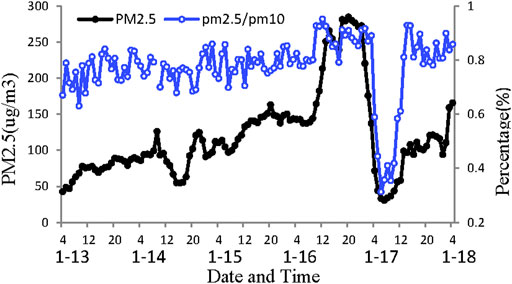
FIGURE 3. Variations in the hourly PM2.5 concentration and proportions of PM2.5 to PM10 in Fuyang.
TABLE 1. Summary of the different air pollution stages in Fuyang during the study period.
The PM2.5/PM10 ratios of the mass concentration exhibited obvious differences at different stages. The ratios were always between 0.63 and 0.86 with no obvious trends during the slow-increase stage, and the ratios increased overall to 0.79–0.95 in the rapid-increase stage, which suggested that fine particles accounted for a large proportion of the particle mass. Thereafter, the particles exhibited irregular fluctuations, the PM2.5/PM10 ratios dropped to 0.31, and PM10 became the main pollutant in the rapid-decrease stage. Corresponding to the rebound in pollutant concentration in the daytime on January 17, the ratios rose to 0.93 and remained above 0.78 on January 18.
Fog Weather Process During the Episode
Fog is a weather phenomenon, which occurs when the atmospheric relative humidity in the boundary layer is greater than 90% and the horizontal visibility is less than 1 km. The visibility within 1–10 km is called light fog. It is worth noting that large-scale foggy weather was observed on the mornings of January 16–18 and affected more than 20 provinces in China. Figure 4 depicts the dense fog areas with visibility below 1 km and the relative humidity exceeds 90%. On the morning of January 17, dense fog occurred in most parts of Anhui and Jiangsu Provinces and their border with Hebei and Shandong Provinces. Especially in northern Anhui Province, the visibility was less than 0.4 km.
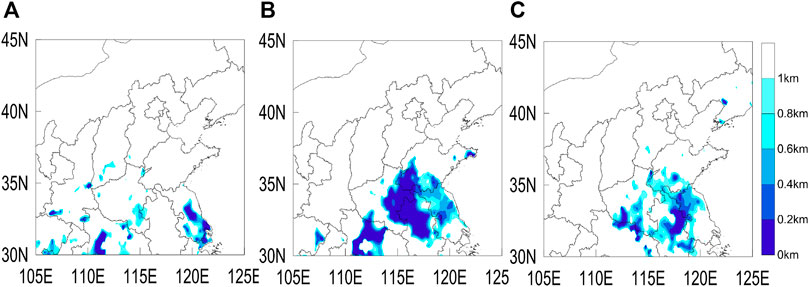
FIGURE 4. Distributions of the daily visibility at 06:00 in Central-East China on 16–18 (A–C) January 2018.
The Driving Meteorological Conditions for Slow-Increase, Rapid-Increase and Short-Term Dissipation of PM2.5 Pollution
Large Scale Synoptic Patterns
Figure 5 shows that evolution of the sea level pressure fields during the heavy pollution episode. The results show that CEC experienced sustained south winds due to its location near the rear of the high-pressure system that was caused by the East Asian trough on January 13 (Figure 5A). In addition to the East Asian trough moving east on January 14, the atmospheric circulation adjusted, as is demonstrated by the continuous high-pressure systems, and was separated from the Mongolia-Siberian High Pressure (Figure 5B). A separate high-pressure system centered at the Bohai Gulf area moved rapidly east on January 15 (Figure 5C). After that, a slightly stronger high-pressure system was separated again on the morning of January 16 and affected a wider area, while weak north winds prevailed in Anhui (Figure 5D). However, the high pressure system was not strong enough and gradually diminished by the night of January 16. Meanwhile, the southerly airstream strengthened and moved northward, which meant that convergence lines formed at night on January 16 in CEC when the enhanced southerly winds met the original northerly winds. By the morning of January 17, CEC was entirely dominated by southerly winds.
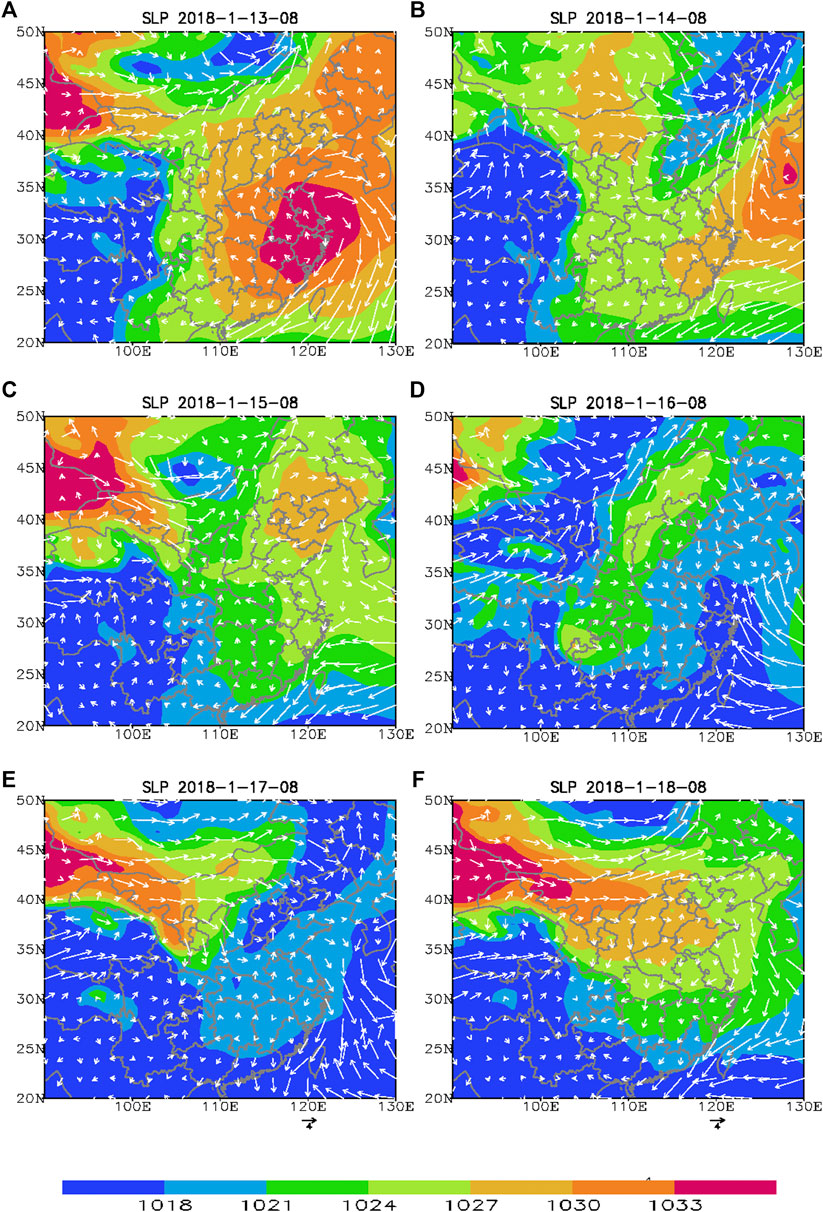
FIGURE 5. Distributions of the sea level pressure (unit: hPa) and 10 m winds (unit: m/s) at 08:00 on January 13–18, 2018. The arrow length represents wind speed with 4 m/s. Wind speed 4 m/s.
The changes in SLP in Anhui, along with the surface winds, demonstrate that heavy pollution episodes occurred during the atmospheric circulation adjustment period, with several weak colds fronts intruding into the North China Plain and Northeast Plain. Most of the time, the SLP were uniformly distributed, with southerly wind speeds that were low in CEC.
Inversion of Boundary Layer Temperature
The wind and temperature profiles at the Fuyang sounding station that were obtained at 07:00 and 19:00 on each day during the episode were used to reveal the vertical structures of the atmospheric layer (Figure 6). On January 13–14, all of the middle and lower troposphere was controlled by southwesterly winds. In particular, the southwesterly warm moisture flow was stronger between 500 m and 1,500 m (Figure 6A), which led to the temperature of the lower atmosphere being higher than that at the surface. Therefore, an NSI was observed in the morning and night of January 13–14 (Figures 6B,C). The top of the NSI was below 500 m, and its intensity was approximately 1–2.4°C/100 m. These results indicate that a persistent temperature inversion decreased the thickness of the mixing layer and hindered the upward transport of pollutants and was favorable for the gradual air pollution accumulation on the ground at the early stage of the pollution episode.
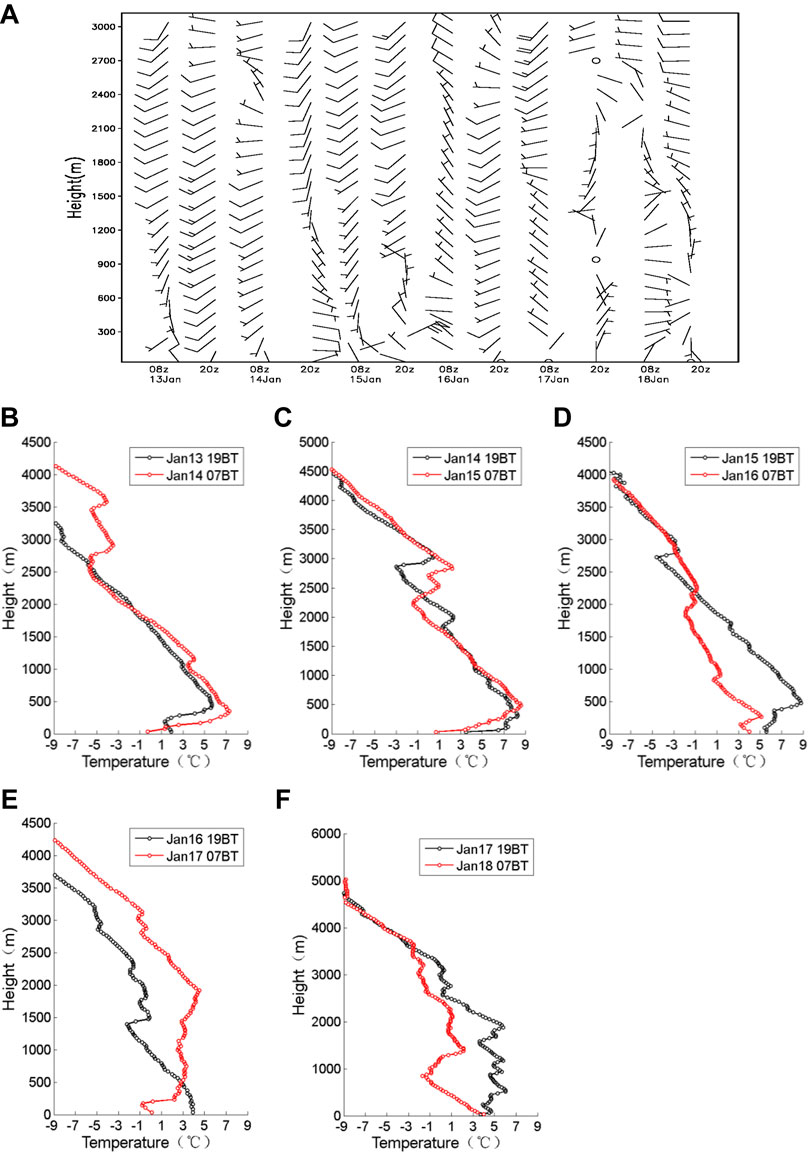
FIGURE 6. Vertical distributions of wind vector (A) and temperature (B–F) at the Fuyang sounding station, which are shown in Figure 1, from January 13 to January 18, 2018.
The prevailing wind direction within 1 km of the ground shifted to northeast on the evening of January 15 (Figure 6A). At 07:00 on January 16, northerly winds further strengthened and dominated from ground level to 3 km or higher, which indicated that the warm air mass had weakened and retreated southward when the cold air mass was enhanced and the CEC area was controlled. The northerly wind broke the NSI and an inversion layer appeared between 1,400 and 1,500 m, which was higher in the daytime on January 16 (Figure 6E).
Although the vertical diffusion conditions improved, the ground pollution levels were pushed upward (Figure 3). Therefore, we further investigated the effect of pollutant transport in the daytime of January 16. Figure 7 shows the height-latitude cross section of aerosol extinction along the orbit displayed in Figure 1 on 13:00 January 16. After removing the influence of clouds, the high extinction coefficients were attributed to high aerosol concentration. Large amounts of aerosols were distributed from the ground up to 1.5 km between 31.5°N and 35°N. As mentioned in Figures 5D, 6A, not only the surface but also the lower atmosphere were controlled by north winds in Anhui and Henan Provinces as a result of the development of the high-pressure system. It can be deduced that in addition to pollution transport on the ground, the north winds in the lower atmosphere were also conducive to the transport of particulate matter from North China to CEC during the episode.
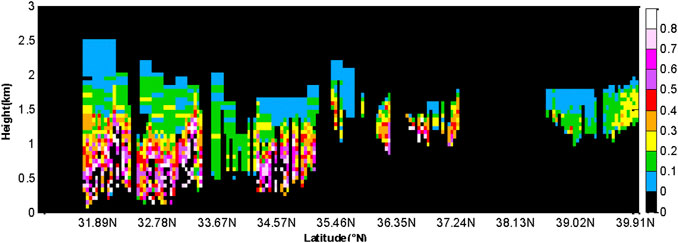
FIGURE 7. Vertical distribution of the aerosol extinction coefficients along the CALIPSO orbit at 13:00 January 16.
On the morning of January 17 (07:00), corresponding to the northerly winds at ground level up to 1.5 km and southwesterly winds above 2 km, the ground temperature dropped to 0°C, but the temperature at 1,500 m rose from −3°C to 3°C and formed a deep, strong SBI in the boundary layer with the inversion top located at approximately 200 m and the top of the isothermal layer at approximately 2 km. The SBI at 07:00 January 17 decreased the thickness of the mixing layer and was favorable for the accumulation of air pollution on the ground. However, under unfavorable conditions, the PM2.5 mass concentration at Fuyang decreased sharply and decreased by 254 μg/m3 within 11 h (Table 1). We further investigate the reasons for the sharp reduction in PM2.5 concentration in Analysis of the Reasons for the Dramatic Drop and Rebound in PM2.5 Concentration. At the night of January 17 (Figure 6F), the surface temperature rose from 0°C to about 4°C, but the NSI was not broke. The top of the isothermal layer located at approximately 2 km.
Surface Meteorological Factors
To further understand the formation, maintenance and short-term dissipation of the episode, especially the two increasing phases and one sharp reduction phase, extensive analyses were conducted to understand the driving meteorological conditions. Hence, the hourly near-surface meteorological conditions (e.g., wind speed, wind direction, temperature, dew point temperature, relative humidity, and visibility) and important weather events from January 13 to January 18, 2018 in Fuyang are shown in Figure 8.
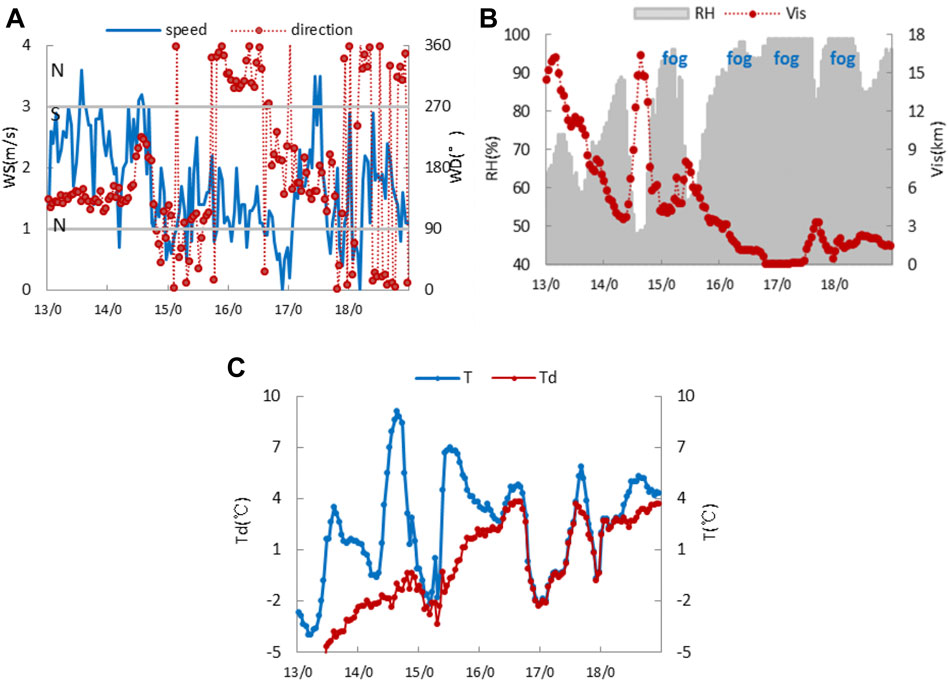
FIGURE 8. Hourly surface meteorological conditions from January 13 to January 23, 2018 at Fuyang station including (A) wind speeds (WS), wind directions (WD), (B) relative humidity (RH) and visibility (Vis), (C) temperature (T) and dew point temperature (Td).
In the early period of the slow-increase stage (January 13–14), the prevailing wind direction was mainly southeast on January 13–14 with wind speeds of approximately 2–3 m/s. The ground relative humidity correspondingly showed fluctuating growth and reached 90% at 00:00 on January 15 (Figure 8B). In combination with Figures 6, 8A, it can be deduced that the existence of the NSI led to pollutants being confined to the shallow mixing layer, and the sustained southerly winds increased the moisture content of the atmosphere and particle hygroscopic growth occurred, which were both conducive to an increase in the PM2.5 mass concentration. In the later period of the slow-increase stage (January 15), the prevailing wind speeds were light, and the directions changed frequently from southeast to northeast due to a weak high-pressure system that originated in Mongolia (Figure 8C). This meant that the enhanced northerly winds met the southerly winds and the wind fields converged near Fuyang, which led to the pollutants and vapor that had been transported in the earlier stage remaining for a longer period and were not conducive to the diffusion of pollutants.
On January 16, due to the development of the high-pressure system shown in Figure 5D, weak cold air invaded southward, and north winds prevailed on the ground with velocities below 2 m/s in Fuyang (Figure 8A). It is worth noting that the center of highest pollution was located in the region north of Fuyang, so it transported pollutants from Henan and Shandong. However, the cold air was so weak that the pollutants in CEC could not be carried away and continued to accumulate. Meanwhile, along with a sharp increase in the PM2.5 mass concentration, the visibility further decreased to less than 1 km by 17:00 January 16.
It could not be neglected that the value of relative humidity increased gradually from January 13 to 15 (Figure 8B). At the night of January 14, the relative humidity exceeded 90% and haze turned into light fog. However the fog days just sustained for about 7 h and then dissipated as the sun rose. At the afternoon of January 16, because of the weakening of the high-pressure system, the surface winds changed to the south in Fuyang which brought warm, moist air, which resulted in relative humidity greater than 95% by the evening of January 16 and maintained at a high level over the next few days. From 08:00 January 16 to 14:00 January 17, the dew point temperature was nearly equal to the temperature, and the air was totally saturated (Figure 8C). Therefore, psersistant fog days were observed in Fuyang and surrounding areas during January 16–18, as shown in Figure 4B. Especially at the night of January 16, the visibility was below 300 m, which meant dense fog formed. It should be noted that it was during that time that the PM2.5 mass concentration dropped to 31 μg/m3 from 285 μg/m3. Therefore, it can be deduced that the dense fog played an important role in the sharp decline in PM2.5 concentration during the pollution episode.
Analysis of the Reasons for the Dramatic Drop and Rebound in PM2.5 Concentration
As mentioned above (Figures 6, 7), the meteorological characteristics in Fuyang from 20:00 January 16 to 07:00 January 17 can be summarized as a strong NSI, high humidity, and ground breeze, none of which were conducive to pollution dissipation (He et al., 2017). Therefore, we further investigated the reason for the sudden pollution decrease on the night of January 16.
Figure 9, shows the time-latitude cross sections of the vertical velocities at 500, 700, 850, and 925 hPa along 115.75°E (Fuyang Station 115.82°E, 32.92°N). The results show that significant subsidence occurred from the evening of January 16 to the morning of January 17 in the mid-low troposphere and that the center was located at 33°N. The greatest subsidence speed at 500 hPa was approximately 1.0 Pa/s, which decreased to 0.4 Pa/s at 700 hPa and was weaker and not obvious at 850 and 925 hPa. The local subsidence motions at 500 and 700 hPa led to a temperature increase in the lower atmosphere, and a strong NSI occurred. This is consistent with previous research results. Gramsch et al. (2014), Shi et al. (2019) suggested that subsidence movements in the middle and upper layers cause warming in the lower troposphere, and an inversion layer then forms. As a result, the strong NSI confined the vapor water to the shallow mixing layer, and large-scale fog occurred.
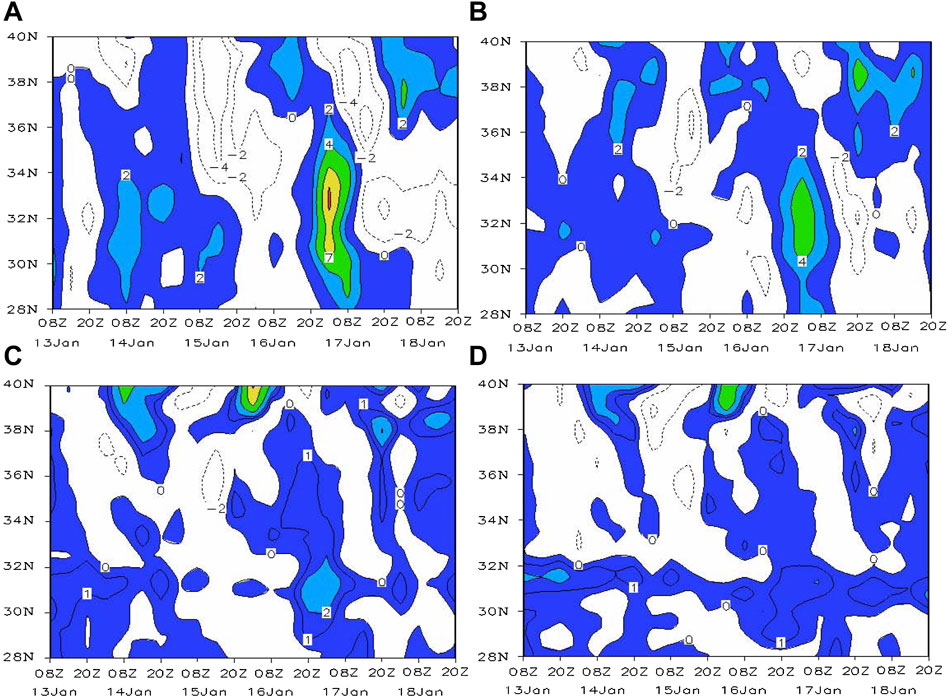
FIGURE 9. Vertical velocity distributions at 115.75E (A) 500 hPa; (B) 700 hPa; (C) 850 hPa; (D) 925 hPa; unit: 0.1 Pa/s.
In Figure 10, the colored areas show the dense fog regions with surface visibility below 500 m at 06:00 January 17. The heavier the fog, the lower the visibility. The region of dense fog was located in the region of the intersection of Shandong, Hebei and Anhui. In Fuyang, the visibility was lower than 100 m. The colored spots depict the PM2.5 concentration differences between 20:00 January 16 and 07:00 January 17. Negative values indicate decreases in the PM2.5 concentration. The PM2.5 concentration in the region of the intersection of Shandong, Hebei and Anhui experienced the largest drop with a concentration decrease that exceeded 100 μg/m3 within 11 h. Especially in Fuyang city, Bozhou city of Anhui Province and Zhoukou city of Henan Province, the PM2.5 concentration fell by more than 200 μg/m3, which meant that sharp reductions occurred in the areas where dense fog appeared. It can be deduced that the scavenging of particles was caused by fog droplet deposition.
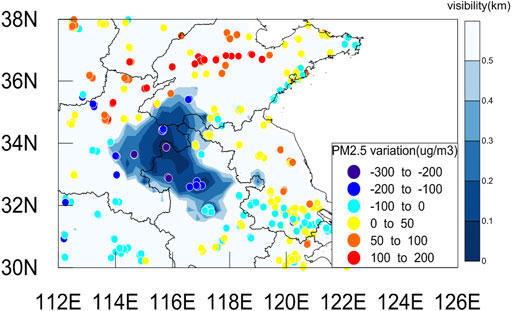
FIGURE 10. Surface visibility distributions at 07:00 January 17 (colored areas) and PM2.5 concentration difference from 20:00 January 16 to 07:00 January 17 (colored spots) in CEC.
Previous research has shown that large fractions of the pollutants scavenged in fog could be removed from the atmosphere so that the occurrence of fog could diminish or limit the accumulation of particulate matter in stagnant air masses (Jacob et al., 1984). Studies have revealed that many air pollutants are deposited via fog droplets, and the nitrogen deposition rate via fog water is of the same magnitude as that via rainwater (Igawa et al., 1998). Moreover, a simple formula for cleaning a polluted atmosphere by fog (haze) events was deduced for fog that lasts more than 4 h (Podzimek, 1998). As mentioned above (Figure 8), the atmosphere was supersaturated and condensed from fog droplets on the evening of January 16. The particles entered the fog droplets and were scavenged partly by the deposition of large droplets on the surface.
On the morning of January 17, the air quality was good with PM2.5 concentration sustained in the range of 31–58 µg/m3. At 14:00 of January 17, the relative humidity decreased to about 80% and the atmosphere was unsaturated (Figure 8B), the droplets dehydrated, and the aerosol particles resuspended again in the atmosphere. It resulted in a rebound in the mass concentration with the PM2.5 concentration jumped to about 100 μg/m3 at 14:00 of January 17 (Figure 3). Thereafter the air quality continued to deteriorate and started another pollution process under the unfavorable meteorological conditions.
Conclusion
Based on multisource observations, the characteristics and mechanisms of the heavy PM2.5 pollution episode that was accompanied by dense fog that occurred in CEC from January 13 to 18, 2018 were comprehensively investigated. The results showed that the episode occurred during an atmospheric circulation adjustment and that the surface PM2.5 concentration slowly increased in Fuyang city in four stages: 1) the slow-increasing phase, 2) the rapid-increasing phase, 3) the rapid-decreasing phase, and 4) the rebound phase. The slow-increase phase was due to high humidity, ground breeze and a surface-based inversion, whereas the rapid-increase phase was due to pollution transport. In particular, the CALIPSO satellite monitoring suggested that pollution transport occurred not only at ground level but also in the lower troposphere.
The rapid-decrease phase and rebound phase were closely associated with the dense fog process. A rapid decrease in PM2.5 concentration occurred in the region of the intersection of Shandong, Hebei and Anhui, where dense fog was observed. The analysis showed that the significant subsidence at 500 and 700 hPa led to a strong NSI, which confined the vapor water to the shallow mixing layer, and the atmosphere was supersaturated. Under these conditions, the particles entered the fog droplets and were scavenged partly by deposition of the large droplets on the surface. However, the aerosol particles were resuspended when the atmosphere was unsaturated Kang et al., 2019, Ni et al., 2018, Su et al., 2020, Wang et al., 2017, Wang et al., 2021c, Wang et al., 2014, Wang et al., 2016, Xu and Zhu, 2017, Xu et al., 2015, Zheng et al., 2019.
Data Availability Statement
The original contributions presented in the study are included in the article/Supplementary Material, further inquiries can be directed to the corresponding author.
Author Contributions
CY wrote the first draft of the manuscript, YY contributed to manuscript revision, DL contributed to conception and design of the study. All authors contributed to manuscript revision approved the submitted version.
Funding
This study was jointly supported by the National Nature Science Foundation of China (No. 42061134009 and 42175098); ANSO Joint Research Special Project (No. ANSO-CR-KP-2020-09); Key Research and Development Projects in Anhui, China (No. 202004b11020012). The following are websites from which the data were obtained: The air quality data were downloaded from: http://106.37.208.233:20035/, the routine meteorological data were downloaded from: http://www.nmic.cn/, the ECMWF reanalysis data were downloaded from: http://apps.ecmwf.int/datasets/data/interimfull-daily/levtype=sfc/, the CALIPSO data were downloaded from: https://www-calipso.larc.nasa.gov/.
Conflict of Interest
The authors declare that the research was conducted in the absence of any commercial or financial relationships that could be construed as a potential conflict of interest.
Publisher’s Note
All claims expressed in this article are solely those of the authors and do not necessarily represent those of their affiliated organizations, or those of the publisher, the editors and the reviewers. Any product that may be evaluated in this article, or claim that may be made by its manufacturer, is not guaranteed or endorsed by the publisher.
References
Al-Saadi, J., Szykman, J., Pierce, R. B., Kittaka, C., Neil, D., Chu, D. A., et al. (2005). Improving National Air Quality Forecasts with Satellite Aerosol Observations. Bull. Amer. Meteorol. Soc. 86, 1249–1262. doi:10.1175/bams-86-9-1249
Chen, R., Peng, R. D., Meng, X., Zhou, Z., Chen, B., and Kan, H. (2013). Seasonal Variation in the Acute Effect of Particulate Air Pollution on Mortality in the China Air Pollution and Health Effects Study (CAPES). Sci. Total Environ. 450-451, 259–265. doi:10.1016/j.scitotenv.2013.02.040
Chen, Z., Chen, D., Zhao, C., Kwan, M.-p., Cai, J., Zhuang, Y., et al. (2020). Influence of Meteorological Conditions on PM2.5 Concentrations across China: A Review of Methodology and Mechanism. Environ. Int. 139, 105558. doi:10.1016/j.envint.2020.105558
Chen, Z. H., Cheng, S. Y., Li, J. B., Guo, X. R., Wang, W. H., and Chen, D. S. (2008). Relationship between Atmospheric Pollution Processes and Synoptic Pressure Patterns in Northern China. Atmos. Environ. 42, 6078–6087. doi:10.1016/j.atmosenv.2008.03.043
Delfino, R. J., Sioutas, C., and Malik, S. (2005). Potential Role of Ultrafine Particles in Associations between Airborne Particle Mass and Cardiovascular Health. Environ. Health Perspect. 113, 934–946. doi:10.1289/ehp.7938
Deng, X., Cao, W., Huo, Y., Yang, G., Yu, C., He, D., et al. (2019). Meteorological Conditions during a Severe, Prolonged Regional Heavy Air Pollution Episode in Eastern China from December 2016 to January 2017. Theor. Appl. Climatol. 135, 1105–1122. doi:10.1007/s00704-018-2426-4
Deng, X., Shi, C., Wu, B., Chen, Z., Nie, S., He, D., et al. (2012). Analysis of Aerosol Characteristics and Their Relationships with Meteorological Parameters over Anhui Province in China. Atmos. Res. 109-110, 52–63. doi:10.1016/j.atmosres.2012.02.011
Ding, Y., and Liu, Y. (2014). Analysis of Long-Term Variations of Fog and Haze in China in Recent 50 Years and Their Relations with Atmospheric Humidity. Sci. China Earth Sci. 57, 36–46. doi:10.1007/s11430-013-4792-1
Gao, B., Guo, H., Wang, X.-M., Zhao, X.-Y., Ling, Z.-H., Zhang, Z., et al. (2012). Polycyclic Aromatic Hydrocarbons in PM2.5 in Guangzhou, Southern China: Spatiotemporal Patterns and Emission Sources. J. Hazard. Mater. 239-240, 78–87. doi:10.1016/j.jhazmat.2012.07.068
Gao, M., Liu, Z., Zheng, B., Ji, D., Sherman, P., Song, S., et al. (2020). China's Emission Control Strategies Have Suppressed Unfavorable Influences of Climate on Wintertime PM2.5 Concentrations in Beijing since 2002. Atmos. Chem. Phys. 20, 1497–1505. doi:10.5194/acp-20-1497-2020
Gramsch, E., Cáceres, D., Oyola, P., Reyes, F., Vásquez, Y., Rubio, M. A., et al. (2014). Influence of Surface and Subsidence thermal Inversion on PM2.5 and Black Carbon Concentration. Atmos. Environ. 98, 290–298. doi:10.1016/j.atmosenv.2014.08.066
Gu, Y., Zhang, W., Yang, Y., Wang, C., Streets, D. G., and Yim, S. H. L. (2020). Assessing Outdoor Air Quality and Public Health Impact Attributable to Residential Black Carbon Emissions in Rural China. Resour. Conservation Recycling 159, 104812. doi:10.1016/j.resconrec.2020.104812
Guo, J.-P., Zhang, X.-Y., Wu, Y.-R., Zhaxi, Y., Che, H.-Z., La, B., et al. (2011). Spatio-temporal Variation Trends of Satellite-Based Aerosol Optical Depth in China during 1980-2008. Atmos. Environ. 45, 6802–6811. doi:10.1016/j.atmosenv.2011.03.068
Guo, J., He, J., Liu, H., Miao, Y., Liu, H., and Zhai, P. (2016). Impact of Various Emission Control Schemes on Air Quality Using WRF-Chem during APEC China 2014. Atmos. Environ. 140, 311–319. doi:10.1016/j.atmosenv.2016.05.046
Guo, J., Li, Y., Cohen, J. B., Li, J., Chen, D., Xu, H., et al. (2019). Shift in the Temporal Trend of Boundary Layer Height in China Using Long-Term (1979-2016) Radiosonde Data. Geophys. Res. Lett. 46, 6080–6089. doi:10.1029/2019GL082666
Han, S., Liu, J., Hao, T., Zhang, Y., Li, P., Yang, J., et al. (2018). Boundary Layer Structure and Scavenging Effect during a Typical winter Haze-Fog Episode in a Core City of BTH Region, China. Atmos. Environ. 179, 187–200. doi:10.1016/j.atmosenv.2018.02.023
He, J., Gong, S., Yu, Y., Yu, L., Wu, L., Mao, H., et al. (2017). Air Pollution Characteristics and Their Relation to Meteorological Conditions during 2014-2015 in Major Chinese Cities. Environ. Pollut. 223, 484–496. doi:10.1016/j.envpol.2017.01.050
Holt, J., Selin, N. E., and Solomon, S. (2015). Changes in Inorganic Fine Particulate Matter Sensitivities to Precursors Due to Large-Scale US Emissions Reductions. Environ. Sci. Technol. 49, 4834–4841. doi:10.1021/acs.est.5b00008
Igawa, M., Tsutsumi, Y., Mori, T., and Okochi, H. (1998). Fogwater Chemistry at a Mountainside Forest and the Estimation of the Air Pollutant Deposition via Fog Droplets Based on the Atmospheric Quality at the Mountain Base. Environ. Sci. Technol. 32, 1566–1572. doi:10.1021/es970213x
Jacob, D. J., Waldman, J. M., Munger, J. W., and Hoffmann, M. R. (1984). A Field Investigation of Physical and Chemical Mechanisms Affecting Pollutant Concentrations in Fog Droplets. Tellus B: Chem. Phys. Meteorology 36, 272–285. doi:10.3402/tellusb.v36i4.14909
Ji, D., Li, L., Wang, Y., Zhang, J., Cheng, M., Sun, Y., et al. (2014). The Heaviest Particulate Air-Pollution Episodes Occurred in Northern china in January, 2013: Insights Gained from Observation. Atmos. Environ. 92, 546–556. doi:10.1016/j.atmosenv.2014.04.048
Jin, Q., Fang, X., Wen, B., and Shan, A. (2017). Spatio-temporal Variations of PM2.5 Emission in China from 2005 to 2014. Chemosphere 183, 429–436. doi:10.1016/j.chemosphere.2017.05.133
Kang, H. Q., BZhu, , Gao, J., He, Y., Wang, H., and Su, J. (2018). Cold Fronts -- a Potential Air Quality Threat over the Yangtze River Delta, China. Atmos. Chem. Phys., 1–17. doi:10.5194/acp-2018-588-AC2
Kang, H., Zhu, B., Gao, J., He, Y., Wang, H., Su, J., et al. (2019). Potential Impacts of Cold Frontal Passage on Air Quality over the Yangtze River Delta, China. Atmos. Chem. Phys. 19, 3673–3685. doi:10.5194/acp-19-3673-2019-supplement
Li, Z., Lau, W. K. M., Ramanathan, V., Wu, G., Ding, Y., Manoj, M. G., et al. (2016). Aerosol and Monsoon Climate Interactions over Asia. Rev. Geophys. 54, 866–929. doi:10.1002/2015RG000500
Liu, F., Zhang, Q., Tong, D., Zheng, B., Li, M., Huo, H., et al. (2015). High- Resolution Inventory of Technologies, Activities, and Emissions of Coal-Fired Power Plants in China from 1990 to 2010. Atmos. Chem. Phys. 15, 18787. doi:10.5194/acp-15-13299-2015
Markovic, M. Z., VandenBoer, T. C., Baker, K. R., Kelly, J. T., and Murphy, J. G. (2014). Measurements and Modeling of the Inorganic Chemical Composition of fine Particulate Matter and Associated Precursor Gases in California's San Joaquin Valley during CalNex 2010. J. Geophys. Res. Atmos. 119, 6853–6866. doi:10.1002/2013jd021408
Miao, Y., Guo, J., Liu, S., Liu, H., Li, Z., Zhang, W., et al. (2017). Classification of Summertime Synoptic Patterns in Beijing and Their Associations with Boundary Layer Structure Affecting Aerosol Pollution. Atmos. Chem. Phys. 17, 3097–3110. doi:10.5194/acp-17-3097-2017
Ni, Z.-z., Luo, K., Zhang, J.-x., Feng, R., Zheng, H.-x., Zhu, H.-r., et al. (2018). Assessment of winter Air Pollution Episodes Using Long-Range Transport Modeling in Hangzhou, China, during World Internet Conference, 2015. Environ. Pollut. 236, 550–561. doi:10.1016/j.envpol.2018.01.069
Pasch, A. N., Macdonald, C. P., Gilliam, R. C., Knoderer, C. A., and Roberts, P. T. (2011). Meteorological Characteristics Associated with PM2.5 Air Pollution in Cleveland, Ohio, during the 2009-2010 Cleveland Multiple Air Pollutants Study. Atmos. Environ. 45, 7026–7035. doi:10.1016/j.atmosenv.2011.09.065
Pei, L., Yan, Z., Sun, Z., Miao, S., and Yao, Y. (2018). Increasing Persistent Hazes in Beijing: Potential Impacts of Weakening East Asian Winter Monsoons Associated with Northwestern Pacific SST Trend since 1900. Atmos. Chem. Phys. 18, 3173–3183. doi:10.5194/acp-2017-757
Peters, A., Goldstein, I. F., Beyer, U., Franke, K., Heinrich, J., Dockery, D. W., et al. (1996). Acute Health Effects of Exposure to High Levels of Air Pollution in Eastern Europe. Am. J. Epidemiol. 144, 570–581. doi:10.1093/oxfordjournals.aje.a008967
Podzimek, J. (1998). Aerosol Particle Scavenging by Fog and Haze Droplets. Stud. Geophys. Geod. 42, 540–560. doi:10.1023/A:1023305423337
Pope, C. A., and Dockery, D. W. (2006). Health Effects of Fine Particulate Air Pollution: Lines that Connect. J. Air Waste Manag. Assoc. 56, 709–742. doi:10.1080/10473289.2006.10464485
Satheesh, S. K. (2002). Radiative Forcing by Aerosols over Bay of Bengal Region. Geophys. Res. Lett. 29, 40–41. doi:10.1029/2002GL015334
Shi, C. E., Nduka, I. C., Yang, Y., Huang, Y., Yao, R., Zhang, H., et al. (2019). Characteristics and Meteorological Mechanisms of Transboundary Air Pollution in a Persistent Heavy PM2.5 Pollution Episode in Central-East China. Atmos. Environ. 223, 117239. doi:10.1016/j.atmosenv.2019.117239
Shi, C., Yuan, R., Wu, B., Meng, Y., Zhang, H., Zhang, H., et al. (2018). Meteorological Conditions Conducive to PM2.5 Pollution in winter 2016/2017 in the Western Yangtze River Delta, China. Sci. Total Environ. 642, 1221–1232. doi:10.1016/j.scitotenv.2018.06.137
Su, T., Li, Z., Li, C., Li, J., Han, W., Shen, C., et al. (2020). The Significant Impact of Aerosol Vertical Structure on Lower Atmosphere Stability and its Critical Role in Aerosol-Planetary Boundary Layer (PBL) Interactions. Atmos. Chem. Phys. 20, 3713–3724. doi:10.5194/acp-20-3713-2020
Sun, Y., Wang, Z., Fu, P., Jiang, Q., Yang, T., Li, J., et al. (2013). The Impact of Relative Humidity on Aerosol Composition and Evolution Processes during Wintertime in Beijing, China. Atmos. Environ. 77, 927–934. doi:10.1016/j.atmosenv.2013.06.019
Waldman, J. M., and Hoffmann, M. R. (1987). Depositional Aspects of Pollutant Behavior in Fog and Intercepted Clouds [M]. ISBN: 9780841209831.
Wang, H., Miao, Q., Shen, L., Yang, Q., Wu, Y., and Wei, H. (2021a). Air Pollutant Variations in Suzhou during the 2019 Novel Coronavirus (COVID-19) Lockdown of 2020: High Time-Resolution Measurements of Aerosol Chemical Compositions and Source Apportionment. Environ. Pollut. 271, 116298. doi:10.1016/j.envpol.2020.116298
Wang, H., Pei, Y., Yin, Y., Shen, L., Chen, K., Shi, Z., et al. (2021c). Observational Evidence of Lightning‐Generated Ultrafine Aerosols. Geophys. Res. Lett. 48, e2021GL093771. doi:10.1029/2021gl093771
Wang, H., Tan, Y., Zhang, L., Shen, L., Zhao, T., Dai, Q., et al. (2021b). Characteristics of Air Quality in Different Climatic Zones of China during the COVID-19 Lockdown. Atmos. Pollut. Res. 12, 101247. doi:10.1016/j.apr.2021.101247
Wang, J., Zhang, M., Bai, X., Tan, H., Li, S., Liu, J., et al. (2017). Large-scale Transport of PM2.5 in the Lower Troposphere during winter Cold Surges in China. Sci. Rep. 7, 13238. doi:10.1038/s41598-017-13217-2
Wang, L., Zhang, N., Liu, Z., Sun, Y., Ji, D., and Wang, Y. (2014). The Influence of Climate Factors, Meteorological Conditions, and Boundary-Layer Structure on Severe Haze Pollution in the Beijing-Tianjin-Hebei Region during January 2013. Adv. Meteorology 2014, 1–14. doi:10.1155/2014/685971
Wang, M., Cao, C., Li, G., and Singh, R. P. (2015). Analysis of a Severe Prolonged Regional Haze Episode in the Yangtze River delta, China. Atmos. Environ. 102, 112–121. doi:10.1016/j.atmosenv.2014.11.038
Wang, M. Y., Yim, S. H. L., Dong, G. H., Ho, K. F., and Wong, D. C. (2020). Mapping Ozone Source-Receptor Relationship and Apportioning the Health Impact in the Pearl River Delta Region Using Adjoint Sensitivity Analysis. Atmos. Environ. 222, 117026. doi:10.1016/j.atmosenv.2019.117026
Wang, X., Chen, J., Sun, J., Li, W., Yang, L., Wen, L., et al. (2014). Severe Haze Episodes and Seriously Polluted Fog Water in Ji'nan, China. Sci. Total Environ. 493 (15), 133–137. doi:10.1016/j.scitotenv.2014.05.135
Wang, Z., Liu, X., Xie, X., and Xie, X. M. (2016). Effects of Strong East Asian Cold Surges on Improving the Air Quality over Mainland China. Atmosphere 7, 38. doi:10.3390/atmos7030038
Wei, Y., Cao, X. N., Tang, X. L., Shen, L. J., Lin, T., He, D. W., et al. (2017). Urban fine Particulate Matter (PM2.5) Exposure Destroys Blood-Testis Barrier (BTB) Integrity through Excessive ROS-Mediated Autophagy. Toxicol. Mech. Methods 28, 302–319. doi:10.1080/15376516.2017.1410743
Winker, D. M., Vaughan, M. A., Omar, A., Hu, Y., Powell, K. A., Liu, Z., et al. (2009). Overview of the CALIPSO Mission and CALIOP Data Processing Algorithms. J. Atmos. Ocean. Tech. 26, 2310–2323. doi:10.1175/2009JTECHA1281.1
Wu, X., Chen, B., Wen, T., Habib, A., and Shi, G. (2020). Concentrations and Chemical Compositions of PM10 during Hazy and Non-hazy Days in Beijing. J. Environ. Sci. 87, 1–9. doi:10.1016/j.jes.2019.03.021
Xu, J., Chang, L., Yan, F., and He, J. (2017). Role of Climate Anomalies on Decadal Variation in the Occurrence of Wintertime Haze in the Yangtze River Delta, China. Sci. Total Environ. 599-600, 918–925. doi:10.1016/j.scitotenv.2017.05.015
Xu, J., Yan, F., Xie, Y., Wang, F., Wu, J., and Fu, Q. (2015). Impact of Meteorological Conditions on a Nine-Day Particulate Matter Pollution Event Observed in December 2013, Shanghai, China. Particuology 20, 69–79. doi:10.1016/j.partic.2014.09.001
Xu, Y., and Zhu, X. (2017). Recognizing Dew as an Indicator and an Improver of Near-Surface Air Quality. Adv. Meteorology 2017, 1–9. doi:10.1155/2017/3514743
Yang, J., Xie, Y.-J., Shi, C.-E., Liu, D.-Y., Niu, S.-J., and Li, Z.-H. (2012). Ion Composition of Fog Water and its Relation to Air Pollutants during Winter Fog Events in Nanjing, China. Pure Appl. Geophys. 169, 1037–1052. doi:10.1007/s00024-011-0342-y
Yang, Y., Zheng, X., Gao, Z., Wang, H., Wang, T., Li, Y., et al. (2018). Long-Term Trends of Persistent Synoptic Circulation Event`s in Planetary Boundary Layer and Their Relationships with Haze Pollution in Winter Half Year over Eastern China. J. Geophys. Res. Atmos. 123, 10991–11007. doi:10.1029/2018JD028982
Yang, Y., Zheng, Z., Yim, S. Y. L., Roth, M., Ren, G., Gao, Z., et al. (2020). PM2.5 Pollution Modulates Wintertime Urban Heat Island Intensity in the Beijing-Tianjin-Hebei Megalopolis, China. Geophys. Res. Lett. 47, e2019GL084288. doi:10.1029/2019gl084288
Zhang, J. P., Zhu, T., Zhang, Q. H., Li, C. C., Shu, H. L., Ying, Y., et al. (2012). The Impact of Circulation Patterns on Regional Transport Pathways and Air Quality over Beijing and its Surroundings. Atmos. Chem. Phys. 12, 5031–5053. doi:10.5194/acp-12-5031-2012
Zhang, Q., Quan, J., Tie, X., Li, X., Liu, Q., Gao, Y., et al. (2015). Effects of Meteorology and Secondary Particle Formation on Visibility during Heavy Haze Events in Beijing, China. Sci. Total Environ. 502, 578–584. doi:10.1016/j.scitotenv.2014.09.079
Zheng, Z., Li, Y., Wang, H., Ding, H., Li, Y., Gao, Z., et al. (2019). Re-evaluating the Variation in Trend of Haze Days in the Urban Areas of Beijing during a Recent 36-year Period. Atmos. Sci. Lett. 20, e878. doi:10.1002/asl.878
Zheng, Z., Ren, G., Wang, H., Dou, J., Gao, Z., Duan, C., et al. (2018). Relationship between Fine-Particle Pollution and the Urban Heat Island in Beijing, China: Observational Evidence. Boundary-layer Meteorol. 169, 93–113. doi:10.1007/s10546-018-0362-6
Zhou, W., Tie, X., Zhou, G., and Liang, P. (2015). Possible Effects of Climate Change of Wind on Aerosol Variation during winter in Shanghai, China. Particuology 20, 80–88. doi:10.1016/j.partic.2014.08.008
Keywords: PM2.5 pollution episodes, fog process, wet deposition, subsidence motions, rebound
Citation: Yu C, Yang Y and Liu D (2022) Joint Occurrence of Heavy PM2.5 Pollution Episodes and Persistent Foggy Days in Central East China. Front. Environ. Sci. 9:821648. doi: 10.3389/fenvs.2021.821648
Received: 24 November 2021; Accepted: 20 December 2021;
Published: 19 January 2022.
Edited by:
Junke Zhang, Southwest Jiaotong University, ChinaReviewed by:
Lei Shu, Southern University of Science and Technology, ChinaYefu Gu, the Chinese University of Hong Kong, China
Copyright © 2022 Yu, Yang and Liu. This is an open-access article distributed under the terms of the Creative Commons Attribution License (CC BY). The use, distribution or reproduction in other forums is permitted, provided the original author(s) and the copyright owner(s) are credited and that the original publication in this journal is cited, in accordance with accepted academic practice. No use, distribution or reproduction is permitted which does not comply with these terms.
*Correspondence: Dong Liu, dliu@aiofm.cas.cn