Testing the Hypothesis of Allopolyploidy in the Origin of Penstemon azureus (Plantaginaceae)
 Travis J. Lawrence
 Shannon L. Datwyler
- 1Quantitative and Systems Biology Program, University of California, Merced, CA, USA
- 2Department of Biological Sciences, California State University, Sacramento, CA, USA
Polyploidy plays a major role in the evolution of angiosperms with multiple paleopolyploid events having been suggested making it plausible that all angiosperms have a polyploid event in their history. Polyploidy can arise by genome duplication within a species (i.e., autopolyploidy), or whole genome duplication coupled with hybridization (i.e., allopolyploidy). Penstemon subsection Saccanthera contains a species complex of closely related diploids and polyploids. The species in this complex are P. heterophyllus (2x, 4x), P. parvulus (4x), P. neotericus (8x), P. laetus (2x), and P. azureus (6x). Previous studies have hypothesized that P. azureus is an allopolyploid of P. parvulus (4x) X P. laetus (2x). To test the hypothesis of allopolyploidy in the origin of P. azureus and to determine possible progenitors, two nuclear loci (Adh and NIA) and three chloroplast spacer regions (trnD-trnT, rpoB-trnC, rpl32-trnL) were sequenced from P. azureus, P. heterophyllus, P. laetus, P. parvulus, and P. neotericus. These data were analyzed in a phylogenetic framework and a network analysis was used on the nuclear data. Both nuclear datasets supported the allopolyploid origin of P. azureus with divergent Adh orthologs recovered in all five accessions of P. azureus and divergent NIA orthologs recovered in three of the P. azureus accessions. Furthermore, the Adh and NIA datasets support three hypotheses for the possible progenitors of P. azureus: (1) P. heterophyllus (2x) X P. parvulus; (2) P. heterophyllus (4x) X P. laetus; and (3) P. heterophyllus (2x) X P. heterophyllus (4x). Markedly, all hypotheses support P. heterophyllus (2x) as a progenitor. In addition, the Adh and NIA trees also suggest that P. neotericus is an allopolyploid, P. parvulus is an autopolyploid with two distinct origins, and P. heterophyllus (4x) is an autopolyploid or allopolyploid. The cpDNA analysis resolved geographically structured clades. This pattern seems best explained by local adaptation of the chloroplast genome and chloroplast capture. However, multiple origins of the polyploid species and gene flow could also explain this pattern. This study provides the first molecular phylogenetic evidence of the allopolyploid origin of P. azureus and has given insight into the origin of the other polyploids in this species complex.
Introduction
The importance of polyploidy as an evolutionary mechanism for speciation and diversification, especially in flowering plants, has become apparent over the last 60 years (Soltis et al., 2014a). There are two types of polyploidy: autopolyploid and allopolyploidy. Autopolyploidy results from whole genome duplication without hybridization, whereas allopolyploidy includes hybridization between different species. Allopolyploidization has been shown to induce rapid changes in genome composition (Leitch and Leitch, 2008; Tate et al., 2009; Buggs et al., 2012a), gene expression (Buggs et al., 2011, 2012b; Soltis et al., 2014b), protein expression (Hu et al., 2011), phenology, and morphological traits (Pires et al., 2004; Gaeta et al., 2007). Furthermore, these changes can be non-additive thus producing unique phenotypes and genotypes compared to the progenitor species (Osborn et al., 2003; Buggs et al., 2011; Soltis et al., 2014b). It has been suggested that these changes produce a plethora of diversity for natural selection to act on making allopolyploidization a successful evolutionary mechanism (Soltis et al., 2014b).
Penstemon is the largest genus of plants endemic to North America with ~271 species (Wolfe et al., 2006). Species diversity within Penstemon seems to be the result of a post-tertiary radiation where speciation has resulted mainly from adaptation to distinct ecological niches and to distinct pollinators (Wolfe et al., 2006). Polyploidy is relatively rare in Penstemon, with only a few documented cases (Wolfe et al., 2006). However, subsection Saccanthera contains 21 species that show very little divergence in floral morphology and includes four closely related polyploid species: P. heterophyllus (2x, 4x), P. parvulus (4x), P. azureus (6x), and P. neotericus (8x).
All the species of subsection Saccanthera share very similar floral morphologies of five fused petals forming a corolla tube ranging from blue to purple in color. The differences between species take the form of slight differences in length of the corolla, anther dehiscence, presence of glandular hairs on the inflorescence, anther and corolla pubescence, and vegetative characteristics such as leaf size and shape (Baldwin et al., 2012). Species in this subsection are pollinated by a variety of generalist insects, primarily bees and Pseudomasaris vespoides an oligolectic pollen wasp, that have small foraging ranges (Richards, 1962; Crosswhite and Crosswhite, 1966; Clinebell and Bernhardt, 1998). Although, there is a dearth of information on seed dispersal in Penstemon it is generally assumed to be by barochory (gravity dispersal) (Clements et al., 2002). Keck's (1932) treatment of subsection Saccanthera proposed that P. neotericus (8x) was a hybrid of P. azureus (6x) X P. laetus (2x) and P. azureus (6x) was a hybrid of P. laetus (2x) X P. parvulus (4x). These hypotheses were based on morphological traits and overlapping geographic range (Keck, 1932). Clausen (1933) expanded on these hypotheses by collecting cytological data, chromosome number and behavior during meiosis, for P. neotericus (8x), P. azureus (6x), P. parvulus (4x), and P. laetus (2x), which provided evidence for the allopolyploidy origin of P. neotericus (8x).
The goals of this study were to (1) test the hypothesis that P. azureus (6x) is an allopolyploid species for the first time in a molecular phylogenetic context using a combination of three intergenic chloroplast markers (trnD-trnT, rpl32-trnL, and rpoB-trnC) and two low-copy nuclear genes (alcohol dehydrogenase [Adh] and nitrate reductase [NIA]), (2) Explore the potential role of P. heterophyllus, P. laetus, and P. parvulus as progenitors of P. azureus, and (3) provide preliminary evidence for the auto- or allopolyploid origins of P. heterophyllus (4x), P. parvulus (4x), and P. neotericus (8x).
Materials and Methods
Species Selection
Species selection for this project was mainly determined by the hypotheses of Clausen (1933) and Keck (1932), which are stated above. These hypotheses have been based on chromosome number, morphological traits, and geographic range. Penstemon heterophyllus was added to the current analysis based on the same criteria. Clausen (1933) and Keck (1932) did not address their reasons for excluding P. heterophyllus as a possible progenitor of P. azureus. Conversely, Keck (1932) alludes to the idea that P. heterophyllus might be a major player of this polyploid complex, but never expands on this idea.
Taxon Sampling
Specimens from five populations of the widespread species (P. azureus, P. heterophyllus, and P. laetus) (Table 1; Figure 1) were collected from across their geographic range in California. Specimens from two populations of the narrowly distributed species (P. parvulus, and P. neotericus) (Table 1; Figure 1) were collected from across their geographic range. Ploidy levels of P. azureus, P. laetus, P. parvulus, and P. neotericus were assumed to conform to known ploidy levels for these species. Ploidy levels of P. heterophyllus samples were determined in a previous study using flow cytometry (Visger and Datwyler, unpublished data). Penstemon cardwellii was used as the outgroup for the chloroplast dataset, Keckiella cordifolia was used for the Adh dataset, and P. dissectus was used for the NIA dataset. Herbarium vouchers for each sample were submitted to the California State University, Sacramento herbarium. The NIA sequence for P. dissectus was obtained bioinformatically from GenBank BioProject PRJNA162457 Assembly GCA_000280965.1 ASM28096v1.
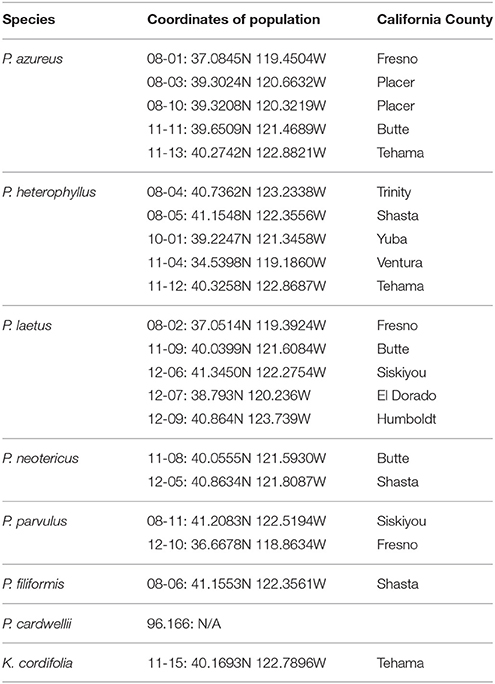
Table 1. Sampling locations given in decimal degrees and California county.
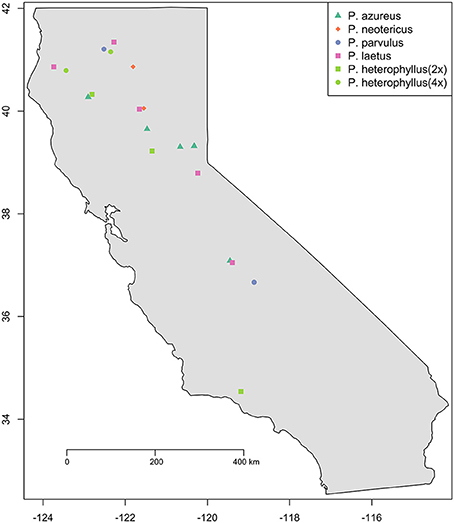
Figure 1. Sampling locations. Species are indicated by color (see legend). Ploidy level is indicated by shape: Square (2x), Circle (4x), Triangle (6x), and Diamond (8x).
Data Collection
Genomic DNA was extracted from silica-gel-dried leaves using Qiagen DNeasy Plant Mini Kit (Valencia, CA). Amplifications of the three chloroplast DNA intergenic spacer regions trnD-trnT, rpoB-trnC, and rpl32-trnL were performed using universal primers and cycling protocols described in Shaw et al. (2005) and Shaw et al. (2007) (Table 2). PCR products were generated for Adh (intron 1 through intron 5) and NIA (intron 3) using the primers and cycling protocols from Randy Small (R. Small, personal communication; Table 2). PCR products were confirmed on a 1.0% agarose gel and cleaned up using either the Qiagen QIAquick PCR Purification Kit (Valencia, CA) or Exosap-IT protocol (Affymetrix; Santa Clara, CA). DNA quantifications were carried out on a Promega GloMax-Multi+ plate reader (Madison, WI) using PicoGreen (Invitrogen, Carlsbad, CA).
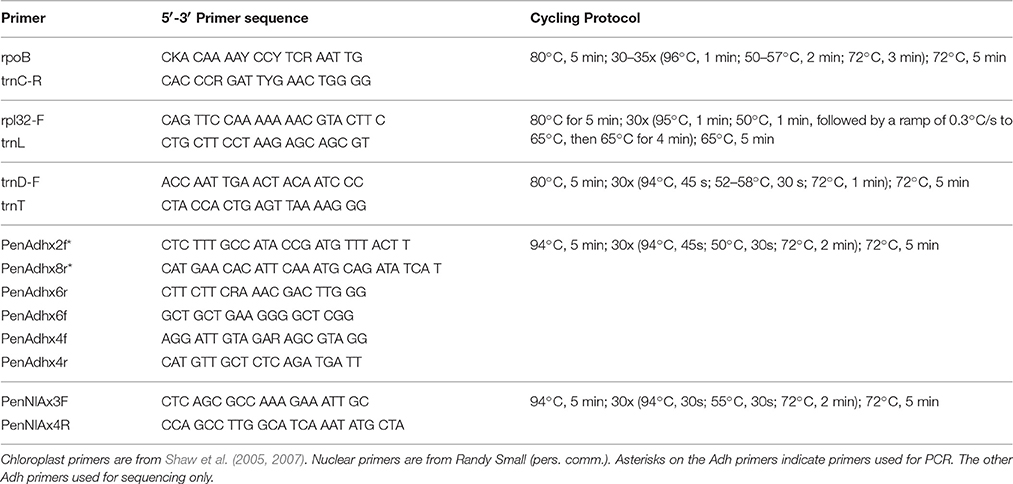
Table 2. Primers used to amplify chloroplast and nuclear regions.
DNA concentrations of the chloroplast regions were adjusted to 20–40 ng/μl and were either sequenced directly on an ABI 3730XL using BigDye Terminator v3.1 Cycle Sequencing Kit (Foster City, CA) following the manufacturer's protocol except using 1/8 of the reaction volume or were sequenced by Eurofins MWG Operon (Huntsville, AL). Adh and NIA products were cloned using either a Qiagen PCR Cloning Kit (Valencia, CA) or a ThermoFisher Scientific CloneJET Cloning Kit (Pittsburgh, PA) following the manufacturer's protocols except using one half of the reaction volume. Colonies were selected initially using blue/white screening for the Qiagen PCR Cloning Kit or by lack of the lethal insert for the ThermoFisher Scientific CloneJET Cloning Kit, and insert size was confirmed using whole colony PCR visualized on a 1.0% gel. Plasmid inserts were prepared for sequencing by two different methods. In the first method, colonies with the correct insert were grown overnight in 1x LB broth containing ampicillin. The plasmids were isolated from overnight cultures using a Qiagen QIAprep Spin Miniprep Kit (Valencia, CA). Isolated plasmids were quantified by the same method as above and concentrations were adjusted to the specifications of the sample submission guidelines of MWG Operon (100–200ng/μl). The second method isolated inserts by whole colony PCR. The PCR product were cleaned using either Qiagen QIAprep Spin Miniprep Kit (Valencia, CA) or USB ExoSAP-IT (Santa Clara, CA) and quantified using the same procedure as above with 20 ng/μl final concentration. Sequencing was completed on an ABI 3730XL using BigDye Terminator v3.1 Cycle Sequencing Kit (Foster City, CA) following the manufacturer's protocol except using 1/8 of the reaction volume. Four clones for diploid specimens, eight clones for tetraploid specimens, 10 clones for hexaploid specimens, and 12 clones for octoploid specimens were isolated and sequenced for each of the two nuclear loci. All sequences generated for this study have been deposited in GenBank (Table 3) with annotations matching the OTU used as leaves of the phylogenetic trees. All sequence files used for analyses are provided in Supplemental File 1.
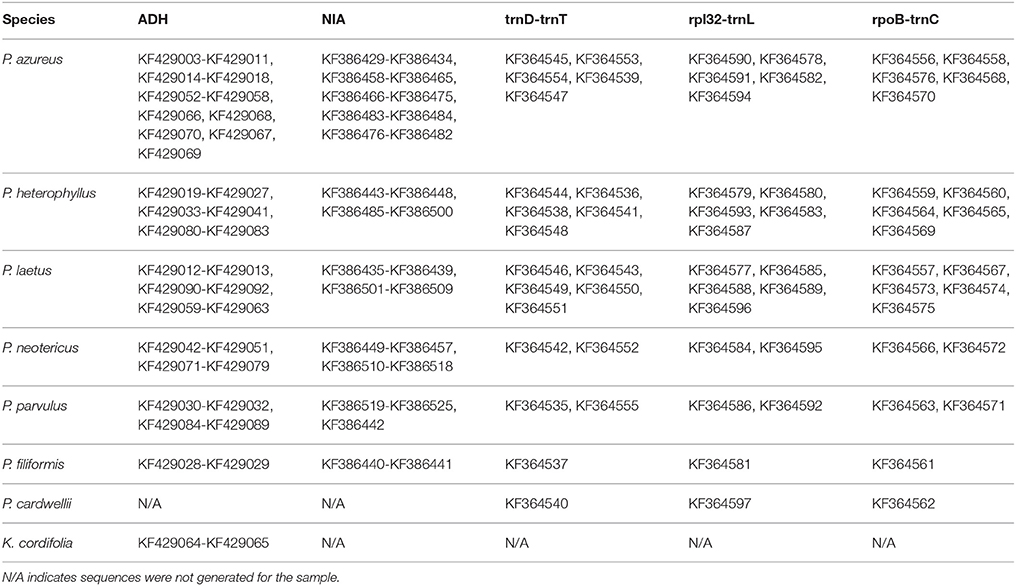
Table 3. GenBank accession numbers of generated sequences.
Data Analysis
DNA sequences were assembled and edited in Sequencher v5.0 (GeneCodes, Ann Arbor, MI). Sequences were processed using the FAST command-line utilities v1.6 (Lawrence et al., 2015) and aligned using the Clustal algorithm (Higgins and Sharp, 1988) implemented in the program Seaview v4.5.3 (Gouy et al., 2010) with manual adjustments made as necessary. Three different datasets were analyzed independently: a combined dataset with all cpDNA intergenic spacers, Adh, and NIA. Gaps in the data matrices were treated as missing data and unambiguous indel characters were coded as additional characters using the simple indel coding method of Simmons and Ochoterena (2000) and appended to the end of each matrix accordingly. Maximum parsimony analyses were performed using the program TNT v1.1 (Goloboff et al., 2008) using 20 random sequence additions and finding the shortest tree 200 times. The “New Technology” search techniques implementing the Ratchet (Nixon, 1999), Tree Drifting (Goloboff, 1999), Sectorial Searches (Goloboff, 1999), and Tree Fusing (Goloboff, 1999) algorithms with default settings were used. Strict consensus trees were calculated and relative node support was assessed using 1000 maximum parsimony bootstrap (BS) replicates with the same settings as above. Nucleotide substitution models for the nucleotide partition of the chloroplast regions (TPM2uf+G), Adh (TIM3+I+G), and NIA (TVM+G) datasets were selected using the Akaike information criterion implemented in jModelTest (Posada, 2008) and the binary model of substitution was used for the gap partition of each dataset. Bayesian analyses of all three datasets were performed using MrBayes v3.1.2 (Ronquist and Huelsenbeck, 2003) with two Metropolis-coupled Markov-chain Monte Carlo (MCMC) runs of four chains with 10 million generations sampled every 500 generations. Since, the best-fit models of nucleotide substitution could not be implemented in MrBayes a mixed model of nucleotide substitution was used. The mixed model of nucleotide substitution uses a reversible-jump MCMC method to sample across different models of nucleotide substitution as part of its MCMC sampling. Uniform priors were used for all analyses and each chloroplast region had model parameters estimated independently. Stationarity of the Bayesian MCMC runs was based on: (1) convergence to a stable log likelihood value and (2) a value of less than 0.01 for the average standard deviation of the split frequencies between runs. Trees sampled prior to stationarity were discarded as burn in and the remaining trees were used to construct a majority rule consensus tree with clade credibility values (posterior probabilities [PP]). Maximum likelihood analyses were performed using Garli v2.0 (Zwickl, 2006) with 20 replicates performed. Runs were terminated after 10000 generations with no change in the log likelihood score of more than 0.01 and keeping the best tree from the 20 replicates. Branch support was assessed using 100 maximum likelihood bootstrap replicates with the same settings. The majority consensus bootstrap tree for each analysis was calculated and clade support values mapped onto the most likely tree using the SumTrees v3.3.0 program of the DendroPy package v3.8.0 (Sukumaran and Holder, 2010). Adh and NIA gene trees were networked by hand using the multi-labeled tree method of Huber and Moulton (2006). All phylogentic trees were visualized and prepared for publication with TreeGraph2 (Stöver and Müller, 2010). Lastly, all phylogenetic trees and matrices used for these analyses were uploaded to TreeBase (Sanderson et al., 1994) under accession number S18982.
Results
Chloroplast DNA
The aligned matrix of the combined cpDNA data of 21 accessions contained 3240 bp with 118 (3.6%) variable characters of which 43 (1.3%) were parsimony-informative and 5.7% of the matrix cells were scored as missing data. The combined matrix also contained seven indels of which six were parsimony-informative. The rpoB-trnC region ranged in length between 1172 and 1288 bp with an aligned length of 1313 bp with 27 (2.1%) variable characters of which 13 (1.0%) were parsimony-informative. The rpoB-trnC dataset included three coded indels of which two (66%) were parsimony-informative. The rpl32-trnL region ranged in length between 540 and 1008 bp with an aligned length of 1023 bp with 40 (3.9%) variable characters of which 24 (2.3%) were parsimony-informative. The rpl32-trnL dataset included two coded indels both of which were parsimony-informative. The trnD-trnT region ranged in length between 759 and 891 bp with an aligned length of 906 bp with 51 (5.6%) variable characters of which six (0.7%) were parsimony-informative. The trnD-trnT dataset included two coded indels both of which were parsimony-informative. Parsimony analysis of the 21 sequences including seven indels resulted in seven equally parsimonious trees of 52 steps. The strict consensus of the parsimony analysis (Figure 2) was almost identical to the majority-rule consensus from the Bayesian analysis (Figure 3) and the tree recovered from the maximum likelihood (lnL-5266.7251; Supplemental Figure 1) analysis, except for additional sub-structuring within some clades that was supported by variable characters that were not parsimony informative. Additionally, the branch leading to P. azureus 11-13 in the Bayesian and maximum likelihood trees is relatively long and seems to be caused by a possible extension of an AT rich repeat at the end of the trnD-trnT dataset. However, without additional sequence data that extends past the currently sequenced trnD-trnT region it is difficult to determine if the sequence differences found in P. azureus 11-13 were caused by the extension of an AT rich repeat or a higher rate of nucleotide substitution. For all analyses it was assumed to be caused by a higher rate of nucleotide substitution and was aligned as such. All analyses found five well-supported clades referred to as the orange (100 BS, 94 MLBS, 1.0 PP), blue (100 BS, 85 MLBS, 1.0 PP), red (100 BS, 99 MLBS, 1.0 PP), green (100 BS, 63 MLBS, 0.98 PP), and brown clades (100 BS, 86 MLBS, 1.0 PP). Each of the major clades were structured by geographic location with each species being paraphyletic or polyphyletic. The orange clade consisted of two accessions of P. laetus (11-9 and 12-7) and P. azureus (08-3 and 08-10) from Placer, Nevada, El Dorado, and Butte counties. The blue clade consisted of two accessions of the tetraploid P. heterophyllus (08-4 and 08-5), and P. laetus (12-6 and 12-9), and single accessions of the diploid P. heterophyllus (10-1), P. azureus (11-13), and P. filiformis (08-6). This is the most geographically widespread clade with accessions coming from Trinity, Shasta, Yuba, Tehama, and Humboldt counties. The red clade consisted of both accessions of P. neotericus (11-8 and 12-5) and single accessions of P. parvulus (08-11), P. azureus (11-11), and P. heterophyllus (11-12) from Butte, Trinity, Tehama and Shasta counties. The green clade consisted of one accession of P. azureus (08-1), P. laetus (08-2), and P. parvulus (12-10) from Fresno and Tulare counties. The brown clade contains a single accession of P. heterophyllus (11-4), which is located in Ventura County (Figure 2).
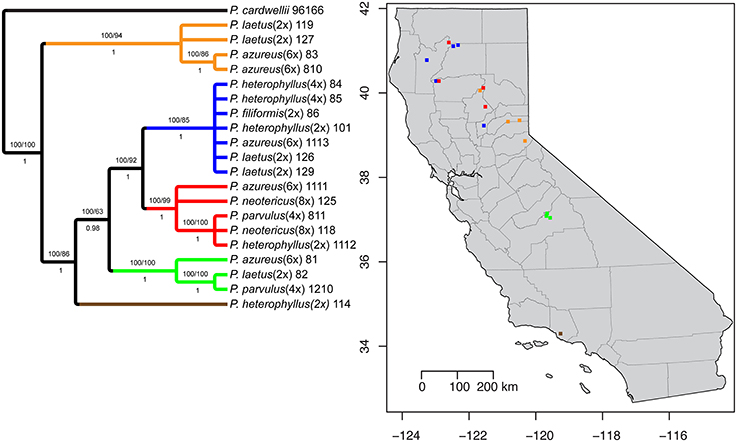
Figure 2. Strict consensus of seven equally parsimonious cpDNA trees with sampling location of colored clades indicated on map. Numbers above branches indicate parsimony bootstrap and maximum likelihood bootstrap support values greater than or equal to 60 respectively. Numbers below branches indicate Bayesian posterior probability greater than or equal to 0.50.
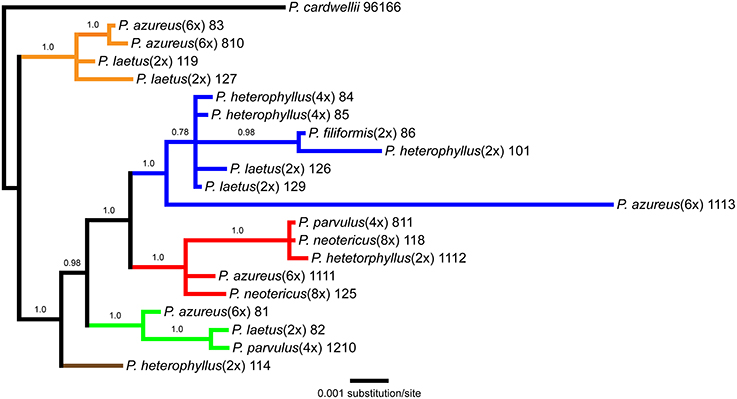
Figure 3. Bayesian majority-rule phylogram recovered from Bayesian analysis of the cpDNA dataset. Numbers above branches indicate posterior probabilities. Only posterior probability values greater than or equal to 0.50 are indicated. Clades are colored based on the strict consensus parsimony tree in Figure 2.
Adh Data Analysis
The Adh data matrix consisted of 90 sequences from 20 accessions with an aligned length of 1798 bp with 498 (27.7%) variable characters of which 316 (17.6%) were parsimony informative and 11% of the matrix cells were scored as missing (including gaps in the alignment). We were unable to amplify Adh from two samples of P. laetus and P. cardwellii for unknown reasons. The length of the Adh region ranged between 715 and 1730 bp with the shortest sequence being a result of a partial sequencing read (Paz81_FA; KF429008.1). To ascertain the effects of partial sequences on phylogenetic reconstruction all analyses were run with and without partial sequences. Because no topological or support value differences were found between the dataset with partial sequences and the one without partial sequences, the remaining analyses included partial sequences. The data matrix also contained four indel characters that were all parsimony informative. Parsimony analysis of the 90 sequences including four indels resulted in a single most parsimonious tree of 843 steps (Figure 4A). The analysis recovered six clades with low support of which four contained sequences from P. azureus accessions. These four clades have been color coded as red, blue, green, and brown. The blue clade has sequences from two tetraploid P. heterophyllus accessions (08-4 and 08-5), one P. laetus (08-2) accession, two P. parvulus accessions (08-11 and 12-10), one P. filiformis accession (08- 6), one P. neotericus (12-5) accession, and three P. azureus (08-10, 11-11, and 11-13) accessions. The green clade has sequences from two P. laetus (11-9 and 12-7) accessions, one P. parvulus (12-10) accession, one P. neotericus (12-5) accession, and from one accession of P. azureus (08-3). The brown clade contains only sequences from two P. azureus (08-1 and 08-10) accessions. The red clade is largest of the four clades and consists of sequences from two P. neotericus (11-8 and 12-5) accessions, one tetraploid P. heterophyllus (08-4) accession, every sequence from the three diploid P. heterophyllus (10-1, 11-4, and 11-12) accessions, and sequences from all five accessions of P. azureus (Figure 4A). The two remaining clades consist of a clade of sequences from P. laetus (08- 2) and P. parvulus (12-10) and a clade containing sequences from P. laetus (11-9). The tree recovered from the maximum likelihood (-lnL: 7848.1471) (Supplemental Figure 2) and the Bayesian majority-rule consensus tree (Figure 4B) resolved similar clades as the parsimony analysis, but with lack of resolution of the branches leading to the major clades, therefore, the parsimony tree was used for all further analyses.
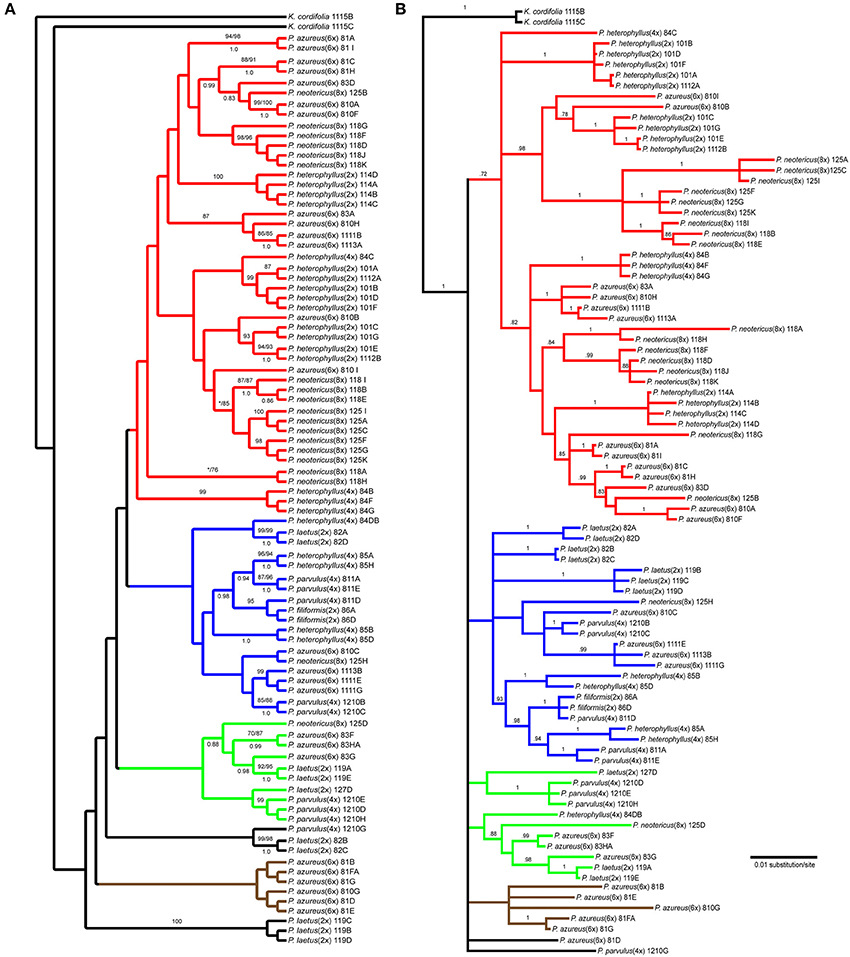
Figure 4. Branch colors are based on clades in the parsimony tree and are used for reference within the text. (A) Single most parsimonious Adh tree. Numbers above branches indicate parsimony bootstrap and maximum likelihood bootstrap support values greater than or equal to 70 respectively. Numbers below branches indicate Bayesian posterior probability greater than or equal to 0.50. Asterisk indicates that clade did not receive minimum support value for one of the bootstrap support methods. (B) Bayesian majority-rule phylogram recovered from Bayesian analysis of the Adh dataset. Numbers above branches indicate posterior probabilities. Only posterior probability values greater than or equal to 0.50 are indicated. The branch leading to the outgroup is shown at 1/16 of actually length.
NIA Data Analysis
The NIA data matrix consisted of 97 sequences from 21 accessions with an aligned length of 768 bp with 208 (27.1%) variable characters of which 86 (11.1%) were parsimony informative and 24% of the matrix cells were scored as missing, which included gaps in the alignment. We were unable to amplify NIA from P. cardwellii and K. cordifolia for unknown reasons. The length of the NIA region ranged between 430 and 703 bp. The shortest sequence was from a partial sequence. Because no topological or support value differences were found between the dataset with partial sequences and the one without partial sequences, the remaining analyses included partial sequences. The data matrix also contained four indel characters that were all informative. Parsimony analysis of the 97 sequences including 7 indels resulted in 4174 equally parsimonious trees of 171 steps. The strict consensus of the parsimony analysis (Figure 5A) recovered two clades with low support both containing sequences from P. azureus accessions. These clades have been color coded as red and blue. The blue clade contained sequences from three P. laetus accessions (11-9, 08-2, and 12-7), three accessions of P. azureus (08-1, 08-3, and 08-10), both P. neotericus accessions, and all of the sequences from P. parvulus 12-10. The relationships within the red clade are largely unresolved and contained sequences from two accessions of P. laetus (12-9 and 12-6), all five accessions of P. azureus, and both accessions of P. neotericus. The red clade also contains all of the sequences from P. parvulus 8-10, P. filiformis, and all of the P. heterophyllus accessions. The tree recovered from the maximum likelihood (-lnL: 3079.1856) (Supplemental Figure 3) and the Bayesian majority-rule consensus tree (Figure 5B) resolved similar clades as the parsimony analysis, but with lack of resolution of the branches leading to the major clades, therefore, the parsimony tree was used for all further analyses.
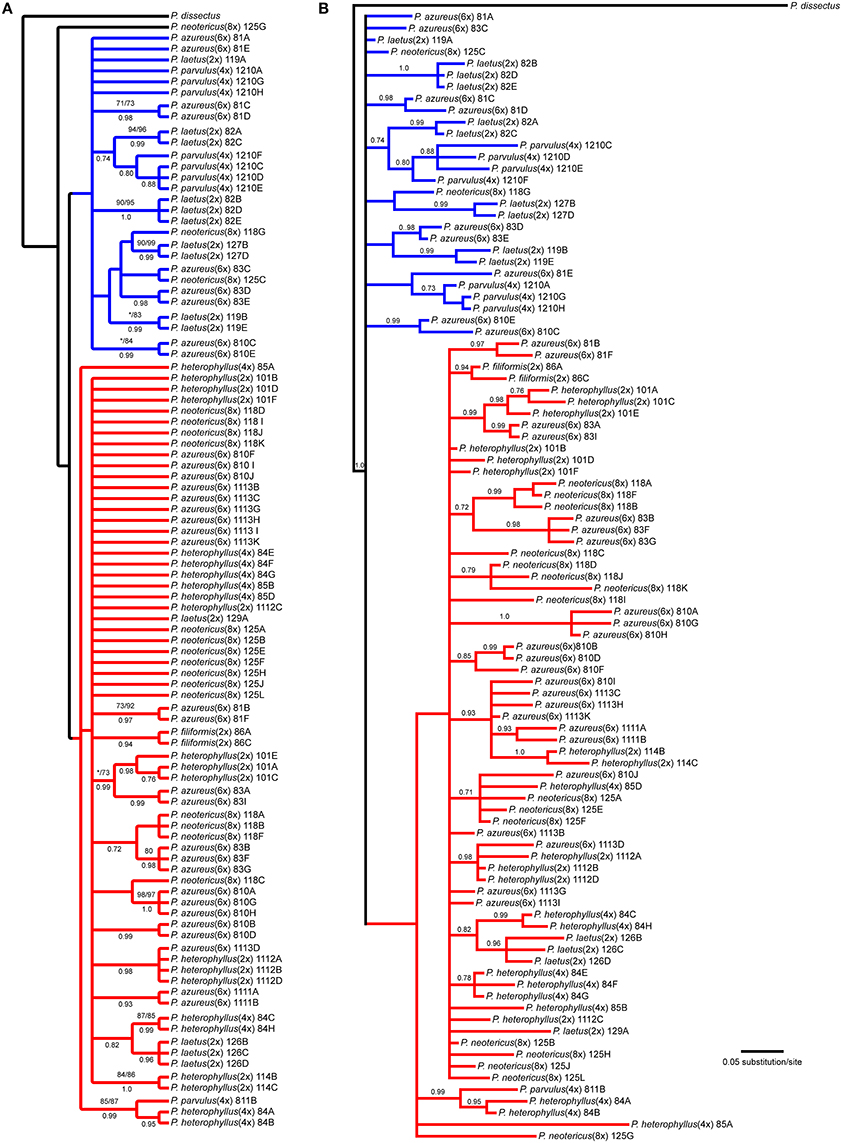
Figure 5. Branch colors are based on clades in the parsimony tree and are used for reference within the text. (A) Strict consensus of 4174 equally parsimonious NIA trees. Numbers above branches indicate parsimony bootstrap and maximum likelihood bootstrap support values greater than or equal to 70 respectively. Numbers below branches indicate Bayesian posterior probability greater than or equal to 0.50. Asterisk indicates that clade did not receive minimum support value for one of the bootstrap support methods. (B) Bayesian majority-rule phylogram recovered from Bayesian analysis of the NIA dataset. Numbers above branches indicate posterior probabilities. Only posterior probability values greater than or equal to 0.50 are indicated. The branch leading to the outgroup is shown at 1/16 of actually length.
Network Analysis
The network analyses of the multi-labeled Adh maximum parsimony tree (Figure 6) found that the P. azureus 08-1 genome contained orthologs from the red and brown clade. The P. azureus 08-3 genome contained orthologs from the red and green clade. The P. azureus 08-10 genome contained orthologs from the brown, red, and blue clade. The orthologs of P. azureus 11-11 and 11-13 were resolved as sister to each other and their genomes contained orthologs form the red and blue clades. The network analysis of the multi-labeled NIA maximum parsimony tree (Figure 7) found that the P. azureus 08-1, P. azureus 08-3, and P. azureus 08-10 genomes contained orthologs from the red and blue clades. The P. azureus 11-13 and P. azureus 11-11 genomes contained orthologs only from the red clade.
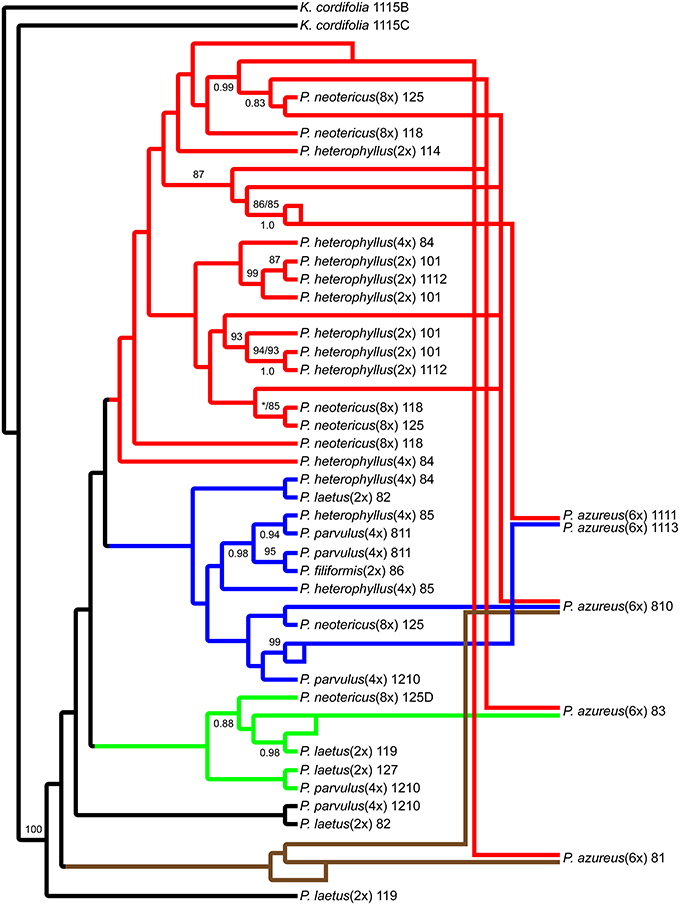
Figure 6. Network analysis of the multiple-labeled single most parsimonious Adh tree. Multiple-labeled tree is shown in Supplemental Figure 4.
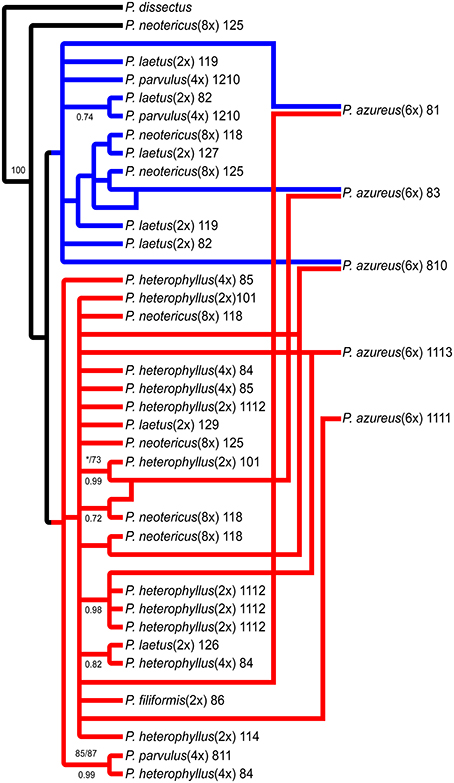
Figure 7. Network analysis of the multiple-labeled strict consensus of 4174 equally parsimonious NIA trees. Multiple-labeled tree is shown in Supplemental Figure 5.
Discussion
Origin of Penstemon azureus
Based on the phylogenetic reconstruction for both Adh and NIA, the evidence seems to support the allopolyploid origin of P. azureus because all five P. azureus accessions contained divergent Adh orthologs (Figure 6), whereas three of five accessions contained divergent NIA orthologs (Figure 7).
Although two of five accessions of P. azureus individuals did not have divergent NIA orthologs, this may be the result of divergent orthologs that were not sampled due to limited sampling or because of limited resolution in the NIA phylogeny. Increasing the number of introns sequenced or sequencing more orthologs for each sample may result in these two accessions having divergent orthologs. The mechanisms that result in divergent orthologs within an individual are hybridization, ancestral polymorphism (incomplete lineage sorting), presence of pseudogenes, or duplicated genes (paralogs) (Degnan and Rosenberg, 2009; Edwards, 2009). It does not seem likely that the NIA dataset contains any pseudogenes or paralogs. It is expected that a gene duplication or pseudogenization event that happened before these species diverge would be reconstructed as an early divergence from orthologs of all species, which is not present in the NIA dataset (Maddison, 1997; Zmasek and Eddy, 2001; Maddison and Knowles, 2006). A younger duplication or pseudogenization event would be hard if not impossible to detect with the current NIA dataset because of the low level of resolution in the tree.
The Adh dataset suggests a possible gene duplication in P. azureus after formation of the hexaploid species (Brown Clade, Figures 4, 6), but this might also be an indication of a progenitor species that was not sampled or an extinct species within the complex. Excluding the brown clade as a possible duplicated gene results in four of the five P. azureus accessions containing divergent orthologs (Figure 6). The lack of evidence of orthologs from pseudogenes or duplicated loci, excluding the brown clade from Adh tree, supports hybridization as an explanation of the divergent orthologs found in P. azureus, thus supporting the hypothesis that P. azureus is an allopolyploid.
Distinguishing between incomplete lineage sorting and hybridization is more difficult. Lineage sorting is affected by time since divergence and effective population size (Ne) of the ancestral species. For diploid organisms it has been determined that it can take up to 4Ne generations for complete lineage sorting to occur (Kimura, 1983; Tajima, 1983; Takahata and Nei, 1985; Maddison, 1997; Degnan and Rosenberg, 2009; Edwards, 2009). There is currently no data on the effective ancestral population sizes of different Penstemon clades, but it seems that Penstemon is the result of an evolutionary radiation (Wolfe et al., 2006), which implies that the time since divergence of different species is short and makes incomplete lineage sorting more likely. If the divergent orthologs recovered from P. azureus are to be explained by incomplete lineage sorting instead of hybridization it implies that all divergent orthologs were present in a common ancestor and their preservation in various combinations occurred in a descendant heterozygous taxon (Degnan and Rosenberg, 2009; Edwards, 2009). This would suggest a large effective population size of the descendant heterozygous taxon, which seems unlikely given that most species in this complex are poor competitors and often have small populations. Additionally, if incomplete lineage sorting was to explain the pattern of divergent orthologs we expect that all divergent orthologs may be found in one of the diploid species, but the gene tree constructed from the Adh dataset has some species distinction between diploid species. The red clade in the Adh tree contains all of the diploid P. heterophyllus orthologs along with orthologs recovered from the polyploids P. azureus, P. neotericus, and tetraploid P. heterophyllus compared to the green and blue clades, which have orthologs from the diploid P. laetus and from the polyploids P. azureus, P. neotericus, P. parvulus, and tetraploid P. heterophyllus (Figures 4A, 6). As a result of divergent orthologs never being recovered in the diploid species P. heterophyllus and P. laetus in the Adh tree it seems that hybridization is more likely explanation of the divergent orthologs found in P. azureus. However, because of the limited sampling of orthologs it is possible that these divergent orthologs could be contained in one of the diploid species with only one ortholog being sampled.
In contrast, the pattern of hybridization vs. incomplete lineage sorting is less clear in the NIA dataset. The red clade of the NIA tree contains all of the diploid P. heterophyllus orthologs (Figures 5A, 7), which is similar to the red clade of the Adh tree (Figure 4), however, it also contains orthologs from two P. laetus accessions. These results could indicate that lineage sorting has not gone to completion at the NIA locus. Nevertheless, the proposed hybridization events in the NIA network (Figure 7) are also supported by the Adh network (Figure 6). Since lineage sorting is a random process it has been suggested that consensus between gene trees indicate the true evolutionary relationships (Maddison, 1997; Maddison and Knowles, 2006) and for this reason we suggest that hybridization is more likely the explanation of the divergent orthologs found in P. azureus in both the Adh and NIA trees.
These results support three hypotheses for the possible progenitors of P. azureus: (1) P. heterophyllus (2x) X P. parvulus (4x); (2) P. heterophyllus (4x) X P. laetus (2x); and (3) P. heterophyllus (2x) X P. heterophyllus (4x). Markedly, all of the hypotheses support P. heterophyllus (2x) as a possible progenitor of P. azureus. The other possible progenitor species of P. azureus are less clear with P. laetus (2x), P. parvulus (4x), and P. heterophyllus (4x) all being supported by the data. P. neotericus (8x) was not considered as a possible progenitor because the most common mechanism of polyploid formation appears to be unreduced gametes (Ramsey and Schemske, 1998), which excludes P. neotericus (8x) based on chromosome number. Since orthologs from P. parvulus (4x) and P. heterophyllus (4x) segregated with P. laetus orthologs this could suggest a more complicated reticulate pattern where P. laetus at first played a role in the formation of P. parvulus and/or P. heterophyllus (4x) and then later on P. parvulus and/or P. heterophyllus (4x) acted as a progenitor of P. azureus. This could explain why orthologs from P. laetus, P. parvulus, P. heterophyllus (4x), and P. azureus segregate together in the Adh and NIA trees.
Gene Flow and Local Adaptation or Multiple Origins
The cpDNA tree has well-supported clades that are geographically structured (Figures 2, 3), whereas the Adh and NIA trees seem to lack any geographic structuring. This pattern in the cpDNA could be explained by local adaptation of the chloroplast genome (Budar and Roux, 2011) followed by gene flow between the different species that resulted in chloroplast capture (Tsitrone et al., 2003). This scenario is supported by seed dispersal by barochory, which is associated with localized gene flow (Duminil et al., 2007) resulting in the geographic structure seen. This is assuming that chloroplast are maternally inherited, which seems a reasonable assumption given that the majority of angiosperms studied have maternal inheritance of chloroplasts. The short foraging range of potential pollinators also support the above scenario by facilitating the repeated nuclear gene flow between hybrids needed for chloroplast capture (Tsitrone et al., 2003; Acosta and Premoli, 2010). Additionally, the potential for gene flow between different ploidy levels has been observed before (Stahlberg, 2009; Chapman and Abbott, 2010) and after polyploidization reproductive barriers can be weakened allowing a higher rate of successful hybridization between species (Muntzing, 1936; Bendiksby et al., 2011). Geographic correlation of chloroplast haplotypes between interfertile species has been observed previously suggesting possible selection of those haplotypes. For example, a correlation between latitude and chloroplast haplotype has been observed in the South American subgenus Nothofagus (Acosta and Premoli, 2010) and a correlation between riparian habitat and chloroplast haplotype has been shown in Brassica rapa (Allainguillaume et al., 2009). However, this pattern could also suggest multiple origins of P. azureus and P. parvulus from genetically distinct P. heterophyllus and P. laetus populations. The population structure apparent in the cpDNA dataset could be lacking in the Adh and NIA datasets because of the shorter time to coalescence of the haploid chloroplast genome, which is 2Ne instead of 4Ne of a diploid genome (Kimura, 1983; Tajima, 1983; Takahata and Nei, 1985; Degnan and Rosenberg, 2009; Edwards, 2009), thus, giving us a more recent view of the genetic structure of sampled populations. Multiple origins of allopolyploid species is quickly becoming the rule instead of the exception as more allopolyploid species are investigated (Soltis et al., 2004, 2009, 2014a; Tate et al., 2009). However, population substructuring of P. heterophyllus and P. laetus followed by multiple of origins of P. azureus and P. parvulus does not fully explain the patterns seen in the cpDNA tree. For example, the blue clade (Figures 2, 3) contains an accession of P. heterophyllus and P. laetus, which could only be explained by gene flow between the diploids that resulted in chloroplast capture. Gene flow between P. laetus and P. heterophyllus in the blue clade may have been facilitated through the polyploids in the blue clade, which would still be consistent with multiple origins of P. azureus and P. parvulus.
Further investigation of the population structure of P. heterophyllus and P. laetus resulting in the identification of population level markers and the distribution of these markers in the polyploid species will be needed to truly address the question of multiple origins.
Biogeography
Despite the number of parsimony informative characters, the major clades recovered from phylogenetic analyses of the Adh and NIA datasets had very low support values with support values increasing closer to the tips of the trees recovered (Figures 4, 5). These results were not surprising given that Penstemon seems to be the result of a post-tertiary evolutionary radiation (Wolfe et al., 2006), which would result in short internal branch lengths that are very hard to resolve. Likewise, the phylograms of the Adh and NIA maximum likelihood (Supplemental Figures 2, 3) and Bayesian (Figures 4B, 5B) trees have extremely short branch lengths between the major clades followed by longer branches leading to the tips, which suggests a rapid radiation followed by differentiation. The short branches of the Adh and NIA trees along with the cpDNA tree (Figure 3) suggest a possible rapid diversification of this species complex originating in the Sierra Nevada Mountains followed by differentiation within the Sierra Nevada Mountains, Coastal, Cascade, and Klamath Ranges. The first diverging clade within the cpDNA tree (Figure 2) is located in the northern Sierra Nevada Mountains suggesting that this region might provide the source populations for diversification and differentiation in this complex. The next clade to diverge is represented by a single collection from the Transverse Ranges. Although only one accession is shown here, other P. heterophyllus collected from the transverse ranges also diverge at this point (Visger and Datwyler, unpublished data), followed by a clade from the southern Sierra Nevada Mountains, and a final clade that includes collections from the northern Sierra Nevada Mountains, the Cascade Mountains and Klamath Ranges. The ability of this study to elucidate phylogeography is limited since it was designed to address the allopolyploid origin of P. azureus. To truly address the origin and diversification of this species complex will require a well-resolved species phylogeny of subgenus Saccanthera with extensive sampling to represent the diversity of this subgenus.
Comments on P. neotericus, P. parvulus, and P. heterophyllus (4x)
Penstemon neotericus
The orthologs recovered from P. neotericus segregate with orthologs recovered from P. azureus in the Adh tree (Figure 4A), but segregate with P. heterophyllus, P. azureus, and P. laetus in the NIA trees (Figure 5A). This supports an allopolyploid origin of P. neotericus as a result of a complex reticulate history among P. heterophyllus, P. azureus, and P. laetus, thus, partially supporting the conclusions of Clausen (1933). It is likely that P. azureus is a progenitor of P. neotericus, but it is unclear whether P. laetus is supported as a progenitor in the current analysis despite the morphological similarities between P. laetus and P. neotericus.
Penstemon parvulus
The orthologs recovered from the northern population of P. parvulus segregate with P. heterophyllus (4x) in both the blue clade of the Adh tree (Figure 4A) and the red clade of the NIA tree (Figure 5A) with moderate support. This suggests that the northern population of P. parvulus and P. heterophyllus (4x) might share a common origin and the morphological differences could be a result of environmental differences or population differentiation. Interestingly, the cpDNA (Figures 2, 3) tree recovers P. heterophyllus (4x) in a distinct clade from northern populations of P. parvulus. The orthologs recovered from the southern population of P. parvulus do not segregate with the northern P. parvulus or P. heterophyllus (4x), but instead segregate with orthologs from P. laetus in both the Adh (Figure 5) and NIA tree (Figure 6) with moderate support, suggesting that the southern population might be an autopolyploid of P. laetus. This suggests that the northern and southern P. parvulus populations are of independent origin and possibly from different progenitors making them different species. Alternatively, this pattern may be the result of hybridization between species with different chromosome numbers followed by incomplete lineage sorting.
Penstemon heterophyllus (4x)
The orthologs recovered from P. heterophyllus (4x) segregated with orthologs from P. heterophyllus (2x) and the northern P. parvulus with moderate to strong support in both the Adh (Figure 5) and NIA trees (Figure 6) suggesting that P. heterophyllus (4x) and the northern P. parvulus are both autopolyploids of P. heterophyllus (2x). However, orthologs from P. heterophyllus (4x) also segregated with orthologs from P. laetus, which would suggest an allopolyploid origin of P. heterophyllus (4x) or could be explained by hybridization with P. laetus after autopolyploidization. Further population level sampling and additional loci will be needed to address the origin of P. heterophyllus (4x).
Conclusion
This study provides strong support that P. azureus is of allopolyploid origin and that P. heterophyllus is most likely a progenitor. Information from additional nuclear loci and further elucidation of the genetic population structure of P. heterophyllus, P. laetus, and P. parvulus will help answer questions of multiple origins of P. azureus and the role that P. laetus and P. parvulus have played as possible progenitors. The additional data will also help to untangle the complex reticulate relationships of the polyploids of this complex.
Nevertheless, it is apparent that polyploidy has played a major role in the diversification of subsection Saccanthera in California with the two diploid species, P. heterophyllus and P. laetus as the base of this polyploid complex. This is also the first time that allopolyploidy has been supported as a mechanism of diversification in Penstemon. Furthermore, this study adds to the growing number of examples that polyploidy is an important mechanism of diversification in flowering plants.
Author Contributions
SD conceived the presented hypotheses. TL and SD contributed to the experimental design and sampling. TL generated the majority of the sequence data with contribution from SD. TL performed the data analysis and interpretation with significant input from SD. TL wrote the paper with major contributions from SD. Both authors reviewed the final version of the manuscript and agree to be accountable for its contents.
Funding
This work was funded through the C. M. Goethe Bequest for Biological Surveys at California State University, Sacramento, and through the Albert Delisle Research Funds in Biological Sciences at California State University, Sacramento.
Conflict of Interest Statement
The authors declare that the research was conducted in the absence of any commercial or financial relationships that could be construed as a potential conflict of interest.
Acknowledgments
We would like to thank Benjamin Sacks for providing resources and laboratory space for DNA sequencing and Randall Small for providing primer sequences. We acknowledge the Department of Biological Sciences California State University, Sacramento for supporting this research by providing funding. TL gratefully acknowledges Professor Shannon Datwyler's mentorship throughout the entirety of this research.
Supplementary Material
The Supplementary Material for this article can be found online at: https://www.frontiersin.org/article/10.3389/fevo.2016.00060
Supplementary Figure 1. Phylogram recovered from maximum likelihood analysis of the cpDNA dataset. Numbers above branches indicate maximum likelihood bootstrap values. Only bootstrap values greater than or equal to 70 are indicated.
Supplementary Figure 2. Phylogram recovered from maximum likelihood analysis of the Adh dataset. Numbers above branches indicate maximum likelihood bootstrap values. Only bootstrap values greater than or equal to 70 are indicated. The branch leading to the outgroup shown at 1/16 of actually length.
Supplementary Figure 3. Phylogram recovered from maximum likelihood analysis of the NIA dataset. Numbers above branches indicate maximum likelihood bootstrap values. Only bootstrap values greater than or equal to 70 are indicated. The branch leading to the outgroup shown at 1/16 of actually length.
Supplementary Figure 4. Multi-labeled Adh tree using the single most parsimonious Adh tree.
Supplementary Figure 5. Multi-labeled NIA tree using the strict consensus of 4174 equally parsimonious NIA trees.
Supplementary File 1. Contains nexus files for the chloroplast, Adh, and NIA used for analyses; conf files used by Garli for the maximum likelihood; csv file containing coordinates for all sampled taxa.
References
Acosta, M. C., and Premoli, A. C. (2010). Evidence of chloroplast capture in South American Nothofagus (subgenus Nothofagus, Nothofagaceae). Mol. Phylogenet. Evol. 54, 235–242. doi: 10.1016/j.ympev.2009.08.008
Allainguillaume, J., Harwood, T., Ford, C. S., Cuccato, G., Norris, C., Allender, C. J., et al. (2009). Rapeseed cytoplasm gives advantage in wild relatives and complicates genetically modified crop biocontainment. New Phytol. 183, 1201–1211. doi: 10.1111/j.1469-8137.2009.02877.x
Baldwin, B. G., Goldman, D. H., Keil, D. J., Patterson, R., and Rosatti, T. J. (2012). The Jepson Manual, 2nd Edn. Oakland, CL: University of California Press.
Bendiksby, M., Tribsch, A., Borgen, L., Trávnícek, P., and Brysting, A. K. (2011). Allopolyploid origins of the Galeopsis tetraploids - revisiting Muntzing's classical textbook example using molecular tools. New Phytol. 191, 1150–1167. doi: 10.1111/j.1469-8137.2011.03753.x
Budar, F., and Roux, F. (2011). The role of organelle genomes in plant adaptation: time to get to work! Plant Signal. Behav. 6, 635–639. doi: 10.4161/psb.6.5.14524
Buggs, R. J. A., Chamala, S., Wu, W., Tate, J. A., Schnable, P. S., Soltis, D. E., et al. (2012a). Rapid, repeated, and clustered loss of duplicate genes in allopolyploid plant populations of independent origin. Curr. Biol. 22, 248–252. doi: 10.1016/j.cub.2011.12.027
Buggs, R. J. A., Renny-Byfield, S., Chester, M., Jordon-Thaden, I. E., Viccini, L. F., Chamala, S., et al. (2012b). Next-generation sequencing and genome evolution in allopolyploids. Am. J. Bot. 99, 372–382. doi: 10.3732/ajb.1100395
Buggs, R. J. A., Zhang, L., Miles, N., Tate, J. A., Gao, L., Wei, W., et al. (2011). Transcriptomic shock generates evolutionary novelty in a newly formed, natural allopolyploid plant. Curr. Biol. 21, 551–556. doi: 10.1016/j.cub.2011.02.016
Chapman, M. A., and Abbott, R. J. (2010). Introgression of fitness genes across a ploidy barrier. New Phytol. 186, 63–71. doi: 10.1111/j.1469-8137.2009.03091.x
Clausen, J. (1933). Cytological evidence for the hybrid origin of Penstemon neotericus Keck. Hereditas 18, 65–76. doi: 10.1111/j.1601-5223.1933.tb02598.x
Clements, R. K., Baskin, J. M., and Baskin, C. C. (2002). The comparative biology of the two closely-related species Penstemon tenuiflorus Pennell and P. hirsutus (L.) Willd. (Scrophulariaceae, Section Graciles): III. Ecological life cycle, growth characteristics, and flowering requirements. Castanea 67, 161–176.
Clinebell, R. R., and Bernhardt, P. (1998). The pollination ecology of five Species of Penstemon (Scrophulariaceae) in the tallgrass prairie. Ann. Missouri Bot. Gard. 85, 126–136. doi: 10.2307/2992002
Crosswhite, F. S., and Crosswhite, C. D. (1966). Insect pollinators of Penstemon series Graciles (Scrophulariaceae) with notes on Osmia and other Megachilidae. Am. Midl. Nat. 76, 450–467. doi: 10.2307/2423097
Degnan, J. H., and Rosenberg, N. A. (2009). Gene tree discordance, phylogenetic inference and the multispecies coalescent. Trends Ecol. Evol. 24, 332–340. doi: 10.1016/j.tree.2009.01.009
Duminil, J., Fineschi, S., Hampe, A., Jordano, P., Salvini, D., Vendramin, G. G., et al. (2007). Can population genetic structure be predicted from life-history traits? Am. Nat. 169, 662–672. doi: 10.1086/513490
Edwards, S. V. (2009). Is a new and general theory of molecular systematics emerging? Evolution 63, 1–19. doi: 10.1111/j.1558-5646.2008.00549.x
Gaeta, R. T., Pires, C. J., Iniguez-Luy, F., Leon, E., and Osborn, T. C. (2007). Genomic changes in resynthesized Brassica napus and their effect on gene expression and phenotype. Plant Cell Online 19, 3403–3417. doi: 10.1105/tpc.107.054346
Goloboff, P. A. (1999). Analyzing large data sets in reasonable times: solutions for composite optima. Cladistics 15, 415–428. doi: 10.1111/j.1096-0031.1999.tb00278.x
Goloboff, P. A., Farris, J. S., and Nixon, K. C. (2008). TNT, a free program for phylogenetic analysis. Cladistics 24, 774–786. doi: 10.1111/j.1096-0031.2008.00217.x
Gouy, M., Guindon, S., and Gascuel, O. (2010). SeaView version 4: a multiplatform graphical user interface for sequence alignment and phylogenetic tree building. Mol. Biol. Evol. 27, 221–224. doi: 10.1093/molbev/msp259
Higgins, D. G. Sharp P. M. (1988). CLUSTAL: a package for performing multiple sequence alignment on a microcomputer. Gene 73, 237–244. doi: 10.1016/0378-1119(88)90330-7
Hu, G., Houston, N. L., Pathak, D., Schmidt, L., Thelen, J. J., and Wendel, J. F. (2011). Genomically biased accumulation of seed storage proteins in allopolyploid cotton. Genetics 189, 1103–1115. doi: 10.1534/genetics.111.132407
Huber, K. T., and Moulton, V. (2006). Phylogenetic networks from multi-labelled trees. J. Math. Biol. 52, 613–632. doi: 10.1007/s00285-005-0365-z
Keck, D. D. (1932). Studies in Penstemon: a systematic treatment of the section Saccanthera. Univ. Calif. Publ. Bot. 16, 59.
Kimura, M. (1983). The Neutral Theory of Molecular Evolution. Cambridge: Cambridge University Press.
Lawrence, T. J., Kauffman, K. T., Amrine, K. C. H., Carper, D. L., Lee, R. S., Becich, P. J., et al. (2015). FAST: FAST Analysis of Sequences Toolbox. Front. Genet. 6:172. doi: 10.3389/fgene.2015.00172
Leitch, A. R., and Leitch, I. J. (2008). Genomic plasticity and the diversity of polyploid plants. Science 320, 481–483. doi: 10.1126/science.1153585
Maddison, W. P. (1997). Gene trees in species trees. Syst. Biol. 46, 523–536. doi: 10.1093/sysbio/46.3.523
Maddison, W. P., and Knowles, L. L. (2006). Inferring phylogeny despite incomplete lineage sorting. Syst. Biol. 55, 21–30. doi: 10.1080/10635150500354928
Muntzing, A. (1936). The evolutionary significance of autopolyploidy. Hereditas 21, 263–378. doi: 10.1111/j.1601-5223.1936.tb03204.x
Nixon, K. C. (1999). The parsimony ratchet, a new method for rapid parsimony analysis. Cladistics 15, 407–414. doi: 10.1111/j.1096-0031.1999.tb00277.x
Osborn, T. C., Pires, J. C., Birchler, J. A., Auger, D. L., Jeffery Chen, Z., Lee, H.-S., et al. (2003). Understanding mechanisms of novel gene expression in polyploids. Trends Genet. 19, 141–147. doi: 10.1016/S0168-9525(03)00015-5
Pires, J. C., Zhao, J., Schranz, M. E., Leon, E. J., Quijada, P. A., Lukens, L. N., et al. (2004). Flowering time divergence and genomic rearrangements in resynthesized Brassica polyploids (Brassicaceae). Biol. J. Linn. Soc. 82, 675–688. doi: 10.1111/j.1095-8312.2004.00350.x
Posada, D. (2008). jModelTest: phylogenetic model averaging. Mol. Biol. Evol. 25, 1253–1256. doi: 10.1093/molbev/msn083
Ramsey, J., and Schemske, D. (1998). Pathways, mechanisms, and rates of polyploid formation in flowering plants. Annu. Rev. Ecol. Evol. Syst. 29, 467–501. doi: 10.1146/annurev.ecolsys.29.1.467
Richards, O. W. (1962). A Revisional Study of the Masarid Wasps (Hymenoptera, Vespoidea). London: British Museum, Natural History.
Ronquist, F., and Huelsenbeck, J. P. (2003). MrBayes 3: Bayesian phylogenetic inference under mixed models. Bioinformatics 19, 1572–1574. doi: 10.1093/bioinformatics/btg180
Sanderson, M. J., Donoghue, M. J., Piel, W. H., and Eriksson, T. (1994). TreeBASE: a prototype database of phylogenetic analyses and an interactive tool for browsing the phylogeny of life. Am. J. Bot. 81, 183.
Shaw, J., Lickey, E. B., Beck, J. T., Farmer, S. B., Liu, W., Miller, J., et al. (2005). The tortoise and the hare II: relative utility of 21 noncoding chloroplast DNA sequences for phylogenetic analysis. Am. J. Bot. 92, 142–166. doi: 10.3732/ajb.92.1.142
Shaw, J., Lickey, E. B., Schilling, E. E., and Small, R. L. (2007). Comparison of whole chloroplast genome sequences to choose noncoding regions for phylogenetic studies in Angiosperms: the tortoise and the hare III. Am. J. Bot. 94, 275–288. doi: 10.3732/ajb.94.3.275
Simmons, M. P., and Ochoterena, H. (2000). Gaps as characters in sequence-based phylogenetic Analyses. Syst. Biol. 49, 369–381. doi: 10.1093/sysbio/49.2.369
Soltis, D. E., Buggs, R. J. A., Barbazuk, W. B., Schnable, P. S., and Soltis, P. S. (2009). On the origins of species: does evolution repeat itself in polyploid populations of independent origin? Cold Spring Harb. Symp. Quant. Biol. 74, 215–223. doi: 10.1101/sqb.2009.74.007
Soltis, D. E., Soltis, P. S., Pires, J. C., Kovarik, A., Tate, J. A., and Mavrodiev, E. (2004). Recent and recurrent polyploidy in Tragopogon (Asteraceae): cytogenetic, genomic and genetic comparisons. Biol. J. Linn. Soc. 82, 485–501. doi: 10.1111/j.1095-8312.2004.00335.x
Soltis, D. E., Visger, C. J., and Soltis, P. S. (2014a). The polyploidy revolution then…and now: stebbins revisited. Am. J. Bot. 101, 1057–1078. doi: 10.3732/ajb.1400178
Soltis, P. S., Liu, X., Marchant, D. B., Visger, C. J., and Soltis, D. E. (2014b). Polyploidy and novelty: Gottlieb's legacy. Philos. Trans. R. Soc. Lond. B. Biol. Sci. 369, 20130351. doi: 10.1098/rstb.2013.0351
Stahlberg, D. (2009). Habitat differentiation, hybridization and gene flow patterns in mixed populations of diploid and autotetraploid Dactylorhiza maculata s.l. (Orchidaceae). Evol. Ecol. 23, 295–328. doi: 10.1007/s10682-007-9228-y
Stöver, B. C., and Müller, K. F. (2010). TreeGraph 2: combining and visualizing evidence from different phylogenetic analyses. BMC Bioinformatics 11:7. doi: 10.1186/1471-2105-11-7
Sukumaran, J., and Holder, M. T. (2010). DendroPy: a Python library for phylogenetic computing. Bioinformatics 26, 1569–1571. doi: 10.1093/bioinformatics/btq228
Tajima, F. (1983). Evolutionary relationship of DNA sequences in finite populations. Genetics 105, 437–460.
Takahata, N., and Nei, M. (1985). Gene genealogy and variance of interpopulational nucleotide differences. Genetics 110, 325–344.
Tate, J. A., Joshi, P., Soltis, K. A., Soltis, P. S., and Soltis, D. E. (2009). On the road to diploidization? Homoeolog loss in independently formed populations of the allopolyploid Tragopogon miscellus (Asteraceae). BMC Plant Biol. 9:80. doi: 10.1186/1471-2229-9-80
Tsitrone, A., Kirkpatrick, M., and Levin, D. A. (2003). A model for chloroplast capture. Evolution 57, 1776–1782. doi: 10.1111/j.0014-3820.2003.tb00585.x
Wolfe, A., Randle, C., Datwyler, S., Morawetz, J., Arguedas, N., and Diaz, J. (2006). Phylogeny, taxonomic affinities, and biogeography of Penstemon (Plantaginaceae) based on ITS and cpDNA sequence data. Am. J. Bot. 93, 1699–1713. doi: 10.3732/ajb.93.11.1699
Zmasek, C. M., and Eddy, S. R. (2001). A simple algorithm to infer gene duplication and speciation events on a gene tree. Bioinformatics 17, 821–828. doi: 10.1093/bioinformatics/17.9.821
Keywords: Penstemon azureus, allopolyploidy, polyploid speciation, hybridization, hybrid speciation
Citation: Lawrence TJ and Datwyler SL (2016) Testing the Hypothesis of Allopolyploidy in the Origin of Penstemon azureus (Plantaginaceae). Front. Ecol. Evol. 4:60. doi: 10.3389/fevo.2016.00060
Received: 17 March 2016; Accepted: 23 May 2016;
Published: 08 June 2016.
Edited by:
Mariana Mateos, Texas A&M University, USAReviewed by:
Brian I. Crother, Southeastern Louisiana University, USARobert William Meredith, Montclair State University, USA
Copyright © 2016 Lawrence and Datwyler. This is an open-access article distributed under the terms of the Creative Commons Attribution License (CC BY). The use, distribution or reproduction in other forums is permitted, provided the original author(s) or licensor are credited and that the original publication in this journal is cited, in accordance with accepted academic practice. No use, distribution or reproduction is permitted which does not comply with these terms.
*Correspondence: Shannon L. Datwyler, datwyler@csus.edu